HOUSTON HOSPITALS EMERGENCY DEPARTMENT USE STUDY. January 1, 2009 through December 31, 2009 FINAL REPORT. Prepared By
|
|
|
- Darrell Cobb
- 6 years ago
- Views:
Transcription


1 HOUSTON HOSPITALS EMERGENCY DEPARTMENT USE STUDY January 1, 2009 through December 31, 2009 FINAL REPORT Prepared By School of Public Health University of Texas Health Science Center at Houston Charles Begley, Patrick Courtney, Keith Burau May 2011
2 TABLE OF CONTENTS I. Executive Summary...3 II. Purpose...13 III. Methods...14 IV. Results, A. Total ED Visits B. Primary Care Related ED Visits C. ED Visits by Month, Day, and Time D. ED Visits by Patient Characteristics E. Health Conditions of Patients with ED Visits F. Behavioral Health Related ED Visits G. Length of Stay in the ED H. Estimated Cost of Primary Care Related ED Visits. 52 I. Geographic Distribution of Patients with ED Visits J. Trends in ED Visits Over Time..68 V. Limitations
3 I. EXECUTIVE SUMMARY The University Of Texas School Of Public Health collects and analyzes emergency department (ED) visit data in Harris County hospitals and monitors primary care related (PCR) use of the ED. The main purpose of this report is to provide information on the frequency and type of ED visits in Houston hospitals in 2009, the medical conditions for which visits were made, the characteristics of patients that visited the ED, and the trends in ED use over the last five years. Data and Analysis Twenty four hospitals with EDs that serve the general public of Harris County (provide hospital based ED care and accept 911 deliveries) participated in the 2009 hospital ED study. They include: two hospitals of the Harris County Hospital District (Ben Taub General and Lyndon B. Johnson General); nine hospitals of the Memorial Hermann Health Care System (Hermann/Texas Medical Center, Southwest, Southeast, Northeast, Northwest, The Woodlands, Memorial City, Katy, and Sugar Land); four hospitals of the Hospital Corporation of America (Bayshore Medical Center, Spring Branch Medical Center, East Houston Regional Medical Center, and West Houston Medical Center); Texas Children s Hospital; two hospitals of CHRISTUS Gulf Coast (St. Catherine and St. John); two hospitals of the St. Luke s hospital system (Episcopal Hospital and Community Medical Center); and four hospitals of the Methodist Hospital System (Methodist/Texas Medical Center, San Jacinto Methodist, Methodist Willowbrook, and Methodist Sugar Land). Each hospital supplied the following information on each ED visit during the period January 1, 2009 through December 31, 2009: 3
4 1. Date and time of admission to ED 2. Primary and all secondary discharge diagnoses 3. Discharge date and time 4. Payment source 5. Patient age 6. Patient gender 7. Patient race/ethnicity 8. Patient ZIP code 9. Where discharged (e.g. home, nursing home, etc.) 10. Method of transport (e.g. ambulance, self, other) Based on this information, the number, type, and rate of ED visits to all Houston hospitals for various population groups was estimated and the number and percentage of primary care-related ED (PCRED) visits was estimated by applying the New York University ED Algorithm to each visit. The NYU Algorithm determines the likelihood that a visit is one of the following types. 1. Non-emergent: Immediate treatment was not required within 12 hours. 2. Emergent-Primary Care Treatable: Treatment was required within 12 hours, but could have been provided effectively and safely in a primary care setting. Continuous observation was not required, no procedures were performed or resources used that are not typically available in a primary care setting. 3. Emergent-ED Care Needed-Preventable/Avoidable: ED care was required within 12 hours, but the emergent nature of the condition was potentially preventable/ avoidable if timely/continuous primary care had been received for the underlying illness. 4. Emergent-ED Care Needed-Not Preventable/Avoidable: ED care was required within 12 hours and primary care could not have prevented the condition. The demographic, coverage, and health conditions of patients with ED visits and PCRED visits was determined. ED visits were mapped by ZIP code, population-based PCRED visit rates were calculated, and the pattern over time of ED visits and PCRED visits was summarized and assessed. 4
5 2009 Highlights 1. Total ED Visits a. During 2009, 1,127,557 ED visits were made to all 25 participating hospitals. Of this total, 84.8% were made by Harris County residents, 12.9% by residents of the seven surrounding counties, and 2.3% by patients from outside the area. Of all ED visits by residents of the eight county area, 84.0% were discharged home or elsewhere. Of all ED visits by Harris County residents, 72.9% were discharged home or elsewhere (Table 1a). b. The ED visits of participating hospitals represented 74.04% of all ED visits reported to the Texas Department of State Health Services by all hospitals in Harris County in Using this percentage for extrapolation, an estimated 1,287,710 ED visits were made by Harris County residents to all hospitals in the county. The ED visit rate of Harris County residents was per 100 residents in 2009, exceeding the and 30.0 ED visit rates in 2007 and 2008, respectively (Table 1a). 2. Primary Care Related ED Visits A little over 40% (41.0%) of ED visits by Harris County residents were PCR in This includes non-urgent, primary care treatable, and primary care preventable visits. The 2009 rate compares to 39.1% in 2008 and 41.1% in 2007 (Table 2). 3. ED Visit Rates by Population Sub-Group Females have a higher rate than males for both total visits and PCRED visits. Persons age 65 and over have the highest rate of total ED visits (34.33 per 100 elderly), but children and adolescents have the highest rate of PCRED visits (12.10 per 100 children) (Table 1b). Persons enrolled in Medicare have the highest rate of total ED visits (76.13 per 100 Medicare enrollees), but persons enrolled in Medicaid and/or CHIP have a slightly higher rate of PCRED visits (23.0 5
6 per 100 Medicaid/CHIP enrollees). Persons of other race or ethnicity have the highest rates of total visits and PCRED visits. Among those defined as one race, persons who were Black have the highest rate of total visits (37.43 per 100 Black persons) and PCRED visits (17.4 per 100 Black persons). 4. ED Visits by Month, Day, and Time The number of ED visits by Harris County residents was highest in May and September but vary relatively little from month to month (Figure 3). The percentage of ED visits that lead to hospitalizations was also relatively constant over the year. The peak days of the week for ED visits were Saturday and Sunday (Figure 4). The percentage of ED visits leading to hospitalizations remained relatively level each day. ED visits by children peaked between 7-8 PM, with a secondary peak at 11 AM-12 PM (Figure 5a). ED visits by adults age 18 to 64 peaked at noon, dropped slightly and remained fairly level until 7 PM (Figure 5b). ED visits by adults age 65 and over peaked from 12 PM to 4 PM, then dropped during the evening (Figure 5c). Relatively few ED visits by children resulted in a hospitalization, in contrast to adults age 65 and over. 5. ED Visits by Patient Characteristics a. Payer source: The uninsured accounted for 33.1% of PCRED visits and 29.2% of non- PCRED visits. Medicaid covered individuals made up 26.8% of PCRED visits and 21.2% of non-pcred visits. Children on CHIP made up 4.2% of PCRED visits (Figures 6 & 7). Patients with commercial insurance accounted for 24.1% of PCRED visits and 26.4% of non-pcred visits. Four in ten ED visits made by persons on Medicaid (39.8%) were PCR, and more than half of all ED visits by persons on CHIP (51.9%) were PCR. Medicare enrollees had the highest percentage of hospitalized ED visits (32.2%) (Figure 8). 6
7 b. Race/Ethnicity: Seven in ten (70.6%) PCRED visits were by persons who were Black or Hispanic, as were 60.2% of non-pcred visits. By contrast, persons who were White accounted for 24.1% of PCRED visits and 34.2% of non-pcred visits (Figures 9 & 10). Nearly half of all ED visits by persons who were black or Hispanic were PCR. Asians and Whites were most likely to have an ED visits resulting in a hospitalization (Figure 11). c. Age: Children age 17 and under made up more than one third (36.4%) of all PCRED visits, and just over one fourth (27.6%) of non-pcred visits. Adults age 65 and over were almost twice as likely to have non-pcred visits than a PCRED visit. Adults age were more likely to have a PCRED visit than a non-pcred visit (Figures 12 & 13). More than three in ten (31.8%) ED visits by adults age 65 resulted in a hospitalization (Figure 14). d. Gender: Almost six in ten (58.5%) PCRED visits were by females and 41.5% by males (Figure 15). Of non-pcred visits, 52.8% were by females and 47.2% by males (Figure 16). The percentage of ED visits resulting in a hospitalization was higher among males (14.4%) than females (13.8) (Figure 17). e. Transport: One in ten (10.1%) PCRED visits were by persons with an ambulance transport to the ED. By contrast, more than one in five (21.8%) non-pcred visits were by persons with an ambulance transport to the ED (Tables 7a & 7b; Figures 18 & 19). One fourth (25.0%) of ambulance transports to the ED eventually resulted in a hospitalization (Table 7c and Figure 20) 6. Health Conditions of Patients with ED Visits The most common discharge diagnoses of patients with PCRED visits for the last three years has been acute upper respiratory infection not otherwise specified. The frequency of visits with this diagnosis was higher in 2009 than in previous years (Table 8). Chest pain not otherwise 7
8 specified was the leading diagnosis of non-pcred visits, and also increased in frequency in 2009 (Table 9). 7. Behavioral Health-Related ED Visits The percentage of behavioral health visits dropped from 8.3% in 2008 to 7.7% in The number of patients who were seen with an alcohol-related diagnosis and no other behavioral diagnosis nearly doubled in 2009 (1,079) compared to 2008 (585). The number of patients whose primary diagnosis was medical, but who had a secondary diagnosis of an alcohol problem, rose by about 50% (from 2,417 in 2008 to 3,689 in 2009) (Table 10a). 8. Length of Stay in the ED The mean length of stay of ED visits (measured from time of admission to the ED to time of discharge from the ED) was calculated for visits of less than 24 hours each. PCR visits last roughly half an hour less than other non-hospitalized visits (3.70 hours in 2009 vs hours in 2009). The length of stay for a hospitalized ED visit increased from 5.37 hours in 2007 to 6.84 hours in 2009 (Table 12). Non hospitalized behavioral health visits continue to last longer than non hospitalized medical visits (Table 11). 8. Estimated Cost of Primary Care Related ED Visits Applying national estimates of the unit cost of ED visits to Houston ED visits suggests that the cost of PCRED visits in Houston hospitals increased from $187,310,573 in 2007 to $214,859,768 in 2009 (Table 13). The greatest potential cost savings from diverting PCRED visits would be among uninsured adults age 18 to 44 (Table 12 and 13, Figures 21and 22). This is based on the fact that PCRED visits of adults age 18 to 44 represented 36.8% of total PCRED visits the estimated savings among all persons in 2009 and uninsured adults accounted for 54.2% of the estimated cost of PCRED visits savings among the uninsured in 2009 (Tables 12 and 13). 8
9 9. Geographic Distribution of Patients with ED Visits The following ZIP code clusters had the highest number of ED visits: 1) the intersection of Highway 59 and the North Loop East; 2) the Ship Channel and the area along Interstate 10 and the East Belt; 3) an area just east of Highway 288 and on both sides of the South Loop; 4) an area along the Southwest Freeway and between the West Loop and West Belt; 5) the intersection of Interstate 10 and Highway 6; and 6) an area along Highway 290 and just outside the North Loop West (Map 1a). Clusters 1, 4, and 5 had the biggest increases from 2007 to 2009 (Map 1b). The geographic distribution of PCRED visits by the insured and uninsured was similar to that of ED visits (Maps 2a and 3a). An area between the North Loop and the North Belt had the biggest increase in PCRED visits by the insured and uninsured (area shaded in orange) compared to the increase by the uninsured (area shaded in yellow). (Maps 2b and 3b). The areas with the highest rates of ED visits, PCRED visits by all, and PCRED visits by the uninsured were the East/Northeast and South Central areas of Harris County (Map 4). The population rates of PCRED visits for all and the uninsured, were lowest in the Baytown area (Maps 4, 5, and 6). 10. Trends in ED Visits Over Time To examine trends over time, the ED visits in which patients were discharged home or elsewhere of 15 hospitals were tracked over the five-year period from 2004 to 2009 (Ben Taub General, Lyndon B. Johnson General, Memorial Hermann (MH) Hermann, MH Southwest, MH Southeast, MH Northwest, MH Woodlands, MH Memorial City, MH Katy, MH Sugar Land (formerly Fort Bend), Hospital Corporation of America (HCA) Bayshore, HCA Spring Branch, HCA East Houston, Texas Children s Hospital, St. Luke s Episcopal Hospital). The ED visits of 9
10 22 hospitals were tracked over the four-year period from 2005 to 2009 (above listed hospitals, plus MH Northeast, HCA West Houston, CHRISTUS St. Catherine, CHRISTUS St. John, St. Luke s Community Medical Center, The Methodist Hospital, and San Jacinto Methodist Hospital). There was a downward trend in non-hospitalized ED visits from 2004 through 2006 followed by an increase in 2008 and The number of PCRED visits was highest in The percentage of categorized visits that were PCR consistently declined over the period but increased in For the 15 hospitals, the PCRED visit percentage was 80.9% in 2009, compared to 72.4% in 2007 (Table 14). For the 22 hospitals, the percentage was 80.4% in 2009 (Table 15). Visits by persons with Medicare represented a small but steadily increasing percentage of PCRED visits for most of the study years, but decreased in 2009 (Figures 23 and 24). The uninsured have continued to account for the highest percentage of PCRED visits. Individuals with Medicaid have fluctuated between 25% and 32% of total PCRED visits. The percentage of PCRED visits by persons with private insurance was at its peak in Hispanics are steadily increasing as a percentage of PCRED visits. In both groups of hospitals they represented approximately 40% of PCRED visits in 2009 (Figures 25 & 26). Blacks represent the next largest group on a percentage basis. Visits by children age 18 and under continue to account for the largest proportion of PCRED visits. In 2008 that proportion dropped somewhat, but increased again in 2009 (Figures 27 & 28). Adults age 26 to 44 accounted for the next largest percentage. There has been no change in the gender ratio of PCRED visits over the last five years (Figures 29 & 30) 10
11 Conclusion ED visits of Harris County residents in area hospitals increased in 2009 both in terms of the total number and population rates. The percentage of visits that were PCR rose slightly when compared with The same areas of the county had the highest frequencies and rates of ED visits and PCRED visits as in past years. The ZIP codes with the largest increases in PCRED visits by the uninsured tend to be outside the 610 Loop. The East/Northeast and South/Central sections of Harris County continue to have the highest rates of PCRED visits by the uninsured. PCRED visits had a shorter length of stay than non-pcred visits. Behaviorrelated ED visits took longer to treat than medical visits. Diversion of PCRED visits of adults age 18 to 44 have the largest potential for cost-savings, especially among the uninsured. Children have the highest rate of PCRED visits as do Medicaid and CHIP enrollees. Further exploration of Census data is recommended to compare children with commercial insurance to children who are on Medicaid and CHIP, and to compare Medicare enrollees above 65 with Medicare enrollees below 65. Continued participation by a large number of hospitals has allowed for monitoring of community-wide trends ED and PCRED utilization in Harris County. The trend analysis over the last five years suggests the following: a) the need to expand outpatient primary and specialty care capacity, especially for the uninsured, b) the need for patient education about appropriate ED use, c) the need for after hours clinics for children, d) the need for hospital staffing at peak hours of ED use, and e) the need for efforts to link the uninsured, as well as Medicaid and CHIP enrollees to a medical home. Although the highest percentages and rates of PCRED are for the uninsured, Medicaid, and CHIP, the fact that a high number and rate of PCRED visits are by persons with private insurance or Medicare should not be ignored. Understanding trends in ED 11
12 patterns for all populations suggests that multiple diversion strategies are needed targeting multiple population groups. Limitations The NYU ED algorithm does not classify hospitalized visits, mental health, drug/alcohol, and injury-related visits. It may be assumed that most hospitalized visits and a large percentage of mental health, drug/alcohol, and injury visits are not PCRED visits. To the extent that some are PCR, the estimates understate the number of PCRED visits. This limitation does not affect the percentage or rate calculations. Because the data submitted is de-identified, it is not possible to identify patients who make multiple ED visits. Therefore, we are not able to identify frequent users of the ED. In past years it was believed that Medicaid ED visits also included CHIP. A review of the 2007 data has revealed that most CHIP visits were counted as commercial or private insurance by participating hospitals. In 2009, because some of the commercial visits could not be separated from CHIP visits, actual CHIP visits may be slightly higher in frequency than reported. New ZIP codes took effect during 2008 in the Baytown and Fort Bend County areas. For the aggregate report, what may appear to be a drop in visits from (for example) is a reflection of the fact that part of that ZIP code is now 77523, which is in Chambers County. 12
13 II. PURPOSE The increasing number of hospital ED visits, many of which are PCR, is leading to a multitude of associated issues regarding equity and access to care in the U.S. One of the most pressing issues in Houston is the capacity of hospitals to provide emergency care when emergency rooms are crowded with patients seeking basic care. The main purpose of this study is to provide information on the frequency, type, and distribution of ED visits in Houston hospitals that are PCR. To achieve this purpose, the study obtained ED data from twenty five hospitals in Houston for 2008, classified the visits of Harris County residents in terms of PCR/non-PCR use of the ED, and examined the demographic, coverage, and geographic characteristics of patients making the visits. The goal is to replicate the study over time in order to determine trends and evaluate primary care enhancement activities. 13
14 III. METHODS The study initially resulted from a partnership between Gateway to Care, the Harris County Hospital District (HCHD), and The University of Texas School of Public Health (UTSPH). In 2002, UTSPH worked with Gateway to Care on a pilot study to develop a process for monitoring ED use in Houston. The process developed in the pilot study was then applied to 11 hospitals in An increasing number of hospitals have participated each year. The current report uses data from 25 of the hospitals that serve the Houston 911 service area. Aggregate reports for each year are posted on the website for the Health Services Research Collaborative. The first step in the study involves requesting the following information on ED visits in Houston hospitals: 1. Date and time of admission to ED 2. Primary and secondary discharge diagnosis 3. Discharge date and time 4. Payment source (payer codes from the Patient Data Set of the Texas Hospital Association and the Texas Health Care Information Council) 5. Patient age 6. Patient gender 7. Patient race/ethnicity (Black, Asian, American Indian, Hispanic, White, Other, Unknown) 8. Patient ZIP code 9. Where discharged to (e.g. home, hospital, etc) 10. Method of transport (e.g. ambulance, self, other) Working with the hospitals, a dataset was obtained, reviewed, and cleaned comprising a full set of ED visit information for the period January 1, 2008 December 31, Visits that did not result in a hospitalization were analyzed. The second step involved the application of the New York University ED Classification Algorithm to classify ED visits of Harris County residents into the following four categories: 1. Non-emergent: Immediate treatment was not required within 12 hours. 14
15 2. Emergent-Primary Care Treatable: Treatment was required within 12 hours, but could have been provided effectively and safely in a primary care setting. Continuous observation was not required, no procedures were performed or resources used that are not typically available in a primary care setting. 3. Emergent-ED Care Needed-Preventable/Avoidable: ED care was required within 12 hours, but the emergent nature of the condition was potentially preventable/avoidable if timely/continuous primary care had been received for the underlying illness. 4. Emergent-ED Care Needed-Not Preventable/Avoidable: ED care was required within 12 hours and primary care could not have prevented the condition. The NYU Center for Health and Public Service Research and the United Hospital Fund of New York developed the ED Algorithm as a measure of PCR ED use. The ED Algorithm is a set of probabilities that when applied to the primary diagnosis (ICD-9 code) of the patient estimates the likelihood that the patient s ED visit was one or more of the types described above. The ED algorithm was developed with the advice of a panel of ED physicians and is based on information abstracted from a sample of complete ED records 3,500 cases in 1994 and 2,200 cases in 1999 from six Bronx, New York hospitals. The decision tree followed by the panel is summarized on the next page. The distribution of ED visits by type represents the weighted sum of all visits with a certain probability of being that type. ED visits in the first three categories are considered PCR use of the ED, while those in the fourth category reflect non-pcr use of the ED. A number of visits are not categorized using the Algorithm. These include injury, mental health-related, and alcohol or drug-related visits, and visits with missing data. The ED Algorithm for these visits has not yet been developed by the NYU researchers. 15
16 ED CLASSIFICATION PROCESS Step 1 Steps 2 and 3 Step 4 Not Preventable/Avoidable ED Care Needed Emergent Preventable/Avoidable Primary Care Treatable Non-emergent Primary Care Treatable Various analyses were conducted of the classified visit data to determine patterns of PCR and non-pcr visits. These included monthly, daily, and time of day patterns of visits; the distribution of visits by the coverage and demographic characteristics of patients (payment source, race/ethnicity, age, employment status, and sex); the distribution of visits by primary diagnosis (ICD9 Codes); and the distribution of visits by ZIP code of patient residence. The results of the analysis of ED visits should be treated cautiously and are best viewed as indicators of utilization rather than a definitive assessment. This is because only a portion of all visits are categorized by the Algorithm. ED visits that result in a hospitalization usually encompass no more than 10-20% of total visits. 1 Given these limitations in the methods, the percentage of visits that fall into the PCR categories should be interpreted as a conservative estimate. In order to get a complete picture of ED utilization, attention must also be paid to injuries, mental health and substance abuse, and hospitalized visits. In an effort to address this 1 Billings J, Using administrative data to monitor access, identify disparities, and assess performance of the safety net, U.S. Agency for Healthcare Research and Quality,
17 broader picture, the report examines not only PCR visits, but non primary care related visits as well. 17
18 IV. RESULTS A. Total ED Visits by Type During 2009, 1,127,557 ED visits were made to all 25 participating hospitals. Of this total, 84.8% were made by Harris County residents, 12.9% by residents of the seven surrounding counties, and 2.3% by patients from outside the area. Of all ED visits by residents of the eight county area, 84.0% were discharged home or elsewhere. Of all ED visits by Harris County residents, 72.9% were discharged home or elsewhere (Table 1a). The ED visits of participating hospitals represented 74.04% of all ED visits reported to the Texas Department of State Health Services by all hospitals in Harris County in Using this percentage for extrapolation, an estimated 1,287,710 ED visits were made by Harris County residents to all hospitals in the county. The ED visit rate of Harris County residents was per 100 residents in 2009, exceeding the and 30.0 ED visit rates in 2007 and 2008, respectively (Table 1a). Females have a higher rate than males for both total visits and PCRED visits. Persons age 65 and over have the highest rate of total ED visits (34.33 per 100 elderly), but children and adolescents have the highest rate of PCRED visits (12.10 per 100 children) (Table 1b). Persons enrolled in Medicare have the highest rate of total ED visits (76.13 per 100 Medicare enrollees), but persons enrolled in Medicaid and/or CHIP have a slightly higher rate of PCRED visits (23.0 per 100 Medicaid/CHIP enrollees). Persons of other race or ethnicity have the highest rates of total visits and PCRED visits. Among those defined as one race, persons who were Black have the highest rate of total visits (37.43 per 100 Black persons) and PCRED visits (17.4 per 100 Black persons) (Table 1b). 18
19 Table 1a. Total ED Visits to Hospitals in Harris County Study Hospital Visits 25 Hospitals Hospitals Hospitals Frequency Percent of first row Percent of Frequency first row Percent of Frequency first row A Total 1 (all areas) 2 1,060, % 1,060, % 1,127, % B Total Discharged to Home or Self (all areas) 3 897, % 931, % 961, % C Total Admitted (all areas) 3 163, % 128, % 165, % D Total (eight county area) 3 984, % 1,013, % 1,094, % E Total Discharged to Home or Self (eight county area) 3 835, % 890, % 934, % F Total Admitted (eight county area) 3 149, % 122, % 159, % G Total (Harris County) 901, % 899, % 953, % H Total Discharged to Home or Self (Harris County) 761, % 789, % 812, % I Total Admitted (Harris County) 3 140, % 109, % 140, % All Hospital Visits All Hospitals All Hospitals 2008 All Hospitals 2009 J Total All 5 (all areas) 2 1,414,863 1,401,423 1,522,943 K Total Visits as a Percentage of Total All Visits 74.98% 75.68% 74.04% L Estimated Number of Total That Are From Harris Co. 6 1,202,611 1,188,791 1,287,710 M Est. Number of Discharged That Are From Harris Co. 7 1,015,078 1,043,867 1,097,899 N Est. Number of Admitted That Are From Harris Co , , ,811 O Population of Harris County 9 3,891,240 3,965,716 4,044,032 P Harris Co. ED Rate per 100 population (adm. and disch.) Q Total Rate of Discharged ED Visits per R Total Rate of Admitted ED Visits per Total visits reported by hospitals participating in this report. 2 All areas = all states, all countries. 3 22,691 total visits in 2008 lacked a primary ICD9 code, 20,533 of these were in Harris County. 4 Represents a correction to report on 2007 ED visits. 5 Source: Cooperative DSHS/AHA/THA Annual Survey of Hospital and Tracking Database. 6Row J x percentage in Row G. 7Row J x percentage in Row H. 8Row J x percentage in Row I. 9 Source: Texas State Data Center. 19
20 Table 1b ED Visits to Hospitals in Harris County by Demographics, 2009 Population Rates 1 For Demographics Males Females 2009 total population (by gender) 2,043,393 2,027, total ED visits (by gender) 417, , total PCRED visits (by gender) 162, , total ED rate per 100 (by gender) PCRED rate per 100 (by gender) and over 2009 total population (by age) 1,174,860 1,641, , , total ED visits (by age) 291, , , , total PCRED visits (by age) 142, ,674 69,914 30, total ED rate per 100 (by age) PCRED rate per 100 (by age) Commercial Medicaid/SCHIP Medicare Uninsured 2009 total population (by payer) 2 2,111, , ,607 1,093, total ED visits (by payer) 237, , , , total PCRED visits (by payer) 94, ,166 34, , total ED rate per 100 (by payer) PCRED rate per 100 (by payer) Asian Black Hispanic Am. Indian Other White 2009 total population (by race) 3 232, ,412 1,619,426 6, total ED visits (by race) 16, , , total PCRED visits (by race) 6, , , ,698 94, total ED rate per 100 (by race) PCRED rate per 100 (by race) Population data comes from the 2009 American Community Survey 1 Year Estimates, Census Bureau. 2 Payer: For ED visits, commercial and other private were combined, as were Medicaid and CHIP. For ACS population, the following were combined: commercial (employer provided, direct purchase, employer and direct purchase, employer and Medicare, other private only), Medicare (Medicare only, Medicare and Medicaid). Even though ACS population is available for Tricare and VA coverage, the majority of other government ED visits are usually worker s comp. The ACS data did not have a separate category for CHIP. 3 Race: For ACS data, the following were combined: other (Native Hawaiian, Pacific Islander, some other race alone, two or more races). 20
21 B. Primary Care Related ED Visits A little over 40% (41.0%) of ED visits by Harris County residents were PCR in This includes non-urgent, primary care treatable, and primary care preventable visits. The 2009 rate compares to 39.1% in 2008 and 41.1% in 2007 (Table 2). 21
22 Table 2. ED visits to Hospitals by Harris County Residents Type of Visit 25 Hospitals Hospitals Hospitals 2009 Frequency TOTAL VISITS Total All Visits, Harris County (discharged and admitted) 1 901, , ,395 Total Discharged Visits (DC), Harris County 1 761, , ,863 Total Admitted Visits, Harris County 1 140, , ,532 CATEGORIZED VISITS (DC) Non-Emergent 2 145, , ,180 Emergent, Primary Care Treatable 2 166, , ,389 Emergent, ED Care Needed - Preventable/Avoidable 2 58,334 48,903 52,376 Total Primary Care Related Visits, eight county area 370, , ,945 Emergent, ED Care Needed - NOT Preventable/Avoidable 85,034 94,429 95,463 Total Categorized Visits eight county area 455, , ,408 NON-CATEGORIZED VISITS (DC) Injury 166, , ,243 Mental Health Related 10,720 12,382 10,227 Alcohol or Drug Related 5,648 4,389 4,973 Unclassified 3 96, , ,390 Total Non-Categorized Visits, eight county area 279, , ,833 Percent PERCENTAGE OF CATEGORIZED ED VISITS (DC) Non-Emergent 32.0% 31.7% 32.5% Emergent - Primary Care Treatable 36.6% 36.1% 37.1% ED Care Needed - Prev./Avoid. 12.8% 11.0% 10.8% % Categorized That Are Primary Care Related 81.3% 78.8% 80.4% ED Care Needed - NOT Prev./Avoid. 18.7% 21.2% 19.6% PERCENTAGE OF TOTAL ED VISITS Non-Emergent (DC) 16.2% 15.7% 16.6% Emergent - Primary Care Treatable (DC) 18.5% 17.9% 18.9% ED Care Needed - Prev./Avoid. (DC) 6.5% 5.4% 5.5% % Total That Are Primary Care Related 41.1% 39.1% 41.0% ED Care Needed - NOT Prev./Avoid. (DC) 9.4% 10.5% 10.0% PERCENTAGE OF TOTAL ED VISITS Injury (DC) 18.5% 21.5% 17.2% Mental Health Related (DC) 1.2% 1.4% 1.1% Alcohol or Drug Related (DC) 0.6% 0.5% 0.5% Unclassified (DC) % 24.4% 14.2% Admitted Visits (all causes) 15.6% 12.2% 14.7% PERCENTAGE OF DISCHARGED ED VISITS Non-Emergent 19.1% 17.9% 19.5% Emergent - Primary Care Treatable 21.9% 20.4% 22.2% ED Care Needed - Prev./Avoid. 7.7% 6.2% 6.4% % Discharged That Are Primary Care Related 48.7% 44.5% 48.1% ED Care Needed - NOT Prev./Avoid. 11.2% 12.0% 11.7% PERCENTAGE OF DISCHARGED ED VISITS Injury 21.9% 24.5% 20.2% Mental Health Related 1.4% 1.6% 1.3% Alcohol or Drug Related 0.7% 0.6% 0.6% Unclassified 12.7% 27.8% 16.7% 1 May contain missing data. Therefore, percentages at the bottom will not total to 100%. 2 Primary care related. 3 The rise in unclassified visits in 2008 was due primarily to a coding problem. 22
23 Figure Categorized ED Visits by Type (N=24) ED Care Needed - NOT Prev./Avoid., 19.6% Non-Emergent, 32.5% ED Care Needed - Prev./Avoid., 10.8% Emergent - Primary Care Treatable, 37.1% Figure Total ED Visits by Type Unclassified (DC), 14.2% Admitted Visits (all causes), 14.7% Non- Emergent (DC), 16.6% Emergent - Primary Care Treatable (DC), 18.9% Alcohol or Drug Related (DC), 0.5% ED Care Needed - Prev./Avoid. (DC), 5.5% Mental Health Related (DC), 1.1% Injury (DC), 17.2% ED Care Needed - NOT Prev./Avoid. (DC), 10.0% 23
24 C. ED Visits by Month, Day, and Time The number of ED visits by Harris County residents was highest in May and September but vary relatively little from month to month (Figure 3). The percentage of ED visits that lead to hospitalizations was also relatively constant over the year. The peak days of the week for ED visits were Saturday and Sunday (Figure 4). The percentage of ED visits leading to hospitalizations remained relatively level each day. ED visits by children peaked between 7-8 PM, with a secondary peak at 11 AM-12 PM (Figure 5a). ED visits by adults age 18 to 64 peaked at noon, dropped slightly and remained fairly level until 7 PM (Figure 5b). ED visits by adults age 65 and over peaked from 12 PM to 4 PM, then dropped during the evening (Figure 5c). Relatively few ED visits by children resulted in a hospitalization, in contrast to adults age 65 and over. 24

25 Figure 3 25
26 Figure 4 26
27 Figure 5. All ages 27
28 Figure 5a. Age
29 Figure 5b. Age
30 Figure 5c. Age 65 and over 30
31 D. ED Visits by Patient Characteristics Tables 3a, 4a, 5a, and 6a represent the frequency counts for ED visits by payer source, race, age, and gender (respectively). Tables 3b, 4b, 5b, and 6b represent percentages of these characteristics when summed horizontally (e.g. total hospitalized visits by payer source). Tables 3c, 4c, 5c, and 6c represent percentages of these characteristics in four broad categories when summed vertically (e.g. total visits by persons who are Hispanic). Payer source: The uninsured accounted for 33.1% of PCRED visits and 29.2% of non- PCRED visits. Medicaid covered individuals made up 26.8% of PCRED visits and 21.2% of non-pcred visits. Children on CHIP made up 4.2% of PCRED visits (Figures 6 & 7). Patients with commercial insurance accounted for 24.1% of PCRED visits and 26.4% of non-pcred visits. Four in ten ED visits made by persons on Medicaid (39.8%) were PCR, and more than half of all ED visits by persons on CHIP (51.9%) were PCR. Medicare enrollees had the highest percentage of hospitalized ED visits (32.2%) (Figure 8). Race/Ethnicity: Seven in ten (70.6%) PCRED visits were by persons who were Black or Hispanic, as were 60.2% of non-pcred visits. By contrast, persons who were White accounted for 24.1% of PCRED visits and 34.2% of non-pcred visits (Figures 9 & 10). Nearly half of all ED visits by persons who were black or Hispanic were PCR. Asians and Whites were most likely to have an ED visits resulting in a hospitalization (Figure 11). Age: Children age 17 and under made up more than one third (36.4%) of all PCRED visits, and just over one fourth (27.6%) of non-pcred visits. Adults age 65 and over were almost twice as likely to have non-pcred visits than a PCRED visit. Adults age were more likely to have a PCRED visit than a non-pcred visit (Figures 12 & 13). More than three in ten (31.8%) ED visits by adults age 65 resulted in a hospitalization (Figure 14). 31
32 Table 3a. Frequency of ED Visit Types by Payment Source (N=24) Type of Visit Comm SCHIP M'Caid M'care Other Gov. Other Priv. Unins Unk All Total Visits (hospitalized & non hospitalized) 237,079 31, , ,786 27, ,290 5, ,385 Total Hospitalized Visits 22,392 1,817 25,057 39,841 3, , ,144 Total Primary Care Related 94,393 16, ,762 34,270 8, ,434 2, ,945 Total Injury/BH/Unclass. Visits 89,113 10,848 72,299 36,316 13, ,318 1, ,833 Tot. non Primary Care Related (Total minus PCR) 142,686 15, ,717 89,516 19, ,856 2, ,440 Non-Emergent 36,722 6,464 40,656 12,033 4, ,608 1, ,180 Emergent-Primary Care Treatable 44,956 7,830 48,961 15,569 3, ,257 1, ,389 Emergent Care Needed-Preventable/Avoidable 12,715 2,109 15,145 6,669 1, , ,376 Emergent Care Needed-NOT Prev./Av. 31,181 2,520 17,361 13,359 2, , ,463 TOTAL Categorized Visits 125,574 18, ,123 47,629 10, ,768 3, ,408 Table 3b. Percentage of ED Visit Types by Payment Source (read horizontally) Type of Visit Comm SCHIP M'Caid M'care Oth. Gov Oth. Priv Unins All Total Visits (hospitalized & non hospitalized) 25.4% 3.4% 23.5% 13.3% 3.0% 0.0% 30.8% 100.0% Total Hospitalized Visits 17.1% 1.4% 19.1% 30.4% 2.4% 0.0% 29.1% 100.0% Total Primary Care Related* 24.1% 4.2% 26.8% 8.8% 2.2% 0.0% 33.1% 100.0% Total Injury/BH/Unclass. Visits 28.3% 3.4% 23.0% 11.5% 4.4% 0.0% 29.0% 100.0% Tot. non Primary Care Related (Total minus PCR)* 26.4% 2.8% 21.2% 16.5% 3.5% 0.0% 29.2% 100.0% Non-Emergent 23.2% 4.1% 25.7% 7.6% 2.5% 0.0% 35.8% 100.0% Emergent-Primary Care Treatable 24.9% 4.3% 27.1% 8.6% 2.0% 0.0% 32.3% 100.0% Emergent Care Needed-Preventable/Avoidable 24.3% 4.0% 28.9% 12.7% 1.9% 0.0% 27.8% 100.0% Emergent Care Needed-NOT Prev./Av. 32.7% 2.6% 18.2% 14.0% 2.2% 0.0% 29.7% 100.0% TOTAL Categorized Visits 25.8% 3.9% 25.1% 9.8% 2.2% 0.0% 32.4% 100.0% * Reflected in figures on following page. 32
33 Figure 6. PCR ED Visits by Payment Source (N=24) Unins, 33.1% Comm. 24.1% SCHIP 4.2% Oth. Priv. 0.0% Oth. Govt. 2.2% Medicaid 26.8% Medicare 8.8% Figure 7. All Other 1 ED Visits by Payment Source (N=24) Unins, 29.2% Comm. 26.4% Oth. Priv. 0.0% SCHIP 2.8% Oth. Govt. 3.5% Medicare 16.5% Medicaid 21.2% 1 Non PCR non-hospitalized visits and hospitalized visits. 33
34 Table 3c. Percentage of ED Visit Types by Payment Source (read vertically) T ype o f Visit Commerc. SCHIP Medicaid Medicare Other Gov. Other Priv. Uninsured Unk All P ercentage P rimary C are R elated 39.8% 51.9% 47.7% 27.7% 31.4% 50.4% 45.1% 54.9% 41.9% P ercentage ED C are N eeded, N o t P rev. 13.2% 8.0% 7.9% 10.8% 7.6% 10.9% 9.9% 11.2% 10.2% P ercentage Injury/ B H / Unclass. 37.6% 34.3% 32.9% 29.3% 49.6% 29.3% 31.8% 21.3% 33.8% P ercentage H o spitalized 9.4% 5.8% 11.4% 32.2% 11.4% 9.4% 13.3% 12.5% 14.1% T o tal 100.0% 100.0% 100.0% 100.0% 100.0% 100.0% 100.0% 100.0% 100.0% Figure 8. Payment Source by ED Visit Type (N=24) 100% 90% 80% 70% 60% 50% 40% 30% 20% 10% 0% Percentage Hospitalized Percentage Injury/BH/Unclass. Percentage ED Care Needed, Not Prev. Percentage Primary Care Related 34
35 Table 4a. Frequency of ED Visit Types by Race/Ethnicity (N=24) Type of Visit Asian Black Hispanic Am. Indian Other Unk White All Total Visits (hospitalized & non hospitalized) 16, , , ,505 8, , ,385 Total Hospitalized Visits 2,754 38,756 37, , , ,144 Total Primary Care Related 6, , , ,698 4,477 94, ,945 Total Injury/BH/Unclass. Visits 5,634 80, , ,813 2, , ,833 Tot. non Primary Care Related (Total minus PCR) 10, , , ,807 4, , ,440 Non-Emergent 2,529 53,088 60, ,859 1,845 36, ,180 Emergent-Primary Care Treatable 2,767 56,008 70, ,599 2,230 44, ,389 Emergent Care Needed-Preventable/Avoidable ,999 18, , ,858 52,376 Emergent Care Needed-NOT Prev./Av. (dc) 1,858 27,229 32, , ,230 95,463 TOTAL Categorized Visits 7, , , ,341 5, , ,408 Table 4b. Percentage of ED Visit Types by Race/Ethnicity (read horizontally) Type of Visit Asian Black Hispanic Am. Indian Other Unk White All Total Visits (hospitalized & non hospitalized) 1.7% 29.3% 35.3% 0.1% 2.6% 1.0% 30.0% 100.0% Total Hospitalized Visits 2.1% 29.6% 28.9% 0.1% 2.6% 0.7% 36.1% 100.0% Total Primary Care Related* 1.5% 32.5% 38.1% 0.1% 2.5% 1.1% 24.1% 100.0% Total Injury/BH/Unclass. Visits 1.8% 25.5% 34.7% 0.1% 2.8% 0.9% 34.2% 100.0% Tot. non Primary Care Related (Total minus PCR)* 1.9% 27.0% 33.2% 0.1% 2.7% 0.8% 34.2% 100.0% Non-Emergent 1.6% 33.6% 38.2% 0.1% 2.4% 1.2% 22.9% 100.0% Emergent-Primary Care Treatable 1.5% 31.0% 39.1% 0.1% 2.5% 1.2% 24.5% 100.0% Emergent Care Needed-Preventable/Avoidable 1.4% 34.4% 34.5% 0.1% 2.4% 0.8% 26.5% 100.0% Emergent Care Needed-NOT Prev./Av. (dc) 1.9% 28.5% 34.3% 0.1% 2.8% 0.7% 31.7% 100.0% TOTAL Categorized Visits 1.6% 31.7% 37.4% 0.1% 2.5% 1.1% 25.6% 100.0% * Reflected in figures on following page. 35
36 Figure 9. Primary Care-Related ED Visits by Race/Ethnicity (N=24) White, 24.1% Asian, 1.5% Black, 32.5% Unk, 1.1% Other, 2.5% Am. Indian, 0.1% Hispanic, 38.1% Figure 10. All Other 1 ED Visits by Race/Ethnicity (N=24) Asian, 1.9% White, 34.2% Black, 27.0% Unk, 0.8% Other, 2.7% Am. Indian, 0.1% Hispanic, 33.2% 1 Non PCR non-hospitalized visits and hospitalized visits. 36
37 Table 4c. Percentage of ED Visit Types by Race/Ethnicity (read vertically) Type of Visit Asian Black Hispanic Am.Indian Other Unk White All Percentage Primary Care Related 37.1% 46.5% 45.3% 43.7% 39.6% 50.0% 33.7% 41.9% Percentage ED Care Needed, Not Prev. 11.4% 10.0% 10.0% 12.0% 10.8% 7.5% 10.8% 10.2% Percentage Injury/BH/Unclass. 34.6% 29.4% 33.2% 30.4% 36.0% 32.2% 38.5% 33.8% Percentage Hospitalized 16.9% 14.2% 11.5% 13.9% 13.7% 10.2% 16.9% 14.1% Total 100.0% 100.0% 100.0% 100.0% 100.0% 100.0% 100.0% 100.0% Figure 11. Race/Ethnicity by ED Visit Type (N=24) 100% 90% 80% 70% 60% 50% 40% 30% 20% 10% 0% Percentage Hospitalized Percentage Injury/BH/Unclass. Percentage ED Care Needed, Not Prev. Percentage Primary Care Related 37
38 Table 5a. Frequency of ED Visit Types by Age (N=24) Type of Visit All Total Visits (hospitalized & non hospitalized) 291, , , , , ,385 Total Hospitalized Visits 22,867 12,349 26,802 33,297 35, ,144 Total Primary Care Related 142,210 51,806 96,867 69,914 30, ,945 Total Injury/BH/Unclass. Visits 108,286 39,870 74,614 58,392 33, ,833 Tot. non Primary Care Related (Total minus PCR) 149,682 64, , ,688 82, ,440 Non-Emergent 53,425 23,182 42,041 28,845 10, ,180 Emergent-Primary Care Treatable 68,024 23,156 44,345 31,302 13, ,389 Emergent Care Needed-Preventable/Avoidable 20,762 5,468 10,481 9,767 5,898 52,376 Emergent Care Needed-NOT Prev./Av. (dc) 18,529 11,943 28,129 23,999 12,864 95,463 TOTAL Categorized Visits 160,739 63, ,996 93,913 43, ,408 Table 5b. Percentage of ED Visit Types by Age (read horizontally) Type of Visit All Total Visits (hospitalized & non hospitalized) 31.3% 12.4% 24.3% 19.9% 12.1% 100.0% Total Hospitalized Visits 17.4% 9.4% 20.4% 25.4% 27.3% 100.0% Total Primary Care Related* 36.4% 13.3% 24.8% 17.9% 7.7% 100.0% Total Injury/BH/Unclass. Visits 34.4% 12.7% 23.7% 18.5% 10.7% 100.0% Tot. non Primary Care Related (Total minus PCR)* 27.6% 11.9% 23.9% 21.4% 15.2% 100.0% Non-Emergent 33.8% 14.7% 26.6% 18.2% 6.8% 100.0% Emergent-Primary Care Treatable 37.7% 12.8% 24.6% 17.4% 7.5% 100.0% Emergent Care Needed-Preventable/Avoidable 39.6% 10.4% 20.0% 18.6% 11.3% 100.0% Emergent Care Needed-NOT Prev./Av. (dc) 19.4% 12.5% 29.5% 25.1% 13.5% 100.0% TOTAL Categorized Visits 33.0% 13.1% 25.7% 19.3% 8.8% 100.0% * Reflected in figures on following page. 38
")


39 Figure 12. PCR ED Visits by Age (N=24) 45-64, 17.9% 65+, 7.7% 26-44, 24.8% 0-17, 36.4% 18-25, 13.3% Figure 13. All Other 1 ED Visits by Age (N=24) 65+, 15.2% 45-64, 21.4% 0-17, 27.6% 26-44, 23.9% 18-25, 11.9% 1 Non PCR non-hospitalized visits and hospitalized visits. 39
40 Table 5c. Percentage of ED Visit Types by Age (read vertically) Type of Visit All Percentage Primary Care Related 48.7% 44.7% 42.8% 37.7% 26.8% 41.9% Percentage ED Care Needed, Not Prev. 6.3% 10.3% 12.4% 12.9% 11.4% 10.2% Percentage Injury/BH/Unclass. 37.1% 34.4% 33.0% 31.5% 29.9% 33.8% Percentage Hospitalized 7.8% 10.6% 11.8% 17.9% 31.8% 14.1% Total 100.0% 100.0% 100.0% 100.0% 100.0% 100.0% Figure 14. Age by ED Visit Type (N=24) 100% 90% 80% 70% 60% 50% 40% 30% 20% 10% 0% All Percentage Hospitalized Percentage Injury/BH/Unclass. Percentage ED Care Needed, Not Prev. Percentage Primary Care Related 40
41 Table 6a. Frequency of ED Visit Types by Gender (N=24) Type of Visit Female Male Unk All Total Visits (hospitalized & non hospitalized) 514, , ,385 Total Hospitalized Visits 71,129 60, ,144 Total Primary Care Related 228, , ,945 Total Injury/BH/Unclass. Visits 159, , ,833 Tot. non Primary Care Related (Total minus PCR) 285, , ,440 Non-Emergent 95,755 62, ,180 Emergent-Primary Care Treatable 104,381 75, ,389 Emergent Care Needed-Preventable/Avoidable 28,580 23, ,376 Emergent Care Needed-NOT Prev./Av. (dc) 55,581 39, ,463 TOTAL Categorized Visits 284, , ,408 Table 6b. Percentage of ED Visit Types by Gender (read horizontally) Type of Visit Female Male Unk All Total Visits (hospitalized & non hospitalized) 55.2% 44.8% 0.0% 100.0% Total Hospitalized Visits 54.2% 45.8% 0.0% 100.0% Total Primary Care Related* 58.5% 41.5% 0.0% 100.0% Total Injury/BH/Unclass. Visits 50.5% 49.4% 0.0% 100.0% Tot. non Primary Care Related (Total minus PCR)* 52.8% 47.2% 0.0% 100.0% Non-Emergent 60.5% 39.5% 0.0% 100.0% Emergent-Primary Care Treatable 57.9% 42.1% 0.0% 100.0% Emergent Care Needed-Preventable/Avoidable 54.6% 45.4% 0.0% 100.0% Emergent Care Needed-NOT Prev./Av. (dc) 58.2% 41.8% 0.0% 100.0% TOTAL Categorized Visits 58.4% 41.5% 0.0% 100.0% * Reflected in figures on following page. 41
42 Figure 15. Primary Care Related ED Visits by Gender (N=24) Male, 41.5% Female, 58.5% Figure 16. All Other 1 ED Visits by Gender (N=24) Male, 47.2% Female, 52.8% 1 Non PCR non-hospitalized visits and hospitalized visits. 42
43 Table 6c. Percentage of ED Visit Types by Gender (read vertically) Type of Visit Female Male Unk All Percentage Primary Care Related 44.4% 38.8% 31.1% 41.9% Percentage ED Care Needed, Not Prev. 10.8% 9.5% 8.0% 10.2% Percentage Injury/BH/Unclass. 30.9% 37.3% 43.7% 33.8% Percentage Hospitalized 13.8% 14.4% 17.2% 14.1% Total 100.0% 100.0% 100.0% 100.0% Figure 17. Gender by ED Visit Type (N=24) 100% 90% 80% 70% 60% 50% 40% 30% 20% 10% 0% Female Male Unk All Percentage Hospitalized Percentage Injury/BH/Unclass. Percentage ED Care Needed, Not Prev. Percentage Primary Care Related 43
44 ED Visits by Method of Transporation to the ED Visits were classified according to the following groupings: ambulance (any form of ground or air ambulance), self (automobile, walk in, public transporation), other (e.g. police, newborns), and unknown (field was empty or missing). Even though the hospitals invited to take part in the study are primarily the ones serving the Houston 911 service area, non HFD ambulance transports are reflected in these results as well. One in ten (10.1%) PCRED visits were by persons with an ambulance transport to the ED. By contrast, more than one in five (21.8%) non-pcred visits were by persons with an ambulance transport to the ED (Tables 7a & 7b; Figures 18 & 19). One fourth (25.0%) of ambulance transports to the ED eventually resulted in a hospitalization (Table 7c and Figure 20). 44
45 Table 7a. Frequency of ED Visit Types by Transport (N=24) Type of Visit Ambulance Self Other Unk All Total Visits (hospitalized & non hospitalized) 157, ,225 5,661 20, ,385 Total Hospitalized Visits 42,779 82,759 1,179 4, ,144 Total Primary Care Related 39, ,385 1,682 7, ,945 Total Injury/BH/Unclass. Visits 58, ,556 2,382 6, ,833 Tot. non Primary Care Related (Total minus PCR) 118, ,840 3,979 12, ,440 Non-Emergent 13, , , ,180 Emergent-Primary Care Treatable 17, , , ,389 Emergent Care Needed-Preventable/Avoidable 8,494 42, ,376 Emergent Care Needed-NOT Prev./Av. (dc) 16,434 76, ,087 95,463 TOTAL Categorized Visits 55, ,910 2,100 9, ,408 Table 7b. Percentage of ED Visit Types by Transport (read horizontally) Type of Visit Ambulance Self Other Unk All Total Visits (hospitalized & non hospitalized) 16.9% 80.4% 0.6% 2.1% 100.0% Total Hospitalized Visits 32.6% 63.1% 0.9% 3.4% 100.0% Total Primary Care Related* 10.1% 87.6% 0.4% 1.9% 100.0% Total Injury/BH/Unclass. Visits 18.7% 78.6% 0.8% 1.9% 100.0% Tot. non Primary Care Related (Total minus PCR)* 21.8% 75.1% 0.7% 2.3% 100.0% Non-Emergent 8.6% 88.8% 0.5% 2.1% 100.0% Emergent-Primary Care Treatable 9.6% 88.2% 0.4% 1.8% 100.0% Emergent Care Needed-Preventable/Avoidable 16.2% 81.7% 0.4% 1.7% 100.0% Emergent Care Needed-NOT Prev./Av. (dc) 17.2% 80.2% 0.4% 2.2% 100.0% TOTAL Categorized Visits 11.5% 86.1% 0.4% 2.0% 100.0% * Reflected in figures on following page. 45
46 Figure 18. Primary Care Related ED Visits by Transport (N=24) Other, 0.4% Unk, 1.9% Ambulance, 10.1% Self, 87.6% Figure 19. All Other 1 ED Visits by Transport (N=24) Other, 0.7% Unk, 2.3% Ambulance, 21.8% Self, 75.1% 1 Non PCR non-hospitalized visits and hospitalized visits. 46
47 Table 7c. Percentage of ED Visit Types by Transport (read vertically) Type of Visit Ambulance Self Other Unk All Percentage Primary Care Related 25.0% 45.7% 29.7% 37.2% 41.9% Percentage ED Care Needed, Not Prev. 10.4% 10.2% 7.4% 10.4% 10.2% Percentage Injury/BH/Unclass. 37.4% 33.0% 42.1% 30.3% 33.8% Percentage Hospitalized 27.2% 11.0% 20.8% 22.1% 14.1% Total 100.0% 100.0% 100.0% 100.0% 100.0% Figure 20. Transport by ED Visit Type (N = 24) 100% 90% 80% 70% 60% 50% 40% 30% 20% 10% 0% Percentage Hospitalized Percentage Injury/BH/Unclass. Percentage ED Care Needed, Not Prev. Percentage Primary Care Related 47
48 E. Health Conditions of Patients with ED Visits Categorized (primary and non primary care related) ED visits The most common discharge diagnoses of patients with PCRED visits for the last three years has been acute upper respiratory infection not otherwise specified. The frequency of visits with this diagnosis was higher in 2009 than in previous years (Table 8). Chest pain not otherwise specified was the leading diagnosis of non-pcred visits, and also increased in frequency in 2009 (Table 9). F. Behavioral Health Related ED Visits The percentage of behavioral health visits dropped from 8.3% in 2008 to 7.7% in The number of patients who were seen with an alcohol-related diagnosis and no other behavioral diagnosis nearly doubled in 2009 (1,079) compared to 2008 (585). The number of patients whose primary diagnosis was medical, but who had a secondary diagnosis of an alcohol problem, rose by about 50% (from 2,417 in 2008 to 3,689 in 2009) (Table 10a). 48
49 Table 8. Most Frequent Conditions of Patients with PCR ED Visits 2007 data 2008 visits 2009 visits 25 hospitals 25 hospitals 24 hospitals ICD COUNT Description icd COUNT Description ICD COUNT Description ,755 acute uri nos ,118 acute uri nos ,401 acute uri nos ,582 otitis media nos ,934 otitis media nos ,559 urin tract infection nos ,950 fever ,790 fever ,517 otitis media nos ,834 noninf gastroenterit nec ,652 acute pharyngitis ,450 abdmnal pain unspcf site ,023 urin tract infection nos ,249 noninf gastroenterit nec ,195 viral infection nos ,122 acute pharyngitis ,341 abdmnal pain unspcf site ,115 headache 486 9,897 pneumonia, organism nos 486 7,938 pneumonia, organism nos 462 9,868 acute pharyngitis ,933 headache ,674 asthma nos w(ac) exacerb ,462 vomiting alone ,559 abdmnal pain unspcf site ,109 pain in limb 486 7,767 pneumonia, organism nos ,526 asthma nos w(ac) exacerb ,063 vomiting alone ,490 noninf gastroenterit nec ,880 vomiting alone ,816 chest pain nec ,238 oth curr cond-antepartum ,718 cellulitis of leg ,815 cellulitis of leg 490 6,672 bronchitis nos ,420 hypertension nos ,436 lumbago ,617 asthma nos w(ac) exacerb ,274 acute bronchitis ,398 dizziness and giddiness ,982 chest pain nec ,962 chest pain nec ,317 oth curr cond-antepartum ,852 lumbago ,687 convulsions nec ,091 hypertension nos ,673 cellulitis of leg 490 5,571 bronchitis nos ,323 headache ,587 flu w resp manifest nec ,282 oth curr cond-antepartum 490 5,219 bronchitis nos ,572 pain in limb ,117 lumbago ,951 abdmnal pain oth spcf st ,533 acute bronchitis ,546 dizziness and giddiness ,746 urin tract infection nos ,402 hypertension nos ,502 viral infection nos ,565 convulsions nec ,374 dizziness and giddiness ,257 pain in limb ,323 painful respiration ,065 abdmnal pain oth spcf st ,829 painful respiration ,300 nausea with vomiting ,490 cough ,709 threaten abort-antepart ,255 threaten abort-antepart ,421 chest pain nos ,471 cellulitis of arm ,067 cough ,172 threaten abort-antepart 49
50 Table 9. Most frequent Conditions of Patients with Non PCR ED Visits 2007 data 2008 visits 2009 visits 25 hospitals 25 hospitals 24 hospitals ICD COUNT Description icd COUNT Description ICD COUNT Description ,623 chest pain nos ,635 chest pain nos ,225 chest pain nos ,794 chest pain nec ,607 calculus of ureter ,140 abdmnal pain unspcf site ,727 abdmnal pain unspcf site ,382 syncope and collapse ,024 calculus of ureter ,572 syncope and collapse ,338 chest pain nec ,807 chest pain nec ,402 fever ,113 abdmnal pain unspcf site ,719 syncope and collapse ,384 calculus of ureter ,876 fever ,498 abdmnal pain oth spcf st ,854 threaten abort-antepart ,442 abdmnal pain oth spcf st ,086 threaten abort-antepart ,789 calculus of kidney ,270 unkn cause morb/mort nec ,862 flu w resp manifest nec ,613 acute appendicitis nos ,242 shortness of breath ,813 vomiting alone ,600 abdmnal pain oth spcf st ,127 threaten abort-antepart ,659 headache ,474 vomiting alone ,911 atrial fibrillation ,531 cholelithiasis nos ,392 palpitations ,908 acute appendicitis nos ,504 acu brnchlts d/t oth org ,364 cholelithiasis nos ,684 dvrtcli colon w/o hmrhg ,495 atrial fibrillation ,356 acu brnchlts d/t oth org ,680 palpitations ,459 palpitations ,333 headache ,648 acu brnchlts d/t oth org ,452 calculus of kidney ,265 croup ,572 trans cereb ischemia nos ,331 dvrtcli colon w/o hmrhg ,244 trans cereb ischemia nos ,513 vomiting alone ,294 croup ,229 atrial fibrillation ,314 subendo infarct, initial ,265 shortness of breath ,225 acute pancreatitis ,298 gastrointest hemorr nos ,262 acute pancreatitis ,132 dvrtcli colon w/o hmrhg ,292 crbl art ocl nos w infrc ,256 viral infection nos V715 1,006 observ following rape ,261 hb-s disease with crisis ,226 gstr/ddnts nos w/o hmrhg gastrointest hemorr nos ,218 sciatica ,219 acute appendicitis nos gstr/ddnts nos w/o hmrhg V715 1,207 observ following rape V715 1,183 observ following rape hb-s disease with crisis ,142 respiratory abnorm nec ,159 gastrointest hemorr nos sciatica ,016 pain in limb ,105 sciatica 50
51 Table 10. Total Behavioral Health 1 Visits To Harris County Area Hospitals Frequency - Primary diagnosis and any other diagnosis 2008 (25) 2009 (24) Total Visits 2 899, ,395 Total Visits With Any Behavioral Health Diagnosis 74,672 73,383 Total Visits With No Behavioral Health Diagnosis 825, ,012 Total Visits With a Behavioral Health Diagnosis as the primary diagnosis 3 9,021 10,311 Total Visits With a Behavioral Health Diagnosis as both primary and any other diagnosis 3 9,134 8,211 Total Visits With a Behavioral Health Diagnosis as any other diagnosis 3,4 56,287 54,861 Percentage of First Row Total Visits 100.0% 100.0% Total Visits With Any Behavioral Health Diagnosis 8.3% 7.7% Total Visits With No Behavioral Health Diagnosis 91.7% 92.3% Total Visits With a Behavioral Health Diagnosis as the primary diagnosis 1.0% 1.1% Total Visits With a Behavioral Health Diagnosis as both primary and any other diagnosis 3 1.0% 0.9% Total Visits With a Behavioral Health Diagnosis as any other diagnosis 3,4 6.3% 5.8% Frequency - Primary and secondary diagnoses Total Visits With a Mental Health Diagnosis as the primary diag. & no secondary behavioral diag. 5 2,674 2,761 Total Visits With an Alcohol Related Diagnosis as the primary diag. & no secondary behavioral diag ,079 Total Visits With a Drug Related Diagnosis as the primary diag. & no secondary behavioral diag Total Visits With a medical diagnosis as the primary diag. & Mental Health as the secondary diag. 5 11,028 11,155 Total Visits With a medical diagnosis as the primary diag. & Alcohol Related as the secondary diag. 5 2,417 3,689 Total Visits With a medical diagnosis as the primary diag. & Drug Related as the secondary diag. 5 1,820 1,056 1 Behavioral Health = mental health, alcohol, or drug related. 2 Harris County, all diagnoses, all discharge dispositions. 3 Primary diagnosis = first ICD code. Any other diagnosis = ICD codes 2 through A medical diagnosis is the primary diagnosis. 5 Unlike above, secondary diagnosis in this case refers only to the second ICD code. Person may or may not have a secondary medical diagnosis. 51
52 G. Length of Stay in the ED The mean length of stay of ED visits (measured from time of admission to the ED to time of discharge from the ED) was calculated for visits of less than 24 hours each. Primary care related visits continue to last roughly half an hour less than all non-hospitalized visits (3.70 hours in 2009 vs hours in 2009). The length of stay for a hospitalized ED visit increased from 5.37 hours in 2007 to 6.84 hours in 2009 (Table 12). Non hospitalized behavioral health visits continue to last longer than non hospitalized medical visits (Table 11). H. Estimated Cost of Primary Care Related ED Visits Applying national estimates of the unit cost of ED visits to Houston ED visits suggests that the cost of PCRED visits in Houston hospitals increased from $187,310,573 in 2007 to $214,859,768 in 2009 (Table 13). The greatest potential cost savings from diverting PCRED visits would be among uninsured adults age 18 to 44 (Table 12 and 13, Figures 21and 22). This is based on the fact that PCRED visits of adults age 18 to 44 represented 36.8% of total PCRED visits the estimated savings among all persons in 2009 and uninsured adults accounted for 54.2% of the estimated cost of PCRED visits savings among the uninsured in 2009 (Tables 12 and 13). 1 1 Machlin, S.R. Trends in health care expenditures: 2006 versus Statistical Briefs # August Agency for Healthcare Research and Quality, Rockville, MD. Available at estimates were used for this report. These national estimates are based on all payer sources (e.g. insured and uninsured). They may not reflect actual hospital charges or procedures administered during treatment. Outpatient estimate may or may not cover both primary care and specialty care. MEPS estimates were adjusted for inflation to reflect 2007 to 2009 expenses. 52
53 Table 11. Hospitals in the Houston 911 Service Area. Mean length of stay (in hours) in the emergency department for visits of less than 24 hours. Residence Discharge status 2007 Mean (sd) 25 hospitals 2008 Mean (sd) 25 hospitals 2009 Mean (sd) 24 hospitals Harris County All Visits (4.18) 4.55 (4.20) 4.54 (4.27) Harris County Primary care 3.96 (3.57) 3.86 (3.65) 3.70 (3.49) related (4.08) 4.44 (4.10) 4.34 (4.04) Harris County All nonhospitalized 1 Harris County Other 1, (5.07) 5.91 (5.11) 6.84 (5.83) Harris County Harris County Non-hospitalized medical (3.95) 4.48 (4.09) 4.28 (3.94) Non-hospitalized 6.05 (4.75) 5.52 (4.64) 6.01 (5.02) behavioral 3 1 All diagnoses 2 Admitted, transferred to another facility, etc. 3 Medical or behavioral as the primary discharge diagnosis. 53
54 Table 12. Estimated costs of primary care related emergency room visits, estimated costs of treating those same patients in an outpatient setting all payer sources 1 Age Group Prim. Care Visits Estimated national ED cost per visit 2007 (24 hospitals) Est. ED cost Estimated national outpt. cost per visit Est. Outpt cost Difference 17 and under 138,639 $529 $73,367,547 $140 $19,464,859 $53,902, to ,623 $689 $94,828,021 $194 $26,753,987 $68,074, to 64 63,850 $1,023 $65,302,817 $224 $14,274,217 $51,028, and over 28,122 $703 $19,772,227 $194 $5,466,975 $14,305,252 Total Primary Care Visits 368,234 na 2 $253,270,611 na 2 $65,960,038 $187,310, (24 hospitals) 17 and under 118,936 $541 $64,397,681 $144 $17,085,099 $47,312, to ,347 $705 $84,843,269 $199 $23,936,973 $60,906, to 64 58,343 $1,046 $61,052,356 $229 $13,345,130 $47,707, and over 25,411 $719 $18,279,868 $199 $5,054,341 $13,225,527 Total Primary Care Visits 323,037 na 2 $228,573,174 na 2 $59,421,542 $169,151, (24 hospitals) 17 and under 142,210 $568 $80,832,363 $151 $21,445,321 $59,387, to ,674 $740 $110,030,654 $209 $31,043,131 $78,987, to 64 69,914 $1,099 $76,801,513 $240 $16,787,659 $60,013, and over 30,147 $755 $22,766,132 $209 $6,294,783 $16,471,349 Total Primary Care Visits 390,945 na 2 $290,430,662 na 2 $75,570,894 $214,859, Machlin, S.R. Trends in health care expenditures: 2006 versus Statistical Briefs # August Agency for Healthcare Research and Quality, Rockville, MD. Available at estimates were used for this report. These national estimates are based on all payer sources (e.g. insured and uninsured). They may not reflect actual hospital charges or procedures administered during treatment. Outpatient estimate may or may not cover both primary care and specialty care. MEPS estimates were adjusted for inflation to reflect 2007 to 2009 expenses. 2 MEPS estimates were only created for specific age groups. 54
55 Figure 21. Estimated savings for treating all PCRED visits in an outpatient setting all payer sources (final column of previous table) $90,000,000 $80,000,000 $70,000,000 $60,000,000 $50,000,000 $40,000,000 $30,000,000 $20,000,000 $10,000,000 $ and under 18 to to and over 55
56 Table 13. Estimated costs of primary care related emergency room visits, estimated costs of treating those same patients in an outpatient setting uninsured only 1 Estimated national ED cost per visit 2007 (24 hospitals) Estimated national outpt. cost per visit Est. Outpt cost Difference Age Group Prim. Care Visits Est. ED cost 17 and under 24,289 $529 $12,853,797 $140 $3,410,191 $9,443, to 44 70,363 $689 $48,482,984 $194 $13,678,585 $34,804, to 64 23,761 $1,023 $24,301,350 $224 $5,311,911 $18,989, and over 1,437 $703 $1,010,235 $194 $279,328 $730,907 Total Primary Care Visits 119,850 na 2 $86,648,365 na 2 $22,680,014 $63,968, (24 hospitals) 17 and under 19,168 $541 $10,378,779 $144 $2,753,554 $7,625, to 44 60,691 $705 $42,786,562 $199 $12,071,444 $30,715, to 64 22,296 $1,046 $23,331,535 $229 $5,099,924 $18,231, and over 1,634 $719 $1,175,146 $199 $324,925 $850,220 Total Primary Care Visits 103,789 na 2 $77,672,021 na 2 $20,249,846 $57,422, (24 hospitals) 17 and under 24,221 $568 $13,767,256 $151 $3,652,537 $10,114, to 44 76,425 $740 $56,560,747 $209 $15,957,578 $40,603, to 64 27,009 $1,099 $29,669,421 $240 $6,485,291 $23,184, and over 1,779 $755 $1,343,279 $209 $371,413 $971,865 Total Primary Care Visits 129,434 na 2 $101,340,703 na 2 $26,466,819 $74,873, Machlin, S.R. Trends in health care expenditures: 2006 versus Statistical Briefs # August Agency for Healthcare Research and Quality, Rockville, MD. Available at estimates were used for this report. These national estimates are based on all payer sources (e.g. insured and uninsured). They may not reflect actual hospital charges or procedures administered during treatment. Outpatient estimate may or may not cover both primary care and specialty care. MEPS estimates were adjusted for inflation to reflect 2008 expenses. 2 MEPS estimates were only created for specific age groups. 56
57 Figure 22. Estimated savings for treating all PCRED visits in an outpatient setting uninsured (final column of previous table) $45,000,000 $40,000,000 $35,000,000 $30,000,000 $25,000,000 $20,000,000 $15,000,000 $10,000,000 $5,000,000 $ and under 18 to to and over 57
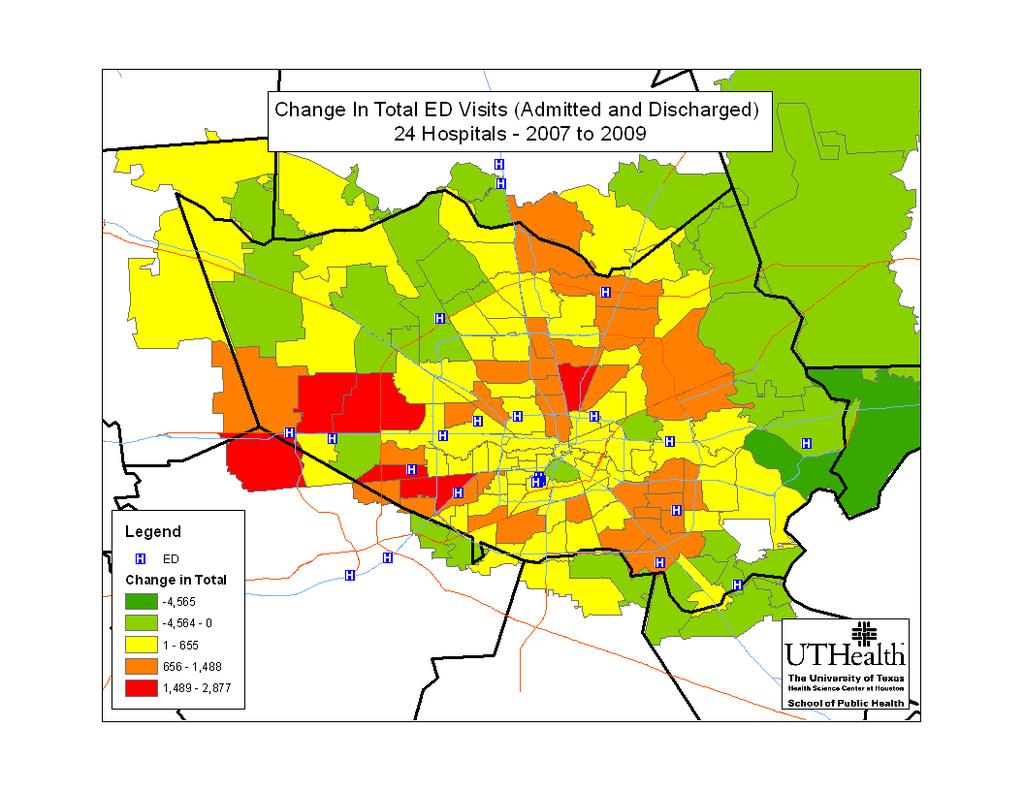
58 I. Geographic Distribution of Patients with ED Visits The following ZIP code clusters had the highest number of ED visits: 1) the intersection of Highway 59 and the North Loop East; 2) the Ship Channel and the area along Interstate 10 and the East Belt; 3) an area just east of Highway 288 and on both sides of the South Loop; 4) an area along the Southwest Freeway and between the West Loop and West Belt; 5) the intersection of Interstate 10 and Highway 6; and 6) an area along Highway 290 and just outside the North Loop West (Map 1a). Clusters 1, 4, and 5 had the biggest increases from 2007 to 2009 (Map 1b). The geographic distribution of PCRED visits by the insured and uninsured was similar to that of ED visits (Maps 2a and 3a). An area between the North Loop and the North Belt had the biggest increase in PCRED visits by the insured and uninsured (area shaded in orange) compared to the increase by the uninsured (area shaded in yellow). (Maps 2b and 3b). The areas with the highest rates of ED visits, PCRED visits by all, and PCRED visits by the uninsured were the East/Northeast and South Central areas of Harris County (Map 4). The population rates of PCRED visits for all and the uninsured, were lowest in the Baytown area (Maps 4, 5, and 6). 58
59 Map 1a 59
60 Map 1b 60
HOUSTON HOSPITALS EMERGENCY DEPARTMENT USE STUDY. January 1, 2007 through December 31, 2007 FINAL REPORT. Prepared By
 HOUSTON HOSPITALS EMERGENCY DEPARTMENT USE STUDY January 1, 2007 through December 31, 2007 FINAL REPORT Prepared By School of Public Health University of Texas Health Science Center at Houston Charles
Issue Brief From The University of Memphis Methodist Le Bonheur Center for Healthcare Economics
 Issue Brief From The University of Memphis Methodist Le Bonheur Center for Healthcare Economics August 4, 2011 Non-Urgent ED Use in Tennessee, 2008 Cyril F. Chang, Rebecca A. Pope and Gregory G. Lubiani,
Demographic Profile of the Active-Duty Warrant Officer Corps September 2008 Snapshot
 Issue Paper #44 Implementation & Accountability MLDC Research Areas Definition of Diversity Legal Implications Outreach & Recruiting Leadership & Training Branching & Assignments Promotion Retention Implementation
Demographic Profile of the Officer, Enlisted, and Warrant Officer Populations of the National Guard September 2008 Snapshot
 Issue Paper #55 National Guard & Reserve MLDC Research Areas Definition of Diversity Legal Implications Outreach & Recruiting Leadership & Training Branching & Assignments Promotion Retention Implementation
2016 Survey of Michigan Nurses
 2016 Survey of Michigan Nurses Survey Summary Report November 15, 2016 Office of Nursing Policy Michigan Department of Health and Human Services Prepared by the Michigan Public Health Institute Table of
Issue Brief. Non-urgent Emergency Department Use in Shelby County, Tennessee, May August 2012
 Issue Brief May 2011 Non-urgent Emergency Department Use in Shelby County, Tennessee, 2009 Cyril F. Chang, Ph.D. Professor of Economics and Director of Methodist Le Bonheur Center for Healthcare Economics
June 25, Shamis Mohamoud, David Idala, Parker James, Laura Humber. AcademyHealth Annual Research Meeting
 Evaluation of the Maryland Health Home Program for Medicaid Enrollees with Severe Mental Illnesses or Opioid Substance Use Disorder and Risk of Additional Chronic Conditions June 25, 2018 Shamis Mohamoud,
CER Module ACCESS TO CARE January 14, AM 12:30 PM
 CER Module ACCESS TO CARE January 14, 2014. 830 AM 12:30 PM Topics 1. Definition, Model & equity of Access Ron Andersen (8:30 10:30) 2. Effectiveness, Efficiency & future of Access Martin Shapiro (10:30
Licensed Nurses in Florida: Trends and Longitudinal Analysis
 Licensed Nurses in Florida: 2007-2009 Trends and Longitudinal Analysis March 2009 Addressing Nurse Workforce Issues for the Health of Florida www.flcenterfornursing.org March 2009 2007-2009 Licensure Trends
Chapter VII. Health Data Warehouse
 Broward County Health Plan Chapter VII Health Data Warehouse CHAPTER VII: THE HEALTH DATA WAREHOUSE Table of Contents INTRODUCTION... 3 ICD-9-CM to ICD-10-CM TRANSITION... 3 PREVENTION QUALITY INDICATORS...
Officer Retention Rates Across the Services by Gender and Race/Ethnicity
 Issue Paper #24 Retention Officer Retention Rates Across the Services by Gender and Race/Ethnicity MLDC Research Areas Definition of Diversity Legal Implications Outreach & Recruiting Leadership & Training
Suicide Among Veterans and Other Americans Office of Suicide Prevention
 Suicide Among Veterans and Other Americans 21 214 Office of Suicide Prevention 3 August 216 Contents I. Introduction... 3 II. Executive Summary... 4 III. Background... 5 IV. Methodology... 5 V. Results
Reenlistment Rates Across the Services by Gender and Race/Ethnicity
 Issue Paper #31 Retention Reenlistment Rates Across the Services by Gender and Race/Ethnicity MLDC Research Areas Definition of Diversity Legal Implications Outreach & Recruiting Leadership & Training
Appendix A Registered Nurse Nonresponse Analyses and Sample Weighting
 Appendix A Registered Nurse Nonresponse Analyses and Sample Weighting A formal nonresponse bias analysis was conducted following the close of the survey. Although response rates are a valuable indicator
Hospital Discharge Data, 2005 From The University of Memphis Methodist Le Bonheur Center for Healthcare Economics
 Hospital Discharge Data, 2005 From The University of Memphis Methodist Le Bonheur Center for Healthcare Economics August 22, 2008 Potentially Avoidable Pediatric Hospitalizations in Tennessee, 2005 Cyril
Minnesota s Registered Nurse Workforce
 Minnesota s Registered Nurse Workforce 2015-2016 HIGHLIGHTS FROM THE 2015-2016 RN WORKFORCE SURVEYi Overall Registered nurses, the largest segment of the health care workforce, deliver primary and specialty
Community Health Needs Assessment for Corning Hospital: Schuyler, NY and Steuben, NY:
 Community Health Needs Assessment for Corning Hospital: Schuyler, NY and Steuben, NY: November 2012 Approved February 20, 2013 One Guthrie Square Sayre, PA 18840 www.guthrie.org Page 1 of 18 Table of Contents
The Prior Service Recruiting Pool for National Guard and Reserve Selected Reserve (SelRes) Enlisted Personnel
 Enlisted Personnel") Issue Paper #61 National Guard & Reserve MLDC Research Areas The Prior Service Recruiting Pool for National Guard and Reserve Selected Reserve (SelRes) Enlisted Personnel Definition of Diversity Legal
Issue Paper #61 National Guard & Reserve MLDC Research Areas The Prior Service Recruiting Pool for National Guard and Reserve Selected Reserve (SelRes) Enlisted Personnel Definition of Diversity Legal
DoDEA Seniors Postsecondary Plans and Scholarships SY
 DoDEA Seniors Postsecondary Plans and Scholarships SY 2011 12 Department of Defense Education Activity (DoDEA) Research and Evaluation Branch Ashley Griffin, PhD D e p a r t m e n t o f D e f e n s e E
Final Report No. 101 April Trends in Skilled Nursing Facility and Swing Bed Use in Rural Areas Following the Medicare Modernization Act of 2003
 Final Report No. 101 April 2011 Trends in Skilled Nursing Facility and Swing Bed Use in Rural Areas Following the Medicare Modernization Act of 2003 The North Carolina Rural Health Research & Policy Analysis
E-BULLETIN Edition 11 UNINTENTIONAL (ACCIDENTAL) HOSPITAL-TREATED INJURY VICTORIA
 HOSPITAL-TREATED INJURY VICTORIA") E-BULLETIN Edition 11 March 2015 UNINTENTIONAL (ACCIDENTAL) HOSPITAL-TREATED INJURY VICTORIA 2013/14 Tharanga Fernando Angela Clapperton 1 Suggested citation VISU: Fernando T, Clapperton A (2015). Unintentional
E-BULLETIN Edition 11 March 2015 UNINTENTIONAL (ACCIDENTAL) HOSPITAL-TREATED INJURY VICTORIA 2013/14 Tharanga Fernando Angela Clapperton 1 Suggested citation VISU: Fernando T, Clapperton A (2015). Unintentional
Carolinas Collaborative Data Dictionary
 Overview Carolinas Collaborative Data Dictionary This data dictionary is intended to be a guide of the readily available, harmonized data in the Carolinas Collaborative Common Data Model via i2b2/shrine.
Fleet and Marine Corps Health Risk Assessment, 02 January December 31, 2015
 Fleet and Marine Corps Health Risk Assessment, 02 January December 31, 2015 Executive Summary The Fleet and Marine Corps Health Risk Appraisal is a 22-question anonymous self-assessment of the most common
COMMUNITY DEVELOPMENT BLOCK GRANT PROGRAM YEAR 2016/17
 COMMUNITY DEVELOPMENT BLOCK GRANT PROGRAM YEAR 2016/17 ANNUAL REPORT CDBG subrecipients, please fill in the following tables and answer questions as completely as possible. Submit this report to the City
Potentially Avoidable Hospitalizations in Tennessee, Final Report. May 2006
 The Methodist LeBonheur Center for Healthcare Economics 312 Fogelman College of Business & Economics Memphis, Tennessee 38152-3120 Office: 901.678.3565 Fax: 901.678.2865 Potentially Avoidable Hospitalizations
Minnesota s Registered Nurse Workforce
 Minnesota s Registered Nurse Workforce 2013-2014 HIGHLIGHTS FROM THE 2013-2014 RN WORKFORCE SURVEY i Overall Registered nurses are the largest segment of the health care workforce delivering primary and
2017 SPECIALTY REPORT ANNUAL REPORT
 2017 SPECIALTY REPORT ANNUAL REPORT National Commission on Certification of Physician Assistants Table of Contents Message from the President... 3 About the Data Collection and Methodology...4 All Specialties....
New Facts and Figures on Hospice Care in America
 New Facts and Figures on Hospice Care in America NHPCO has just released the 2010 edition of NHPCO Facts and Figures: Hospice Care in America. Through an easy-to-read narrative that is written for the
South Carolina Rural Health Research Center. Findings Brief April, 2018
 South Carolina Health Research Center Findings Brief April, 2018 Kevin J. Bennett, PhD Karen M. Jones, MSPH Janice C. Probst, PhD. Health Care Utilization Patterns of Medicaid Recipients, 2012, 35 States
North Carolina Emergency Department Visit Data - Data Dictionary FY2012 Alphabetic List of Variables and Attributes Standard Research File
 North Carolina Emergency Department Visit Data - Data Dictionary FY2012 Alphabetic List of Variables and Attributes Standard Research File One of these three variables must be suppressed (diag1, fac, or
North Carolina Ambulatory Surgery Visit Data - Data Dictionary FY2011 Alphabetic List of Variables and Attributes Standard Research File
 North Carolina Ambulatory Surgery Visit Data - Data Dictionary FY2011 Alphabetic List of Variables and Attributes Standard Research File One of these three variables must be suppressed (Diag1, fac, ptzip)
American Academy of Ophthalmology IRIS Registry (Intelligent Research in Sight) Analytics Data Dictionary
 Analytics Data Dictionary") 7/25/2017 American Academy of Ophthalmology IRIS Registry (Intelligent Research in Sight) Analytics Data Dictionary Disclaimer: This data dictionary covers the data elements found within the American Academy
7/25/2017 American Academy of Ophthalmology IRIS Registry (Intelligent Research in Sight) Analytics Data Dictionary Disclaimer: This data dictionary covers the data elements found within the American Academy
ALL MENTAL HEALTH AND SUBSTANCE USE DISORDER PROGRAMS MUST INCLUDE PSYCHOSOCIAL AND PSYCHIATRIC EVALUATIONS
 COUNTY of NASSAU DEPARTMENT OF HUMAN SERVICES Office of Mental Health, Chemical Dependency and Developmental Disabilities Services 60 Charles Lindbergh Boulevard, Suite 200, Uniondale, New York 11553-3687
Access to Psychiatric Inpatient Care: Prolonged Waiting Periods in Medical Emergency Departments. Data Report for
 Access to Psychiatric Inpatient Care: Prolonged Waiting Periods in Medical Emergency Departments Data Report for 2012-2014 Prepared by: Jennifer D. Dudek, MPH 150 North 18 th Avenue, Suite 320 Phoenix,
Public Policy Forum Impact of Emergency Department Use on the Health Care System in Maryland
 Public Policy Forum Impact of Emergency Department Use on the Health Care System in Maryland Pamela W. Barclay Director, Center for Hospital Services Maryland Health Care Commission University of Maryland
Minnesota s Physical Therapist Assistant Workforce, 2015
 Minnesota s Physical Therapist Assistant Workforce, 2015 HIGHLIGHTS FROM THE 2015 PHYSICAL THERAPIST ASSISTANT WORKFORCE SURVEY i Overall According to the Minnesota Board of Physical Therapy, as of April
Findings Brief. NC Rural Health Research Program
 Safety Net Clinics Serving the Elderly in Rural Areas: Rural Health Clinic Patients Compared to Federally Qualified Health Center Patients BACKGROUND Andrea D. Radford, DrPH; Victoria A. Freeman, RN, DrPH;
Industry Market Research release date: November 2016 ALL US [238220] Plumbing, Heating, and Air-Conditioning Contractors Sector: Construction
![Industry Market Research release date: November 2016 ALL US [238220] Plumbing, Heating, and Air-Conditioning Contractors Sector: Construction](/thumbs/80/81994465.jpg "Industry Market Research release date: November 2016 ALL US [238220] Plumbing, Heating, and Air-Conditioning Contractors Sector: Construction") Industry Market Research release date: November 2016 ALL US [238220] Plumbing, Heating, and Air-Conditioning Contractors Sector: Construction Contents P1: Industry Population, Time Series P2: Cessation
Industry Market Research release date: November 2016 ALL US [238220] Plumbing, Heating, and Air-Conditioning Contractors Sector: Construction Contents P1: Industry Population, Time Series P2: Cessation
MEDICARE ENROLLMENT, HEALTH STATUS, SERVICE USE AND PAYMENT DATA FOR AMERICAN INDIANS & ALASKA NATIVES
 American Indian & Alaska Native Data Project of the Centers for Medicare and Medicaid Services Tribal Technical Advisory Group MEDICARE ENROLLMENT, HEALTH STATUS, SERVICE USE AND PAYMENT DATA FOR AMERICAN
Q4 & Annual 2017 HIGHER EDUCATION. Employment Report. Published by
 Q4 & Annual 2017 HIGHER EDUCATION Employment Report Published by ACE FELLOWS ENHANCE AND ADVANCE FELLOWS PROGRAM American Council on Education HIGHER EDUCATION. With over five decades of success, the ACE
HIDD 101 HOSPITAL INPATIENT AND DISCHARGE DATA IN NEW MEXICO
 HIDD 101 HOSPITAL INPATIENT AND DISCHARGE DATA IN NEW MEXICO Health Information System Act (24-14A-1, et seq. NMSA 1978) Provides authority for the Department of Health to collect health data. NMDOH had
California Community Clinics
 California Community Clinics A Financial and Operational Profile, 2008 2011 Prepared by Sponsored by Blue Shield of California Foundation and The California HealthCare Foundation TABLE OF CONTENTS Introduction
Colorado Community College System ACADEMIC YEAR NEED-BASED FINANCIAL AID APPLICANT DEMOGRAPHICS BASED ON 9 MONTH EFC
 Colorado Community College System ACADEMIC YEAR 2011-2012 NEED-BASED FINANCIAL AID APPLICANT DEMOGRAPHICS BASED ON 9 MONTH EFC SEPTEMBER 2013 1 2011-2012 Aid Recipients and Applicants For academic year
Patient survey report 2004
 Inspecting Informing Improving Patient survey report 2004 Mental health survey 2004 Avon and Wiltshire Mental Health Partnership NHS Trust The mental health service user survey was designed, developed
Memorial Hermann Health System Memorial Hermann Surgical Hospital - Kingwood Community Benefits Strategic Implementation Plan 2016
 Memorial Hermann Health System Memorial Hermann Surgical Hospital - Kingwood Community Benefits Strategic Implementation Plan 2016 September 20, 2016 TABLE OF CONTENTS Introduction... 3 Memorial Hermann
Colorado s Health Care Safety Net
 PRIMER Colorado s Health Care Safety Net The same is true for Colorado s health care safety net, the network of clinics and providers that care for the most vulnerable residents. The state s safety net
Outcomes for Iowa Medicaid Chronic Condition Health Home Program Enrollees. Policy Report. SFYs February 2017
 Policy Report February 2017 Outcomes for Iowa Medicaid Chronic Condition Health Home Program Enrollees Ss 2012-2015 Elizabeth Momany Assistant Director, Health Policy Research Program* Associate Research
Population Representation in the Military Services
 Population Representation in the Military Services Fiscal Year 2008 Report Summary Prepared by CNA for OUSD (Accession Policy) Population Representation in the Military Services Fiscal Year 2008 Report
2015 Hospital Inpatient Discharge Data Annual Report
 2015 Hospital Inpatient Discharge Data Annual Report Health Systems Epidemiology Program Epidemiology and Response Division New Mexico Department of Health 2015 Hospital Inpatient Discharge Data Report
Administrative Billing Data
 Administrative Billing Data Patient Identification and Demographic Information: From UB-04 Data or Medical Record Face Sheet. Note: When you go to enter data on this case, the information below will already
Center for State Health Policy
 Center for State Health Policy A Unit of the Institute for Health, Health Care Policy and Aging Research Opportunities for Better Care and Lower Cost: Data Book on Hospital Utilization and Cost in Camden
Florida Licensed Practical Nurse Education: Academic Year
 # of LPN Programs Florida Licensed Practical Nurse Education: Academic Year 2016-2017 This report presents key findings regarding the Licensed Practical Nursing education system in Florida for Academic
Total Cost of Care Technical Appendix April 2015
 Total Cost of Care Technical Appendix April 2015 This technical appendix supplements the Spring 2015 adult and pediatric Clinic Comparison Reports released by the Oregon Health Care Quality Corporation
Survey of Nurses 2015
 Survey of Nurses 2015 Prepared by Public Sector Consultants Inc. Lansing, Michigan www.pscinc.com There are an estimated... 104,351 &17,559 LPNs RNs onehundredfourteenthousdfourhundredtwentyregisterednursesactiveinmichigan
Appendix: Data Sources and Methodology
 Appendix: Data Sources and Methodology This document explains the data sources and methodology used in Patterns of Emergency Department Utilization in New York City, 2008 and in an accompanying issue brief,
Mental Health Services Provided in Specialty Mental Health Organizations, 2004
 Mental Health Services Provided in Specialty Mental Health Organizations, 2004 Mental Health Services Provided in Specialty Mental Health Organizations, 2004 U.S. Department of Health and Human Services
Analysis of Career and Technical Education (CTE) In SDP:
 In SDP:") Analysis of Career and Technical Education (CTE) In SDP: 2012-2013 9 th Graders That Participated in CTE, With Comparisons to Those That Did Not November 2017 Contact: Theodore Wills, Senior Research Associate
Analysis of Career and Technical Education (CTE) In SDP: 2012-2013 9 th Graders That Participated in CTE, With Comparisons to Those That Did Not November 2017 Contact: Theodore Wills, Senior Research Associate
2016 Hospital Inpatient Discharge Data Annual Report
 2016 Hospital Inpatient Discharge Data Annual Report Health Systems Epidemiology Program Epidemiology and Response Division New Mexico Department of Health 2016 Hospital Inpatient Discharge Data Report
BARNES-JEWISH HOSPITAL 2016 COMMUNITY HEALTH NEEDS ASSESSMENT & IMPLEMENTATION PLAN
 BARNES-JEWISH HOSPITAL 2016 COMMUNITY HEALTH NEEDS ASSESSMENT & IMPLEMENTATION PLAN 1 TABLE OF CONTENTS Executive Summary... 3 Community Description... 4 Geography... 4 Population Trends... 5 Income...
Minnesota s Physician Workforce, 2015
 Minnesota s Physician Workforce, 2015 HIGHLIGHTS FROM THE 2015 PHYSICIAN WORKFORCE SURVEY i Overall According to the Minnesota Board of Medical Practice, as of November 2015, there were 22,353 actively
2013 Workplace and Equal Opportunity Survey of Active Duty Members. Nonresponse Bias Analysis Report
 2013 Workplace and Equal Opportunity Survey of Active Duty Members Nonresponse Bias Analysis Report Additional copies of this report may be obtained from: Defense Technical Information Center ATTN: DTIC-BRR
Cardinal Innovations Healthcare 2017 Needs and Gaps Analysis
 2017 Community Mental Health, Substance Use and Developmental Disabilities Services Needs and Gaps Analysis for the Triad Region (Formerly known as CenterPoint Human Services) This study assesses the community
Minnesota State Colleges & Universities Fact Book
 Minnesota State & Fact Book Student and Graduate Follow-up Data Office of the Chancellor Academic and Student Affairs Division Research, Planning and Academic Programs December 2004 Minnesota State &
Harris County Community Assessment
 Harris County Community Assessment 2004 Harris County Hospital District Community Assessment 2004 I. Summary 2 II. Presentation of Data 7 III. Harris County Community Health Survey 47 a. Survey 48 b. Overall
Inspecting Informing Improving. Patient survey report Mental health survey 2005 Humber Mental Health Teaching NHS Trust
 Inspecting Informing Improving Patient survey report 2005 Mental health survey 2005 The Mental Health Survey 2005 was designed, developed and coordinated by the NHS Surveys Advice Centre at Picker Institute
Higher Education Employment Report
 Higher Education Employment Report Second Quarter 2017 / Published December 2017 Executive Summary The number of jobs in higher education increased 0.8 percent, or 29,900 jobs, during the second quarter
Racial disparities in ED triage assessments and wait times
 Racial disparities in ED triage assessments and wait times Jordan Bleth, James Beal PhD, Abe Sahmoun PhD June 2, 2017 Outline Background Purpose Methods Results Discussion Limitations Future areas of study
2016 FULL GRANTMAKER SALARY AND BENEFITS REPORT
 206 FULL GRANTMAKER SALARY AND BENEFITS REPORT June 207 An active philanthropic network, the Council on Foundations (www.cof.org), founded in 949, is a nonprofit leadership association of grantmaking foundations
Community Health Needs Assessment July 2015
 Community Health Needs Assessment July 2015 1 Executive Summary UNM Hospitals is committed to meeting the healthcare needs of our community. As a part of this commitment, UNM Hospitals has attended forums
National Hospice and Palliative Care OrganizatioN. Facts AND Figures. Hospice Care in America. NHPCO Facts & Figures edition
 National Hospice and Palliative Care OrganizatioN Facts AND Figures Hospice Care in America 2017 Edition NHPCO Facts & Figures - 2017 edition Table of Contents 2 Introduction 2 About this report 2 What
Analysis and Use of UDS Data
 Analysis and Use of UDS Data Welcome and thanks for dropping by to learn about how to analyze and use the valuable UDS data you are reporting! Please click START to begin. Welcome If you have attended
Facility Survey of Providers of ESRD Therapy. Number of Dialysis and Transplant Units 1989 and Number of Units ,660 2,421 1,669
 Annual Data Report Facility Survey of Providers of ESRD Therapy Chapter X Annual Facility Survey of Providers of ESRD Therapy T he Annual Facility Survey conducted, by HCFA, is the source of all the results
Analysis of VA Health Care Utilization Among US Global War on Terrorism (GWOT) Veterans
 Veterans") Analysis of VA Health Care Utilization Among US Global War on Terrorism (GWOT) Veterans Operation Enduring Freedom Operation Iraqi Freedom VHA Office of Public Health and Environmental Hazards May 2008
Analysis of VA Health Care Utilization Among US Global War on Terrorism (GWOT) Veterans Operation Enduring Freedom Operation Iraqi Freedom VHA Office of Public Health and Environmental Hazards May 2008
Analysis of VA Health Care Utilization among Operation Enduring Freedom (OEF), Operation Iraqi Freedom (OIF), and Operation New Dawn (OND) Veterans
, Operation Iraqi Freedom (OIF), and Operation New Dawn (OND) Veterans") Analysis of VA Health Care Utilization among Operation Enduring Freedom (OEF), Operation Iraqi Freedom (OIF), and Operation New Dawn (OND) Veterans Cumulative from 1 st Qtr FY 2002 through 1 st Qtr FY
Analysis of VA Health Care Utilization among Operation Enduring Freedom (OEF), Operation Iraqi Freedom (OIF), and Operation New Dawn (OND) Veterans Cumulative from 1 st Qtr FY 2002 through 1 st Qtr FY
Navy and Marine Corps Public Health Center. Fleet and Marine Corps Health Risk Assessment 2013 Prepared 2014
 Navy and Marine Corps Public Health Center Fleet and Marine Corps Health Risk Assessment 2013 Prepared 2014 The enclosed report discusses and analyzes the data from almost 200,000 health risk assessments
NCPC Specialist Palliative Care Workforce Survey. SPC Longitudinal Survey of English Cancer Networks
 NCPC Specialist Palliative Care Workforce Survey SPC Longitudinal Survey of English Cancer Networks 3 November 211 West Hall Parvis Road West Byfleet Surrey KT14 6EZ UK T +44 ()1932 337 Contents Contents...
Dobson DaVanzo & Associates, LLC Vienna, VA
 Analysis of Patient Characteristics among Medicare Recipients of Separately Billable Part B Drugs from 340B DSH Hospitals and Non-340B Hospitals and Physician Offices Dobson DaVanzo & Associates, LLC Vienna,
Scottish Hospital Standardised Mortality Ratio (HSMR)
") ` 2016 Scottish Hospital Standardised Mortality Ratio (HSMR) Methodology & Specification Document Page 1 of 14 Document Control Version 0.1 Date Issued July 2016 Author(s) Quality Indicators Team Comments
` 2016 Scottish Hospital Standardised Mortality Ratio (HSMR) Methodology & Specification Document Page 1 of 14 Document Control Version 0.1 Date Issued July 2016 Author(s) Quality Indicators Team Comments
Health Indicators. for the Dallas/Fort Worth Combined Metropolitan Statistical Area Brad Walsh and Sue Pickens Owens
 Health Indicators Our Community Health for the Dallas/ Fort Worth Combined Metropolitan Statistical Area Checkup 2007 for the Dallas/Fort Worth Combined Metropolitan Statistical Area Brad Walsh and Sue
Houston Area Collaborative Perinatal Program
 Houston Area Collaborative Perinatal Program Olinda Johnson, PhD, RNC, CNS, Melissa Smith Dover, BSN, RN, IBCLC, Vicki Christie, RN, Deborah Lopez, BSN, RN HACPP The Houston Area Collaborative Perinatal
2016 National NHS staff survey. Results from Surrey And Sussex Healthcare NHS Trust
 2016 National NHS staff survey Results from Surrey And Sussex Healthcare NHS Trust Table of Contents 1: Introduction to this report 3 2: Overall indicator of staff engagement for Surrey And Sussex Healthcare
Evaluation of Health Care Homes:
 Division of Health Policy PO Box 64882 St. Paul, MN 55164-0882 651-201-3626 www.health.state.mn.us Evaluation of Health Care Homes: 2010-2012 Minnesota Department of Health Minnesota Department of Human
Connecting Inpatient and Residential Treatment to Systems of Care
 0th Annual RTC Conference Presented in Tampa, March 007 Connecting Inpatient and Residential Treatment to Systems of Care Mary Armstrong, Ph.D., Norín Dollard, Ph.D., Stephanie Romney, Ph.D., Keren S.
Dual Eligibles: Medicaid s Role in Filling Medicare s Gaps
 I S S U E P A P E R kaiser commission on medicaid and the uninsured March 2004 Dual Eligibles: Medicaid s Role in Filling Medicare s Gaps In 2000, over 7 million people were dual eligibles, low-income
Physician Workforce Fact Sheet 2016
 Introduction It is important to fully understand the characteristics of the physician workforce as they serve as the backbone of the system. Supply data on the physician workforce are routinely collected
INPATIENT/COMPREHENSIVE REHAB AUDIT DICTIONARY
 Revised 11/04/2016 Audit # Location Audit Message Audit Description Audit Severity 784 DATE Audits are current as of 11/04/2016 The date of the last audit update Information 1 COUNTS Total Records Submitted
Quantitative Component Year One Report: Medicaid Enrollee Characteristics, Service Utilization, Costs, and Access to Care in AHCA Areas 4 and 6
 University of South Florida Scholar Commons Mental Health Law & Policy Faculty Publications Mental Health Law & Policy 1998 Quantitative Component Year One Report: Medicaid Enrollee Characteristics, Service
Colorado Community College System ACADEMIC YEAR NEED-BASED FINANCIAL AID APPLICANT DEMOGRAPHICS BASED ON 9 MONTH EFC
 Colorado Community College System ACADEMIC YEAR 2010-2011 NEED-BASED FINANCIAL AID APPLICANT DEMOGRAPHICS BASED ON 9 MONTH EFC SEPTEMBER 2013 1 2010-2011 Aid Recipients and Applicants For the academic
Patients Experience of Emergency Admission and Discharge Seven Days a Week
 Patients Experience of Emergency Admission and Discharge Seven Days a Week Abstract Purpose: Data from the 2014 Adult Inpatients Survey of acute trusts in England was analysed to review the consistency
ADDING A PRACTITIONER FORM
 This form is applicable for Medicaid AND Passport Advantage provider networks. YOU ONLY NEED TO SUBMIT THIS FORM ONE (1) TIME. ADVANTAGE (HMO SNP) ADDING A PRACTITIONER FORM Must complete entire form for
Baseline and 9-Month Follow-Up Outcomes of Health Care for Iowa Medicaid Health Home Program Enrollees
 Health Policy 11-1-2013 Baseline and 9-Month Follow-Up Outcomes of Health Care for Iowa Medicaid Health Home Program Enrollees Elizabeth T. Momany University of Iowa Peter C. Damiano University of Iowa
Q HIGHER EDUCATION. Employment Report. Published by
 Q1 2018 HIGHER EDUCATION Employment Report Published by ACE FELLOWS ENHANCE AND ADVANCE HIGHER EDUCATION. American Council on Education FELLOWS PROGRAM With over five decades of success, the American Council
Community Health Centers: Growing Importance in a Changing Health Care System
 March 2018 Issue Brief Community Health Centers: Growing Importance in a Changing Health Care System Sara Rosenbaum, Jennifer Tolbert, Jessica Sharac, Peter Shin, Rachel Gunsalus, Julia Zur Executive Summary
Manatee County Rural Healthcare Services ER Diversion Program. Manatee ER Diversion (Fusco)
") Manatee County Rural Healthcare Services ER Diversion Program 1 Recognition of the problem Data from HMOs and Medipass (Phytrust/Access) showed increased ER utilization by our patients during reduced hours
Manatee County Rural Healthcare Services ER Diversion Program 1 Recognition of the problem Data from HMOs and Medipass (Phytrust/Access) showed increased ER utilization by our patients during reduced hours
Research Brief IUPUI Staff Survey. June 2000 Indiana University-Purdue University Indianapolis Vol. 7, No. 1
 Research Brief 1999 IUPUI Staff Survey June 2000 Indiana University-Purdue University Indianapolis Vol. 7, No. 1 Introduction This edition of Research Brief summarizes the results of the second IUPUI Staff
Community Performance Report
 : Wenatchee Current Year: Q1 217 through Q4 217 Qualis Health Communities for Safer Transitions of Care Performance Report : Wenatchee Includes Data Through: Q4 217 Report Created: May 3, 218 Purpose of
2005 Survey of Licensed Registered Nurses in Nevada
 2005 Survey of Licensed Registered Nurses in Nevada Prepared by: John Packham, PhD University of Nevada School of Medicine Tabor Griswold, MS University of Nevada School of Medicine Jake Burkey, MS Washington
The Number of People With Chronic Conditions Is Rapidly Increasing
 Section 1 Demographics and Prevalence The Number of People With Chronic Conditions Is Rapidly Increasing In 2000, 125 million Americans had one or more chronic conditions. Number of People With Chronic
Patient survey report Survey of people who use community mental health services 2011 Pennine Care NHS Foundation Trust
 Patient survey report 2011 Survey of people who use community mental health services 2011 The national Survey of people who use community mental health services 2011 was designed, developed and co-ordinated
Proceedings of the 2005 Systems and Information Engineering Design Symposium Ellen J. Bass, ed.
 Proceedings of the 2005 Systems and Information Engineering Design Symposium Ellen J. Bass, ed. ANALYZING THE PATIENT LOAD ON THE HOSPITALS IN A METROPOLITAN AREA Barb Tawney Systems and Information Engineering