Deal with the Devil: The Successes and Limitations of Bureaucratic Reform in India
|
|
|
- Dorothy Hines
- 6 years ago
- Views:
Transcription
1 Deal with the Devil: The Successes and Limitations of Bureaucratic Reform in India Iqbal Dhaliwal, J-PAL Rema Hanna, Harvard Kennedy School, NBER, BREAD, JPAL December 2013 Abstract Employing a technological solution to monitor the attendance of public-sector, health care workers in India resulted in a 15 percent increase in the attendance of the medical staff. Health outcomes improved, with a 16 percent increase in the delivery of infants by a doctor and a 26 percent reduction in the likelihood of infants born under 2500 grams. However, women in treatment areas substituted away from the newly monitored health centers towards delivery in the (unmonitored) larger public hospitals and private hospitals. Several explanations may help explain this shift: better triage by the more present health care staff; increased patients beliefs on absenteeism in the treatment health centers; and the ability of staff in treatment areas to gain additional rents by moving women to their private practices and by siphoning off the state-sponsored entitlements that women would normally receive at the health center at the time of delivery. Despite initiating the reform on their own, there was a low demand among all levels of government state officials, local level bureaucrats, and locally elected bodies to use the better quality attendance data to enforce the government s human resource policies due to a fear of generating discord among the staff. These fears were not entirely unfounded: staff at the treatment health centers expressed greater dissatisfaction at their jobs and it was also harder to hire new nurses, lab technicians and pharmacists at the treatment health centers after the intervention. Thus, this illustrates the implicit deal that governments make on non-monetary dimensions truancy, allowance of private practices to retain staff at rural outposts in the face of limited budgets and staff shortages. This project was a collaboration involving many people. We gratefully acknowledge our research managers Manaswini Rao and KB Prathap for their outstanding overseeing of the field research work. We also thank Kanika Dua, Manisha Pandita, Gowramma, Srini Vasudevan and Priyanka Kanth for their excellent work coordinating the field surveyors. We thank Jonathan Holmes, Susanna Berkouwer, and Claire Walsh for outstanding research assistance. We thank the National Rural Health Mission of the State of Karnataka (particularly its head Selva Kumar) for their cooperation implementing this project. We thank Rohini Pande and Asim Khwaja for helpful comments on the study. This project was generously funded by grants from J-PAL and the United States AID s Development Innovation Ventures (DIV). All views expressed are those of the authors and do not necessarily reflect the views of the Government of Karnataka, NRHM, USAID or JPAL.
2 I. INTRODUCTION Developing countries often have extensive, and quite stringent, rules on the books that govern the responsibilities of government bureaucrats, as well as the supposed penalties in place if they violate those rules. And, yet, despite of or perhaps, in some ways, because of these extensive rules and systems, service provision and quality remains low. One view is that bureaucratic reform, either to improve these rules or even just to better enforce the ones on the books, will be fruitless: countries are beholden to their past institutional design (see, for example, Acemoglu, 2006; Acemoglu, Johnson, and Robinson, 2001) and these designs in developing countries are often characterized by a myriad of confusing rules that few fully know or understand, with complicated bureaucratic structures in place that leave no one fully responsible for enforcing them (see, for example, Devarajan, Easterly, and Pack, 2003). Thus, inefficiency and corruption remain the norm. A second view is that reform is possible, especially with technological solutions that can bypass the poor incentives, overlapping institutional structures and individual discretion that make it easier for bureaucrats to ignore the existing rules and extract rents. This view has gained traction in many different areas of government from the introduction of electronic voting machines (Fujiwara, 2013) to computerized land registration systems (Deininger and Goyal, 2010) to electronic identification cards for the beneficiaries of social assistance programs (Niehaus, Muralidharan, and Sukhtankar, 2013) to smartphones to monitor officials who monitor lower-level bureaucrats (Callen, Gulzarz, Hasanain, Khan, 2013). However, it not always clear as to when these kinds of reform will be readily adopted and, if they are, under what types of circumstances will they be effective. This study provides evidence on the reform process from an intervention initiated in 2010 by the National Rural Health Mission (NRHM) of Karnataka the lead department for the delivery of health services in the state of the Government of India (GoI). Their health centers were plagued by the persistent absenteeism that many government bureaucracies face: in a baseline set of random checks, doctors were present only 36 percent of time. Consequently, the NRHM set up a pilot program to better enforce the existing attendance policies. In 140 primary health centers (PHCs), randomly chosen from among 322 across five diverse districts, they introduced a biometric monitoring device to digitally capture the thumb impression for each staff member at the start and end of the day and informed the staff that these data would be used to ensure that the staff s leave days were properly deducted for the days that they were absent. Approximately two and a half million individuals live in the catchment areas of the 2
3 treatment PHCs and so even this pilot project had the potential to impact the lives of millions of individuals. The experiment was similar in spirit to Duflo, Hanna, and Ryan (2013), which studied the effect of monitoring and financial incentives on the performance of para-teachers in India, but differed in several important ways. First, this experiment was conducted within the real government bureaucracy, whereas that intervention was conducted within NGO-run schools. Second, the teacher s contract was changed at the same time as the monitoring began from a fixed salary to an incentive based system; in this case, the government began the program as a way to enforce the existing staff contracts. Similarly, the intervention differed in several key ways from Banerjee, Duflo, Glennerster (2008), which studied the effect of a monitoring system run by the same NGO, Seva Mandir, for nurses in government sub-centers. The government introduced a schedule of penalties specifically for that experiment, whereas this project traces out whether the attendance data can be incorporated into the (somewhat complicated) government bureaucracy to enforce the existing contracts. Moreover, this project focuses on all types of staff (from clerks to doctors) at primary health centers, which are larger than the sub-centers and for which the staff have presumably even fewer field duties than sub-center nurses, who were only required to be at the subcenter on Mondays. Attendance increased, but truancy was not fully eliminated: the treatment PHCs experienced a 14.7 percent increase in the attendance of health care workers relative to the control. There was substantial heterogeneity based on the power structure within the PHCs: there were no observable effects of the treatment on doctors, but instead the treatment effect appears driven by an 18 percent increase in attendance for lower-level civil servants the nurses, lab technicians and pharmacists. The treatment effect appeared fairly constant for the first 10 months of follow-up, but then appeared to decline in the final months as the pilot program began to wind down, when the research team was also less involved in the day-to-day monitoring of the system. Despite the imperfect implementation of the system, it translated to substantial health gains: baby birth weight increased by 67 grams in the catchment area of the treatment PHCs, with a 4.6 percentage point decrease or a 26 percent decline in the probability of being born below 2500 grams. The level of ante-natal visits was already quite high and did not alter as a result of the treatment, but there is evidence that the quality of antenatal care increased in the treatment PHCs along dimensions that were low to start (e.g. the disbursement of iron folic acid tablets). 3
4 One of the biggest changes as a result of the intervention was a change in delivery methods: deliveries conducted by doctors increased by about 16 percent in the catchment area of the treatment PHCs. At first, this seems at odd, as doctor attendance did not increase as a result of the treatment. However, deliver location also changed, with more women in the treatment areas delivering in the large public and private hospitals. Some of this may have been due to better triage by the more present nurses and pharmacists, sending women with high-risk pregnancies to the more advanced hospitals. Moreover, the women who had just delivered in the catchment area of the treatment PHCs were less satisfied with staff attendance at the treatment PHCs, so it is also possible that that the treatment simply increased the salience of the absenteeism when the women came in for their antenatal visits. An alternative theory is that the monitoring placed additional hardships and costs on the PHC staff, so that the doctors diverted women to their private practices to earn additional fees, as evidenced by the fact that delivery costs significantly increased in the treatment group. Moreover, the staff may have diverted them elsewhere to prevent the women from claiming their state entitlements (i.e. cash and inkind payments for institutional delivery) at the primary health centers at the time of delivery, which the staff could then siphon off: in fact, women in the treatment areas were about 7 percent less likely to know about their state entitlements than those in the control areas (significant at the 1percent level) and they were also less likely to actually receive their entitlements (p-value of 0.105). Thus, while the program was designed to reduce one particular form of corruption (fraudulent absenteeism), it may have exacerbated other forms in response. Despite the fact that there were gains in both attendance and subsequently health, the reform process was fraught with delays and implementation challenges. The state government itself, which initiated and designed the pilot project, never followed through in using the better data to actually deduct the employees leave balances. Some of this was due to the fact that it was also not necessarily trivial to deduct a staff member s leave balance: as we discuss more below, it is a process that involves a multitude of stakeholders and requires much effort due to elaborate and cumbersome civil service rules that apply to government staff. Qualitative interviews with government officials also revealed a hold-up problem: given the growing private sector, coupled with the fact that many PHCs are in less desired rural locations, state officials often claim that they have to give the staff more leeway along dimensions other than salary in order to keep them happy and employed. This view is not entirely without merit: doctors and staff nurses in treatment PHCs report significantly less satisfaction with their positions. Moreover, the 4
5 treatment PHCs attract fewer nurses, lab technicians and pharmacists than the control PHCs the very group that was most affected by the intervention. Throughout the system, the various lower level government civil servants and political bodies that are responsible for monitoring the PHCs did not have much interest in using or enforcing the system, or in general improving attendance. For example, the sub-district health officials, who are in charge of monitoring the PHCs, have very low expectations of what is considered good attendance for doctors: they expect doctors to be present about half of the required days of the month. When asked to rank the PHCs under their domain from best to worst, we find that actual attendance is uncorrelated with rank, suggesting that attendance is not a serious criterion in which they judge the health centers. As such, they approved most exemption requests by doctors for absences. 1 Even when the state government tried to motivate the sub-district health officials to better enforce the rules through a series of video conferences with them, an event study analysis reveals that these attempts yielded no change in absence rates. Similarly, the local elected government bodies (or Gram Panchayat), that help monitor the PHCs and control a small portion of their funding, could use the data and help better enforce the attendance rules, since they are beholden to citizens. 2 In the control group, having a more active local elected bodies i.e. those who have heard of the attendance program is associated with a higher doctor attendance, by about 10 percentage points. There was a large treatment effect on doctor attendance in areas where the local government bodies were not active, but no effect in the areas where the government bodies had heard of the program: this suggests that even though the active local elected bodies expected higher attendance from doctors than non-active ones, they did not expect it to increase further when provided with the tools to do so. Again, this was often due to expectations of what they believed doctor attendance should be: 77 percent of the control group GPs were either satisfied or very satisfied with their attendance despite the high truancy. 1 Banerjee, Duflo, Glennerster (2008) also found that the primary health center officials continually granted exemptions to the sub-centers, leading the program effect to reduce after the first six months. Interestingly, in this case, the exemptions were entered into the system by the sub-district officials and thus monitored by the state level officials; even then, they had no hesitations about granting exemptions. 2 Callen, Gulzarz, Hasanain, Khan (2013) find that doctors have better attendance in more politically competitive districts, and thus find that local politicians can improve attendance if they have an incentive to do so. However, the context here differs considerably from Callen, Gulzarz, Hasanain, Khan (2013), where the district parliaments have more say over the hiring of staff of the medical staff; in this context, a civil service process and counseling sessions with state government bureaucrats determines the staff placement and so the local elected bodies have less power over individual the staff hiring and movements. 5
6 This paper contributes to a growing literature that aims to understand whether bureaucratic reforms can improve government efficiency and under what cases do these reforms work, from changing the negotiation power of citizens with local officials (Alatas, et al, 2013; Björkman and Svensson, 2009) to changing the structure and responsibilities of staff (Banerjee, et al, 2012; Duflo, et al 2013). This paper illustrates that if one wants to implement reform, there are real gains to doing so, as birth outcomes dramatically improved. However, it also shows that a reform in one aspect of work (absenteeism) led to potentially other forms of corruption to increase (e.g. higher delivery costs, diversions of patients to private practice, and reductions in receipt of patient entitlements). More importantly, it highlights the conflicting demands within the system: the fact that enforcing contracts within government bureaucracy is not only hard to do, but that demand to do so may also be quite low for reasons in addition to just the fact that it is challenging to negotiate the government bureaucracy. Given limited budgets and competition for staff with the private sector in urban areas, governments appear to make implicit deals on non-monetary aspects of the job, such as truancy, to retain staff, particularly in rural areas. This leads to the question of whether non-monetary aspects of the job can be improved in ways that does not compromise the quality of services. Or, as the private sector continues to expand, are broader reforms necessary: from changing the responsibilities of remote government health centers from providing health care to becoming triage centers to incentizing private health care providers to operate in remote areas? The paper proceeds as follows: Section II describes the experimental design and data, while we present the results on attendance and health in Section III. Section IV describes the reform challenges. Section V concludes. II. EXPERIMENTAL DESIGN, DATA COLLECTION, AND SAMPLE STATISTICS In this section, we discuss the setting and experimental design. We then describe the data collection efforts and provide sample statistics. A. Setting and Sample This project explores a reform designed to reduce bureaucratic absenteeism in India. India has an extensive network of about 24,000 government-run Primary Health Centers (PHCs) that provide basic medical care to the poor, particularly those located in rural areas. These centers experience the common 6
7 challenges observed in many government bureaucracies: staff vacancies, fraudulent absenteeism, limited monetary and physical resources, and so forth. Currently, attendance is recorded on paper registers that are maintained at the PHC. The staff are required to sign in each morning. As we discuss below, there is significant absenteeism either missing full days or only attending for limited hours. Monitoring is conducted by surprise checks by sub-district health officials and through local elected bodies (GPs). Qualitatively, these checks are not frequent and collusion between staff means that inspecting officials are informed either that the truant health staff is out doing field work or is sick. Health staff often mentioned the high requirements for being in the field or in meetings, the distance of many PHCs from district headquarters where most of the doctors live due to the absence of good living arrangements around the rural PHCs, lack of demand among local population for their work 3, and lack of appreciation among government and the people for their service. Most in the government and local people believed that the primary reasons were the combination of more lucrative private practice of many of these doctors and the lack of effective monitoring of health staff. To address the absence problem, the National Rural Health Mission (NRHM) Directorate of Karnataka, an Indian state of about 53 million individuals, designed and raised funds to employ an innovative biometric device to enforce the State of Karnataka s attendance rules, which are rarely followed in practice. They aimed to pilot the program, entitled the Integrated Medical Information and Disease Surveillance System ( IMIDSS ), in 140 PHCs that were spread across five districts Mysore, Chitradurga, Dharwad, Dakshina Kannada, and Bidar in order to learn how the program would function given the diversity in income levels and institutional capacity across the state. Thus, our overall sample consisted of the 322 PHCs in these five districts. 4 Note that with an expected catchment area of about 18,000 individuals per PHC, even this small pilot had the potential to affect health services delivery for the over 2.5 million individuals that belonged to the catchment area of the treated PHCs. 3 One reason cited for this lack of demand was that most people prefer to either go to sub-district or district hospitals that have better facilities and specialist doctors, or to private health care (including traditional practitioners). However, many of the local individuals that we spoke to mentioned that they would prefer to visit the local PHC but cited the absence of health staff or closed PHCs, unsatisfactory treatment and lack of medicines as reason for not going to the PHC. 4 The initial government listing consisted of 350 PHCs. However, upon investigation, 20 were not actually PHCs (but rather Community Health Centers or Maternity Centers), 1 was a duplicate PHC, and 1 was adopted by a medical college and not fully under the government control; these were excluded from our sampling frame. Six PHCs refused to participate in any surveys and pilot projects, leading to the final sample of
8 C. Experimental Design Out of the 322 PHCs, 140 were randomly assigned to be part of the pilot project, while the remaining 182 PHCs functioned normally as before. Details of each treatment are below: Comparison PHCs (Status Quo): The PHCs are open daily from 9AM to 4:30 on weekdays, and 9AM to 1:00PM on Sunday and holidays; the PHC staff are required to work each and every day, but nurses, laboratory technicians, and pharmacists are allowed to take off the second Saturday of each month. A fraction of the PHCs are open 24 hours a day (about 40 percent in our sample), with most staff present for the day shift and additional nursing staff present at night. During work hours, the PHC employees are expected to be at the PHCs, except for monthly meetings and the occasional field visit if approved by a supervisor (sub-district health officer for the doctor, and the doctor for all other staff). There is a procedure for absences, but it is not followed in practice. Each staff member has 15 days of guaranteed leave a year, which they need to use that year; doctors are responsible for approving and maintaining the records for these leave days (including for themselves). In addition, staff member can accumulate up to 30 days of earned leave days each year. Deductions of earned leave are maintained at the Accountant General office at the state level; these days are very valuable as unused days can be carried forward to next year and cashed out in small amounts every year or at the time of retirement. 5 The sub-district health officers (taluk health officers, or THOs) are administratively responsible for implementing the health programs of Department of Health and Family Welfare within each subdistrict through the network of PHCs and a network of sub-centers that fall under the PHCs. These health programs are primarily preventive services. They are also in charge of training, as well as the day-to-day monitoring of the PHC staff. However, the sub-district health officers do not have the direct authority to enact disciplinary action on any employee: the power to take action for lower level civil servants (e.g. Nurses, Lab Technicians, Clerks) rests with the District Health Officer (DHO), while the authority to take action for higher level civil servants (e.g. government doctors) rests only with the state. The sub-district 5 This explains the hesitation of government staff to be absent without authorization rather than just apply for earned leave even when they have positive leave balances. 8
9 officer can only provide complaints regarding the staff members or PHCs to the district health office, who then also involves the state government if the problem is not within their domain. In addition, the local elected bodies (Gram Panchayats of GPs) are also involved in monitoring the PHCs: in our control group, 81 percent report conducting a monitoring visit of the PHC at least once in the last three months and 69 percent report that a doctor had attended at least one GP meeting in the last three months. Moreover, about 80 percent had a joint account with the PHC for certain funds, and 86 percent managed untied funds that they could use at their discretion to incentivize the PHCs. Treatment PHCs: The government aimed to utilize the bio-metric devices to enforce the existing leave rules for the PHC staff through improved attendance monitoring. The state government supplied each PHC with a monitoring device (the IMIDSS system ), consisting of a fingerprint reader (FPR) and a multi-purpose mobile phone device (Figure 1). Each staff member is required to scan their thumb impression when they first arrive at the PHC in the morning and when they leave in the evening. One staff member at each PHC is then responsible for uploading the data to a dedicated control room in the state capital that managed the pilot project. The staff member who was in charge was also required to enter in details on disease counts and information on women who gave birth at the PHC. 6 There are several important program details: First, while the PHC employees were supposed to primarily be present at the PHC, they were allowed some flexibility for attending meetings or for occasional field visits. Specifically, in increments of half-days, the doctor was allowed a maximum of 5 full day exemptions for work outside the PHC each month, the staff nurse was allowed a maximum of 2 full-days, and all remaining staff was allowed a maximum of 3 full days. The doctor could approve all of these allowed exemptions (including for himself), but any exemptions above and beyond this were to be approved by the sub-district health officers, who were informed by the state government repeatedly that approval for these additional exemptions should be rare. In practice, the sub-district officer basically approved all of the exemptions that were submitted. Rarely, they refused, but this was only for lower level staff and for obvious cases of misconduct (such as absences that last several weeks). We interviewed 15 6 The government was concerned that if the system looked too focused on attendance, there would be resistance to its use. Thus, it was decided that additional health data would be collected to frame the program as a general program to improve the functioning of the PHCs. In practice, the disease counts were never used by the central government in planning. Moreover, most of the staff recognized that the machines were primarily focused on attendance: for example, one staff nurse from a treatment PHC jokingly referred to it Punch-in and Punch-out machine. At all levels of administration, the system was commonly known as the Biometric Program, showing the ultimate belief that the system was in place to address attendance, rather than collect disease counts. 9
10 sub-district officials: despite the official regulations that PHC staff needed to be present, the sub-district officers claimed that the staff, and in particular the doctors, had too many administrative duties and emergencies in the field to be present. On average, the sub-district officials claimed that they only expected the doctors to be present 16 days a month (or about 54 percent of the time); in contrast, they expected nurses and other medical staff to be present between 23 and 24 days a month. Thus, they had no qualms about excusing doctors from being present at the PHC. Second, even with the precise data on who is present, it is not trivial to use this data to actual deduct leave days. Using the times and dates of the fingerprint readings, the state government could calculate the number of working days of each staff member in a given month. At this point, the government also collects the exemption records from the sub-district offices and the leave days taken from the machines, and calculates if there is a shortfall in attendance and if so, by how many days. At this point, the shortfall is supposed to be communicated in the form of a memo (a show cause notice ) to each PHC staff, which allows him or her to offer explanations as to his/her unauthorized absence. Once the memo is returned, it is acted on by the sub-district health officer, who is authorized to debit the exceeded days from the staff member s leave balance. First, they deducted the guaranteed leave days that are accrued to the staff; to do so, the sub-district officer needs to communicate the deductions to the doctor, who maintains these records at the PHC. After the guaranteed leave days are depleted, the subdistrict officer can start to deduct the earned leave balance; this requires that the sub-district officer make a presentation to the Director, Health and Family Welfare in Bangalore, with detailed reasons for the leave debits, and if the leave deductions are approved by them, the request is forwarded by the Director to the Accounted General office, a different department within the government. As we discuss below, only in very rare cases did the truant staff receive a formal show-cause notice from the NRHM and the subdistrict officers never made any real efforts to actually deduct the unauthorized absences from the leave balances. Third, to motivate staff, the state government announced that they would also link the staff-level and the PHC-level awards to the attendance data for those PHCs in the program. The government had proposed awards such as Best PHC for overall attendance and PHC staff with highest attendance. However, during the Annual Doctors Day in 2012, none of the awards that were given out were actually linked to the data from the IMIDSS system. 10
11 Fourth, to prevent damage or the mis-use of the device, the government appointed one staff member at each PHC typically either the pharmacist or the lab technician to be in charge of the device. 7 The government provided this person with Rs500 ($9.10) per month to ensure that the device was functioning. However, this payment was performance-driven: for each day in a month that the device was not functioning (and hence not uploading data), Rs. 50 ($0.91) would be deducted for that month; thus, if a device was not functioning for ten or more days in a month, he or she would not receive any payment for caring for the device. This too was fraught with implementation challenges, since, any disbursement of cash required approval of the Program Budget by the National Mission Directorate of the Government of India by March for the upcoming financial year. In the first fiscal year of the program, every appointed staff member received a bulk payment for the full amount, irrespective of machine functioning; this was done to motivate these staff members and as a promissory gesture. In the second fiscal year, the disbursement of payments did not consistently happen on a monthly basis. Finally, during the course of the pilot study, it would be near impossible to keep knowledge of the experiment from the control group and vice versa. Thus, from the start, all staff members were informed of the pilot project and informed that selection into the pilot was at random. Given the initial plans to scale the program after one year, the government informed all staff members that they were testing the system this year to work out the bugs in it, and that it would be expanded to all PHCs the following year. D. Randomization Design and Timing The unit of randomization was a Primary Health Center (PHC). We randomly selected 140 PHCs from the 322 PHCs in the chosen districts, stratified by the 29 sub-districts ( taluks ). In four districts Chitradurga, Dharwad, Dakshina Kannada, and Bidar we selected about half the PHCs in the district. In Mysore, the biggest and most developed district, we selected 36 out of 120 (about 30 percent). During the course of the experiment, we requested that staff transfers be frozen to prevent movement into the control group. The transfers for the entire department are typically decided upon each 7 In addition, the government also appointed a Block Program Manager (BPM) from each sub-district to respond to questions on how to use the system, as well as to arrange for repairs and the replacement of broken machines. They were provided up to Rs 1000 ($18.18) per month for this work: each time a device was inoperable due to mishandling, Rs. 100 ($1.82) per PHC per day would be deducted from the total and they would be fined Rs. 25 ($0.45) per PHC for each day that data was not uploaded for reasons other than network or server failure. Again, the disbursement of these payments had similar budgeting and delivery issues as that of PHC level staff. 11
12 June through a systematic program called counseling that is held in Bangalore. However, as we discuss below, while the government made efforts to not take the treatment into account during the counseling, individuals do express location preferences during the counseling. Thus, we drop all new staff members from the analysis on attendance and then we systematically explore the entry and exit in the treatment PHCs. As shown in Figure 2, in July, 2010, we conducted random checks to assess the baseline absenteeism rates at the PHC and then conducted a baseline facility survey. These surveys were conducted in anticipation of the government s plan to deploy the IMIDSS system in September In practice, the machines were only procured in March 2011 so we conducted a second baseline survey in the summer of After piloting at a few PHCs to ensure the functioning of the system, the government conducted training sessions and rolled out the system in Mysore district in July, The training for the other districts (as well as a retraining for Mysore) was conducted in September to October After the intervention commenced, we conducted seven rounds of random checks. We conducted the first round (August 2011) only in Mysore District, which received the system first. We conducted the subsequent follow-up random checks between September 2011 and November In November to December 2012, we also conducted a series of endline surveys with the various stakeholders in the project (facility survey, doctors, nurses, sub-district health officials, local elected officials, and women who had given birth within the timeframe of the experiment). E. Data Collection We administered several types of surveys. First, we conducted random checks on the PHC to assess the attendance of each staff member. We conducted two rounds of unannounced checks to assess baseline attendance and an additional seven follow-up rounds to assess program impact. For logistics purposes, the PHCs within the same sub-district were generally surveyed over the same set of days; we randomly assigned the time of day that PHCs were checked so that no PHC was always checked at the same time of day. For each random check, the enumerator conducted a surprise visit at the PHC and recorded the attendance of all staff at the moment that he or she arrived; if the PHC was closed on arrival, everyone was considered absent. The enumerator then inquired about who was transferred or resigned, and they were subsequently dropped from the sample from then on. Next, the enumerator counted the number of 12
13 patients present at the time of the visit and the number of patients in hospital beds. For treatment villages, the enumerator additionally checked whether the IMIDSS system was in working condition and being used. Although the checks were infrequent, there was a concern that the monitoring associated with the random checks could affect attendance as well; therefore, 50 percent of sample was randomly selected to be visited only in every other follow-up survey round so that the Hawthorne effect of monitoring could be measured. Second, we administered a facility survey at the start (July, 2011) and end (November to December, 2012) of the study. This survey was designed to learn general information about the PHCs: hours of operation, number of staff, the number of patients, disease counts, quality of infrastructure, and available medicines and vaccines. While conducting the facility survey during endline, we also conducted surveys with the doctor and one staff nurse at each health center to learn more about their background, work experience, perception of working conditions, and the system. 8 In addition, we also conducted interviews with the sub-district health officers, who are responsible for monitoring all PHCs (including staff attendance) in their sub-district to learn more about their interactions with the health centers. Next, we interviewed members from the local government body (Gram Panchayats or GP) that fell within the catchment area of the PHC. Due to monetary constraints, we interviewed GPs in all districts except Mysore. We interviewed the president of the GP in 61 percent of the cases and we interviewed the vice president in 11 percent of the cases; in the remaining villages, we interviewed an active member. We interviewed the GPs to learn about the village demographics, their interactions with and perceptions of the PHCs, their perceptions of the GP quality, and their beliefs on the IMIDSS system. Finally, we conducted a survey of women who had given birth in the last year within the catchment area of the PHC. We randomly selected a village from the catchment area of each PHC for all districts other than Mysore and conducted a census of all women in that village who were pregnant during the experiment and their pregnancy outcomes. We then randomly selected 4 women per catchment area 8 Not all PHCs that we attempted to interview were included in this survey. First, not all PHCs had a doctor or staff nurse employed as vacancies are common. Second, there were a small percentage of doctors and nurses who were never present during any of our attempts to interview them. In Appendix Table 1, we regress an indicator variable for whether the PHC was not interviewed on the treatment variable and sub-district fixed effects; PHC were more likely to be missing in our sample if they were in the treatment, but this is not significant. The endline surveys are primarily used to understand staff satisfaction and management of PHC. If staff left the treatment PHCs at a higher rate due to being unsatisfied with the NRHM program, then we would underestimate the level of dissatisfaction. Thus, our estimates will provide a lower bound on the satisfaction levels with the program. 13
14 who had given birth during the course of the experiment to learn about where they had given birth, who conducted the delivery, how much they paid, whether they had antenatal care, their perceptions of the PHC, and the baby s birth weight. 9 In addition to the survey data, we obtained administrative data from the government on the program functioning. In particular, we obtained all data from the IMIDSS system, including both the biometric records and the disease counts collected within the system. Finally, to better understand how the program was operating in practice, our team conducted extensive interviews with the government (state officials, district and sub-districtt health officers), PHCs staff and local residents during the course of the study, as well as recorded their field observations. F. Summary Statistics Table 1 provides baseline sample statistics from the facility survey and the first two rounds of random checks. As shown in Panel A, the PHCs served, on average, around 13 villages, and claimed an average of 67 patients per day (or about 24,500 patients per year). About 40 percent of them were open 24 hours a day, while the remaining PHCs were on a 9am to 4:30pm schedule. 10 Recruiting staff to rural or remote areas is a challenge for the state government, especially in the presence of a growing private health sector. This is reflected in relatively high rates of vacancies: for example, in the baseline, 20 percent of PHCs had a unfilled position for a doctor, 15 percent for staff nurses, 37 percent for pharmacists and 13 percent for laboratory technicians. Staff presence is generally low, despite the fact that they are required to primarily be at the PHCs during work hours. In the first round of the random checks, the nurses, lab technicians and pharmacists (henceforth, NLP for conciseness) were present in only 49 percent of the checks, while the doctors were there in 40 percent of them. These rates continued to remain low ten months later during the second round of checks: for example, the doctors were only present at the PHC in 32 percent of the random checks. While these numbers seem low, they are consistent with the persistently high absenteeism observed in other studies: Banerjee, Deaton and Duflo (2003) reported a 54 percent attendance rate of 9 We did not want to interview women who had just experienced a miscarriage, a still-birth, or sudden infant death as it is a sensitive time. Thus, we only conducted in-depth interviews with women who gave birth to a living child. If the intervention reduced infant mortality, the effect of the intervention on infant mortality could be biased downwards. Thus, this would provide a lower bound estimate of the effect of the program on birth weight. Nonetheless, in Appendix Table 2, we test for the effect of the program on stillbirths, miscarriages, or infant death at the time of birth. These are low probability events, and we do not observe any difference based on treatment status. 10 9AM to 1PM on Sundays and Holidays. 14
15 the PHC (and the larger Community Health Centers) staff in Rajasthan, while Chaudhury, et. al. (2006) found a 60 percent attendance rate in a nationally representative survey of PHCs in India, with doctors more likely to be absent than lower-level staff. These high absence rates are unlikely to be primarily explained by field activities or other work activities (e.g. trainings, meetings). 11 The staff are primarily obligated to be at PHC during operating hours and those who have even more limited field responsibilities (e.g. laboratory technician, pharmacist) exhibit the same high rates of absenteeism as everyone else. Furthermore, Banerjee, Deaton and Duflo (2003) tracked sub-center nurses in Rajasthan who were absent during their random checks, and found that the nurses were only in the villages attached to their sub-centers in 12 percent of the cases. G. Experimental Validity The first threat to experimental validity is that by chance, the randomization led to imbalanced groups. Appendix Table 3 provides a check on the randomization; Panel A explores balance across the PHC characteristics in the baseline facility survey, while Panel B tests for balance across the baseline attendance measures. The treatment and control groups appear fairly balanced along these dimensions: a joint-test across the facility measures yields a p-value of 0.81 and a joint test across the attendance measures yields a p-value of A second threat to experimental validity could stem from two potential forms of monitoring effects. First, even though we conducted the random checks relatively infrequently as compared to other forms of monitoring, there could be a concern that they affected attendance as well. However, because the checks were conducted equally for the treatment and the control groups, it is unlikely that this caused a differential effect on attendance. Nonetheless, we randomly selected 50 percent of the PHCs to only be visited in every other follow-up survey round. Appendix Table 4 shows that the monitoring frequency does not significantly impact attendance. Third, it is possible that others within the government system (e.g. local government bodies or sub-district officials) change their own monitoring of the PHCs as a result of the system. The possible direction is ambiguous: they may see the machines as a substitute for their own activities and monitor the PHCs less. Or the system may make the absenteeism issue more salient and, thus, they may increase their 11 Even if we assumed that every month the doctors spent 5 of the days in the field and took 2 legitimate leave days (which are both unlikely), their attendance rate would only be 77 percent. Thus, there is a large scope for improvement. 15
16 own monitoring. This is not necessarily a threat to validity: the fact that they change their behavior to the machines may occur in the actual scale-up as well and thus may be an important policy outcome. However, the worry is that their behavior changes are just due to the experiment: for example, suppose they have a fixed amount of time for monitoring activities, view the machine as a substitute for their activities and thus differentially shift all of their monitoring into the control group, whereas if it was applied everywhere, there would not be a differential shift. In this case we may underestimate the effect of the machines. In Appendix Table 5, we test for whether the treatment induced differential monitoring by either the sub-district health officer or the local government body (GPs). We find no observable relationship between the sub-district officials monitoring of the PHC and the treatment status (Columns 1 and 2). Contact between the local government bodies and the PHCs is already high, with 81 percent of the GPs having conducted at least one inspection of a GP in the last three months (Column 5). We find no significant differences in contact between the GPs and the PHCs, and in fact, the signs of the coefficients show no clear pattern in terms of direction (Columns 3 6). III. RESULTS ON SYSTEM USE, ATTENDANCE AND HEALTH A. Did the Primary Health Centers Use the IMIDSS System? In Table 2, we document whether the treatment PHCs received the system and whether it was in working order at the time of the random check. As no PHCs in the control group received the IMIDSS system, we simply present sample statistics on the machine functioning and use for the treatment group. While all PHCs received the system, it was only currently functioning in 66 percent of the random checks. This mal-functioning was often due to the phone not being present or charged: in 13.9 percent of the cases, the fingerprint reader was not in working order, whereas the phone was not working in 28.6 percent of cases. 12 If the machines were functioning, the PHCs typically used them. In the random check data, 67 percent of the PHCs report uploading data to the state government the day before the check; this is consistent with the percent of machines in order. The rate of reporting data is even higher if we examine the data from the system on those same days: on 82 percent of days, at least some data are recorded. The 12 Mobile coverage is fairly decent. In 93 percent of the random checks, the enumerator was able to detect a signal. In cases where there was no signal, it was due to fluctuations in signal, rather than persistence in non-coverage. 16
17 machine stores 40GB of data at a time, and so even if data is not uploaded to Bangalore on a particular day, this implies that at least some staff used the fingerprint reader on those days. As we discuss above and in Section D, it was challenging to actually deduct leaves and demand to do so was low. Thus, even though the PHCs tended to upload the data, the State Government did not end up using the data to enforce the existing attendance rules. B. Did the Intervention Reduce Increase Health Worker Presence? The natural question that follows is whether that, even without the cuts to the leave balances, the additional monitoring had an effect on staff attendance. In Table 3, we estimate the reduced form effect of the program on attendance as measured by the random checks. Specifically, we regress an indicator variable for whether the staff member was present during a given random check on a dummy variable indicating treatment status, one s average attendance rate in the random checks, and sub-district effects. 13 All standard errors are clustered by PHC. We only include staff who were employed at the time the intervention began, given the differential selection by new hires; as Appendix Table 7, Panel A, shows, the results are also robust to their inclusion. 14 Overall, the program led to a 3.4 percentage point or 8.7 percent increase in staff attendance, despite the imperfect implementation of the program (Column 1 of Table 3). The medical staff experienced a 5.5 percentage point increase in attendance (Column 2). However, there is heterogeneity in the treatment effect based on the power structure within the PHC: there was no observable treatment effect for doctors (Column 3), but about an 7 percentage point or 18 percent increase for lower level medical staff, the NLP (Column 4). 15 Finally, we test whether the treatment increased overall coverage by a doctor or a nurse: we regress an indicator variable for a doctor or nurse being present at the PHC on 13 If the baseline is missing, we input it with the average and also include a dummy variable indicating imputed baseline values. In Appendix Table 6, we explore the robustness of the estimates to varying the control variables. The results are near identical when we omit the baseline control (Panel A). As expected, we lose some power when omitting the strata fixed effects, but the statistical conclusions that the NLP are more likely to be present does not change (Panel B). In Panel C, we include individual-level control variables for gender and years at the PHC; again, the results are near identical to those in Table Note, that we also test the robustness of the results to dropping individuals who left the PHC from the sample in Panel B of Appendix Table 7; the results from the balanced panel are near identical to that those with their inclusion. 15 We group together nurses, laboratory technicians and pharmacists as they tend to provide triage services. In Appendix Table 8, we further disaggregate by staff position. There is a significant effect of treatment on both nurses and the laboratory technicians/pharmacists, and find no significant difference between them. Thus, we feel comfortable grouping them together in the main analysis. 17
18 the treatment status and sub-district fixed effects (Column 5). We find no effect on overall coverage, which suggests that the nurses increase their presence during the hours when the doctor is also present. Next, we explore potential patterns in the treatment effect. In all of the following graphs and regressions, we continue to control for baseline attendance and the sub-district fixed effects and to cluster the standard errors by the PHC. First, in Figure 3, we explore the treatment effect by survey round: we cannot reject that the effect differs over time, although we qualitatively observe a shrinking of the treatment effect in the last round (October 2012), at a time where the leadership of the health department had been changing, the pilot began to wind down, and we had reduced our support to the state government to implement the day-to-day running of the system. Second, we had randomly varied the time of day that the PHCs were checked. Interestingly, the biggest observed effect both for doctors and the NLP occurs in the morning. However, once the treatment NLPs arrive in the morning, they stay for the full day, whereas the treatment doctors compensate by being less likely to be present at later hours. This is consistent with the interviews we conducted with the PHC staff: the nurses stated that the program forced them to take earlier buses and, in general, make a conscious effort to be at work on time. 16 Finally, in Appendix Table 9, we estimate the treatment effect, by district. The government purposely chose districts that capture Karnataka s socio-economic diversity, variation in institutional capacity and their a-priori belief about inter-district variation in absenteeism rates. The ordering of the table panels reflects this: with Mysore being the most developed and closest to the capital and Bidar being the most rural and farthest. We find qualitatively similar treatment effects for Mysore, Dakshin Kannada, Chitradurga, and Dharward. In the least developed district, Bidar, we find no effect for NLP; we observe the qualitatively larges effect for doctors here (almost 9 percentage points over a mean of 15 percent in the control), but the coefficient is not significant at conventional levels (p-value of 0.28). 17 C. Effects on Health Services Delivery 16 We also explore attendance by day of the week in Appendix Figure 1. For medical professionals as a whole, it appears that the treatment effect occurs on most days expect Friday and Saturday. 17 In Appendix Table 10, we test whether the treatment effect varies by whether the PHC is open 24 hours a day or not. Opening 24 hours a day places more demand on the staff, even though there are more typically more staff employed. It is also much more difficult to monitor attendance for these PHCs for nurses as there may be multiple shifts. We find that much of the effect of the NLP occurs in PHCs that operate only during the day. However, 78 percent of the PHCs in Bidar are also 24 hour PHCs, which also has the lowest institutional capacity, and so it is hard to distinguish if this effect is driven by the hours of operation of the PHC or the locations. 18
19 The intervention increased the presence of the nurses, laboratory technicians and pharmacists, but had limited effects on doctors. The question that follows is whether this increase in attendance had any meaningful effects on health care provision and outcomes. On one hand, increased presence may allow for more time to treat patients and to triage high risk patients to the more advanced district hospitals. On the other hand, there are a number of reasons why there could be no effect: NLP could multi-task, i.e. show up more, but simply slack off when present. Perhaps only doctor presence affects health or the increase in attendance was not large enough to have any noticeable effect on health? To explore these issues, we surveyed 4 randomly selected women from a randomly selected village in each PHC catchment area who had recently given birth. For cost considerations, we did not conduct the survey in Mysore district. Tables 4, 5A and 5B provide these findings; note that we always include sub-district fixed effects and cluster by PHC. 18 The intervention led to a substantial increase in baby birth weight (Table 4). On average, babies weighed 67 more grams at the time of birth (Column 1 of Table 4) in treatment areas, and there was a 4.6 percentage point reduction or a 26 percent decrease in the probability of being born below at or below 2500 grams (Column 2). The number of antenatal visits did not change, but this was already quite high to start, with an average of 6.3 visits per woman in the control group. 19 Most women (86 percent of the control) received the two recommended tetanus shots already, and so while the treatment increased this by 3 percentage points, the change was not statistically significant at conventional levels. However, few women initially receive the recommended Iron Folic Acid (IFA) Tablets (39 percent of the control) and so this is a margin of ante-natal visit quality where there could potentially be room for gains. Indeed, this was the case, with the treatment leading to a 10.6 percentage point or 27 percent increase in receipt. This suggests that antenatal care may have increased along margins that were lower to start, perhaps through increase in time spent with patients. The composition of who conducts the delivery and where it is conducted also changed somewhat dramatically (Table 5A): There was a statistically significant 8 percentage point or 16 percent increase in deliveries by doctors (Column 1), with deliveries by nurses and others falling (Columns 2 and 18 We also collected data on the number of patients present at the PHC during the time of the random check. On one hand, we may expect this to increase if citizens learn about the program and utilize the PHC more. However, on the other hand, we might expect that more staff presence would lead to less waiting time and quicker discharges. Thus, the predictions are ambiguous. Nonetheless, we provide the findings in Appendix Table 11; we find no discernable effect on either the number of patients either waiting at the PHC to be seen or in beds. 19 While we do not know where all the visits occurred, we do know that over 70 percent of women received a tetanus shot at the PHC, which suggests that a large majority of visits occur at the PHC. 19
20 3). At first glance, this seems surprising, given that the intervention had no discernable impact on the doctors overall attendance. However, the intervention led to a shift in where deliveries occurred: we find that the deliveries were 8 percentage points or 28 percent less likely to occur at the PHC (Column 6) and home deliveries were almost completely eliminated in the treatment group (Column 4). Instead, it appears that the women in the treatment areas shift to delivering at the larger public hospitals or the private hospitals (Column 7). 20 There are several possible explanations for these compositional shifts in delivery patterns. While we cannot conclusively point out which is most responsible, we can provide some evidence on each. First, if the staff were present more and spent more time with patients during the antenatal visits, they could have also better triaged high risk pregnancies to larger hospitals. Moreover, it is also possible that the machines increased the salience of the doctor s absence, and led the staff that were actually present to relate the idea of the absent doctor to patients. When we asked the women to rate different aspects of the PHC, those in the treatment group were significant more likely to be unhappy with the availability of the PHC staff (Column 1 of Table 5B), despite the fact that there was no perceived difference in PHC quality by treatment status (Column 2). This suggests that the treatment shined a light on public sector absence, leading women shift away from the PHCs. A second potential explanation is more cynical: the monitoring system placed a real burden on the PHC staff, even if they did not fully change their behavior. In response, the staff may have chosen to compensate themselves in other ways. While they do not formally or readily admit it, many of the doctors have private practices/moonlight at private hospitals on the side. The fact that there may have been a shift to the private hospitals may signal that doctors are diverting patients there to increase their salaries. While it is challenging to measure this type of corruption, the increase in delivery costs (Column 3 of Table 5B) suggests that this may be occurring. Moreover, the state runs a number of entitlement programs: low-income women can receive financial and in-kind transfers for delivery in any type of institution from the PHCs. Qualitatively, many women do not receive their full entitlements, and instead, the PHC staff either keeps the entitlements or asks for a share. In Columns 4 and 5 of Table 5B, we explore the effect of the program on the provision of the entitlements: in treatment areas, the knowledge of entitlements significantly falls by almost 7 percent. Receipt of entitlements also falls by about 7 percent, but the p-value is Thus, the treatment staff may divert women to deliver elsewhere so that 20 Although note that these effects while positive are not individually significant (Columns 8 and 9). 20
21 they cannot claim their state entitlements at the PHC at the time of delivery, allowing the PHC staff to siphon off more of the entitlements. In sum, children born in the catchment areas of treatment PHCs exhibited better birth outcomes than those in the control areas, potentially due to an increased in quality of antenatal care. However, the treatment shifted deliveries out of the network of smaller government hospitals and into larger hospitals (both government and private sector), thus defeating the government s intention of reducing health care costs for the poor, as the women both paid a higher overall price for the deliveries and faced a reduction in the state-sponsored entitlements. IV. CHALLENGES TO REFORM The idea for the original reform did not stem from the research team: the government identified the absence problem, conceived the program, developed the software, and piloted the equipment prior to the involvement of the researchers in the project. They also independently raised the money for the project. When we joined, we provided numerous insights from previous research on how to improve both the software and program design, but ultimately, it was the government s idea to set up the program. Despite this ownership, the project was plagued with both delays and inadequacies in implementation. The state government was unable to procure the machines until seven months after the initial pilot and the planned program start date and they rolled out the program to the first district nearly eleven months after that date. Even at the first training sessions, when there should perhaps be the most enthusiasm and dedication over a new initiative, the program officer announced to the PHC staff her reluctance to deduct their leave balances and salaries if the staff did not comply with the system and attendance rules. Despite the fact that the PHCs were inputting data on most days, the follow-up from the state government was weak: as Table 6 shows, in only about half the times that we conducted a random check had the doctor even received the monthly attendance report from the state government the previous month. The idea of using the more accurate attendance data to better enforce the existing government rules, in the end, just never happened. As we described above, the process of deducting leave days is actually quite complex and requires cooperation among different government stakeholders; thus in practice, these deductions rarely ever actually occurred. Show cause notices, the official document needed to start the process of deducting leaves, were rarely issued. For example, only 9 percent of 21
22 doctors in the control group had issued at least one notice for any reason to one of his or her staff members in the last three months, and there was no difference in the issuing of notices between the treatment and control group (Table 6). Interestingly, despite the better data on delinquencies, there were actually fewer cases of outright dismissal in the treatment group than in the control group (Table 6). The implementation challenges stemmed from both the top i.e. the state government and the local bureaucrats and politicians who are responsible for further monitoring the PHC staff. At the top, the state government officials, the very office that conceived the project, did not always follow through with implementation. Part of this came from a split focus among a variety of initiatives and responsibilities; for example, at one point, the project was slowed down for a month as the state government team working on this project was drawn into leading an investigation of a fire at an old age home. At another point, the state government forgot to pay its phone bill, leading the system to temporarily shut down. However, the reluctance was more systematic and reflected the government s overall challenges and tradeoffs in running a public health care system with limited resources. Vacancies are prevalent; it is tough recruiting doctors and other staff to work in rural health centers, especially given the demand for health care professionals in the private sector in urban areas. 21 Salaries are considered low: 25 percent of current doctors claimed to be dissatisfied with this salary, and only 15 percent claimed to be very satisfied with it. As a result, despite believing that the staff needed to be present, the state government officials stated that they were reluctant to place too many expectations on the staff. For example, they raised the number of exemptions for doctors from 3 to 5 during the program design. It is not unclear that this view, given these other pressures, is entirely unreasonable. As shown in Table 7, in the endline survey, even with the imperfect implementation, the doctors and nurses in treatment PHCs expressed more dissatisfaction with their job. 22 As shown in Column 1, staff in the treatment group are unhappier with the overall work environment, but this is not significant at conventional levels (p-value of 0.21 in Panel A). Those in the treatment group are less satisfied with the location of the PHC (Column 2) and with the weekly holidays given (Column 8). Interestingly, although doctors claim to be happier with the attendance of the staff who report to them (Column 11), they are less 21 The private sector accounts for roughly 80 percent of health care spending in India, much of it in urban areas (PricewaterhouseCoopers Report on Health Care in India, 2007). 22 In Columns 1-9, we pool together the nurse and doctor samples; Columns explore outcomes that are specific to doctors. All regressions include sub-district fixed effects and are clustered by PHC. 22
23 happy with the power or authority given to them to manage the PHC (Column 10). A joint test rejects the null that there is no effect across all the satisfaction measures (p-value of in Panel A and in Panel B). As part of the experiment, we worked with the government to freeze transfers across the PHCs. However, individuals may nonetheless choose to leave and others may join. Moreover, new employees have some choice over their placements: when they are hired, there is a counseling session in which they can express location preferences, with those who score higher on placement exams having a greater probability of receiving their preferences. Thus, in Table 8, we more formally test whether the treatment PHCs exhibited greater difficulty in retaining and hiring new staff. In Panel A, we present coefficients from a regression of an indicator variable for whether the staff member left on the treatment status and sub-district fixed effects; in Panel B, the outcome is whether the staff member joined. In Panel C, we explore the total number of individuals employed in that category. On net, the treatment resulted in fewer lower level medical staff, but had no effect on doctors. New doctors were less likely to join the PHC, but the effect was not significant and the rate was similar to the percentage that left. In contrast, new staff for lower level positions nurses, lab technicians and pharmacists were significantly less likely to join the treatment PHCs than the control and at a rate that exceeded exit out of the treatment group. Thus, as a result of the project, there were about 3 percent fewer lower level medical staff in the treatment group (Column 4, Panel C). 23 The low level of staff expectations and reluctance and/or inability to fully enforce the existing rules also is present among the local-level bureaucrats and politicians in charge of monitoring the PHCs. The 15 sub-district health officers (local bureaucrats) that we interviewed reported low expectations for staff attendance, despite the formal rules on the books: they believed that a doctor should only be present at the PHC about half of the expected working days. This translated to the fact that they mostly approved all exemptions that the treatment doctors asked for as part of the system, and thus helped the doctors bypass the attendance rules that the machines aimed to enforce. In fact, it appears that attendance is not particularly salient within the set of criterion that they use to evaluate the PHCs: when we asked them to 23 We attempted to quantify the characteristics of those who left and joined, although the results are inconclusive. Doctors who left the treatment PHCs had relatively lower attendance than those who joined the control PHCs in the baseline, but the NLP who left were those attended more in the baseline (Appendix Table 12). There is some qualitative evidence that the new staff nurses who joined the treatment PHCs were relatively more likely to live closer to the PHC than those who joined the control i.e. they were willing to travel further not to be in the treatment group but this is not significant at conventional levels (Appendix Table 13). 23
24 rank the PHCs in their sub-district from best performing to least performing, we find no relationship between their rankings and the attendance of the staff (Appendix Table 14). Even when the state government tried to motivate the sub-district officers to better implement the system, it appears that their efforts were ineffective. Three times during the course of the project, the Director of the National Rural Health Mission of Karnataka set up a video conference call with all subdistrict officials to chastise them for the poor attendance of the PHC staff that they managed and to order them to ensure that the staff were using the machines and taking leave days when absent. As we know the dates of the video conferences, and have detailed daily attendance from the machines, we can conduct an event analysis to test the impact of these video conferences. Figure 5 shows no systematic increase in attendance in the days following the video conferences, suggesting that the local bureaucrats did not follow up successfully with the PHCs to increase attendance even when the state government ordered them to do so. These lower level bureaucrats may have little incentive to enforce the rules: if they enforce them, the health officers would have to handle complaints by PHC staff and they get no personal return in terms of their careers. On the other hand, local elected politicians in India, the Grand Panchayet, or GP--may have better incentives than bureaucrats to monitor PHC staff to be present: if service provision if low, they could be voted out of office. Yet, even here, we observe interesting patterns. Specifically, we interviewed GPs to learn whether they had heard of the system to understand how engaged they were with the health sector; about 34.5 percent of GPs across both the treatment and control catchments had heard of the system. We then tested whether the effect of the program varied by this characteristic. To do so, we regress the attendance of the PHC staff on a dummy for treatment status, a dummy for whether the GP heard of the program and the interaction between these two variables; we also include sub-district fixed effects and cluster by PHC. In control group areas, attendance of doctors was 10 percentage points higher in areas where GPs had heard of the program than in areas where they did not; thus, active GPs are correlated with higher doctor attendance (Column 2). However, all the of the treatment effect occurred for all types of staff members in areas where the GP had not heard of the program (Columns 1-3). This implies that even though the active GPs expected higher attendance from doctors than non-active ones, they did not expect it to increase further when provided with the tools to do so. Furthermore, GPs in the treatment areas that had heard of the program were as equally satisfied with doctor availability as those GPs that had not heard of the program (Column 4). In fact, despite the high 24
25 rates of absenteeism, GPs were generally satisfied with the doctor s attendance: 77 percent were either satisfied or very satisfied with their attendance. V. CONCLUSION We evaluate government reform that employed a technological solution to monitor the presence of bureaucrats for the purpose of using the data to enforce the staff s actual contracts for attendance. The underlying idea for these kind of reforms stem from our models of bureaucratic behavior (such as Banerjee, 1997): increasing the probability that a bureaucrat is caught and penalized for bad behavior can improve performance. Providing monitoring and incentives of this type within the NGO context has been shown to be very successful and sustainable over time in reducing absenteeism and improving service outcomes (Duflo, Hanna and Ryan, 2012). However, we find that this was not the case within the government context. Doctor attendance did not change. The attendance of lower level health staff (nurses, lab technicians, and pharmacists) increased, but only when the research team provided monitoring support and feedback to NRHM leadership to ensure that the system was in place and working. Despite conceiving the intervention, piloting it, and raising funds for it prior to the research team being involved, the government never actually followed through on penalizing anyone who was absent. Even with imperfect implementation, there were substantial health gains while the program was operating: baby birth weight increase by 67 grams in the catchment area of the treatment PHCs, with a 4.6 percentage point decrease or a 26 percent decline in the probability of being born below 2500 grams. Deliveries by doctors increased considerably, and some of this could have been due to better antenatal care and triage by the lower level staff. However, the women were much less likely to deliver at the PHC (instead delivering at larger public hospitals and the private clinics that the staff often moonlight at), delivery costs increased and knowledge of state entitlements fell illustrating that a reform in one aspect of work (absenteeism) potentially led other forms of corruption to increase. More importantly, the intervention illustrates the conflicting demands within the system. Unlike the NGO context where the financial penalties were enforced, the government never full enforced the staffs contracts, even when they now had the better data to do so). As we discussed, some of this was due to the fact that it was administratively challenging to actual cut leave balances. However, this was also due to a fear that the government would have a harder time managing staff if they were not happy, as 25
26 well as a fear that it would be harder to retain and recruit staff given their potential opportunities in the private market. Both of these fears were not entirely unfounded. Taken all together, the findings suggest that while improving attendance has the potential to greatly improve health outcomes, hoping that simply using innovative technology solutions to better monitor staff will not be a sustainable way to achieve these gains because the devil is in the details of the implementation of the program and effective enforcement of the incentives and penalties with minimal discretion. This naturally leads to many open research questions of how to best organize the work structure of government systems: can non-monetary aspects of the jobs be improved in ways that better incentivize staff and/or recruit those who are more intrinsically motivated? Or do we need broader reforms to how governments provide services, from changing the responsibly of remote government health centers to becoming triage centers to incentizing private health care providers to operate in remote areas? 26
27 Work Cited Acemoglu Daron, Simon Johnson, and James A. Robinson The Colonial Origins of Comparative Development: An Empirical Investigation. The American Economic Review, 91(5): Acemoglu, Daron A Simple Model of Inefficient Institutions. The Scandinavian Journal of Economics, 108: Banerjee Abhijit, Raghabendra Chattopadhyay, Esther Duflo, Daniel Keniston, Nina Singh Can Institutions Be Reformed From Within? Evidence From A Randomized Experiment With The Rajasthan Police. National Bureau of Economic Research Working Paper Banerjee, Abhijit, Esther Duflo, Rachel Glennerster Putting a Band-Aid on a Corpse: Incentives for Nurses in the Indian Public Health Care System. Journal of the European Economic Association, 6(2-3): Björkman, Martina, and Jakob Svensson Power to the People: Evidence from a Randomized Field Experiment on Community-Based Monitoring in Uganda. Quarterly Journal of Economics, 124(2): Callen, Michael, Saad Gulzarz, Ali Hasanain, and Yasir Khan The Political Economy of Public Employee Absence: Experimental Evidence from Pakistan. MIMEO. Devarajan Shanta, William Easterly, and Howard Pack The Cartel of Good Intentions: The Problem of Bureaucracy in Foreign Aid. Journal of Policy Reform, 5(4): Deininger, Klaus, and Aparajita Goyal Going digital: Credit effects of land registry computerization in India. Journal of Development Economics, 99: Duflo Esther, Michael Greenstone, Rohini Pande, and Nicholas Ryan Truth-telling by Third-party Auditors and the Response of Polluting Firms: Experimental Evidence from India. Quarterly Journal of Economics, 128(4): Duflo, Esther, Rema Hanna, and Stephen P. Ryan "Incentives Work: Getting Teachers to Come to School." American Economic Review, 102(4): Fujiwara, Thomas Voting Technology, Political Responsiveness, and Infant Health: Evidence from Brazil. Muralidharan, Karthik, Paul Niehaus and Sandip Sukhtankar Building State Capacity: Biometric Identification and the Delivery of Public Programs in India. MIMEO. 27

28 Figure 1: Medical Information and Disease Surveillance System
29 Implementation Training Mysore Implementation Mysore Training Other Districts All Other Districts Subdistrict Officer Refresher Training Video Conferences Figure 2: Project Timeline J A S O N D J F M A M J J A S O N D J F M A M J J A S O N D Surveys Baseline 1 Baseline 2 Follow-Up 1 Follow-Up 2 Follow-Up 3 Follow-Up 4 Follow-Up 5 Follow-Up 6 Follow-Up 7 Endline

30 Figure 3: Presence by Follow-Up Round Note: These figures plot attendance rates for the treatment and control groups by follow-up round, net of sub-district fixed effects.


31 Figure 4: Presence by Time of Day Note: These figures plot attendance rates for the treatment and control groups by time of day, net of sub-district fixed effects.
 of time before and after the three video conferences (relative to days that were not within two months of the video conferences).")
32 Figure 5: Event Study for Video Conferences on Attendance Note: The figure above represents a regression of daily attendance (as measured by the IMIDSS system) on 20 dummy variables (in sets of three days) of time before and after the three video conferences (relative to days that were not within two months of the video conferences). We control for day of the week, month of the year, whether a random check was conducted on that day at the PHC, and subdistrict fixed effects. The dotted lines represent 95% confidence interval around the coefficients; the standard errors are clustered by PHC.
33 Table 1: Descriptive Baseline Statistics Mean Std N (1) (2) (3) Panel A. Facility Survey, July 2010 PHC Open 24 x Number of Villages Served Number of Patients Seen Daily Doctor Vacant Staff Nurse Vacant Pharmacist Vacant Lab Technician Vacant Panel B: Presence, July 2010 All Staff Medical Staff Doctor Nurse, Lab Technician, Pharmacist Panel C: Presence, May 2011 All Staff Medical Staff Doctor Nurse, Lab Technician, Pharmacist Note: This table provides sample statistics from the baseline survey. The data presented in Panel A come from a facility survey that we conducted in 2010, while the data presented in Panels B and C come from the surprise random checks on the primary health centers. A post is vacant if there is at least one sanctioned position that is vacant at the time of survey.
34 Table 2: Was the System Received and Used? Data Source Mean N (1) (2) (3) PHC received device and mobile phone Random Check Device and mobile phone both currently functioning Random Check Data successfully transferred the day before the random check Random Check Data was sent on the data prior to the random check Administrative Data Note: This table provides information on the receipt and use of the IMIDSS system from both the random checks and the administrative data.
35 Table 3: Reduced Form Effect on Attendance (Random Checks) Nurse, Lab Technician, All Staff Medical Staff Doctors Pharmacist Indicator for Doctor or Nurse Presence (1) (2) (3) (4) (5) Treat ** *** *** (0.0137) (0.0165) (0.0264) (0.0194) (0.0384) Baseline Value 0.230*** 0.144*** *** (0.0173) (0.0213) (0.0358) (0.0258) (0.129) Observations 8,084 4,659 1,363 3,296 1,440 Control Group Mean Note: This table provides the reduced form effect of belonging to a treatment PHC on attendance, by type of staff member. In Columns 1 to 4, an observation is an individual staff member and the outcome is a dummy variable that indicates whether that staff member was present; in Column 5, an observation is a PHC and the outcome is a dummy variable for whether at least one nurse or doctor is present. All regressions are estimated by OLS, include a baseline control and sub-district fixed effects, and are clustered by primary health center. If the baseline value is missing, we assign the average baseline attendance and include a dummy variable for when the baseline value was imputed. *** p<0.01, ** p<0.05, * p<0.1
36 Table 4: Reduced Form Effect on Health Care Delivery (Pregnancy Survey) Birth Outcomes Antenatal Care Received at least 2 tetanus shots Received at least 100 IFA tablets or 2 IFA bottles Birth Weight (Grams) Low Birth Weight Number of antenatal check-ups (1) (2) (3) (4) (5) Treat 66.85* * ** (38.21) (0.0272) (0.235) (0.0247) (0.0410) Observations Control Group Mean Note: This table provides the reduced form effect of belonging to a treatment PHC on birth outcomes and antenatal care. All regressions are estimated by OLS, include sub-district fixed effects, and are clustered by primary health center. IFA stands for Iron Folic Acid Tablets. *** p<0.01, ** p<0.05, * p<0.1.
37 Table 5A: Reduced Form Effect on Type of Delivery (Pregnancy Survey) Who performed delivery? Delivery Location Doctor Nurse Other Home NGO or Subcenter PHC Large Public or Private Hospital Large Public Hospital Private Hospital (1) (2) (3) (4) (5) (6) (7) (8) (9) Treat ** * ** ** 0.102*** (0.0362) (0.0367) (0.0164) (0.0114) (0.0100) (0.0351) (0.0373) (0.0401) (0.0327) Observations Control Group Mean Note: This table provides the reduced form effect of belonging to a treatment PHC on type of delivery. All regressions are estimated by OLS, include sub-district fixed effects, and are clustered by primary health center. *** p<0.01, ** p<0.05, * p<0.1.
38 Table 5B: Reduced Form Effect on Satisfaction and Costs (Pregnancy Survey) Standardized Satisfaction Index Entitlements Staff Availability Staff Quality Log (Cost) Knowledge Received (1) (2) (3) (4) (5) Treat * *** *** (0.0777) (0.0882) (0.215) (0.0557) (0.0802) Observations Control Group Mean Note: This table provides the reduced form effect of belonging to a treatment PHC on patient satisfaction, delivery cost, and entitlements. All regressions are estimated by OLS, include sub-district fixed effects, and are clustered by primary health center. The satisfaction variables range from 1 ("very dissatisfied") and 4 ("very satisfied"); we standardized these varaibles and averaged them by category. The entitlements are the state programs that women are entitled to upon delivery, regardless of delivery location. *** p<0.01, ** p<0.05, * p<0.1.
39 Table 6: Management of PHC by Doctors Means Treatment Control Difference (1) (2) (3) PHC received monthly attendance report 0.53 [0.50] 515 Staff leave accounts updated based on report 0.47 [0.50] 502 Faced problem with PHC staff in last three months [0.39] [0.34] (0.048) Issued show cause notice in the last three months [0.26] [0.28] (0.032) Dismissals [0.28] [0.43] (0.045) Note: This table provides information on how doctors manage the PHC staff and enforce disciplinary rules.
40 Table 7: Staff Satisfaction Measures Doctors and Nurses Doctors Condition of PHC Building Opportunities for Weekly Power or Authority for Attendance of PHC staff Performance of PHC staff Overall Work Environment Location of PHC and Equipment Salary and Benefits Job Stability Professional Growth Work Load Holidays Given Appreciation by community Managing PHC who report to you who report to you (1) (2) (3) (4) (5) (6) (7) (8) (9) (10) (11) (12) Panel A. All Staff Treat ** ** ** (0.0298) (0.0309) (0.0420) (0.0488) (0.0332) (0.0482) (0.0455) (0.0475) (0.0205) (0.0450) (0.0361) (0.0381) Observations Control Group Mean Panel B. Only Staff who Joined Prior to Implementation Treat ** * ** (0.0352) (0.0330) (0.0480) (0.0558) (0.0379) (0.0553) (0.0520) (0.0518) (0.0245) (0.0499) (0.0416) (0.0421) Observations Control Group Mean Note: This table provides the reduced form effect of belonging to a treatment PHC on employee satisfaction. All regressions are estimated by OLS, include sub-district fixed effects, and are clustered by primary health center. Each outcome is a dummy variable where 1 indicates satisfied or very satisfied and 0 otherwise. All staff members that we interviewed are listed in Panel A, while we restrict the analysis to only those who joined prior to the implementation of the program in Panel B. Note: For all staff jointly (Panel A), the joint chi-sq test across the variables has a value of with prob > chi-sq = For only existing staff (Panel B), the joint chi-sq test has a value of with prob > chi-sq = *** p<0.01, ** p<0.05, * p<0.1.
41 Table 8: Movement Into and Out of the PHCs All Staff Medical Staff Doctors Nurse, Lab Technician, Pharmacist (1) (2) (3) (4) Panel A: Indicator Variable for Left Treat (0.0176) (0.0221) (0.0375) (0.0258) Control Group Mean Panel B: Indicator Variable for Joined After Implementaion Began Treat ** ** (0.0154) (0.0202) (0.0366) (0.0215) Control Group Mean Observations 3,037 1, ,258 Panel C: Number of staff at each followup Treat * (0.113) (0.0767) (0.0429) (0.0623) Observations 1,361 1,361 1,361 1,361 Mean of Control Group Note: In Panel A and B, an observation is an individual and the outcome is an indicator variable, respectively, for whether the indivdiual either left or joined the survey at any point in time. In Panel C, the observation is a PHC at the given follow-up, and the outcome is the number of staff members employed at that point in time. *** p<0.01, ** p<0.05, * p<0.1.
42 Table 9: Reduced Form Effect of Treatment, by Local Government Involvement Attendance Satisfaction Medical Staff Doctors Nurse, Lab Technician, Pharmacist with doctor availability with nurse availability (1) (2) (3) (4) (5) Treat 0.107*** 0.151*** *** * (0.0249) (0.0432) (0.0294) (0.177) (0.203) Heard of Program * (0.0351) (0.0558) (0.0462) (0.262) (0.305) Treat * Heard of Program ** *** (0.0463) (0.0755) (0.0607) (0.345) (0.369) Observations 2, , Control Group Mean Note: This table provides the reduced form effect of belonging to a treatment PHC, by whether the local government has heard of the program. The outcomes in Columns 1-3 are staff attendance, while they are local government satisfaction with the health center in Columns 4 and 5 (these range from 4 being very satisfied to 1 being very unsatisfied). All regressions are estimated by OLS, include sub-district fixed effects, and are clustered by primary health center. *** p<0.01, ** p<0.05, * p<0.1.
43 Appendix Table 1: Attrition Check on Endline Survey Doctors Nurses (1) (2) Treat (0.0450) (0.0515) Observations Mean of Control Group Note: The outcome variable is an indicator variable for a PHC not being surveyed, either due to having a vacancy in the position or due to the staff member being repeatedly unavailable during the survey. *** p<0.01, ** p<0.05, * p<0.1.
44 Appendix Table 2: Effect of Treatment on Infant Mortality Indicator for Stillbirth or Miscarriage (1) Treat ( ) Observations 2,598 Control Group Mean Note: This table looks at the effect of belonging to the catchment area of a PHC group on still births and miscarriages. *** p<0.01, ** p<0.05, * p<0.1.
45 Appendix Table 3: Randomization Check Mean Treatment Control Difference (1) (2) (3) A: Facility Survey Number of Sub-Centers [2.52] [2.37] (0.23) 24/7 PHC [0.49] [0.49] (0.05) Number of daily patients [41.64] [39.18] (4.62) Number of examination beds [0.9] [0.88] (-0.1) Has working toilet [0.43] [0.41] (0.04) Has drinking water [0.42] [0.44] (0.05) Has broken windows [0.46] [0.44] (0.05) Has clean walls [0.50] [0.50] (0.06) Has clean floors [0.49] [0.50] (0.05) Has pharmacy [0.32] [0.34] (0.04) Number of medicines in stock [2.76] [3.12] (0.25) Number of vaccines in stock [2.33] [2.26] (0.31) B. Attendance Measures All Staff * [0.21] [0.17] (0.02) Medical Staff [0.26] [0.24] (0.03) Doctor [0.36] [0.35] (0.04) Nurse, Lab Technician, Pharmac [0.30] [0.31] (0.03) Note: This table provides a check on the randomization. For the facility data (Panel A), the joint chi-sq test across the variables with fixed effects has a value of 7.71 with prob > chi-sq = For the attendance data (Panel B), the joint chi-sq test with fixed effects has a value of 5.24 with prob > chi-sq =
46 Appendix Table 4: Test For Hawthorne Effects Nurse, Lab Technician, Pharmacist Indicator for Doctor or Nurse Presence All Staff Medical Staff Doctors (1) (2) (3) (4) (5) Monitoring Status ( ) (0.0102) (0.0164) (0.0119) (0.0215) Observations 8,084 4,659 1,363 3,296 1,440 Note: This table provides the reduced form effect of being monitored more heavily in the random checks, by type of staff member. In Columns 1 to 4, an observation is an individual staff member and the outcome is a dummy variable that indicates whether that staff member was present; in Column 5, an observation is a PHC and the outcome is a dummy variable for whether at least one nurse or doctor is present. All regressions are estimated by OLS, include a baseline control and sub-district fixed effects, and are clustered by primary health center. If the baseline value is missing, we assign the average baseline attendance and include a dummy variable for when the baseline value was imputed. *** p<0.01, ** p<0.05, * p<0.1
47 Appendix Table 5: Monitoring By Sub-district and Community Sub-district Health Officer Community Number of visits the sub-district officer conducted MO attended GP meeting in past 3 months (dummy) GP inspected PHC in past 3 months (dummy) Number of inspections GP conducted Visited the PHC in last month (dummy) Number of meetings MO attended (1) (2) (3) (4) (5) (6) Treat (0.0504) (0.109) (0.0685) (0.242) (0.0510) (1.050) Observations Control Group Mean Note: This table explores whether the sub-district health officers and local government bodies differentially monitored the PHCs by treatment status. *** p<0.01, ** p<0.05, * p<0.1
48 Appendix Table 6: Reduced Form Effect on Attendance (Random Checks), Robustness to Controls All Staff Medical Staff Doctors Nurse, Lab Technician, Pharmacist (1) (2) (3) (4) (5) A. No Baseline Measure Indicator for Doctor or Nurse Presence Treat ** *** *** (0.0137) (0.0166) (0.0264) (0.0197) (0.0386) Observations 8,084 4,659 1,363 3,296 1,440 Control Group Mean B. No Baseline Measure Nor Sub-District Fixed Effects Treat ** ** (0.0163) (0.0192) (0.0280) (0.0227) (0.0395) Observations 8,084 4,659 1,363 3,296 1,440 Control Group Mean C. Gender, Years at PHC, Baseline Attendance and Sub-district Fixed Effects Treat ** *** *** (0.0137) (0.0164) (0.0265) (0.0194) Observations 8,084 4,659 1,363 3,296 Control Group Mean Note: This table replicates Table 3, but varies the control variables that are included. In Columns 1 to 4, an observation is an individual staff member and the outcome is a dummy variable that indicates whether that staff member was present; in Column 5, an observation is a PHC and the outcome is a dummy variable for whether at least one nurse or doctor is present. All regressions are estimated by OLS and are clustered by PHC. If a control variable has a missing value, we assign the average and include a dummy variable to indictate when it was imputed.*** p<0.01, ** p<0.05, * p<0.1
49 Appendix Table 7: Reduced Form Effect on Attendance (Random Checks), Robustness to Sample All Staff Medical Staff Doctors Nurse, Lab Technician, Pharmacist Indicator for Doctor or Nurse Presence (1) (2) (3) (4) (5) Panel A: Including New Staff Members Treat ** *** *** (0.0129) (0.0161) (0.0269) (0.0179) (0.0384) Observations 9,057 5,235 1,553 3,682 1,441 Control Group Mean Panel B: Balanced Panel Only Treat ** *** *** (0.0145) (0.0171) (0.0287) (0.0203) (0.0380) Observations 7,117 4,162 1,152 3,010 1,435 Control Group Mean Note: This table replicates Table 3, but varies the included sample. In Panel A, we include everyone, including staff members that joined the PHC. In Panel B, we only include staff members who were present in all follow-up rounds. In Columns 1 to 4, an observation is an individual staff member and the outcome is a dummy variable that indicates whether that staff member was present; in Column 5, an observation is a PHC and the outcome is a dummy variable for whether at least one nurse or doctor is present. All regressions are estimated by OLS, include the baseline attendance measure, and are clustered by PHC. *** p<0.01, ** p<0.05, * p<0.1
50 Appendix 8: Attendance Results, by Staff Type (1) Treat X "Doctor Dummy" (0.0239) Treat X "Nurse Dummy" *** (0.0226) Treat X "Lab Tech or Pharmacist Dummy" *** (0.0275) Test Doctors = Nurses F(1,320) Prob > F Test Doctor = L/P F(1,320) Prob > F Test Nurse = L/P F(1,320) 0.31 Prob > F Observations 4,659 Control Group Mean Note: This table estimates the treatment effect (from Table 3) seperately by doctor, nurse, and lab technician/pharmacist. The regression is estimated by OLS, includes the baseline attendance measure, and is clustered by PHC. *** p<0.01, ** p<0.05, * p<0.1
51 Appendix Table 9: Reduced Form Effect on Attendance, by District (Random Checks) All Staff Medical Staff Doctors Nurse, Lab Technician, Pharmacist Indicator for Doctor or Nurse Presence (1) (2) (3) (4) (5) Panel A. Mysore Treat ** (0.0247) (0.0327) (0.0416) (0.0404) (0.0678) Observations 3,329 1, , Control Group Mean Panel B. Dakskin Kannada Treat ** * (0.0297) (0.0379) (0.0602) (0.0445) (0.0790) Observations 1, Control Group Mean Panel C. Chitradurga Treat ** * ** (0.0294) (0.0348) (0.0545) (0.0448) (0.0838) Observations 1, Control Group Mean Panel D. Dharwad Treat ** (0.0447) (0.0435) (0.119) (0.0428) (0.109) Observations Control Group Mean Panel E. Bidar Treat (0.0329) (0.0322) (0.0778) (0.0351) (0.0735) Observations 1, Control Group Mean Note: This table replicates Table 3, by district. In Columns 1 to 4, an observation is an individual staff member and the outcome is a dummy variable that indicates whether that staff member was present; in Column 5, an observation is a PHC and the outcome is a dummy variable for whether at least one nurse or doctor is present. All regressions are estimated by OLS, include a baseline control and sub-district fixed effects, and are clustered by primary health center. If the baseline value is missing, we assign the average baseline attendance and include a dummy variable for when the baseline value was imputed. *** p<0.01, ** p<0.05, * p<0.1
52 Appendix Table 10: Reduced Form Effect on Attendance (Random Checks), Heterogeneity By PHC Type Nurse, Lab Technician, Pharmacist Indicator for Doctor or Nurse Presence All Staff Medical Staff Doctors (1) (2) (3) (4) (5) Treat *** *** *** (0.0206) (0.0263) (0.0348) (0.0335) (0.0453) 24x7 PHC *** (0.0186) (0.0241) (0.0374) (0.0295) (0.0412) Treat x 24x7 PHC * * ** (0.0270) (0.0329) (0.0533) (0.0398) (0.0616) Observations 8,084 4,659 1,363 3,296 1,440 Mean of Control Group Note: This table replicates explore the effect of belonging to the treatment group, by whether the PHC is open 24 hours a day. In Columns 1 to 4, an observation is an individual staff member and the outcome is a dummy variable that indicates whether that staff member was present; in Column 5, an observation is a PHC and the outcome is a dummy variable for whether at least one nurse or doctor is present. All regressions are estimated by OLS, include a baseline control and sub-district fixed effects, and are clustered by primary health center. If the baseline value is missing, we assign the average baseline attendance and include a dummy variable for when the baseline value was imputed. *** p<0.01, ** p<0.05, * p<0.1
53 Appendix Table 11: Number of Patients Patients Waiting at PHC Women in Beds for Childbirth Patients in Beds (1) (2) (3) Treat (0.390) (0.0786) (0.0247) Observations 1,433 1,433 1,433 Control Group Mean Note: This table replicates explore the effect of belonging to the treatment group on the number of patients present. All regressions are estimated by OLS, include a baseline control and sub-district fixed effects, and are clustered by primary health center. *** p<0.01, ** p<0.05, * p<0.1
54 Appendix Table 12: Do the Staff that Left Differ in Baseline Attendance? All Staff Medical Staff Only Doctors Only N/L/P Only (1) (2) (3) (4) Treat (0.0210) (0.0254) (0.0463) (0.0277) Left *** *** *** *** (0.0210) (0.0265) (0.0461) (0.0333) Treat * Left ** 0.104** (0.0317) (0.0431) (0.0676) (0.0506) Observations 4,653 2, ,949 Control Group Mean Note: This table explores the baseline characteristics for those who left the PHC, by treatment status. *** p<0.01, ** p<0.05, * p<0.1
55 Appendix Table 13: Characteristics of New Staff Distance to get Live locally to work (dummy) Treat (2.290) (0.0505) New 7.771* ** (4.136) (0.0671) Treat * New (5.289) (0.109) Observations Control Group Mean Note: This table explores the baseline characteristics for those who left the PHC, by treatment status. *** p<0.01, ** p<0.05, * p<0.1
56 Appendix Table 14: Correlation Between Rank Quality, Attendance and Treatment Rank Attendance Attendance (1) (2) (3) Panel A: No Fixed Effects treat (0.0949) (0.0250) (0.0563) rank (0.0521) (0.0887) treat * rank (0.120) Panel B: Include Sub-District Fixed Effects treat (0.106) (0.0223) (0.0637) rank (0.0543) (0.0870) treat * rank (0.111) Observations Control Group Mean Note: This table explores relationship between the sub-district health officials rankings of PHCs in their subdistrict, attendance, and rankings. *** p<0.01, ** p<0.05, * p<0.1
57 Appendix Table 15: Interactions with Local Government, With Additional Controls Satisfaction with Presence of Medical Staff Presence of Doctors only Presence of N/L/P doctor availability Satisfaction with nurse availability (1) (2) (3) (4) (5) treat 0.106*** 0.165*** *** (0.0263) (0.0484) (0.0283) (0.177) (0.211) heard * (0.0430) (0.0577) (0.0565) (0.281) (0.289) heard_treat ** ** (0.0516) (0.0778) (0.0672) (0.342) (0.376) 24 Hour PHC ** 0.350** 0.829*** (0.0258) (0.0445) (0.0311) (0.170) (0.185) Gender President * (0.0216) (0.0405) (0.0251) (0.155) (0.171) Caste (0.0253) (0.0465) (0.0291) (0.187) (0.200) Caste ** (0.0335) (0.0539) (0.0362) (0.236) (0.260) Caste (0.0386) (0.0683) (0.0420) (0.309) (0.321) Tenure President * ( ) ( ) ( ) ( ) ( ) Observations 2, , Mean of Control Group


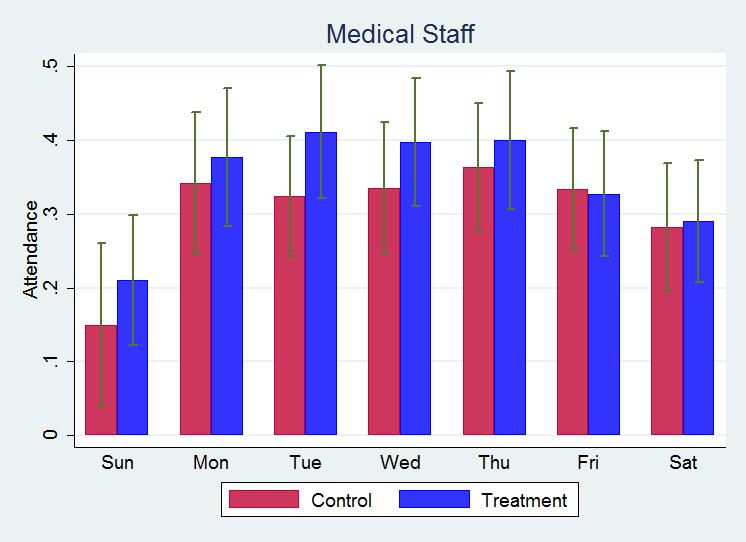
58 Appendix Figure 1: Attendance, by Day of the Week
Improving Health Outcomes Incentives for Immunization and Reliable Services
 Session 1, Part A: 9:30am 10:15am Improving Health Outcomes Incentives for Immunization and Reliable Services Rachel Glennerster & Neelima Khetan The poor in rural Rajasthan spend a lot on health care
Appendix. We used matched-pair cluster-randomization to assign the. twenty-eight towns to intervention and control. Each cluster,
 Yip W, Powell-Jackson T, Chen W, Hu M, Fe E, Hu M, et al. Capitation combined with payfor-performance improves antibiotic prescribing practices in rural China. Health Aff (Millwood). 2014;33(3). Published
NIH Public Access Author Manuscript J Eur Econ Assoc. Author manuscript; available in PMC 2010 February 23.
 NIH Public Access Author Manuscript Published in final edited form as: J Eur Econ Assoc. 2008 ; 6(2-3): 487 500. doi:10.1162/jeea.2008.6.2-3.487. PUTTING A BAND-AID ON A CORPSE: INCENTIVES FOR NURSES IN
Working Paper Series
 The Financial Benefits of Critical Access Hospital Conversion for FY 1999 and FY 2000 Converters Working Paper Series Jeffrey Stensland, Ph.D. Project HOPE (and currently MedPAC) Gestur Davidson, Ph.D.
2013 Workplace and Equal Opportunity Survey of Active Duty Members. Nonresponse Bias Analysis Report
 2013 Workplace and Equal Opportunity Survey of Active Duty Members Nonresponse Bias Analysis Report Additional copies of this report may be obtained from: Defense Technical Information Center ATTN: DTIC-BRR
Quality Management Building Blocks
 Quality Management Building Blocks Quality Management A way of doing business that ensures continuous improvement of products and services to achieve better performance. (General Definition) Quality Management
GAO. DEPOT MAINTENANCE The Navy s Decision to Stop F/A-18 Repairs at Ogden Air Logistics Center
 GAO United States General Accounting Office Report to the Honorable James V. Hansen, House of Representatives December 1995 DEPOT MAINTENANCE The Navy s Decision to Stop F/A-18 Repairs at Ogden Air Logistics
The challenge of delivering healthcare to the poor: Udaipur Example. Improving Health Status
 The challenge of delivering healthcare to the poor: Udaipur Example. Esther Duflo, 14.73, October 28, 2009 povertyactionlab.org Improving Health Status Seva Mandir was keen to find new interventions for
December 15, 1995 No. 17
 WASHINGTON WATCH An update on federal action from The Center for Public Policy Priorities 900 Lydia Street Austin, Texas 78702 512-320-0222 voice 512-320-0227 fax December 15, 1995 No. 17 A Brief Update
Primary care P4P in Portugal
 Primary care P4P in Portugal Country Background Note: Portugal Alexandre Lourenço, Nova School of Business and Economics, Coimbra Hospital and University Centre February 2016 1 Primary care P4P in Portugal
National Science Foundation Annual Report Components
 National Science Foundation Annual Report Components NSF grant PIs submit annual reports to NSF via the FastLane system at fastlane.nsf.gov. This document is a compilation of the FastLane annual reports
Free to Choose? Reform and Demand Response in the British National Health Service
 Free to Choose? Reform and Demand Response in the British National Health Service Martin Gaynor Carol Propper Stephan Seiler Carnegie Mellon University, University of Bristol and NBER Imperial College,
CITY OF GRANTS PASS SURVEY
 CITY OF GRANTS PASS SURVEY by Stephen M. Johnson OCTOBER 1998 OREGON SURVEY RESEARCH LABORATORY UNIVERSITY OF OREGON EUGENE OR 97403-5245 541-346-0824 fax: 541-346-5026 Internet: OSRL@OREGON.UOREGON.EDU
Primary Care Workforce Survey 2013
 Experimental Report Primary Care Workforce Survey 2013 Out of Hours GP Services Strand Sections 1,2,3 and 6 Publication Date 19 November 2013 Contents Introduction... 2 Method of completing the survey...
2015 Lasting Change. Organizational Effectiveness Program. Outcomes and impact of organizational effectiveness grants one year after completion
 Organizational Effectiveness Program 2015 Lasting Change Written by: Outcomes and impact of organizational effectiveness grants one year after completion Jeff Jackson Maurice Monette Scott Rosenblum June
Fertility Response to the Tax Treatment of Children
 Fertility Response to the Tax Treatment of Children Kevin J. Mumford Purdue University Paul Thomas Purdue University April 2016 Abstract This paper uses variation in the child tax subsidy implicit in US
how competition can improve management quality and save lives
 NHS hospitals in England are rarely closed in constituencies where the governing party has a slender majority. This means that for near random reasons, those parts of the country have more competition
Summary of Findings. Data Memo. John B. Horrigan, Associate Director for Research Aaron Smith, Research Specialist
 Data Memo BY: John B. Horrigan, Associate Director for Research Aaron Smith, Research Specialist RE: HOME BROADBAND ADOPTION 2007 June 2007 Summary of Findings 47% of all adult Americans have a broadband
INPATIENT SURVEY PSYCHOMETRICS
 INPATIENT SURVEY PSYCHOMETRICS One of the hallmarks of Press Ganey s surveys is their scientific basis: our products incorporate the best characteristics of survey design. Our surveys are developed by
Employee Telecommuting Study
 Employee Telecommuting Study June Prepared For: Valley Metro Valley Metro Employee Telecommuting Study Page i Table of Contents Section: Page #: Executive Summary and Conclusions... iii I. Introduction...
Title: Preparedness to provide nursing care to women exposed to intimate partner violence: a quantitative study in primary health care in Sweden
 Author's response to reviews Title: Preparedness to provide nursing care to women exposed to intimate partner violence: a quantitative study in primary health care in Sweden Authors: Eva M Sundborg (eva.sundborg@sll.se)
Chapter 1 Duties, Obligations and Privileges 1.6 HOURS OF WORK
 Chapter 1 Duties, Obligations and Privileges 1.6 HOURS OF WORK 1.6.1 A common workweek (number of scheduled hours of work in a week) at each duty station is agreed upon by the Heads of UN Organisations
Community CCT in Indonesia The Generasi Project
 Community CCT in Indonesia The Generasi Project November 12 th, 2008 Junko Onishi jonishi@jhsph.edu Two Pilot Projects In 2007 GoI started two pilot projects: Household CCT the traditional model Quarterly
Report on the Pilot Survey on Obtaining Occupational Exposure Data in Interventional Cardiology
 Report on the Pilot Survey on Obtaining Occupational Exposure Data in Interventional Cardiology Working Group on Interventional Cardiology (WGIC) Information System on Occupational Exposure in Medicine,
PANELS AND PANEL EQUITY
 PANELS AND PANEL EQUITY Our patients are very clear about what they want: the opportunity to choose a primary care provider access to that PCP when they choose a quality healthcare experience a good value
Primary Care Workforce Survey Scotland 2017
 Primary Care Workforce Survey Scotland 2017 A Survey of Scottish General Practices and General Practice Out of Hours Services Publication date 06 March 2018 An Official Statistics publication for Scotland
Impact of Scholarships
 Impact of Scholarships Fall 2016 Office of Institutional Effectiveness and Analytics December 13, 2016 Impact of Scholarships Office of Institutional Effectiveness and Analytics Executive Summary Scholarships
Inpatient Experience Survey 2012 Research conducted by Ipsos MORI on behalf of Great Ormond Street Hospital
 1 Version 2 Internal Use Only Inpatient Experience Survey 2012 Research conducted by Ipsos MORI on behalf of Great Ormond Street Hospital Table of Contents 2 Introduction Overall findings and key messages
Caregivingin the Labor Force:
 Measuring the Impact of Caregivingin the Labor Force: EMPLOYERS PERSPECTIVE JULY 2000 Human Resource Institute Eckerd College, 4200 54th Avenue South, St. Petersburg, FL 33711 USA phone 727.864.8330 fax
Barriers & Incentives to Obtaining a Bachelor of Science Degree in Nursing
 Southern Adventist Univeristy KnowledgeExchange@Southern Graduate Research Projects Nursing 4-2011 Barriers & Incentives to Obtaining a Bachelor of Science Degree in Nursing Tiffany Boring Brianna Burnette
Cumulative Out-of-Pocket Health Care Expenses After the Age of 70
 April 3, 2018 No. 446 Cumulative Out-of-Pocket Health Care Expenses After the Age of 70 By Sudipto Banerjee, Employee Benefit Research Institute A T A G L A N C E This study estimates how much retirees
THE ROLE OF HOSPITAL HETEROGENEITY IN MEASURING MARGINAL RETURNS TO MEDICAL CARE: A REPLY TO BARRECA, GULDI, LINDO, AND WADDELL
 THE ROLE OF HOSPITAL HETEROGENEITY IN MEASURING MARGINAL RETURNS TO MEDICAL CARE: A REPLY TO BARRECA, GULDI, LINDO, AND WADDELL DOUGLAS ALMOND JOSEPH J. DOYLE, JR. AMANDA E. KOWALSKI HEIDI WILLIAMS In
Analysis of Nursing Workload in Primary Care
 Analysis of Nursing Workload in Primary Care University of Michigan Health System Final Report Client: Candia B. Laughlin, MS, RN Director of Nursing Ambulatory Care Coordinator: Laura Mittendorf Management
(Signed original copy on file)
") CFOP 75-8 STATE OF FLORIDA DEPARTMENT OF CF OPERATING PROCEDURE CHILDREN AND FAMILIES NO. 75-8 TALLAHASSEE, September 2, 2015 Procurement and Contract Management POLICIES AND PROCEDURES OF CONTRACT OVERSIGHT
CFOP 75-8 STATE OF FLORIDA DEPARTMENT OF CF OPERATING PROCEDURE CHILDREN AND FAMILIES NO. 75-8 TALLAHASSEE, September 2, 2015 Procurement and Contract Management POLICIES AND PROCEDURES OF CONTRACT OVERSIGHT
Shifting Public Perceptions of Doctors and Health Care
 Shifting Public Perceptions of Doctors and Health Care FINAL REPORT Submitted to: The Association of Faculties of Medicine of Canada EKOS RESEARCH ASSOCIATES INC. February 2011 EKOS RESEARCH ASSOCIATES
Demographic Profile of the Officer, Enlisted, and Warrant Officer Populations of the National Guard September 2008 Snapshot
 Issue Paper #55 National Guard & Reserve MLDC Research Areas Definition of Diversity Legal Implications Outreach & Recruiting Leadership & Training Branching & Assignments Promotion Retention Implementation
CHAPTER 3. Research methodology
 CHAPTER 3 Research methodology 3.1 INTRODUCTION This chapter describes the research methodology of the study, including sampling, data collection and ethical guidelines. Ethical considerations concern
Are the Non- Monetary Costs of Energy Efficiency Investments Large? Understanding Low Take- up of a Free Energy Efficiency Program
 THE BECKER FRIEDMAN INSTITUTE FOR RESEARCH IN ECONOMICS BFI Working Paper Series No. 2015-01 Are the Non- Monetary Costs of Energy Efficiency Investments Large? Understanding Low Take- up of a Free Energy
THe liga InAn PRoJeCT TIMOR-LESTE
 spotlight MAY 2013 THe liga InAn PRoJeCT TIMOR-LESTE BACKgRoUnd Putting health into the hands of mothers The Liga Inan project, TimorLeste s first mhealth project, is changing the way mothers and midwives
REQUEST FOR PROPOSALS
 REQUEST FOR PROPOSALS Improving the Treatment of Opioid Use Disorders The Laura and John Arnold Foundation s (LJAF) core objective is to address our nation s most pressing and persistent challenges using
Biometric Enrollment Of Conditional Cash Transfer (CCT) Beneficiaries
 Beneficiaries") Biometric Enrollment Of Conditional Cash Transfer (CCT) Beneficiaries 5-May-2011 Cross River State - Ministry of Social Welfare & Community Development Agenda Introduction Background on Cross River State
Biometric Enrollment Of Conditional Cash Transfer (CCT) Beneficiaries 5-May-2011 Cross River State - Ministry of Social Welfare & Community Development Agenda Introduction Background on Cross River State
Making the Business Case
 Making the Business Case for Payment and Delivery Reform Harold D. Miller Center for Healthcare Quality and Payment Reform To learn more about RWJFsupported payment reform activities, visit RWJF s Payment
HIGH SCHOOL STUDENTS VIEWS ON FREE ENTERPRISE AND ENTREPRENEURSHIP. A comparison of Chinese and American students 2014
 HIGH SCHOOL STUDENTS VIEWS ON FREE ENTERPRISE AND ENTREPRENEURSHIP A comparison of Chinese and American students 2014 ACKNOWLEDGEMENTS JA China would like to thank all the schools who participated in
Research Brief IUPUI Staff Survey. June 2000 Indiana University-Purdue University Indianapolis Vol. 7, No. 1
 Research Brief 1999 IUPUI Staff Survey June 2000 Indiana University-Purdue University Indianapolis Vol. 7, No. 1 Introduction This edition of Research Brief summarizes the results of the second IUPUI Staff
Contracts and Grants between Nonprofits and Government
 br I e f # 03 DeC. 2013 Government-Nonprofit Contracting Relationships www.urban.org INsIDe this IssUe In 2012, local, state, and federal governments worked with nearly 56,000 nonprofit organizations.
Survey of the Existing Health Workforce of Ministry of Health, Bangladesh
 Original article Abstract Survey of the Existing Health Workforce of Ministry of Health, Bangladesh Belayet Hossain M.D. 1, Khaleda Begum M.D. 2 1. Professor, Department of Economics, University of Chittagong,
Chapter -3 RESEARCH METHODOLOGY
 Chapter -3 RESEARCH METHODOLOGY i 3.1. RESEARCH METHODOLOGY 3.1.1. RESEARCH DESIGN Based on the research objectives, the study is analytical, exploratory and descriptive on the major HR issues on distribution,
Physician Assistants: Filling the void in rural Pennsylvania A feasibility study
 Physician Assistants: Filling the void in rural Pennsylvania A feasibility study Prepared for The Office of Health Care Reform By Lesli ***** April 17, 2003 This report evaluates the feasibility of extending
GUIDELINES FOR OPERATION AND IMPLEMENTATION OF ONE NORTH CAROLINA FUND GRANT PROGRAM ( the Program )
") GUIDELINES FOR OPERATION AND IMPLEMENTATION OF ONE NORTH CAROLINA FUND GRANT PROGRAM ( the Program ) The following Guidelines for the Program are submitted for publication and comment by the Department
GUIDELINES FOR OPERATION AND IMPLEMENTATION OF ONE NORTH CAROLINA FUND GRANT PROGRAM ( the Program ) The following Guidelines for the Program are submitted for publication and comment by the Department
Hospital Inpatient Quality Reporting (IQR) Program
 Program") Hospital Quality Star Ratings on Hospital Compare December 2017 Methodology Enhancements Questions and Answers Moderator Candace Jackson, RN Project Lead, Hospital Inpatient Quality Reporting (IQR) Program
Hospital Quality Star Ratings on Hospital Compare December 2017 Methodology Enhancements Questions and Answers Moderator Candace Jackson, RN Project Lead, Hospital Inpatient Quality Reporting (IQR) Program
General practitioner workload with 2,000
 The Ulster Medical Journal, Volume 55, No. 1, pp. 33-40, April 1986. General practitioner workload with 2,000 patients K A Mills, P M Reilly Accepted 11 February 1986. SUMMARY This study was designed to
Scenario Planning: Optimizing your inpatient capacity glide path in an age of uncertainty
 Scenario Planning: Optimizing your inpatient capacity glide path in an age of uncertainty Scenario Planning: Optimizing your inpatient capacity glide path in an age of uncertainty Examining a range of
Annex A: State Level Analysis: Selection of Indicators, Frontier Estimation, Setting of Xmin, Xp, and Yp Values, and Data Sources
 Annex A: State Level Analysis: Selection of Indicators, Frontier Estimation, Setting of Xmin, Xp, and Yp Values, and Data Sources Right to Food: Whereas in the international assessment the percentage of
INTRODUCTION TO Mobile Diagnostic Imaging. A quick-start guide designed to help you learn the basics of mobile diagnostic imaging
 INTRODUCTION TO Mobile Diagnostic Imaging A quick-start guide designed to help you learn the basics of mobile diagnostic imaging INTRODUCTION TO Mobile Diagnostic Imaging TABLE OF CONTENTS How does mobile
community clinic case studies professional development
 community clinic case studies professional development LFA Group 2011 Prepared by: Established in 2000, LFA Group: Learning for Action provides highly customized research, strategy, and evaluation services
Risk Adjustment Methods in Value-Based Reimbursement Strategies
 Paper 10621-2016 Risk Adjustment Methods in Value-Based Reimbursement Strategies ABSTRACT Daryl Wansink, PhD, Conifer Health Solutions, Inc. With the move to value-based benefit and reimbursement models,
Assessment of human resources for health Survey instruments and guide to administration
 Assessment of human resources for health Survey instruments and guide to administration Evidence and Information for Policy Department of Health Service Provision World Health Organization Geneva 00 Assessment
Impact Evaluation Concept Note HEALTH MILLENNIUM DEVELOPMENT GOALS PROGRAM-FOR-RESULTS (P4 R) ETHIOPIA
 ETHIOPIA") Impact Evaluation Concept Note HEALTH MILLENNIUM DEVELOPMENT GOALS PROGRAM-FOR-RESULTS (P4 R) ETHIOPIA Development Impact Evaluation Initiative Innovating in Design: Evidence for Impact in Health Cape
Impact Evaluation Concept Note HEALTH MILLENNIUM DEVELOPMENT GOALS PROGRAM-FOR-RESULTS (P4 R) ETHIOPIA Development Impact Evaluation Initiative Innovating in Design: Evidence for Impact in Health Cape
CHAPTER 5 AN ANALYSIS OF SERVICE QUALITY IN HOSPITALS
 CHAPTER 5 AN ANALYSIS OF SERVICE QUALITY IN HOSPITALS Fifth chapter forms the crux of the study. It presents analysis of data and findings by using SERVQUAL scale, statistical tests and graphs, for the
Impact Evaluation Design for Community Midwife Technicians in Malawi
 Impact Evaluation Design for Community Midwife Technicians in Malawi Nathan B.W. Chimbatata, ( Msc. Epi, BscN, Dip Opth), Mzuzu University, Mzuzu, Malawi Chikondi M. Chimbatata, (BscN, pgucm) Kamuzu College
Quality Assurance Program Guide
 2012 2013 Quality Assurance Program Guide Quality Assurance Committee Orientation Manual Quality Assurance Program Table of Contents 1. Overview 2 2. Two Part Register 3 3. Learning Portfolio 7 4. Self-Assessment
GAO MILITARY ATTRITION. Better Screening of Enlisted Personnel Could Save DOD Millions of Dollars
 GAO United States General Accounting Office Testimony Before the Subcommittee on Personnel, Committee on Armed Services, U.S. Senate For Release on Delivery Expected at 2:00 p.m., EDT Wednesday, March
Research Design: Other Examples. Lynda Burton, ScD Johns Hopkins University
 This work is licensed under a Creative Commons Attribution-NonCommercial-ShareAlike License. Your use of this material constitutes acceptance of that license and the conditions of use of materials on this
FRENCH LANGUAGE HEALTH SERVICES STRATEGY
 FRENCH LANGUAGE HEALTH SERVICES STRATEGY 2016-2019 Table of Contents I. Introduction... 4 Partners... 4 A. Champlain LHIN IHSP... 4 B. South East LHIN IHSP... 5 C. Réseau Strategic Planning... 5 II. Goal
Request for Proposals (RFP) for Police Body Worn Camera Systems and Video Storage Solutions For City of Boulder City, Nevada
 for Police Body Worn Camera Systems and Video Storage Solutions For City of Boulder City, Nevada") Request for Proposals (RFP) for Police Body Worn Camera Systems and Video Storage Solutions For City of Boulder City, Nevada Proposals Due: March 22, 2018 by 6:00 p.m. The City of Boulder City, Nevada
Request for Proposals (RFP) for Police Body Worn Camera Systems and Video Storage Solutions For City of Boulder City, Nevada Proposals Due: March 22, 2018 by 6:00 p.m. The City of Boulder City, Nevada
Special Open Door Forum Participation Instructions: Dial: Reference Conference ID#:
 Page 1 Centers for Medicare & Medicaid Services Hospital Value-Based Purchasing Program Special Open Door Forum: FY 2013 Program Wednesday, July 27, 2011 1:00 p.m.-3:00 p.m. ET The Centers for Medicare
Impact of caregiver incentives on child health: Evidence from an experiment with Anganwadi workers in India
 Impact of caregiver incentives on child health: Evidence from an experiment with Anganwadi workers in India Prakarsh Singh and William Masters Amherst College and Tufts University World Bank Workshop January
LOCAL GOVERNMENT CODE OF ACCOUNTING PRACTICE & FINANCIAL REPORTING SUBMISSION RELATING TO THE DISCLOSURE OF
 LOCAL GOVERNMENT CODE OF ACCOUNTING PRACTICE & FINANCIAL REPORTING SUBMISSION RELATING TO THE DISCLOSURE OF GRANTS, SUBSIDIES & OTHER PAYMENTS FROM GOVERNMENT 1. Introduction The NSW Code of Accounting
Fleet and Marine Corps Health Risk Assessment, 02 January December 31, 2015
 Fleet and Marine Corps Health Risk Assessment, 02 January December 31, 2015 Executive Summary The Fleet and Marine Corps Health Risk Appraisal is a 22-question anonymous self-assessment of the most common
Healthcare- Associated Infections in North Carolina
 2018 Healthcare- Associated Infections in North Carolina Reference Document Revised June 2018 NC Surveillance for Healthcare-Associated and Resistant Pathogens Patient Safety Program NC Department of Health
El Salvador: Basic Health Programme in the Region Zona Oriente / Basic health infrastructure
 El Salvador: Basic Health Programme in the Region Zona Oriente Ex post evaluation OECD sector BMZ programme ID 1995 67 025 Programme-executing agency Consultant 1220 / Basic health infrastructure Ministry
Medicaid HCBS/FE Home Telehealth Pilot Final Report for Study Years 1-3 (September 2007 June 2010)
") Medicaid HCBS/FE Home Telehealth Pilot Final Report for Study Years 1-3 (September 2007 June 2010) Completed November 30, 2010 Ryan Spaulding, PhD Director Gordon Alloway Research Associate Center for
Medicaid HCBS/FE Home Telehealth Pilot Final Report for Study Years 1-3 (September 2007 June 2010) Completed November 30, 2010 Ryan Spaulding, PhD Director Gordon Alloway Research Associate Center for
Janani Suraksha Yojana (JSY) State Institute of Health & Family Welfare, Jaipur
 State Institute of Health & Family Welfare, Jaipur") Janani Suraksha Yojana (JSY) State Institute of Health & Family Welfare, Jaipur JSY A safe motherhood intervention, replacing the National Maternity Benefit Scheme, under NRHM 100 % centrally sponsored
Janani Suraksha Yojana (JSY) State Institute of Health & Family Welfare, Jaipur JSY A safe motherhood intervention, replacing the National Maternity Benefit Scheme, under NRHM 100 % centrally sponsored
Maternity benefit 2018
 Maternity benefit 2018 The Maternity benefit cover in-hospital and day-to-day medical expenses for expecting mothers and their newborns. Who we are The Malcor Medical Aid Scheme (referred to as the Scheme
Evaluation of NHS111 pilot sites. Second Interim Report
 Evaluation of NHS111 pilot sites Second Interim Report Janette Turner Claire Ginn Emma Knowles Alicia O Cathain Craig Irwin Lindsey Blank Joanne Coster October 2011 This is an independent report commissioned
FISCAL FEDERALISM. How State and Local Governments Differ from the National Government
 FISCAL FEDERALISM devolution: The passing or transferring of fiscal responsibilities and authority from one level of government to another. In August 1996, Congress approved legislation ending 60-year
REQUEST FOR PROPOSALS. For: As needed Plan Check and Building Inspection Services
 Date: June 15, 2017 REQUEST FOR PROPOSALS For: As needed Plan Check and Building Inspection Services Submit Responses to: Building and Planning Department 1600 Floribunda Avenue Hillsborough, California
Clearing House on Public Health
 July, 1947 Clearing House on Public Health Salary Information STATEMENT BY EXECUTIVE BoARD ON SALARIES OF PUBLIC HEALTH ADMINISTRATORS The American Public Health Association for more than 15 years has
Chapter 8: Managing Incentive Programs
 Chapter 8: Managing Incentive Programs 8-1 Chapter 8: Managing Incentive Programs What Are Incentive Programs and Rewards? Configuring Rewards Managing Rewards View rewards Edit a reward description Increase
Essential Newborn Care Corps. Evaluation of program to rebrand traditional birth attendants as health promoters in Sierra Leone
 Essential Newborn Care Corps Evaluation of program to rebrand traditional birth attendants as health promoters in Sierra Leone Challenge Sierra Leone is estimated to have the world s highest maternal mortality
Refining the Hospital Readmissions Reduction Program. Mark Miller, PhD Executive Director December 6, 2013
 Refining the Hospital Readmissions Reduction Program Mark Miller, PhD Executive Director December 6, 2013 Medicare Payment Advisory Commission Independent, nonpartisan, Congressional support agency 17
Presentation for CHA Meeting in Bagamoyo on By Patricia Schwerzel, Public Health Advisor, ETC Crystal.
 DEVELOPMENT OF A FRAMEWORK FOR THE DEVELOPMENT OF A BENEFIT/,MOTIVATION PACKAGE FOR RURAL HEALTH WORKERS IN VOLUNTARY AGENCIES (VA) OWNED HOSPITALS BASED ON FINDINGS IN THE LAKE ZONE Presentation for CHA
The attitude of nurses towards inpatient aggression in psychiatric care Jansen, Gradus
 University of Groningen The attitude of nurses towards inpatient aggression in psychiatric care Jansen, Gradus IMPORTANT NOTE: You are advised to consult the publisher's version (publisher's PDF) if you
Evaluation Of Immunization Coverage By Lot Quality Assurance Sampling In A Primary Health Center Area
 ISPUB.COM The Internet Journal of Public Health Volume 1 Number 1 Evaluation Of Immunization Coverage By Lot Quality Assurance Sampling In A Primary Health Center P BS, Gangaboraiah, U S Citation P BS,
Population Council, Bangladesh INTRODUCTION
 Performance-based Incentive for Improving Quality Maternal Health Care Services in Bangladesh Mohammad Masudul Alam 1, Ubaidur Rob 1, Md. Noorunnabi Talukder 1, Farhana Akter 1 1 Population Council, Bangladesh
Egypt, Arab Rep. - Demographic and Health Survey 2008
 Microdata Library Egypt, Arab Rep. - Demographic and Health Survey 2008 Ministry of Health (MOH) and implemented by El-Zanaty and Associates Report generated on: June 16, 2017 Visit our data catalog at:
U.S. Department of Energy Office of Inspector General Office of Audit Services. Audit Report
 U.S. Department of Energy Office of Inspector General Office of Audit Services Audit Report The Department's Unclassified Foreign Visits and Assignments Program DOE/IG-0579 December 2002 U. S. DEPARTMENT
Introduction and Executive Summary
 Introduction and Executive Summary 1. Introduction and Executive Summary. Hospital length of stay (LOS) varies markedly and persistently across geographic areas in the United States. This phenomenon is
SCHOOL - A CASE ANALYSIS OF ICT ENABLED EDUCATION PROJECT IN KERALA
 CHAPTER V IT@ SCHOOL - A CASE ANALYSIS OF ICT ENABLED EDUCATION PROJECT IN KERALA 5.1 Analysis of primary data collected from Students 5.1.1 Objectives 5.1.2 Hypotheses 5.1.2 Findings of the Study among
Contact Center Costs: The Case for Telecommuting Agents
 IP Telephony Contact Centers Mobility Services WHITE PAPER Contact Center Costs: The Case for Telecommuting Agents July 2006 avaya.com Table of Contents Abstract... 1 Section 1: Defining Telecommuting
Multiple Value Propositions of Health Information Exchange
 Multiple Value Propositions of Health Information Exchange The entire healthcare system in the United States is undergoing a major transformation. It is moving from a provider-centric system to a consumer/patient-centric
Executive Summary: Utilization Management for Adult Members
 Executive Summary: Utilization Management for Adult Members On at least a quarterly basis, the reports mutually agreed upon in Exhibit E of the CT BHP contract are submitted to the state for review. This
Outpatient Experience Survey 2012
 1 Version 2 Internal Use Only Outpatient Experience Survey 2012 Research conducted by Ipsos MORI on behalf of Great Ormond Street Hospital 16/11/12 Table of Contents 2 Introduction Overall findings and
Community Performance Report
 : Wenatchee Current Year: Q1 217 through Q4 217 Qualis Health Communities for Safer Transitions of Care Performance Report : Wenatchee Includes Data Through: Q4 217 Report Created: May 3, 218 Purpose of
The Nurse Labor and Education Markets in the English-Speaking CARICOM: Issues and Options for Reform
 A. EXECUTIVE SUMMARY 1. The present report concludes the second phase of the cooperation between CARICOM countries and the World Bank to build skills for a competitive regional economy. It focuses on the
Models of Support in the Teacher Induction Scheme in Scotland: The Views of Head Teachers and Supporters
 Models of Support in the Teacher Induction Scheme in Scotland: The Views of Head Teachers and Supporters Ron Clarke, Ian Matheson and Patricia Morris The General Teaching Council for Scotland, U.K. Dean
Two Keys to Excellent Health Care for Canadians
 Two Keys to Excellent Health Care for Canadians Dated: 22/10/01 Two Keys to Excellent Health Care for Canadians: Provide Information and Support Competition A submission to the: Commission on the Future
University of Michigan Emergency Department
 University of Michigan Emergency Department Efficient Patient Placement in the Emergency Department Final Report To: Jon Fairchild, M.S., R.N. C.E.N, Nurse Manager, fairchil@med.umich.edu Samuel Clark,
Phase II Transition to Scale
 Phase II Transition to Scale Last Updated: July 11, 2013 FULL PROPOSAL INSTRUCTIONS Grand Challenges Canada is dedicated to supporting bold ideas with big impact in global health. We are funded by the
Begin Implementation. Train Your Team and Take Action
 Begin Implementation Train Your Team and Take Action These materials were developed by the Malnutrition Quality Improvement Initiative (MQii), a project of the Academy of Nutrition and Dietetics, Avalere