WIN-WIN-WIN APPROACHES TO ACCOUNTABLE CARE How Physicians, Hospitals, Patients, and
|
|
|
- Joel Wood
- 6 years ago
- Views:
Transcription
1 WIN-WIN-WIN APPROACHES TO ACCOUNTABLE CARE How Physicians, Hospitals, Patients, and Payers Can All Benefit from Better Healthcare Payment Systems Harold D. Miller President and CEO Center for Healthcare Quality and Payment Reform
2 A Short Quiz QUESTION #1: Which U.S. industry told its employees every year for the past decade that their pay would be cut by 15-30% regardless of how well they performed? 2
3 A Short Quiz QUESTION #1: Which U.S. industry told its employees every year for the past decade that their pay would be cut by 15-30% regardless of how well they performed? ANSWER: Health Care 3
4 Medicare SGR Is Now Gone, But Physician Pay Is Behind Inflation 28% Lower Than Inflation If SGR Cut Had Been Made 4
5 A Short Quiz QUESTION #2: In which U.S. industry can one set of employees only get a raise if other employees take a pay cut, even when the business is performing well? 5
6 A Short Quiz QUESTION #2: In which U.S. industry can one set of employees only get a raise if other employees take a pay cut, even when the business is performing well? ANSWER: Health Care 6
7 Even Without the SGR, Physician Pay Must Be Budget-Neutral Physician Payment Budget Neutrality Payments for Specialists Payments for Specialists Payments for PCPs Payments for PCPs 7
8 A Short Quiz QUESTION #3: In which U.S. industries are businesses only able to sell their products and services to consumers through an intermediary who demands large discounts and increases prices by 18-25%? 8
9 A Short Quiz QUESTION #3: In which U.S. industries are businesses only able to sell their products and services to consumers through an intermediary who demands large discounts and increases prices by 18-25%? ANSWER: Health Care 9
10 Health Plans Spend As Much on Administration/Profit as on Drugs Admin: $110 billion Drugs: $117 billion Physicians Hospitals 10


11 A Lot of a Physician s Pay Goes To Costs of Dealing with Health Plans Admin: $110 billion Drugs: $117 billion Admin: $30 billion Physicians Hospitals 11

12 12
13 A Short Quiz QUESTION #4: Who is to blame for the way physicians are paid and micromanaged? 13
14 A Short Quiz QUESTION #4: Who is to blame for the way physicians are paid and micromanaged? ANSWER: Physicians 14
15 The Blame Rests With Physicians Physicians haven t defined solutions to control healthcare costs without rationing Physicians have allowed themselves to be seen as the causes of higher spending Physicians haven t defined payment models that will support lower-cost, higherquality care and maintain financial viability for physician practices Physicians aren t organized to manage and deliver high-value population health care to purchasers and patients 15
16 Three Paths to the Future: Which Door Will Doctors Choose? FUTURE #1 SGR Repeal FUTURE #2 FUTURE #3 16
17 Door #1: Pay for Performance (AKA Value Based Purchasing ) PAY FOR PERFORMANCE ( Value-Based Purchasing ) ( Merit-Based Incentive Payment System ) SGR Repeal 17
18 PROBLEM The Problem That P4P Was Supposed to Solve Physicians are paid the same amount under fee-for-service regardless of the quality of care they deliver 18
19 Bad Solutions Developed by CMS and Other Payers PROBLEM Physicians are paid the same amount under fee-for-service regardless of the quality of care they deliver BAD P4P Requiring physicians to deliver high-quality care regardless of whether they are paid adequately to do so Penalizing physicians for quality problems they did not cause and cannot control Penalizing physicians when patients don t receive services they don t need or want 19
20 Do Physicians Need Incentives to Deliver Higher Value Care? $ Bonus Penalty FFS P4P QUALITY MEASURES Mammograms Flu Vaccine Tobacco Counseling HbA1c Control RESOURCE USE MEASURES Total Spending per Patient Spending Per Episode of Care 20
21 The Problem Isn t Incentives But Lack of Adequate FFS Payment $ QUALITY A small bonus may not be MEASURES enough to pay for delivering Mammograms a high-value service or for Flu Vaccine the added costs of improving Tobacco Counseling quality HbA1c Control A small bonus may not be RESOURCE USE enough to offset the costs of MEASURES collecting and reporting the Total Spending quality data per Patient Spending A small penalty may be less Per Episode Bonus of Care than the loss of Penalty fee-for-service revenue from healthier patients or FFS lower utilization Unpaid Services P4P 21

22 Quality Reporting Alone Costs Physicians $15 Billion 22
23 MIPS is Just More P4P On Top of the Same FFS $ +x% -4.5% +x% -6% +x% -9% +x% -10% +4% -4% +5% -5% +7% -7% +9% -9% +9% -9% +9% -9% FFS + PQRS + MU + VBM FFS + PQRS + MU + VBM FFS + PQRS + MU + VBM FFS + PQRS + MU + VBM FFS + MIPS FFS + MIPS FFS + MIPS FFS + MIPS FFS + MIPS FFS + MIPS MIPS Merit-Based Incentive Payment System Quality Resource Use Clinical Practice Improvement Activities EHR Meaningful Use 50% -> 30% 10% -> 30% 15% 25% 23
24 Docs Will Be Responsible for Costs They Can t Control $ +x% -4.5% +x% -6% +x% -9% +x% -10% +4% -4% +5% -5% +7% -7% +9% -9% +9% -9% +9% -9% FFS + PQRS + MU + VBM FFS + PQRS + MU + VBM FFS + PQRS + MU + VBM FFS + PQRS + MU + VBM FFS + MIPS FFS + MIPS FFS + MIPS FFS + MIPS FFS + MIPS FFS + MIPS Physicians Pay Will Be Based on Total Cost of Care Without the Ability to Control It Quality Resource Use Clinical Practice Improvement Activities EHR Meaningful Use 50% -> 30% 10% -> 30% 15% 25% 24
25 Door #1: Accountability Without Resources or Flexibility PAY FOR PERFORMANCE ( Value-Based Purchasing ) ( Merit-Based Incentive Payment System ) SGR Repeal Accountability for: Quality Measures Meaningful Use Practice Improvement Total Spending on Patients No Change in What Physicians are Paid For or How They re Paid 25
26 Door #2: Alternative Payment Models PAY FOR PERFORMANCE ( Value-Based Purchasing ) ( Merit-Based Incentive Payment System ) SGR Repeal ALTERNATIVE PAYMENT MODELS (APMs) 26
27 PROBLEM The Need for Alternative Payment Models Barriers in fee-for-service prevent physicians from delivering higher-quality care at lower total cost 27
28 The Need for Alternative Payment Models PROBLEM Barriers in fee-for-service prevent physicians from delivering higher-quality care at lower total cost BARRIER #1 No payment or inadequate payment for many high-value services, e.g., Responding to patient phone calls that can avoid office or ER visits Calls among physicians to determine a diagnosis or coordinate care delivery Hiring nurses to help chronic disease patient avoid exacerbations Providing palliative care, not just hospice BARRIER #2 Loss of revenue when patients stay healthy and don t need procedures 28
29 Bad Alternative Payment Models From CMS and Other Payers PROBLEM Barriers in fee-for-service prevent physicians from delivering higher-quality care at lower total cost BAD PAYMENT MODELS Paying for high-value services only if physicians can reduce total spending Dictating how care should be provided in order to increase payments Paying physicians more if their patients receive fewer services Paying physicians the same amount for all services patients need regardless of how sick the patients are 29
30 CMS Alternative Payment Models Announced To Date TYPE OF PROVIDER CMS PROGRAM PAYMENT STRUCTURE Health Systems, PHOs, Multi-Specialty Groups, IPAs, and Dialysis Ctrs Primary Care Specialty Care Hospitals and Post-Acute Care Accountable Care Organizations (MSSP, Pioneer, ESCO) Comprehensive Primary Care Initiative Oncology Care Model Comprehensive Care for Joint Replacement FFS + Shared Savings on Attributed Total Spending FFS + PMPM $ for Attributed Patients w/ Detailed Service Specifications + Shared Savings on Attributed Total Spending (for State or Region) FFS + PMPM $ for Attributed Patients w/ Detailed Service Specifications + Shared Savings on Attributed Total Spending (for 6-month window) FFS + Hospital Bonuses/Penalties for Attributed Total Spending 30
31 CMS Alternative Payment Models Don t Change Current Payments TYPE OF PROVIDER CMS PROGRAM PAYMENT STRUCTURE Health Systems, PHOs, Multi-Specialty Groups, IPAs, and Dialysis Ctrs Primary Care Specialty Care Hospitals and Post-Acute Care Accountable Care Organizations (MSSP, Pioneer, ESCO) Comprehensive Primary Care Initiative Oncology Care Model Comprehensive Care for Joint Replacement FFS + Shared Savings on Attributed Total Spending FFS + PMPM $ for Attributed Patients w/ Detailed Service Specifications + Shared Savings on Attributed Total Spending (for State or Region) FFS + PMPM $ for Attributed Patients w/ Detailed Service Specifications + Shared Savings on Attributed Total Spending (for 6-month window) FFS + Hospital Bonuses/Penalties for Attributed Total Spending 31
32 Some Provide Additional Upfront Resources to Physicians TYPE OF PROVIDER CMS PROGRAM PAYMENT STRUCTURE Health Systems, PHOs, Multi-Specialty Groups, IPAs, and Dialysis Ctrs Primary Care Specialty Care Hospitals and Post-Acute Care Accountable Care Organizations (MSSP, Pioneer, ESCO) Comprehensive Primary Care Initiative Oncology Care Model Comprehensive Care for Joint Replacement FFS + Shared Savings on Attributed Total Spending FFS + PMPM $ for Attributed Patients w/ Detailed Service Specifications + Shared Savings on Attributed Total Spending (for State or Region) FFS + PMPM $ for Attributed Patients w/ Detailed Service Specifications + Shared Savings on Attributed Total Spending (for 6-month window) FFS + Hospital Bonuses/Penalties for Attributed Total Spending 32
33 But With Many Strings Attached TYPE OF PROVIDER CMS PROGRAM PAYMENT STRUCTURE Health Systems, PHOs, Multi-Specialty Groups, IPAs, and Dialysis Ctrs Primary Care Specialty Care Hospitals and Post-Acute Care Accountable Care Organizations (MSSP, Pioneer, ESCO) Comprehensive Primary Care Initiative Oncology Care Model Comprehensive Care for Joint Replacement FFS + Shared Savings on Attributed Total Spending FFS + PMPM $ for Attributed Patients w/ Detailed Service Specifications + Shared Savings on Attributed Total Spending (for State or Region) FFS + PMPM $ for Attributed Patients w/ Detailed Service Specifications + Shared Savings on Attributed Total Spending (for 6-month window) FFS + Hospital Bonuses/Penalties for Attributed Total Spending 33
34 Practice Transformation Required in CMS Oncology Care Model 1. 24/7 patient access to clinicians with real-time access to medical records 2. Meet Meaningful Use requirements for EHR 3. Create care plans with 13 components recommended by IOM 4. Provide patient navigation services 5. Adhere to clinical guidelines for treatment 6. Collect, report, and improve on quality metrics 34
35 Performance Measures in the CMS Oncology Care Model 1. Percentage of beneficiaries who are treated with therapies consistent with nationally recognized clinical guidelines 2. Provide and attest to 24 hour, 7 days a week patient access to appropriate clinician who has real-time access to practice s medical record 3. Attestation and Use of ONC certified EHRs 4. Submission of all quality measures required by the program team 5. Provide core functions of patient navigation 6. Electronically document a care plan that contains the 13 components in the IOM Care Management Plan 7. Number of emergency department visits per attributed OCM-FFS beneficiary per OCM-FFS episode (Risk adjusted) 8. Number of hospital admissions per attributed OCM-FFS beneficiaries per OCM-FFS episode for (Risk adjusted) 9. Percentage of all Medicare FFS beneficiaries managed by a practice who are admitted to hospice for less than 3 days in the last 30 days of life 10. % of all Medicare FFS beneficiaries managed by a practice who experience more than one emergency department visit in the last 30 days of life 11. % of face-to-face visits to the participating practice in which there is a documented plan of care for pain AND pain intensity is quantified 12. Score on patient experience survey (CAHPS as modified by the evaluation contractor) 13. Percentage of OCM-FFS beneficiary face-to-face visits in which the patient is assessed by an approved patient-reported outcomes tool. This would include a minimum of the PROMIS tool short forms for anxiety, depression, fatigue, pain interference, and physical function 14. Percentage of OCM-FFS beneficiaries that receive psychosocial screening and intervention at least once per OCM-FFS episode 15. Percentage of OCM-FFS beneficiaries with least one palliative care consultation per OCM-FFS episode 16. Mortality rates of OCM-FFS beneficiaries, risk adjusted 17. Number of emergency department visits per OCM-FFS beneficiary in the 6 months following the OCM-FFS episode 18. Number of hospital admissions per OCM-FFS beneficiary in the 6 months following the OCM-FFS episode 19. Number of hospital readmissions per OCM-FFS beneficiary during the OCM-FFS episode and the following 6 months 20. Number of ICU admissions per OCM-FFS beneficiary during the OCM-FFS episode and the following 6 months 21. Proportion of all Medicare FFS beneficiaries managed by a practice not admitted to hospice 22. Proportion of all Medicare FFS beneficiaries managed by a practice receiving chemotherapy in the last 14 days of life 23. % of attributed beneficiaries that receive a follow-up visit from the participating practice within 7 days after discharge from any inpatient hospitalization 24. Percentage of face-to-face encounters between an attributed OCM-FFS beneficiary and a participating practice which include medication reconciliation 25. Breast Cancer: Hormonal therapy for Stage IC-IIIC (ER/PR) Positive Cancer in OCM-FFS beneficiaries 26. Breast Cancer: Combination chemotherapy is considered or administered within 4 months (120 days) of diagnosis for women under 70 with AJCC T1c, or Stage II or Stage III hormone receptor negative breast cancer in OCM-FFS beneficiaries 27. Colon Cancer: Chemotherapy for Stage IIIA through Stage IIIC OCM-FFS beneficiaries with colon cancer 28. Colon Cancer: Adjuvant chemotherapy is considered or administered within 4 months (120 days) of surgery to OCM-FFS beneficiaries under the age of 80 with AJCC III (lymph node positive) colon 29. Prostate Cancer: Adjuvant hormonal therapy for high-risk OCM-FFS beneficiaries 30. Percentage of OCM-FFS beneficiaries with documented ECOG, Karnofsky, or WHO performance status assessment prior to OCM-FFS episode initiation and at episode conclusion 31. Percentage of OCM-FFS beneficiaries that receive tobacco screening and cessation intervention at least once per OCM-FFS episode 32. Percentage of OCM-FFS beneficiaries that have an Influenza Immunization 33. Number of OCM-FFS beneficiaries enrolled in clinical trials at any point during an OCM-FFS episode 34. Prescription drug utilization under Medicare Part B and Part D 35. Radiation utilization by OCM-FFS beneficiaries 36. Imaging utilization by OCM-FFS beneficiaries 37. Post-acute provider utilization by OCM-FFS beneficiaries 38. Therapy service utilization by OCM-FFS beneficiaries 39. Home health services utilization by OCM-FFS beneficiaries 35
36 Most Only Provide More $ After Other Spending is Reduced TYPE OF PROVIDER CMS PROGRAM PAYMENT STRUCTURE Health Systems, PHOs, Multi-Specialty Groups, IPAs, and Dialysis Ctrs Primary Care Specialty Care Hospitals and Post-Acute Care Accountable Care Organizations (MSSP, Pioneer, ESCO) Comprehensive Primary Care Initiative Oncology Care Model Comprehensive Care for Joint Replacement FFS + Shared Savings on Attributed Total Spending FFS + PMPM $ for Attributed Patients w/ Detailed Service Specifications + Shared Savings on Attributed Total Spending (for State or Region) FFS + PMPM $ for Attributed Patients w/ Detailed Service Specifications + Shared Savings on Attributed Total Spending (for 6-month window) FFS + Hospital Bonuses/Penalties for Attributed Total Spending 36
37 Problems With Shared Savings Already efficient providers receive little or no additional revenue and may be forced out of business Physicians who have been practicing inefficiently or inappropriately are paid more than conservative physicians Physicians could be rewarded for denying needed care as well as by reducing overuse Physicians are placed at risk for costs they cannot control and random variation in spending Shared savings bonuses are temporary and when there are no more savings to be generated, physicians are underpaid 37
38 Higher Payment Only for Patients Attributed to Physician/Provider TYPE OF PROVIDER CMS PROGRAM PAYMENT STRUCTURE Health Systems, PHOs, Multi-Specialty Groups, IPAs, and Dialysis Ctrs Primary Care Specialty Care Hospitals and Post-Acute Care Accountable Care Organizations (MSSP, Pioneer, ESCO) Comprehensive Primary Care Initiative Oncology Care Model Comprehensive Care for Joint Replacement FFS + Shared Savings on Attributed Total Spending FFS + PMPM $ for Attributed Patients w/ Detailed Service Specifications + Shared Savings on Attributed Total Spending (for State or Region) FFS + PMPM $ for Attributed Patients w/ Detailed Service Specifications + Shared Savings on Attributed Total Spending (for 6-month window) FFS + Hospital Bonuses/Penalties for Attributed Total Spending 38
39 Models Hold Individual Physicians Accountable for Total Cost of Care TYPE OF PROVIDER CMS PROGRAM PAYMENT STRUCTURE Health Systems, PHOs, Multi-Specialty Groups, IPAs, and Dialysis Ctrs Primary Care Specialty Care Hospitals and Post-Acute Care Accountable Care Organizations (MSSP, Pioneer, ESCO) Comprehensive Primary Care Initiative Oncology Care Model Comprehensive Care for Joint Replacement FFS + Shared Savings on Attributed Total Spending FFS + PMPM $ for Attributed Patients w/ Detailed Service Specifications + Shared Savings on Attributed Total Spending (for State or Region) FFS + PMPM $ for Attributed Patients w/ Detailed Service Specifications + Shared Savings on Attributed Total Spending (for 6-month window) FFS + Hospital Bonuses/Penalties for Attributed Total Spending 39
40 CMS Wants to Make Each Provider Accountable for Total Spending ACOs Comp. ESRD Care Comprehensive Primary Care Initiative Oncology Care Model Comp. Care for Joint Replacement Healthcare Spending Spending on All Services the ACO s Patients Receive Spending on All Services End-Stage Renal Disease Patients Receive Spending on All Services the PCP s Patients Receive Spending on All Services Cancer Patients Receive During 6 Month Chemo Treatment Episodes Spending on All Chronic Disease Care & Care Related to Joint Surgery 90 Days After Discharge Payments to ACOs Payments to ESCOs Payments to PCPs Payments to Oncologists Payments to Hospitals 40
41 What s Behind Door #3? PAY FOR PERFORMANCE ( Value-Based Purchasing ) ( Merit-Based Incentive Payment System ) SGR Repeal PAYER-DESIGNED ALTERNATIVE PAYMENT MODELS FUTURE #3 41
42 Physicians Taking Charge of Payment & Delivery Reform PAY FOR PERFORMANCE ( Value-Based Purchasing ) ( Merit-Based Incentive Payment System ) SGR Repeal PAYER-DESIGNED ALTERNATIVE PAYMENT MODELS PHYSICIAN-DESIGNED ALTERNATIVE PAYMENT MODELS (APMs) 42
43 Instead of Payer Designed Payment Systems HOW PAYMENT REFORMS ARE DESIGNED TODAY Medicare and Health Plans Define Payment Systems Physicians Have To Change Care to Align With Payment Systems Patients and Physicians May Not Come Out Ahead 43
44 Physicians Should Design Payments to Support Good Care HOW PAYMENT REFORMS ARE DESIGNED TODAY Medicare and Health Plans Define Payment Systems Physicians Have To Change Care to Align With Payment Systems Patients and Physicians May Not Come Out Ahead THE RIGHT WAY TO DESIGN PAYMENT REFORMS Physicians Redesign Care and Identify Payment Barriers Payers Change Payment to Support Redesigned Care Patients Get Better Care and Physicians Stay Financially Viable 44
45 What Happens When Physicians Redesign Patient Care and Receive Adequate Payments to Support It?
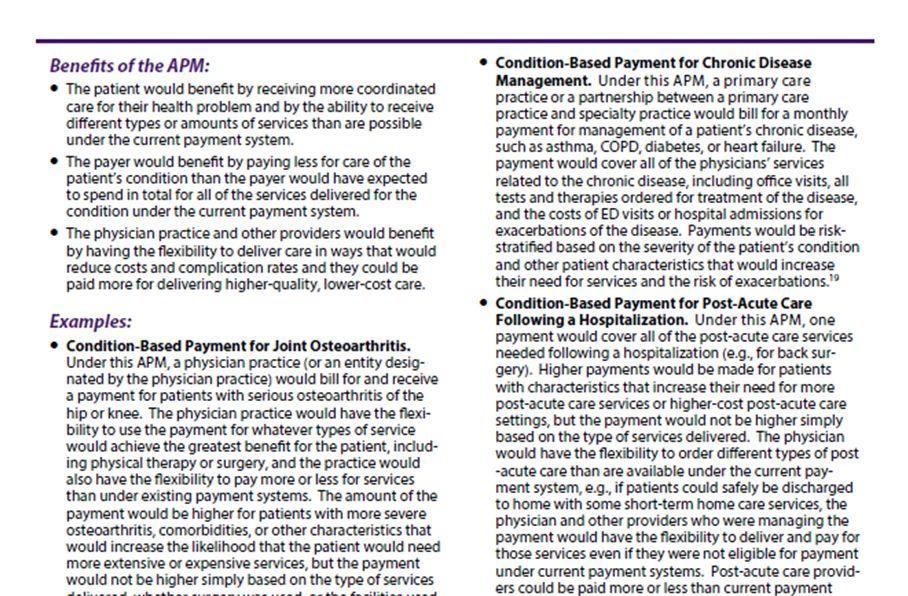
46 Better Care at Lower Cost for Crohn s Disease PHYSICIAN LEADER: Lawrence R. Kosinski, MD Managing Partner, Illinois Gastroenterology Group 46
47 Better Care at Lower Cost for Crohn s Disease PHYSICIAN LEADER: Lawrence R. Kosinski, MD Managing Partner, Illinois Gastroenterology Group OPPORTUNITIES TO IMPROVE CARE AND LOWER COSTS Health plan spends $11,000/year/patient on patients with Crohn s >50% of expenses are for hospital care, most due to complications <33% of patients seen by physician in 30 days prior to hospitalization 10% of expenses for biologics, many administered in hospitals 3.5% of spending goes to gastroenterologists 47
48 Better Care at Lower Cost for Crohn s Disease PHYSICIAN LEADER: Lawrence R. Kosinski, MD Managing Partner, Illinois Gastroenterology Group OPPORTUNITIES TO IMPROVE CARE AND LOWER COSTS Health plan spends $11,000/year/patient on patients with Crohn s >50% of expenses are for hospital care, most due to complications <33% of patients seen by physician in 30 days prior to hospitalization 10% of expenses for biologics, many administered in hospitals 3.5% of spending goes to gastroenterologists BARRIERS IN THE CURRENT PAYMENT SYSTEM No payment to support medical home services in gastroenterology practice: No payment for nurse care manager No payment for clinical decision support tools to ensure evidencebased care No payment for proactive telephone contact with patients 48
49 Better Care at Lower Cost for Crohn s Disease PHYSICIAN LEADER: Lawrence R. Kosinski, MD Managing Partner, Illinois Gastroenterology Group OPPORTUNITIES TO IMPROVE CARE AND LOWER COSTS Health plan spends $11,000/year/patient on patients with Crohn s >50% of expenses are for hospital care, most due to complications <33% of patients seen by physician in 30 days prior to hospitalization 10% of expenses for biologics, many administered in hospitals 3.5% of spending goes to gastroenterologists BARRIERS IN THE CURRENT PAYMENT SYSTEM No payment to support medical home services in gastroenterology practice: No payment for nurse care manager No payment for clinical decision support tools to ensure evidencebased care No payment for proactive telephone contact with patients RESULTS WITH ADEQUATE PAYMENT FOR BETTER CARE Hospitalization rate cut by more than 50% Total spending reduced by 10% even with higher payments to the physician practice Improved patient satisfaction due to fewer complications and lower out-of-pocket costs 49
50 Better Care at Lower Cost for Cancer PHYSICIAN LEADER: Barbara McAneny, MD CEO, New Mexico Cancer Center 50
51 Better Care at Lower Cost for Cancer PHYSICIAN LEADER: Barbara McAneny, MD CEO, New Mexico Cancer Center OPPORTUNITIES TO IMPROVE CARE AND LOWER COSTS 40-50% of patients receiving chemotherapy are hospitalized for complications of treatment 51
52 Better Care at Lower Cost for Cancer PHYSICIAN LEADER: Barbara McAneny, MD CEO, New Mexico Cancer Center OPPORTUNITIES TO IMPROVE CARE AND LOWER COSTS 40-50% of patients receiving chemotherapy are hospitalized for complications of treatment BARRIERS IN THE CURRENT PAYMENT SYSTEM No payment for triage services to enable rapid response to patient complications No payment for patient and family education about complications and how to respond Inadequate payment to reserve capacity for IV hydration of patients experiencing problems 52
53 Better Care at Lower Cost for Cancer PHYSICIAN LEADER: Barbara McAneny, MD CEO, New Mexico Cancer Center OPPORTUNITIES TO IMPROVE CARE AND LOWER COSTS 40-50% of patients receiving chemotherapy are hospitalized for complications of treatment BARRIERS IN THE CURRENT PAYMENT SYSTEM No payment for triage services to enable rapid response to patient complications No payment for patient and family education about complications and how to respond Inadequate payment to reserve capacity for IV hydration of patients experiencing problems RESULTS WITH ADEQUATE PAYMENT FOR BETTER CARE 36% fewer ED visits 43% fewer admissions 22% reduction in total cost of care ($4,784 over six months) 53
54 The Promise of Physician-Focused PROBLEMS Barriers in fee-for-service prevent physicians from delivering higher-quality care at lower total cost + Physicians are paid the same amount under fee-for-service regardless of the quality of care they deliver Alternative Payment Models 54
55 The Promise of Physician-Focused Alternative Payment Models PROBLEMS Barriers in fee-for-service prevent physicians from delivering higher-quality care at lower total cost GOOD ALTERNATIVE PAYMENT MODELS Give physicians adequate resources and flexibility to deliver the kind of care that patients need + + Physicians are paid the same amount under fee-for-service regardless of the quality of care they deliver Ask physicians to take accountability for improving quality and reducing costs in the aspects of care they can control 55
56 Are the CMS Models the Only Way to Define APMs? CMS APM Models Primary Care Medical Home Episode Payment to Hospital Upside-Only Shared Savings Two-Sided Risk Shared Savings Full-Risk Capitation 56
57 Models Authorized by ACA/MACRA for Innovation Center to Implement (i) Promoting broad payment and practice reform in primary care, including patient-centered medical home models for high-need applicable individuals, medical homes that address women s unique health care needs, and models that transition primary care practices away from fee-for-service based reimbursement and toward comprehensive payment or salary-based payment. (ii) Contracting directly with groups of providers of services and suppliers to promote innovative care delivery models, such as through risk-based comprehensive payment or salary-based payment. (iii) Utilizing geriatric assessments and comprehensive care plans to coordinate the care (including through interdisciplinary teams) of applicable individuals with multiple chronic conditions and at least one of the following: (I) An inability to perform 2 or more activities of daily living. (II) Cognitive impairment, including dementia. (iv) Promote care coordination between providers of services and suppliers that transition health care providers away from fee-for-service based reimbursement and toward salary-based payment. (v) Supporting care coordination for chronically ill applicable individuals at high risk of hospitalization through a health information technology-enabled provider network that includes care coordinators, a chronic disease registry, and home tele-health technology. (vi) Varying payment to physicians who order advanced diagnostic imaging services (as defined in section 1834(e)(1)(B)) according to the physician s adherence to appropriateness criteria for the ordering of such services, as determined in consultation with physician specialty groups and other relevant stakeholders. (vii) Utilizing medication therapy management services, such as those described in section 935 of the Public Health Service Act. (viii) Establishing community-based health teams to support small-practice medical homes by assisting the primary care practitioner in chronic care management, including patient selfmanagement, activities. (ix) Assisting applicable individuals in making informed health care choices by paying providers of services and suppliers for using patient decision-support tools, including tools that meet the standards developed and identified under section 936(c)(2)(A) of the Public Health Service Act, that improve applicable individual and caregiver understanding of medical treatment options. (x) Allowing States to test and evaluate fully integrating care for dual eligible individuals in the State, including the management and oversight of all funds under the applicable titles with respect to such individuals. (xi) Allowing States to test and evaluate systems of all-payer payment reform for the medical care of residents of the State, including dual eligible individuals. (xii) Aligning nationally recognized, evidence based guidelines of cancer care with payment incentives under title XVIII in the areas of treatment planning and follow-up care planning for applicable individuals described in clause (i) or (iii) of subsection (a)(4)(a) with cancer, including the identification of gaps in applicable quality measures. (xiii) Improving post-acute care through continuing care hospitals that offer inpatient rehabilitation, long-term care hospitals, and home health or skilled nursing care during an inpatient stay and the 30 days immediately following discharge. (xiv) Funding home health providers who offer chronic care management services to applicable individuals in cooperation with interdisciplinary teams. (xv) Promoting improved quality and reduced cost by developing a collaborative of high-quality, low-cost health care institutions that is responsible for (I) developing, documenting, and disseminating best practices and proven care methods; (II) implementing such best practices and proven care methods within such institutions to demonstrate further improvements in quality and efficiency; and (III) providing assistance to other health care institutions on how best to employ such best practices and proven care methods to improve health care quality and lower costs. (xvi) Facilitate inpatient care, including intensive care, of hospitalized applicable individuals at their local hospital through the use of electronic monitoring by specialists, including intensivists and critical care specialists, based at integrated health systems. (xvii) Promoting greater efficiencies and timely access to outpatient services (such as outpatient physical therapy services) through models that do not require a physician or other health professional to refer the service or be involved in establishing the plan of care for the service, when such service is furnished by a health professional who has the authority to furnish the service under existing State law. (xviii) Establishing comprehensive payments to Healthcare Innovation Zones, consisting of groups of providers that include a teaching hospital, physicians, and other clinical entities, that, through their structure, operations, and joint-activity deliver a full spectrum of integrated and comprehensive health care services to applicable individuals while also incorporating innovative methods for the clinical training of future health care professionals. (xix) Utilizing, in particular in entities located in medically underserved areas and facilities of the Indian Health Service (whether operated by such Service or by an Indian tribe or tribal organization (as those terms are defined in section 4 of the Indian Health Care Improvement Act)), telehealth services (I) in treating behavioral health issues (such as post-traumatic stress disorder) and stroke; and (II) to improve the capacity of non-medical providers and non-specialized medical providers to provide health services for patients with chronic complex conditions. (xx) Utilizing a diverse network of providers of services and suppliers to improve care coordination for applicable individuals described in subsection (a)(4)(a)(i) with 2 or more chronic conditions and a history of prior-year hospitalization through interventions developed under the Medicare Coordinated Care Demonstration Project under section 4016 of the Balanced Budget Act of 1997 (42 U.S.C. 1395b 1 note). (xxi) Focusing primarily on physicians services (as defined in section 1848(j)(3)) furnished by physicians who are not primary care practitioners (xxii) Focusing on practices of 15 or fewer professionals. (xxiii) Focusing on risk-based models for small physician practices which may involve two-sided risk and prospective patient assignment, and which examine risk-adjusted decreases in mortality rates, hospital readmissions rates, and other relevant and appropriate clinical measures. (xxiv) Focusing primarily on title XIX, working in conjunction with the Center for Medicaid and CHIP Services; 57
58 There are Many More Ways to Create Physician-Focused APMs Primary Care Medical Home Episode Payment to Hospital Upside-Only Shared Savings Two-Sided Risk Shared Savings Full-Risk Capitation APM #1: Payment for a High-Value Service APM #2: Condition-Based Payment for a Physician s Services APM #3: Multi-Physician Bundled Payment APM #4: Physician-Facility Procedure Bundle APM #5: Warrantied Payment for Physician Services APM #6: Episode Payment for a Procedure APM #7: Condition-Based Payment 58
59 How Do You Define a Good Alternative Payment Model?
60 Step 1: Identify Opportunities to Reduce Related Spending $ Total Spending Relevant to the Physician s Services Physician Practice Revenue Fee-for-Service Payment (FFS) Avoidable Spending Payments to Other Providers for Related Services FFS Payments to Physician Practice OPPORTUNITIES TO REDUCE SPENDING Reduce Avoidable Hospital Admissions Reduce Unnecessary Tests and Treatments Use Lower-Cost Tests and Treatments Deliver Services More Efficiently Use Lower-Cost Sites of Service Reduce Preventable Complications Prevent Serious Conditions From Occurring 60
61 Step 2: Identify Barriers in Current Payments That Need to Be Fixed $ Total Spending Relevant to the Physician s Services Physician Practice Revenue Fee-for-Service Payment (FFS) Avoidable Spending Payments to Other Providers for Related Services FFS Payments to Physician Practice Unpaid Services OPPORTUNITIES TO REDUCE SPENDING Reduce Avoidable Hospital Admissions Reduce Unnecessary Tests and Treatments Use Lower-Cost Tests and Treatments Deliver Services More Efficiently Use Lower-Cost Sites of Service Reduce Preventable Complications Prevent Serious Conditions From Occurring BARRIERS IN CURRENT FFS SYSTEM No Payment for Many High-Value Services Insufficient Revenue to Cover Costs When Using Fewer or Lower-Cost Services 61
62 Step 3: Design an APM That Removes the Payment Barriers $ Total Spending Relevant to the Physician s Services Physician Practice Revenue Fee-for-Service Payment (FFS) Avoidable Spending Payments to Other Providers for Related Services FFS Payments to Physician Practice Unpaid Services Physician-Focused Alternative Payment Model Flexible, Adequate Payment for Physician s Services 62
63 Step 4: Include Provisions to Assure Control of Cost & Quality $ Total Spending Relevant to the Physician s Services Physician Practice Revenue Fee-for-Service Payment (FFS) Avoidable Spending Payments to Other Providers for Related Services FFS Payments to Physician Practice Unpaid Services Physician-Focused Alternative Payment Model Savings Avoidable Spending Payments to Other Providers for Related Services Flexible, Adequate Payment for Physician s Services Accountability for Controlling Avoidable Spending 63
64 Alternative Payment Models Can Be Win-Win-Wins $ Total Spending Relevant to the Physician s Services Physician Practice Revenue Fee-for-Service Payment (FFS) Avoidable Spending Payments to Other Providers for Related Services FFS Payments to Physician Practice Unpaid Services Physician-Focused Alternative Payment Model Savings Avoidable Spending Payments to Other Providers for Related Services Flexible, Adequate Payment for Physician s Services Win for Payer: Lower Total Spending Win for Patient: Better Care Without Unnecessary Services Win for Physician: Adequate Payment for High-Value Services 64


65 Most of the Money in Healthcare Doesn t Go to Physicians Physicians: 16% 65
66 How Could This Work for Renal Physicians?

67 CMS Focus Has Been on ESRD Because of High Spending Per Patient 67
68 But the Majority of Patients With Kidney Disease Aren t ESRD 68
69 And So Most Spending on Kidney Disease Isn t ESRD 69
70 < 2% of Spending on CKD Patients Goes to Nephrologists 70
71 Nephrologists Can Help Control the Other 98% of Spending What Nephrologists Control or Influence What Nephrologists Get Paid 71
72 If Nephrologists Can Reduce the Other Spending 5% Reduction in Other Spending Savings 72
73 They Can Be Paid Significantly Better 5% Reduction in Other Spending Savings 50% Increase in Nephrology Payments 73


74 While Still Reducing Overall Healthcare Spending 5% Reduction in Other Spending Savings 4% Reduction in Total Medicare Spending 50% Increase in Nephrology Payments 74
75 How Can Nephrologists Improve Care and Reduce Spending? $ Stage 1 Stage 2 Stage 3 Stage 4 Stage 5 ESRD 75
76 Improving Care/Reducing Costs for ESRD Patients $ Reduce catheterrelated infections through increased use of fistulas Increase use of home dialysis Avoid ED visits and hospitalizations Transition patients to hospice sooner Increase successful use of transplants Stage 1 Stage 2 Stage 3 Stage 4 Stage 5 ESRD 76
77 Improving Care/Reducing Costs for CKD Patients, Too $ Avoid ED visits and hospitalizations Reduce cardiovascular complications Avoid overuse of ESAs Reduce unnecessary testing & medications Avoid hospitalizations for first dialysis Slow progression to ESRD and reduce use of dialysis Reduce catheterrelated infections through increased use of fistulas Increase use of home dialysis Avoid ED visits and hospitalizations Transition patients to hospice sooner Increase successful use of transplants Stage 1 Stage 2 Stage 3 Stage 4 Stage 5 ESRD 77
78 Improving Care/Reducing Costs By Avoiding Need for Dialysis $ Avoid ED visits and hospitalizations Reduce cardiovascular complications Avoid overuse of ESAs Reduce unnecessary testing & medications Avoid hospitalizations for first dialysis Slow progression to ESRD and reduce use of dialysis Reduce catheterrelated infections through increased use of fistulas Increase use of home dialysis Avoid ED visits and hospitalizations Transition patients to hospice sooner Increase successful use of transplants Stage 1 Stage 2 Stage 3 Stage 4 Stage 5 ESRD 78
79 Better Care for <65 CKD Patients Needed to Reduce ESRD Costs 79
80 Hypothetical, Simplified Example of Kidney Disease Management 1000 Patients with Stage 3 Chronic Kidney Disease 80
81 Hypothetical, Simplified Example of Kidney Disease Management CURRENT FFS $/Pt # Pts Total $ PCP Office Visits $ $600, Patients with Stage 3 Chronic Kidney Disease PCP paid only for periodic office visits (6 $100/visit) 81
82 Hypothetical, Simplified Example of Kidney Disease Management CURRENT FFS $/Pt # Pts Total $ PCP Office Visits $ $600,000 Nephrologist Office Visits $ $50, Patients with Stage 3 Chronic Kidney Disease PCP paid only for periodic office visits (6 $100/visit) Nephrologist sees only one-half the patients for 1 $100) 82
83 Hypothetical, Simplified Example of Kidney Disease Management CURRENT FFS $/Pt # Pts Total $ PCP Office Visits $ $600,000 Nephrologist Office Visits $ $50,000 Other Services $2, $2,500,000 Hospitalizations $10, $6,000, Patients with Stage 3 Chronic Kidney Disease PCP paid only for periodic office visits (6 $100/visit) Nephrologist sees only one-half the patients for 1 $100) 60% of patients are hospitalized each year; average cost of hospitalization = $10,000 83
84 Hypothetical, Simplified Example of Kidney Disease Management CURRENT FFS $/Pt # Pts Total $ PCP Office Visits $ $600,000 Nephrologist Office Visits $ $50,000 Other Services $2, $2,500,000 Hospitalizations $10, $6,000, Patients with Stage 3 Chronic Kidney Disease PCP paid only for periodic office visits (6 $100/visit) Nephrologist sees only one-half the patients for 1 $100) 60% of patients are hospitalized each year; average cost of hospitalization = $10,000 Spending on other services averages $2,500/patient 84
85 Hypothetical, Simplified Example of Kidney Disease Management CURRENT FFS $/Pt # Pts Total $ PCP Office Visits $ $600,000 Nephrologist Office Visits $ $50,000 Other Services $2, $2,500,000 Hospitalizations $10, $6,000,000 Total Spending 1000 $9,150, Patients with Stage 3 Chronic Kidney Disease PCP paid only for periodic office visits (6 $100/visit) Nephrologist sees only one-half the patients for 1 $100) 60% of patients are hospitalized each year; average cost of hospitalization = $10,000 Spending on other services averages $2,500/patient 85
86 Hypothetical, Simplified Example of Kidney Disease Management CURRENT FFS $/Pt # Pts Total $ PCP Office Visits $ $600,000 Nephrologist Office Visits $ $50,000 Other Services $2, $2,500,000 Hospitalizations $10, $6,000,000 Total Spending 1000 $9,150, Patients with Stage 3 Chronic Kidney Disease PCP paid only for periodic office visits (6 $100/visit) Nephrologist sees only one-half the patients for 1 $100) 60% of patients are hospitalized each year; average cost of hospitalization = $10,000 Spending on other services averages $2,500/patient No payment for phone consults by nephrologist with PCP; no payment for case mgt by nephrologist 86
87 Most of the Money Isn t Going to the Physicians CURRENT FFS $/Pt # Pts Total $ PCP Office Visits $ $600,000 Nephrologist Office Visits $ $50,000 Other Services $2, $2,500,000 Hospitalizations $10, $6,000,000 Total Spending 1000 $9,150,000 Physician Payments = 7% of Spending 87
88 What if More Nephrologist Support Could Reduce Hospital Admissions? CURRENT FFS APM $/Pt # Pts Total $ $/Pt # Pts Total $ Chg PCP Office Visits $ $600,000 $ $600,000 +0% Nephrologist Office Visits $ $50,000 $ $50,000 CKD Mgt $ $120,000 Total Nephrol. $50,000 $170, % Other Services $2, $2,500,000 Hospitalizations $10, $6,000,000 Total Spending 1000 $9,150,000 New CKD Management Payment to Nephrologist: $10/patient/month Allows phone support to PCPs and hiring of a nurse care manager 88
89 What if More Nephrologist Support Could Reduce Hospital Admissions? CURRENT FFS APM $/Pt # Pts Total $ $/Pt # Pts Total $ Chg PCP Office Visits $ $600,000 $ $600,000 +0% Nephrologist Office Visits $ $50,000 $ $50,000 CKD Mgt $ $120,000 Total Nephrol. $50,000 $170, % Other Services $2, $2,500,000 $2, $2,500,000 0% Hospitalizations $10, $6,000,000 $10, $4,500,000-25% Total Spending 1000 $9,150, $7,770,000-15% New CKD Management Payment to Nephrologist: $10/patient/month Allows phone support to PCPs and hiring of a nurse care manager 25% reduction in hospitalizations through improved treatment and case management 89
90 Win-Win-Win for Patients, Physicians, and Payers CURRENT FFS APM $/Pt # Pts Total $ $/Pt # Pts Total $ Chg PCP Office Visits $ $600,000 $ $600,000 +0% Nephrologist Office Visits $ $50,000 $ $50,000 CKD Mgt $ $120,000 Total Nephrol. $50,000 $170, % Other Services $2, $2,500,000 $2, $2,500,000 0% Hospitalizations $10, $6,000,000 $10, $4,500,000-25% Total Spending 1000 $9,150, $7,770,000-15% Win for Nephrologist Win for Patient Win for Payer 90
91 How Does the Payer Know That Hospitalizations Will Decrease? CURRENT FFS APM $/Pt # Pts Total $ $/Pt # Pts Total $ Chg PCP Office Visits $ $600,000 $ $600,000 +0% Nephrologist Office Visits $ $50,000 $ $50,000 CKD Mgt $ $120,000 Total Nephrol. $50,000 $170, % Other Services $2, $2,500,000 $2, $2,500,000 0% Hospitalizations $10, $6,000,000 $10, $6,000,000-0% Total Spending 1000 $9,150, $9,270,000 +1% 91
92 Solution: Add an Accountability Component to the Payment CURRENT FFS APM $/Pt # Pts Total $ $/Pt # Pts Total $ Chg PCP Office Visits $ $600,000 $ $600, % Nephrologist Office Visits $ $50,000 $ $50,000 CKD Mgt $ $120,000 P4P -$ ($60,000) Total Nephrol. $50,000 $110, % Other Services $2, $2,500,000 $2, $2,500,000 0% Hospitalizations $10, $6,000,000 $10, $5,400,000-10% Total Spending 1000 $9,150, $8,610,000-6% New CKD Management Payment to Nephrologist: $10/patient/month Allows phone support to PCPs and hiring of a nurse care manager P4P Adjustment to CKD Management Payment Based on Keeping Hospitalization Rate to Admits/1000 (assuming current average rate is 600/1000) 92
93 Greater Success in Preventing Admissions Increases Payment CURRENT FFS APM $/Pt # Pts Total $ $/Pt # Pts Total $ Chg PCP Office Visits $ $600,000 $ $600, % Nephrologist Office Visits $ $50,000 $ $50,000 CKD Mgt $ $120,000 P4P +$ $60,000 Total Nephrol. $50,000 $230, % Other Services $2, $2,500,000 $2, $2,500,000 0% Hospitalizations $10, $6,000,000 $10, $3,600,000-40% Total Spending 1000 $9,150, $6,930,000-24% New CKD Management Payment to Nephrologist: $10/patient/month Allows phone support to PCPs and hiring of a nurse care manager P4P Adjustment to CKD Management Payment Based on Keeping Hospitalization Rate to Admits/1000 (assuming current average rate is 600/1000) 93
94 Not All Patients Are The Same: APM Low Risk Patients APM High Risk Patients $/Pt # Pts Total $ $/Pt # Pts Total $ PCP Office Visits Nephrologist Office Visits CKD Mgt P4P Total Nephrol. Other Services Hospitalizations Total Spending Patients 25% Admission Rate 75% Admission Rate 94
95 Not All Patients Are The Same: Stratifying APMs Based on Risk APM Low Risk Patients APM High Risk Patients $/Pt # Pts Total $ $/Pt # Pts Total $ PCP Office Visits $ $270,000 $ $330,000 Nephrologist Office Visits $ $12,000 $ $38,000 CKD Mgt $ $36,000 $ $84,000 P4P Total Nephrol. $48,000 $122,000 Other Services $2, $1,200,000 $3, $1,300,000 Hospitalizations $10, $1,500,000 $10, $3,000,000 Total Spending 600 $3,018, $4,752,000 $5.00 PMPM CKD Payment $17.50 PMPM CKD Payment 25% Admission Rate 75% Admission Rate 95


96 APM #1: Payment for a High-Value Service Continuation of existing FFS payments Payment for additional services Measurement of avoidable utilization and/or quality/outcomes Adjustment of payment amounts based on performance Updating payments over time 96
97 A Critical Element is Shared, Trusted Data Physicians need to know the current utilization and costs for their patients and the likely impact of care changes to know whether the payment amount will cover the costs of delivering redesigned care to the patients Purchasers/Payers needs to know the current utilization and costs to know whether the proposed payment amount is a better deal than they have today Both sets of data have to match in order for providers and payers to agree on the new approach! 97
98 Option: Replace FFS Payments w/ Per Patient Bundled Payments CURRENT FFS APM $/Pt # Pts Total $ $/Pt # Pts Total $ Chg PCP Office Visits $ $600,000 $ $600,000 +0% Nephrologist Office Visits $ $50,000 X 1000 $0 CKD Mgt $ $170,000 P4P $ $0 Total Nephrol. $50,000 $170, % Other Services $2, $2,500,000 $2, $2,500,000 0% Hospitalizations $10, $6,000,000 $10, $4,500,000-25% Total Spending 1000 $9,150, $7,770,000-15% 98


99 APM #2: Condition-Based Payment for a Physician s Services 99
100 What About the PCP? CURRENT FFS APM $/Pt # Pts Total $ $/Pt # Pts Total $ Chg PCP Office Visits $ $600,000 $ $600,000 +0% Nephrologist Office Visits $ $50,000 X 1000 $0 CKD Mgt $ $170,000 P4P $ $0 Total Nephrol. $50,000 $170, % Other Services $2, $2,500,000 $2, $2,500,000 0% Hospitalizations $10, $6,000,000 $10, $4,500,000-25% Total Spending 1000 $9,150, $7,770,000-15% Do nephrologists want to manage all of the patients other health problems in addition to kidney disease? 100
101 Savings Allows Higher Pay for Both PCPs and Nephrologists If Savings CURRENT FFSAre High Enough APM $/Pt # Pts Total $ $/Pt # Pts Total $ Chg PCP Office Visits $ $600,000 $ $840, % Nephrologist Office Visits $ $50,000 X 1000 $0 CKD Mgt $ $170,000 P4P $ $0 Total Nephrol. $50,000 $170, % Other Services $2, $2,500,000 $2, $2,500,000 0% Hospitalizations $10, $6,000,000 $10, $4,500,000-25% Total Spending 1000 $9,150, $8,010,000-13% 101
102 Win-Win-Win for Patients, Payers, and All Physicians CURRENT FFS APM $/Pt # Pts Total $ $/Pt # Pts Total $ Chg PCP Office Visits $ $600,000 $ $840, % Nephrologist Office Visits $ $50,000 X 1000 $0 CKD Mgt $ $170,000 P4P $ $0 Total Nephrol. $50,000 $170, % Other Services $2, $2,500,000 $2, $2,500,000 0% Hospitalizations $10, $6,000,000 $10, $4,500,000-25% Total Spending 1000 $9,150, $8,010,000-13% Win for PCP Win for Nephrologist Win for Patient Win for Payer 102
103 Option: Create a Bundled Payment for PCP + Nephrologist CURRENT FFS APM $/Pt # Pts Total $ $/Pt # Pts Total $ Chg Physicians PCP $ $600,000 $ $840, % Nephrologist $ $50,000 $ $170, % P4P Total Physicians $ $700,000 $1, $1,010, % Other Services $2, $2,500,000 $2, $2,500,000 0% Hospitalizations $10, $6,000,000 $10, $4,500,000-25% Total Spending 1000 $9,150, $8,010,000-13% With a bundled payment, the PCP and nephrologist are no longer limited to delivering services supported by current fee-for-service payments 103
104 Flexibility Allows Creation of Specialty Medical Home PCP-Managed Patients Nephrologist-Managed $/Pt # Pts Total $ $/Pt # Pts Total $ Physicians PCP $ $420,000 $ $48,000 Nephrologist $ $60,000 $1, $480,000 Total Physicians $ $480,000 $1, $528,000 Other Services $2, $1,200,000 $3, $1,300,000 Hospitalizations $10, $1,500,000 $10, $3,000,000 Total Spending 600 $3,180, $4,828, Patients 25% Hospitalization Rate 75% Hospitalization Rate 104


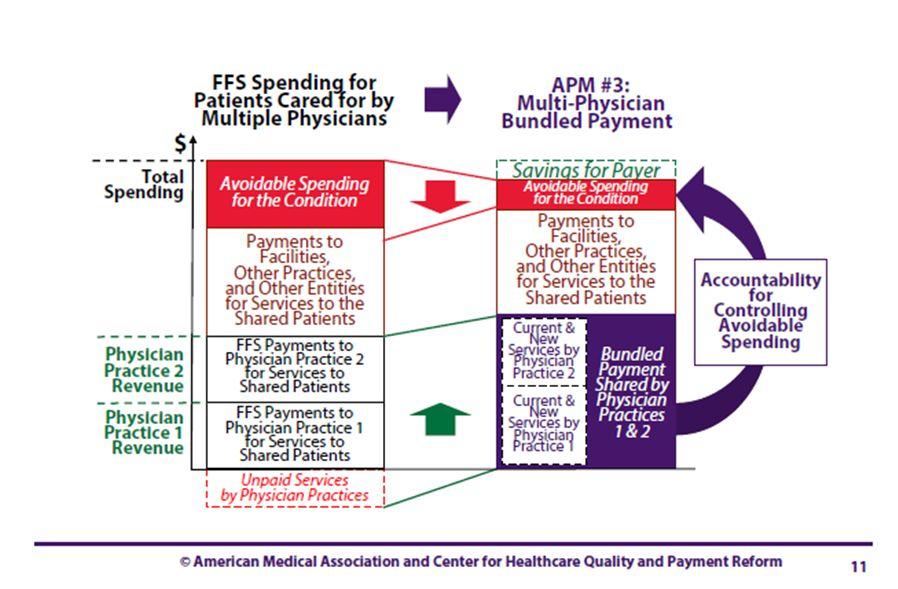
105 APM #3: Multi-Physician Bundled Payment 105
106 Does the Hospital Have to Lose for Everyone Else to Win? CURRENT FFS APM $/Pt # Pts Total $ $/Pt # Pts Total $ Chg Physicians PCP $ $600,000 $ $840, % Nephrologist $ $50,000 $ $170, % P4P Total Physicians $ $700,000 $1, $1,010, % Other Services $2, $2,500,000 $2, $2,500,000 0% Hospitalizations $10, $6,000,000 $10, $4,500,000-25% Total Spending 1000 $9,150, $8,010,000-13% Win for PCP Win for Nephrologist Loss for Hospital Win for Patient Win for Payer 106
107 We Have to Understand the Hospital s Cost Structure CURRENT FFS APM $/Pt # Pts Total $ $/Pt # Pts Total $ Chg Physicians PCP $ $600,000 $ $840, % Nephrologist $ $50,000 $ $170, % P4P Total Physicians $ $700,000 $1, $1,010, % Other Services $2, $2,500,000 $2, $2,500,000 0% Hospitalizations Fixed (60%) $6,000 $3,600,000 Variable (37%) $3,700 $2,220,000 Margin ( 3%) $300 $180,000 Total Hospital $10, $6,000,000 Total Spending 1000 $9,150,
108 Now, If the Number of Admissions is Reduced CURRENT FFS APM $/Pt # Pts Total $ $/Pt # Pts Total $ Chg Physicians PCP $ $600,000 $ $840, % Nephrologist $ $50,000 $ $170, % P4P Total Physicians $ $700,000 $1, $1,010, % Other Services $2, $2,500,000 $2, $2,500,000 0% Hospitalizations Fixed (60%) $6,000 $3,600,000 Variable (37%) $3,700 $2,220,000 Margin ( 3%) $300 $180,000 Total Hospital $10, $6,000, Total Spending 1000 $9,150,
109 Continue to Support Fixed Costs (in the Short Run) CURRENT FFS APM $/Pt # Pts Total $ $/Pt # Pts Total $ Chg Physicians PCP $ $600,000 $ $840, % Nephrologist $ $50,000 $ $170, % P4P Total Physicians $ $700,000 $1, $1,010, % Other Services $2, $2,500,000 $2, $2,500,000 0% Hospitalizations Fixed (60%) $6,000 $3,600,000 $3,600,000 0% Variable (37%) $3,700 $2,220,000 Margin ( 3%) $300 $180,000 Total Hospital $10, $6,000, Total Spending 1000 $9,150,
110 Variable Costs Will Go Down In Proportion to Admissions CURRENT FFS APM $/Pt # Pts Total $ $/Pt # Pts Total $ Chg Physicians PCP $ $600,000 $ $840, % Nephrologist $ $50,000 $ $170, % P4P Total Physicians $ $700,000 $1, $1,010, % Other Services $2, $2,500,000 $2, $2,500,000 0% Hospitalizations Fixed (60%) $6,000 $3,600,000 $3,600,000 0% Variable (37%) $3,700 $2,220,000 $3,700 $1,665,000-25% Margin ( 3%) $300 $180,000 Total Hospital $10, $6,000, Total Spending 1000 $9,150,
111 And Even With a Higher Margin For the Hospital CURRENT FFS APM $/Pt # Pts Total $ $/Pt # Pts Total $ Chg Physicians PCP $ $600,000 $ $840, % Nephrologist $ $50,000 $ $170, % P4P Total Physicians $ $700,000 $1, $1,010, % Other Services $2, $2,500,000 $2, $2,500,000 0% Hospitalizations Fixed (60%) $6,000 $3,600,000 $3,600,000 0% Variable (37%) $3,700 $2,220,000 $3,700 $1,665,000-25% Margin ( 3%) $300 $180,000 $198, % Total Hospital $10, $6,000, Total Spending 1000 $9,150,
112 Spending on Hospitalizations Is Reduced (Just Not as Much) CURRENT FFS APM $/Pt # Pts Total $ $/Pt # Pts Total $ Chg Physicians PCP $ $600,000 $ $840, % Nephrologist $ $50,000 $ $170, % P4P Total Physicians $ $700,000 $1, $1,010, % Other Services $2, $2,500,000 $2, $2,500,000 0% Hospitalizations Fixed (60%) $6,000 $3,600,000 $3,600,000 0% Variable (37%) $3,700 $2,220,000 $3,700 $1,665,000-25% Margin ( 3%) $300 $180,000 $198, % Total Hospital $10, $6,000, $5,463,000-9% Total Spending 1000 $9,150,
113 And the Payer Still Saves Money CURRENT FFS APM $/Pt # Pts Total $ $/Pt # Pts Total $ Chg Physicians PCP $ $600,000 $ $840, % Nephrologist $ $50,000 $ $170, % P4P Total Physicians $ $700,000 $1, $1,010, % Other Services $2, $2,500,000 $2, $2,500,000 0% Hospitalizations Fixed (60%) $6,000 $3,600,000 $3,600,000 0% Variable (37%) $3,700 $2,220,000 $3,700 $1,665,000-25% Margin ( 3%) $300 $180,000 $198, % Total Hospital $10, $6,000, $5,463,000-9% Total Spending 1000 $9,150, $8,973,000-2% 113
114 Win-Win-Win-Win for Patients, Physicians, Hospital, and Payer CURRENT FFS APM $/Pt # Pts Total $ $/Pt # Pts Total $ Chg Physicians PCP $ $600,000 $ $840, % Nephrologist $ $50,000 $ $170, % P4P Total Physicians $ $700,000 $1, $1,010, % Other Services $2, $2,500,000 $2, $2,500,000 0% Hospitalizations Fixed (60%) $6,000 $3,600,000 $3,600,000 0% Variable (37%) $3,700 $2,220,000 $3,700 $1,665,000-25% Margin ( 3%) $300 $180,000 $198, % Total Hospital $10, $6,000, $5,463,000-9% Total Spending 1000 $9,150, $8,973,000-2% Win for PCP Win for Nephrologist Win for Patient Win for Hospital Win for Payer 114
")

115 APM #7: (Full) Condition-Based Payment 115
116 Simplified Example #2: Stage 4 CKD ESRD 200 Patients with Stage 4 CKD + 40 ESRD Patients Nephrologist paid only for periodic office visits with Stage 4 Patients (6 $100/visit) Nephrologist receives $280/month dialysis capitation for 7 months for ESRD pts 116
117 Simplified Example #2: Stage 4 CKD ESRD CURRENT FFS $/Pt # Pts Total $ Nephrologist Stage 4 Pt Visits $ $120, Patients with Stage 4 CKD + 40 ESRD Patients Nephrologist paid only for periodic office visits with Stage 4 Patients (6 $100/visit) Nephrologist receives $280/month dialysis capitation for 7 months for ESRD pts 117
118 Simplified Example #2: Stage 4 CKD ESRD CURRENT FFS $/Pt # Pts Total $ Nephrologist Stage 4 Pt Visits $ $120,000 ESRD Capitation $2, $94, Patients with Stage 4 CKD + 40 ESRD Patients Nephrologist paid only for periodic office visits with Stage 4 Patients (6 $100/visit) Nephrologist receives $280/month dialysis capitation for 7 months for ESRD pts 118
119 Simplified Example #2: Stage 4 CKD ESRD CURRENT FFS $/Pt # Pts Total $ Nephrologist Stage 4 Pt Visits $ $120,000 ESRD Capitation $2, $94,080 Tot. Nephrologist 240 $214,080 Stage 4 PPPY $20, $4,000, Patients with Stage 4 CKD + 40 ESRD Patients Nephrologist paid only for periodic office visits with Stage 4 Patients (6 $100/visit) Nephrologist receives $280/month dialysis capitation for 7 months for ESRD pts Average other spending on Stage 4 Patients = $20,000/pt 119
120 Simplified Example #2: Stage 4 CKD ESRD CURRENT FFS $/Pt # Pts Total $ Nephrologist Stage 4 Pt Visits $ $120,000 ESRD Capitation $2, $94,080 Tot. Nephrologist 240 $214,080 Stage 4 PPPY $20, $4,000,000 ESRD PPPY $55, $2,200, Patients with Stage 4 CKD + 40 ESRD Patients Nephrologist paid only for periodic office visits with Stage 4 Patients (6 $100/visit) Nephrologist receives $280/month dialysis capitation for 7 months for ESRD pts Average other spending on Stage 4 Patients = $20,000/pt Average other spending on ESRD Patients = $55,000/pt 120
121 Simplified Example #2: Stage 4 CKD ESRD CURRENT FFS $/Pt # Pts Total $ Nephrologist Stage 4 Pt Visits $ $120,000 ESRD Capitation $2, $94,080 Tot. Nephrologist 240 $214,080 Stage 4 PPPY $20, $4,000,000 ESRD PPPY $55, $2,200,000 Total Spending 240 $6,414, Patients with Stage 4 CKD + 40 ESRD Patients Nephrologist paid only for periodic office visits with Stage 4 Patients (6 $100/visit) Nephrologist receives $280/month dialysis capitation for 7 months for ESRD pts Average other spending on Stage 4 Patients = $20,000/pt Average other spending on ESRD Patients = $55,000/pt 121
122 Simplified Example #2: Stage 4 CKD ESRD CURRENT FFS $/Pt # Pts Total $ Nephrologist Stage 4 Pt Visits $ $120,000 ESRD Capitation $2, $94,080 Tot. Nephrologist 240 $214,080 Stage 4 PPPY $20, $4,000,000 ESRD PPPY $55, $2,200,000 Total Spending 240 $6,414, Patients with Stage 4 CKD + 40 ESRD Patients Nephrologist paid only for periodic office visits with Stage 4 Patients (6 $100/visit) Nephrologist receives $280/month dialysis capitation for 7 months for ESRD pts Average other spending on Stage 4 Patients = $20,000/pt Average other spending on ESRD Patients = $55,000/pt No payment for non-face-to-face services or case mgt by nephrologist 122
123 Most of the Money Isn t Going to the Nephrologist CURRENT FFS $/Pt # Pts Total $ Nephrologist Stage 4 Pt Visits $ $120,000 ESRD Capitation $2, $94,080 Tot. Nephrologist 240 $214,080 Stage 4 PPPY $20, $4,000,000 ESRD PPPY $55, $2,200,000 Total Spending 240 $6,414,080 Physician Payments = 3.3% of Spending 123
124 What If the Nephrologist Could Slow Progression to ESRD? CURRENT FFS IMPROVED CARE TODAY $/Pt # Pts Total $ $/Pt # Pts Total $ Chg Nephrologist Stage 4 Pt Visits $ $120, ESRD Capitation $2, $94, Tot. Nephrologist 240 $214, Stage 4 PPPY $20, $4,000,000 ESRD PPPY $55, $2,200,000 Total Spending 240 $6,414,
125 Revenue for Stage 4 Patients Would Increase CURRENT FFS IMPROVED CARE TODAY $/Pt # Pts Total $ $/Pt # Pts Total $ Chg Nephrologist Stage 4 Pt Visits $ $120,000 $ $123,600 +3% ESRD Capitation $2, $94, Tot. Nephrologist 240 $214, Stage 4 PPPY $20, $4,000,000 ESRD PPPY $55, $2,200,000 Total Spending 240 $6,414,
126 But Revenue for ESRD Patients Would Decrease CURRENT FFS IMPROVED CARE TODAY $/Pt # Pts Total $ $/Pt # Pts Total $ Chg Nephrologist Stage 4 Pt Visits $ $120,000 $ $123,600 +3% ESRD Capitation $2, $94,080 $2, $79,968-15% Tot. Nephrologist 240 $214, Stage 4 PPPY $20, $4,000,000 ESRD PPPY $55, $2,200,000 Total Spending 240 $6,414,
127 the Nephrology Practice Would Lose Money Overall CURRENT FFS IMPROVED CARE TODAY $/Pt # Pts Total $ $/Pt # Pts Total $ Chg Nephrologist Stage 4 Pt Visits $ $120,000 $ $123,600 +3% ESRD Capitation $2, $94,080 $2, $79,968-15% Tot. Nephrologist 240 $214, $203,568-5% Stage 4 PPPY $20, $4,000,000 ESRD PPPY $55, $2,200,000 Total Spending 240 $6,414,
128 Even Though Medicare Would Save Money on Total Cost of Care CURRENT FFS IMPROVED CARE TODAY $/Pt # Pts Total $ $/Pt # Pts Total $ Chg Nephrologist Stage 4 Pt Visits $ $120,000 $ $123,600 +3% ESRD Capitation $2, $94,080 $2, $79,968-15% Tot. Nephrologist 240 $214, $203,568-5% Stage 4 PPPY $20, $4,000,000 $20, $4,120,000 +3% ESRD PPPY $55, $2,200,000 $55, $1,870,000-15% Total Spending 240 $6,414, $6,193, % 128
129 Win for Patient, Win for Payer, Loss for Physician CURRENT FFS IMPROVED CARE TODAY $/Pt # Pts Total $ $/Pt # Pts Total $ Chg Nephrologist Stage 4 Pt Visits $ $120,000 $ $123,600 +3% ESRD Capitation $2, $94,080 $2, $79,968-15% Tot. Nephrologist 240 $214, $203,568-5% Stage 4 PPPY $20, $4,000,000 $20, $4,120,000 +3% ESRD PPPY $55, $2,200,000 $55, $1,870,000-15% Total Spending 240 $6,414, $6,193, % 129
130 APM Solution: Pay the Nephrologist to Support Improved Care CURRENT FFS APM $/Pt # Pts Total $ $/Pt # Pts Total $ Chg Nephrologist Stage 4 Pt Visits $ $120,000 $ $123,600 +3% ESRD Capitation $2, $94,080 $2, $79,968-15% Stage 4 PMPM $ $98,880 P4P Tot. Nephrologist 240 $214,080 Stage 4 PPPY $20, $4,000,000 ESRD PPPY $55, $2,200,000 Total Spending 240 $6,414,
131 APM Creates Significant Increase in Nephrologist Revenue CURRENT FFS APM $/Pt # Pts Total $ $/Pt # Pts Total $ Chg Nephrologist Stage 4 Pt Visits $ $120,000 $ $123,600 +3% ESRD Capitation $2, $94,080 $2, $79,968-15% Stage 4 PMPM $ $98,880 P4P Tot. Nephrologist 240 $214, $302, % Stage 4 PPPY $20, $4,000,000 ESRD PPPY $55, $2,200,000 Total Spending 240 $6,414,
132 And Medicare Still Saves Money CURRENT FFS APM $/Pt # Pts Total $ $/Pt # Pts Total $ Chg Nephrologist Stage 4 Pt Visits $ $120,000 $ $123,600 +3% ESRD Capitation $2, $94,080 $2, $79,968-15% Stage 4 PMPM $ $98,880 P4P Tot. Nephrologist 240 $214, $302, % Stage 4 PPPY $20, $4,000,000 $20, $4,120,000 +3% ESRD PPPY $55, $2,200,000 $55, $1,870,000-15% Total Spending 240 $6,414, $6,292,448-2% 132
133 Win-Win-Win for Patients, Physician, and Payer CURRENT FFS APM $/Pt # Pts Total $ $/Pt # Pts Total $ Chg Nephrologist Stage 4 Pt Visits $ $120,000 $ $123,600 +3% ESRD Capitation $2, $94,080 $2, $79,968-15% Stage 4 PMPM $ $98,880 P4P Tot. Nephrologist 240 $214, $302, % Stage 4 PPPY $20, $4,000,000 $20, $4,120,000 +3% ESRD PPPY $55, $2,200,000 $55, $1,870,000-15% Total Spending 240 $6,414, $6,292,448-2% Win for Patients Win for Nephrologist Win for Payer 133
134 Protections For Physicians Against Taking Inappropriate Risk Risk Stratification: The payment rates would vary based on objective characteristics of the patient and treatment that would be expected to result in the need for more services or increase the risk of complications. Outlier Payment or Individual Stop Loss Insurance: The payment would be increased if spending on an individual patient exceeds a pre-defined threshold. An alternative would be for the provider to purchase individual stop loss insurance (sometimes referred to as reinsurance) and include the cost of the insurance in the payment bundle. Risk Corridors or Aggregate Stop Loss Insurance: The payment would be increased if spending on all patients exceeds a pre-defined percentage above the payments. An alternative would be for the provider to purchase aggregate stop loss insurance and include the cost of the insurance in the payment bundle. Adjustment for External Price Changes: The payment would be adjusted for changes in the prices of drugs or services from other providers that are beyond the control of the provider accepting the payment. Excluded Services: Services the provider does not deliver, or order, or otherwise have the ability to influence would not be included as part of accountability measures in the payment system. 134
135 How Many Patients Do You Need to (Successfully) Manage Costs?

136 Companies With <1,000 Workers Take Total Healthcare Cost Risk Sources: Employer Health Benefits 2012 Annual Survey. The Kaiser Family Foundation and Health Research and Educational Trust; State-Level Trends in Employer- Sponsored Health Insurance, April State Health Access Data Assistance Center and Robert Wood Johnson Foundation Fewer employees than typical physician practice panel size 136
137 The Keys to Managing Risk How Do Small Employers Manage Self-Insurance Risk? They know who their employees are and can estimate spending They start with what they spent last year and try to control growth They have reserves to cover year-to-year variation They purchase stop-loss insurance to cover unusually expensive cases 137
138 The Keys to Managing Risk How Do Small Employers Manage Self-Insurance Risk? They know who their employees are and can estimate spending They start with what they spent last year and try to control growth They have reserves to cover year-to-year variation They purchase stop-loss insurance to cover unusually expensive cases How Would Physician Practices Manage Risk? They need to know who their patients are in order to project spending They need to start with last year s payments and control growth They need some reserves to cover year-to-year variation They purchase stop-loss insurance to cover unusually expensive cases (if the payment system does not incorporate outlier payments) 138
139 How Does All This Fit Into ACOs? 139
140 Patients Have Many Healthcare Needs PATIENTS Heart Disease Diabetes CKD Pregnancy 140
141 Each Patient Should Choose & Use a Primary Care Practice PATIENTS Heart Disease Diabetes CKD Pregnancy Primary Care Practice 141
142 Which Takes Accountability for What PCPs Can Control/Influence MEDICARE, MEDICAID HEALTH PLAN PATIENTS Heart Disease Diabetes CKD Pregnancy Accountable Medical Home Primary Care Practice Accountability for: Avoidable ER Visits Avoidable Hospitalizations Unnecessary Tests Unnecessary Referrals 142
143 With a Medical Neighborhood to Consult With on Complex Cases MEDICARE, MEDICAID HEALTH PLAN PATIENTS Heart Disease Diabetes CKD Pregnancy Accountable Medical Home Primary Care Practice Endocrinology, Cardiology, Nephrology Accountable Medical Neighborhood Accountability for: Unnecessary Tests Unnecessary Referrals Co-Managed Outcomes 143
144 ..And Specialists Accountable for the Conditions They Manage PATIENTS Heart Disease Diabetes CKD Pregnancy Accountable Medical Home MEDICARE, MEDICAID HEALTH PLAN Primary Care Practice Endocrinology, Cardiology, Physiatry Accountable Medical Neighborhood Accountability for: Unnecessary Tests Unnecessary Procedures Infections, Complications Cardiology Group Nephrology Group OB/GYN Group Heart Episode/ Condition Pmt Kidney Disease Condition Pmt Pregnancy Condition Pmt 144
145 That s Building the ACO from the Bottom Up PATIENTS Heart Disease Diabetes CKD Pregnancy Accountable Medical Home MEDICARE, MEDICAID HEALTH PLAN Primary Care Practice Endocrinology, Cardiology, Nephrology Accountable Medical Neighborhood Alternative Payment Models Cardiology Group Nephrology Group OB/GYN Group ACO Heart Episode/ Condition Pmt Kidney Disease Condition Pmt Pregnancy Condition Pmt 145
146 Most ACOs Today Aren t Truly Reinventing Care Fee-for-Service Payment MEDICARE, MEDICAID HEALTH PLAN Shared Savings Payment PATIENTS Heart Disease Expensive IT Systems ACO Nurse Care Managers Diabetes CKD Share of Shared Savings Payment?? Pregnancy Primary Care Endocrinology Cardiology Nephrology OB/GYN 146
147 Medicare ACOs Aren t Succeeding Due to Flaws in Payment Model 2013 Results for Medicare Shared Savings ACOs 46% of ACOs (102/220) increased Medicare spending Only one-fourth (52/220) received shared savings payments After making shared savings payments, Medicare spent more than it saved 2014 Results for Medicare Shared Savings ACOs 45% of ACOs (152/333) increased Medicare spending Only one-fourth (86/333) received shared savings payments After making shared savings payments, Medicare spent more than it saved 147
148 A True ACO Can Take a Global Payment And Make It Work PATIENTS Heart Disease Diabetes CKD Pregnancy Accountable Medical Home MEDICARE, MEDICAID HEALTH PLAN, EMPLOYER Primary Care Practice Endocrinology, Cardiology, Nephrology ACO Accountable Medical Neighborhood Risk-Adjusted Global Payment Cardiology Group Nephrology Group OB/GYN Group Heart Episode/ Condition Pmt Kidney Disease Condition Pmt Pregnancy Condition Pmt 148
149 You Don t Need a Big Health System to Manage Global Payment Independent PCPs & Specialists Managing Global Payments North Texas Specialty Physicians, a 600 physician multi-specialty IPA in Fort Worth, set up its own Medicare Advantage PPO plan and uses revenues from the health plan and capitation contracts to pay its PCPs 250% of Medicare rates and provides high quality, coordinated care to patients. Joint Contracting by MDs & Hospitals for Global Payments The Mount Auburn Cambridge IPA (MACIPA) and Mount Auburn Hospital jointly contract with three major Boston-area health plans for full-risk capitation. The IPA is independent of the hospital; they coordinate care with each other without any formal legal structure
150 This All Sounds Really Hard
151 This All Sounds Really Hard Can t We Just Keep Doing What We re Doing Today Until We Retire?
152 Choices for the Future VALUE-BASED PURCHASING P4P for hundreds of process measures Shared savings with no changes to FFS Transparency about procedure prices but not the total cost of care Shifting of insurance risk to small providers Government-mandated prices & budgets High deductibles and high cost-sharing Narrow networks & centers of excellence BAD OUTCOMES Small providers forced out of business High prices from consolidated providers Shifts in care to higher-cost settings Overuse of expensive procedures Loss of innovation Large increases in insurance premiums Patients unable to afford necessary care 152
153 Choices for the Future VALUE-BASED PURCHASING P4P for hundreds of process measures Shared savings with no changes to FFS Transparency about procedure prices but not the total cost of care Shifting of insurance risk to small providers Government-mandated prices & budgets High deductibles and high cost-sharing Narrow networks & centers of excellence PHYSICIAN-LED REFORMS Adequate payment for high-value services by specialists as well as PCPs Condition-based payments to support good outcomes, not just low cost procedures Accountability for costs and quality that providers can control, not shifting full risk Accessible data on the utilization and prices for all services in every community Support for community-based, multi-stakeholder solutions to create high-value delivery & payment BAD OUTCOMES Small providers forced out of business High prices from consolidated providers Shifts in care to higher-cost settings Overuse of expensive procedures Loss of innovation Large increases in insurance premiums Patients unable to afford necessary care A SUSTAINABLE FUTURE Collaboration to develop innovative solutions for higher value care Competition to achieve the most effective implementation of solutions Savings by reducing avoidable services, not denying access to needed care Rewards for physicians based on outcomes, not their size or structure Patients able to access affordable care that enables them to be healthy and productive 153


154 Learn More About Win-Win-Win Payment and Delivery Reform 154

155 For More Information: Harold D. Miller President and CEO Center for Healthcare Quality and Payment Reform (412)
CREATING A PHYSICIAN-LED HEALTHCARE FUTURE Better Care for Patients, Lower Healthcare Spending, & Financially Viable Physician Practices & Hospitals
 CREATING A PHYSICIAN-LED HEALTHCARE FUTURE Better Care for Patients, Lower Healthcare Spending, & Financially Viable Physician Practices & Hospitals Harold D. Miller President and CEO Center for Healthcare
REDESIGNING HEALTH CARE FROM THE BOTTOM UP INSTEAD OF FROM THE TOP DOWN
 REDESIGNING HEALTH CARE FROM THE BOTTOM UP INSTEAD OF FROM THE TOP DOWN Supporting Collaborative Regional Approaches to Sustainable High-Value Healthcare Harold D. Miller President and CEO Center for Healthcare
CREATING A PATIENT-CENTERED PAYMENT SYSTEM
 CREATING A PATIENT-CENTERED PAYMENT SYSTEM Better Care for Patients, Lower Healthcare Spending, & Financially Viable Physician Practices & Hospitals Harold D. Miller President and CEO Center for Healthcare
MACRA for Critical Access Hospitals. Tuesday, July 26, 2016 Webinar
 MACRA for Critical Access Hospitals Tuesday, July 26, 2016 Webinar MACRA presenters Harold D. Miller, President & CEO CHQPR Claudia Sanders, Sr. Vice President, Policy Development Andrew Busz, Policy Director,
CREATING PHYSICIAN-FOCUSED ALTERNATIVE PAYMENT MODELS
 CREATING PHYSICIAN-FOCUSED ALTERNATIVE PAYMENT MODELS Better Care for Patients, Lower Cost for Payers, and Financially Viable Physician Practices Harold D. Miller President and CEO Center for Healthcare
Payer s Perspective on Clinical Pathways and Value-based Care
 Payer s Perspective on Clinical Pathways and Value-based Care Faculty Stephen Perkins, MD Chief Medical Officer Commercial & Medicare Services UPMC Health Plan Pittsburgh, Pennsylvania perkinss@upmc.edu
Quality Payment Program and Alternative Payment Models. Brian R. Bourbeau, MBA COA Administrators Network April 11, 2018
 Quality Payment Program and Alternative Payment Models Brian R. Bourbeau, MBA COA Administrators Network April 11, 2018 Speaker Background Associate Director, Business Metrics & Analysis Clinical Affairs
ACOs: California Style
 ACOs: California Style ACO Congress John E. Jenrette, M.D. Chief Executive Officer Sharp Community Medical Group November 2, 2011 California Style California Style A CO California Style California Style
Creating a Patient-Centered Payment System to Support Higher-Quality, More Affordable Health Care. Harold D. Miller
 Creating a Patient-Centered Payment System to Support Higher-Quality, More Affordable Health Care Harold D. Miller First Edition October 2017 CONTENTS EXECUTIVE SUMMARY... i I. THE QUEST TO PAY FOR VALUE
MIPS/APM Proposed Rule Summary On Monday, May 9, 2016 the Centers for Medicare and Medicaid Services (CMS) published in the Federal Register the
 published in the Federal Register the") MIPS/APM Proposed Rule Summary On Monday, May 9, 2016 the Centers for Medicare and Medicaid Services (CMS) published in the Federal Register the proposed criteria for the Quality Payment Program as prescribed
MIPS/APM Proposed Rule Summary On Monday, May 9, 2016 the Centers for Medicare and Medicaid Services (CMS) published in the Federal Register the proposed criteria for the Quality Payment Program as prescribed
Health System Transformation, CMS Priorities, and the Medicare Access and CHIP Reauthorization Act
 Health System Transformation, CMS Priorities, and the Medicare Access and CHIP Reauthorization Act Ashby Wolfe, MD, MPP, MPH Chief Medical Officer, Region IX Centers for Medicare and Medicaid Services
WIN-WIN-WIN APPROACHES TO ACCOUNTABLE CARE
 WIN-WIN-WIN APPROACHES TO ACCOUNTABLE CARE How Providers, Hospitals, Employers, and Patients Can All Benefit from Healthcare Payment and Delivery Reform Harold D. Miller President and CEO Center for Healthcare
The Quality Payment Program Overview Fact Sheet
 Quality Payment Program The Quality Payment Program Overview Background On October 14, 2016, the Department of Health and Human Services (HHS) issued its final rule with comment period implementing the
WELCOME. Kate Gainer, PharmD Executive Vice President and CEO Iowa Pharmacy Association
 WHAT IS MACRA? WELCOME Kate Gainer, PharmD Executive Vice President and CEO Iowa Pharmacy Association WELCOME Anthony Pudlo, PharmD, MBA, BCACP Vice President of Professional Affairs Iowa Pharmacy Association
PALLIATIVE CARE: CHARTING A COURSE MEETING OF THE PATIENT QUALITY OF LIFE COALITION FEBRUARY 18, 2015
 PALLIATIVE CARE: CHARTING A COURSE MEETING OF THE PATIENT QUALITY OF LIFE COALITION FEBRUARY 18, 2015 HENRY R. DESMARAIS, MD, MPA HEALTH POLICY ALTERNATIVES, INC. A POSSIBLE OPTION MENU QUALITY Ø Add palliative
From Surviving to Thriving in the QPP World
 From Surviving to Thriving in the QPP World Today s Objectives Brief MACRA Overview Where are we going?: Advanced Alternative Payment Models (APMs) Where are we now? Merit Incentive-Based Payment System
Alternative Payment Models and Health IT
 Alternative Payment Models and Health IT Health DataPalooza Preconference May 8, 2016 Kelly Cronin, MS, MPH, Director, Office of Care Transformation, ONC/HHS HHS Goals for Medicare Payment Reform In January
MACRA & Implications for Telemedicine. June 20, 2016
 MACRA & Implications for Telemedicine June 20, 2016 Presentation Overview Introductions Deep Dive Into MACRA Implications for Telemedicine Questions Growth in Value-Based Care Over Next Two Years Growth
The Future of Healthcare Delivery; Are we ready?
 The Future of Healthcare Delivery; Are we ready? Lisa K. Saladin, PT, PhD, FAPTA Dean and Professor Medical University of South Carolina copyright LisaSaladin 2016 Objectives 1. Discuss 5 of the projected
MACRA is Coming: Reimbursement for Quality and the Shift to Population-Based Care
 MACRA is Coming: Reimbursement for Quality and the Shift to Population-Based Care AMERICAN NEUROLOGICAL ASSOCIATION October 17, 2017 Marc R. Nuwer, MD PhD Professor and Vice Chair UCLA Lyell K. Jones,
Making the Business Case
 Making the Business Case for Payment and Delivery Reform Harold D. Miller Center for Healthcare Quality and Payment Reform To learn more about RWJFsupported payment reform activities, visit RWJF s Payment
CMS Priorities, MACRA and The Quality Payment Program
 CMS Priorities, MACRA and The Quality Payment Program Ashby Wolfe, MD, MPP, MPH Chief Medical Officer, Region IX Centers for Medicare and Medicaid Services Presentation on behalf of HSAG November 16, 2016
Overview of Quality Payment Program
 Overview of Quality Payment Program Policies for 2017 & 2018 Performance Years The Medicare program has transformed how it reimburses psychiatrists and other clinicians for providing services, under the
QUALITY PAYMENT PROGRAM
 NOTICE OF PROPOSED RULE MAKING Medicare Access and CHIP Reauthorization Act of 2015 QUALITY PAYMENT PROGRAM Executive Summary On April 27, 2016, the Department of Health and Human Services issued a Notice
MACRA Fall into Place. By Stephanie Cecchini, CPC, CEMC, CHISP, AAPC Fellow, AAPC MACRA Prof
 MACRA Fall into Place By Stephanie Cecchini, CPC, CEMC, CHISP, AAPC Fellow, AAPC MACRA Prof About the Presenter https://www.linkedin.com/in/stephaniececchini 2 Introduction Love it Hate it Don t know a
MACRA Implementation: A Review of the Quality Payment Program
 MACRA Implementation: A Review of the Quality Payment Program Neal Logue, Kirk Sadur Centers for Medicare and Medicaid Services, Region IX, September 15, 2017 Disclaimer This presentation was prepared
Payment Reforms to Improve Care for Patients with Serious Illness
 Payment Reforms to Improve Care for Patients with Serious Illness Discussion Draft March 2017 Payment Reforms to Improve Care for Patients with Serious Illness Page 2 PAYMENT REFORMS TO IMPROVE CARE FOR
Population Health or Single-payer The future is in our hands. Robert J. Margolis, MD
 Population Health or Single-payer The future is in our hands Robert J. Margolis, MD Today s problems Interim steps Population health Alternatives Conclusions Outline $3,000,000,000,000 $1,000,000,000,000
Understanding Medicare s New Quality Payment Program
 Understanding Medicare s New Quality Payment Program Your introduction to MACRA and getting started with MIPS 1 Understanding Medicare s New Quality Payment Program 2016 Mingle Analytics. All Rights Reserved.
Navicent Health Physician Group Risk-Based Payments: Assessment of Readiness and Performance for Multiple Reporting Requirements
 Creating Clinically Integrated Health System-Based Medical Groups Collaborative Case Study Navicent Health Physician Group Risk-Based Payments: Assessment of Readiness and Performance for Multiple Reporting
MACRA, MIPS, and APMs What to Expect from all these Acronyms?!
 MACRA, MIPS, and APMs What to Expect from all these Acronyms?! ACP Pennsylvania Council Meeting Saturday, December 5, 2015 Shari M. Erickson, MPH Vice President, Governmental Affairs & Medical Practice
Here is what we know. Here is what you can do. Here is what we are doing.
 With the repeal of the sustainable growth rate (SGR) behind us, we are moving into a new era of Medicare physician payment under the Medicare Access and CHIP Reauthorization Act (MACRA). Introducing the
THE ALPHABET SOUP OF MEDICAL PAYMENTS: WHAT IS MACRA, VBP AND MORE! Lisa Scheppers MD FACP Margo Ferguson MT MSOM
 THE ALPHABET SOUP OF MEDICAL PAYMENTS: WHAT IS MACRA, VBP AND MORE! Lisa Scheppers MD FACP Margo Ferguson MT MSOM THE REASON FOR CHANGE VOLUME TO VALUE Fee-for-service PAYMENT Bundled, Shared Patient FOCUS
Specialty Care Approaches to Accountable Care: A Panel Discussion. Allen R. Nissenson, MD, FACP Chief Medical Officer, DaVita
 Specialty Care Approaches to Accountable Care: A Panel Discussion Allen R. Nissenson, MD, FACP Chief Medical Officer, DaVita 1 Panel Lara M. Khouri, MBA, MPH VP, Health System Development and Integration,
A Practical Approach Toward Accountable Care and Risk-Based Contracting: Design to Implementation
 A Practical Approach Toward Accountable Care and Risk-Based Contracting: Design to Implementation Daniel J. Marino, President/CEO, Health Directions Asad Zaman, MD June 19, 2013 Session Objectives Establish
The Evolving Landscape of Healthcare Payment: Incentive Programs and ACO Model Optimization. Quality Forum August 19, 2015
 The Evolving Landscape of Healthcare Payment: Incentive Programs and ACO Model Optimization Quality Forum August 19, 2015 Ross Manson rmanson@eidebailly.com 701.239.8634 Barb Pritchard bpritchard@eidebailly.com
The Influence of Health Policy on Clinical Practice. Dr. Kim Kuebler, DNP, APRN, ANP-BC Multiple Chronic Conditions Resource Center
 The Influence of Health Policy on Clinical Practice Dr. Kim Kuebler, DNP, APRN, ANP-BC Multiple Chronic Conditions Resource Center Disclaimer Director: Multiple Chronic Conditions Resource Center www.multiplechronicconditions.org
Moving to VBP through MACRA and Other Policies May 18, Cynthia Brown VP, Government Affairs
 Moving to VBP through MACRA and Other Policies May 18, 2017 Cynthia Brown VP, Government Affairs Overview State of play for practices and payments Physicians perspective on today s value-based payment
SVS QUALITY AND PERFORMANCE MEASURES COMMITTEE (QPMC) New Member Orientation
 New Member Orientation") SVS QUALITY AND PERFORMANCE MEASURES COMMITTEE (QPMC) New Member Orientation 2017-2018 SVS QPMC Quality and Performance Measures Committee Policy and Advocacy Council (Chair Sean Roddy) Chair: Brad Johnson,
SVS QUALITY AND PERFORMANCE MEASURES COMMITTEE (QPMC) New Member Orientation 2017-2018 SVS QPMC Quality and Performance Measures Committee Policy and Advocacy Council (Chair Sean Roddy) Chair: Brad Johnson,
MIPS, MACRA, & CJR: Medicare Payment Transformation. Presenter: Thomas Barber, M.D. May 31, 2016
 MIPS, MACRA, & CJR: Medicare Payment Transformation Presenter: Thomas Barber, M.D. May 31, 2016 Michael Porter- Value Based Care Delivery, Annals of Surgery 2008 Principals: Define Value as a Goal Care
BETTER CARE AT LOWER COST THROUGH PHYSICIAN LEADERSHIP
 BETTER CARE AT LOWER COST THROUGH PHYSICIAN LEADERSHIP Redesigning Care Delivery, Payment Systems, & Benefit Designs so Physicians, Hospitals, Patients, & Purchasers All Benefit Harold D. Miller President
Accountable Care and the Laboratory Value Proposition. Les Duncan Director of Operations Highmark Health - Home and Community Services
 Accountable Care and the Laboratory Value Proposition Les Duncan Director of Operations Highmark Health - Home and Community Services Agenda The Goals and Status of Delivery System Reform and Alternative
Medicare Physician Payment Reform:
 Medicare Physician Payment Reform: Implications and Options for Physicians and Hospitals Background The Medicare Access and CHIP Reauthorization Act of 2015 (MACRA) was signed into law on April 14, 2015.
Redesigning Post-Acute Care: Value Based Payment Models
 Redesigning Post-Acute Care: Value Based Payment Models Liz Almeida-Sanborn, MS, PT President Preferred Therapy Solutions This session will address: Discussion of the emergence of voluntary and mandatory
The New Frontier: Value- Based Payment Models
 The New Frontier: Value- Based Payment Models Target Audience: Pharmacists and Pharmacy Technicians ACPE#: 0202-0000-18-026-L04-P/T Activity Type: Knowledge-based Target Audience: ACPE#: Activity Type:
2017/2018. KPN Health, Inc. Quality Payment Program Solutions Guide. KPN Health, Inc. A CMS Qualified Clinical Data Registry (QCDR) KPN Health, Inc.
 KPN Health, Inc.") 2017/2018 KPN Health, Inc. Quality Payment Program Solutions Guide KPN Health, Inc. A CMS Qualified Clinical Data Registry (QCDR) KPN Health, Inc. 214-591-6990 info@kpnhealth.com www.kpnhealth.com 2017/2018
2017/2018 KPN Health, Inc. Quality Payment Program Solutions Guide KPN Health, Inc. A CMS Qualified Clinical Data Registry (QCDR) KPN Health, Inc. 214-591-6990 info@kpnhealth.com www.kpnhealth.com 2017/2018
CMS Quality Payment Program: Performance and Reporting Requirements
 CMS Quality Payment Program: Performance and Reporting Requirements Session #QU1, February 19, 2017 Kristine Martin Anderson, Executive Vice President, Booz Allen Hamilton Colleen Bruce, Lead Associate,
Getting Ready for the Maryland Primary Care Program
 Getting Ready for the Maryland Primary Care Program Presentation to Maryland Academy of Nutrition and Dietetics March 19, 2018 Maryland Department of Health All-Payer Model: Performance to Date Performance
Connected Care Partners
 Connected Care Partners Our Discussion Today Introducing the Connected Care Partners CIN What is a Clinically Integrated Network (CIN) and why is the time right to join the Connected Care Partners CIN?
Passage of Medicare Access and CHIP Reauthorization Act of 2015 (MACRA): The Doc Fix
: The Doc Fix") April, 2015 Passage of Medicare Access and CHIP Reauthorization Act of 2015 (MACRA): The Doc Fix Author: Annemarie Wouters, Senior Advisor The President has signed into law the bipartisan bill H.R. 2,
April, 2015 Passage of Medicare Access and CHIP Reauthorization Act of 2015 (MACRA): The Doc Fix Author: Annemarie Wouters, Senior Advisor The President has signed into law the bipartisan bill H.R. 2,
Physician Compensation in an Era of New Reimbursement Models
 2014 IHA Annual Membership Meeting Physician Compensation in an Era of New Reimbursement Models Taryn E. Stone Ice Miller LLP (317) 236-5872 taryn.stone@ Agenda Background New Reimbursement Models Trends
CMS Oncology Care Model s Standards for Patient Navigation
 CMS Oncology Care Model s Standards for Patient Navigation Nikolas Buescher Executive Director of Cancer Services Penn Medicine, Lancaster November 13, 2017 Ann B Barshinger Health Cancer Institute scale
Thought Leadership Series White Paper The Journey to Population Health and Risk
 AMGA Consulting Thought Leadership Series White Paper The Journey to Population Health and Risk The Journey to Population Health and Risk Howard B. Graman, M.D., FACP White Paper, January 2016 While the
The Patient-Centered Medical Home Model of Care
 The Patient-Centered Medical Home Model of Care May 11, 2017 Louise Bryde Principal Presentation Outline Imperatives for Change Overview: What Is a Patient-Centered Medical Home? The Medical Neighborhood
10/10/2017. Mythbusters: Primary Care Edition (Expanding Opportunities) Amina Abubakar, PharmD, AAHIVP Olivia bentley, PharmD, CFts, AAHIVP
 Amina Abubakar, PharmD, AAHIVP Olivia bentley, PharmD, CFts, AAHIVP") Mythbusters: Primary Care Edition (Expanding Opportunities) Amina Abubakar, PharmD, AAHIVP Olivia bentley, PharmD, CFts, AAHIVP 1 Disclosures Amina Abubakar, PharmD, AAHIVP, RX Clinic Pharmacy and Olivia
Mythbusters: Primary Care Edition (Expanding Opportunities) Amina Abubakar, PharmD, AAHIVP Olivia bentley, PharmD, CFts, AAHIVP 1 Disclosures Amina Abubakar, PharmD, AAHIVP, RX Clinic Pharmacy and Olivia
Understanding PQRS and the Value-Based Modifier: CMS Plan to Achieve High Value Care through Transforming Payment Systems
 Understanding PQRS and the Value-Based Modifier: CMS Plan to Achieve High Value Care through Transforming Payment Systems Dr. Ashby Wolfe, Chief Medical Officer Centers for Medicare and Medicaid Services,
MACRA and the Quality Payment Program. Frequently Asked Questions Edition
 MACRA and the Quality Payment Program Frequently Asked Questions 2018 Edition What is MACRA?...3 What is the Quality Payment Program?...3 How do payments work under the QPP?...3 What is at risk under
HOME DIALYSIS REIMBURSEMENT AND POLICY. Tonya L. Saffer, MPH Senior Health Policy Director National Kidney Foundation
 HOME DIALYSIS REIMBURSEMENT AND POLICY Tonya L. Saffer, MPH Senior Health Policy Director National Kidney Foundation Objectives Understand the changing dynamics of use of home dialysis Know the different
INTRODUCTION TO POPULATION HEALTH. Kathy Whitmire, Vice President
 INTRODUCTION TO POPULATION HEALTH Kathy Whitmire, Vice President 1 Learning Objectives 1. Provide an overall framework for population health 2. Allow clinics to understand why population health is important
Quality Measurement, Population Health and Payment Reform
 Quality Measurement, Population Health and Payment Reform The Move from Volume to Value Dale W. Bratzler, DO, MPH, FACOI, FIDSA Professor, Colleges of Medicine and Public Health Associate Dean, College
Division C: Increasing Choice, Access, and Quality in Health Care for Americans TITLE XV: Provisions Relating to Medicare Part A
 Division C: Increasing Choice, Access, and Quality in Health Care for Americans TITLE XV: Provisions Relating to Medicare Part A Sec. 15001. Development of Medicare study for HCPCS versions of MS-DRG codes
Reinventing Health Care: Health System Transformation
 Reinventing Health Care: Health System Transformation Aspen Institute Patrick Conway, M.D., MSc CMS Chief Medical Officer Director, Center for Clinical Standards and Quality Acting Director, Center for
Glossary of Acronyms for the Quality Payment Program
 The Physicians Advocacy Institute s Medicare Quality Payment Program (QPP) Physician Education Initiative Glossary of Acronyms for the Quality Payment Program 1 P a g e MEDICARE QPP PHYSICIAN EDUCATION
Here is what we know. Here is what you can do. Here is what we are doing.
 With the repeal of the sustainable growth rate (SGR) behind us, we are moving into a new era of Medicare physician payment under the Medicare Access and CHIP Reauthorization Act (MACRA). Introducing the
ESSENTIAL STRATEGIES IN MEDI-CAL PAYMENT REFORM. Richard Popper, Director, Medicaid & Duals Strategy August 3, 2017
 ESSENTIAL STRATEGIES IN MEDI-CAL PAYMENT REFORM Richard Popper, Director, Medicaid & Duals Strategy August 3, 2017 1 DISCLAIMER The enclosed materials are highly sensitive, proprietary and confidential.
Describe the process for implementing an OP CDI program
 1 Outpatient CDI: The Marriage of MACRA and HCCs Marion Kruse, RN, MBA Founding Partner LYM Consulting Columbus, OH Learning Objectives At the completion of this educational activity, the learner will
MACRA Frequently Asked Questions
 Following the release of the Quality Payment Program Interim Final Rule, the American Medical Association (AMA) conducted numerous informational and training sessions for physicians and medical societies.
Statement for the Record. American College of Physicians. Hearing before the House Energy & Commerce Subcommittee on Health
 Statement for the Record American College of Physicians Hearing before the House Energy & Commerce Subcommittee on Health A Permanent Solution to the SGR: The Time Is Now January 21-22, 2015 The American
Perspectives on Primary Care Transformation: Measurement, MACRA, Medical Homes, and Payment Reform
 Perspectives on Primary Care Transformation: Measurement, MACRA, Medical Homes, and Payment Reform Robert A. Berenson, MD Institute Fellow, the Urban Institute rberenson@urban.org Covered California Stakeholder
Moving the Dial on Quality
 Moving the Dial on Quality Washington State Medical Oncology Society November 1, 2013 Nancy L. Fisher, MD, MPH CMO, Region X Centers for Medicare and Medicaid Serving Alaska, Idaho, Oregon, Washington
Goals & Challenges for Outpatient Quality Directors. Quality HealthCare Consulting, LLC CEO: Jennifer O'Donnell, MHA, PCMH-CCE
 Goals & Challenges for Outpatient Quality Directors Quality HealthCare Consulting, LLC CEO: Jennifer O'Donnell, MHA, PCMH-CCE Objectives Learn a practical way for Quality Directors to align Quality Measures
THE REIMBURSEMENT SHIFT: PREPARING YOUR PRACTICE FOR PATIENT-CENTERED PAYMENT REFORM. November 20, 2015
 THE REIMBURSEMENT SHIFT: PREPARING YOUR PRACTICE FOR PATIENT-CENTERED PAYMENT REFORM November 20, 2015 TODAYS PRESENTERS Kavon Kaboli Consultant Galen Healthcare Solutions Cece Teague Consultant Galen
The Future of Physician Reimbursement
 The Future of Physician Reimbursement EBG (PQRS-Quality Measures) yield Outcome Report Yield Increased Quality Yield Decreased Cost yield Increased Patient Satisfaction - CAHPS Consumer Assessment of Healthcare
The Center for Medicare & Medicaid Innovations: Programs & Initiatives
 The Center for Medicare & Medicaid Innovations: Programs & Initiatives Rob Stone, Esq. American Health Lawyers Association Institute on Medicare & Medicaid Payment Issues March 30-April 1, 2012 CMMI Mission
MACRA The shift to Value Based Care and Payment. Michael Munger, M.D., FAAFP
 MACRA The shift to Value Based Care and Payment Michael Munger, M.D., FAAFP Current State Silos of Care Over Utilization Volume over Value Push Towards Value and Quality 85% Medicare Payments tied to quality
Value-Based Reimbursements are Here: Are you Ready?
 Value-Based Reimbursements are Here: Are you Ready? White Paper ELLIS MAC KNIGHT, MD Senior Vice President/CMO Published by Becker s Hospital Review April 2016 White Paper Value-Based Reimbursements are
The Pain or the Gain?
 The Pain or the Gain? Comprehensive Care Joint Replacement (CJR) Model DRG 469 (Major joint replacement with major complications) DRG 470 (Major joint without major complications or comorbidities) Actual
MACRA Quality Payment Program
 The American College of Surgeons Resources for the New Medicare Physician System Table of Contents Understanding the... 3 Navigating MIPS in 2017... 4 MIPS Reporting: Individuals or Groups... 6 2017: The
Volume to Value Transition in the USA
 Volume to Value Transition in the USA Lee A. Fleisher, M.D. Robert D. Dripps Professor and Chair of Anesthesiology Perelman School of Medicine at the University of Pennsylvania Email: lee.fleisher@uphs.upenn.edu
Medicare Quality Payment Program: Deep Dive FAQs for 2017 Performance Year Hospital-Employed Physicians
 Medicare Quality Payment Program: Deep Dive FAQs for 2017 Performance Year Hospital-Employed Physicians This document supplements the AMA s MIPS Action Plan 10 Key Steps for 2017 and provides additional
Value-Based Psychiatric Care
 Value-Based Psychiatric Care North Carolina Psychiatric Association Annual Meeting September 15, 2017 Grace E. Terrell, MD Mission: To be your medical home Vision: To be the model for physician-led health
MACRA Quality Payment Program
 The American College of Surgeons Resources for the New Medicare Physician System Table of Contents Simple Steps to Determine If MIPS Applies to Your Practice Situation... 3 5 Understanding the... 6 7 Big
Specialty Payment Model Opportunities Assessment and Design
 Approved for Public Release. Distribution Unlimited.14.2286. CMS Alliance to Modernize Healthcare (CAMH) Specialty Model Opportunities Assessment and Design Cardiology Technical Expert Panel April 8, 2014
Background and Context:
 Session Objectives: Practice Transformation: Preparing for a Value Based Purchasing Environment Susan Brown, MPH, CPHIMS May 2, 2016 Understand the timeline and impact of MACRA/MIPS on health care payment
Population Health and the Accelerating Leap to Outcomes-Based Reimbursement. Craig J. Wilson
 Population Health and the Accelerating Leap to Outcomes-Based Reimbursement Craig J. Wilson Agenda / Goals Define Population Health Management Review emerging reimbursement landscape eg MACRA Review why
Calendar Year 2014 Medicare Physician Fee Schedule Final Rule
 Calendar Year 2014 Medicare Physician Fee Schedule Final Rule Non-Facility Cap After receiving many negative comments on this issue from physician groups, along with the House GOP Doctors Caucus letter
VALUE PAYMENT: A NEW REIMBURSEMENT SYSTEM USING QUALITY AS CURRENCY
 VALUE PAYMENT: A NEW REIMBURSEMENT SYSTEM USING QUALITY AS CURRENCY Danielle Hansen, DO, MS (Med Ed), MHSA Healthcare Quality/ Value Challenge 1 Value-Based Programs Supports the IHI Triple Aim: 1. Better
Objectives. Preparing for Value-Based Reimbursement 3/28/2016
 Preparing for Value-Based Reimbursement Tracy Bird, FACMPE, CPC, CPMA, CPC-I, CEMC Sr. Advisor Education and Consulting KaMMCO April 12, 2016 1 2 Objectives A look back - how did we get here Existing and
The New World of Value Driven Cardiac Care
 1 The New World of Value Driven Cardiac Care Disclosures MPA Healthcare Solutions is an analytic health care consultancy that provides clients with insight into clinical performance; aids them in the evaluation,
The Healthcare Roundtable
 The Healthcare Roundtable MACRA Update Jayme R. Matchinski Greensfelder, Hemker & Gale, P.C. April 7, 2017 New Orleans, Louisiana This presentation and outline are limited to a discussion of general principles
Kate Goodrich, MD MHS. Director, Center for Clinical Standards & Quality. Center for Medicare and Medicaid Services (CMS) May 6, 2016
 May 6, 2016") Kate Goodrich, MD MHS Director, Center for Clinical Standards & Quality Center for Medicare and Medicaid Services (CMS) May 6, 2016 THE MEDICARE ACCESS & CHIP REAUTHORIZATION ACT OF 2015 Quality Payment
Kate Goodrich, MD MHS Director, Center for Clinical Standards & Quality Center for Medicare and Medicaid Services (CMS) May 6, 2016 THE MEDICARE ACCESS & CHIP REAUTHORIZATION ACT OF 2015 Quality Payment
Value-Based Care Emergent Care Services. Presented by Cliff Frank Partnera Partners LLC
 Value-Based Care Emergent Care Services Presented by Cliff Frank Partnera Partners LLC Problem Un-doctored consumers are driving $575 billion inappropriate emergent care Fee-for-service ER visits add another
MACRA MACRA MACRA 9/30/2015. From the Congress: A New Medicare Payment System. The Future of Medicare: A Move Toward Value Driven Healthcare W20.
 W20.8XXA The Future of Medicare: A Move Toward Value Driven Healthcare Emily L. Graham, RHIA, CCS-P VP, Regulatory Affairs, Hart Health Strategies Consultant, Coalition of State Rheumatology Organizations
New York State Medicaid Value Based Payment: Data Driven Strategies. Bundled Payment Summit June 27, 2017
 New York State Medicaid Value Based Payment: Data Driven Strategies Bundled Payment Summit June 27, 2017 Panelists Moderator Paloma Hernandez Anthony Thompson Marc Berg President and CEO Urban Health Plan
04/03/2015. Quality Matters: How to Succeed with PQRS in A Short History of PQRS. Participate Or Else..
 Quality Matters: How to Succeed with PQRS in 2015 Jeanne Chamberlin, MA, FACMPE Director, MSOC Health A Short History of PQRS 2007: 3 measures on 80% 2% Bonus 2012: 3 measures on 50% / 80% 0.5% Bonus Performance
March Data Jam: Using Data to Prepare for the MACRA Quality Payment Program
 March Data Jam: Using Data to Prepare for the MACRA Quality Payment Program Elizabeth Arend, MPH Quality Improvement Advisor National Council for Behavioral Health CMS Change Package: Primary and Secondary
Quality Measures and Federal Policy: Increasingly Important and A Work in Progress. American Health Quality Association Policy Forum Washington, D.C.
 Quality Measures and Federal Policy: Increasingly Important and A Work in Progress American Health Quality Association Policy Forum Washington, D.C. February 9, 2016 Quality Journey NCQA Develops Health
RE: Medicare Program; CY 2018 Updates to the Quality Payment Program (CMS P)
") Seema Verma Administrator Centers for Medicare and Medicaid Services U.S. Department of Health and Human Services Hubert H. Humphrey Building 200 Independence Ave, SW Washington, DC 20201 RE: Medicare
Seema Verma Administrator Centers for Medicare and Medicaid Services U.S. Department of Health and Human Services Hubert H. Humphrey Building 200 Independence Ave, SW Washington, DC 20201 RE: Medicare
Decoding the QPP Year 2 Quality Measure Benchmarks and Deciles to Maximize Performance
 Decoding the QPP Year 2 Quality Measure Benchmarks and s to Maximize Performance Leila Volinsky, MHA, MSN, RN, PCMH CCE, CPHQ Senior Program Administrator New England Regional Lead Quality Payment Program
CHIA PRESENTATION HANDOUT
 5055 E. McKinley Ave, Fresno CA 95407 Tel: (559) 251 5038 Info@ CHIA PRESENTATION HANDOUT 2018 CHIA CONVENTION & EXHIBIT SAN DIEGO, CA MACRA and HIM Doing the Impossible Presented by: Moshe Starkman Presented