Who is Giving and Who is Getting?
|
|
|
- Eustacia Grant
- 5 years ago
- Views:
Transcription
1 SPRING 2014 Who is Giving and Who is Getting? Charitable Giving in Mercer County, New Jersey A study conducted by the Edward J. Bloustein School of Planning and Public Policy Rutgers, The State University New Jersey in cooperation with Isles, Inc. and the Mid Jersey Chamber of Commerce Meera Ananth Natalia Cámpora Jiamin He Steve Malencheck Ajay Mirmira Norman J. Glickman, Distinguished University Professor of Planning and Public Policy
2 Acknowledgements We would like thank Marty Johnson of Isles, Inc. and Nicol Nicola of the MIDJersey Chamber of Commerce for their help and guidance throughout this project. We also thank Nancy Kieling of the Princeton Area Community Foundation for her insights into philanthropy in Mercer County, New Jersey. We are also grateful to Larry McGill and David Wolchek of the Foundation Center for significant assistance with data on giving through foundations.
3 Who is Giving and Who is Getting? Charitable Giving in Mercer County, New Jersey Table of Contents Introduction... 2 Limitations and Parameters of the Study... 4 The Landscape of the Nonprofit Sector... 4 Mercer County: Demographics Mercer County Tax Returns: A Snapshot of Individual Giving in Nonprofit Foundations in Mercer County New Jersey Funding Influxes, Mercer County Outgoing Foundation Funds: Mercer County Comparison: Inflows and Outflows of Mercer Foundation Grants A Closer Look: Mercer Foundations Giving Back to the County Conclusion...29 Policy Recommendations...32
4 Who is Giving and Who is Getting? Charitable Giving in Mercer County, New Jersey Who is Giving and Who is Getting? Charitable Giving in Mercer County, New Jersey Introduction Americans gave nearly $ billion to charity in People donate for different reasons: to support schools and colleges, hospitals, and churches; to encourage scientific innovation through universities; and to foster social change through community-based organizations. We understand a good deal about why Americans donate, however, we lack an in-depth understanding of how the philanthropic sector operates. Specifically, we recognize much less about how our donations are used to further the causes we believe in. In this report, we attempt to shed light on the philanthropic sector in the United States. Despite the resources dedicated to philanthropy, not much is known about how the sector works. According to the IRS, over 38 million people claimed at least one charitable contribution on their tax return in We know the amount that Americans donate, but we know little about what happens to these resources after the donations have been made by institutions and people. Where does the money go? How efficiently are these gifts used? Are these gifts used according to the donors wishes? The answers to all of these questions are not mandated by law to be answered, yet billions of tax exempt dollars are being funneled into this sector yearly on the assumption that they are being used for good. Philanthropy experts have asked how non-profits, charities, and foundations use the money gifted to them. During our research, many more questions were raised than answered, as well as problems stemming from the lack of data available to the public about these organizations. However, before we delve into specifics to answer these questions, a more basic question stands: why do people give? To better understand why people give, a look at the history of charity and philanthropy is useful. Charity began as a Christian practice, dating back to the early settlers. These Puritan settlers used charity as a means to serve others. The purely religious element of giving changed later in American history, however, with the creation of large philanthropic institutions. 3 Wealthy businessmen, such as Andrew Carnegie and John D. Rockefeller, created these institutions to advance culture, academia, and provide services to the poor and needy. Not only did the formation of these institutions give rise to the philanthropic sector in the United States, it led to closer collaboration with government. Since the early days of these foundations, the philanthropic sector has grown in both size and economic significance. Today, the nonprofit sector is one of the top three employers in the United States, following retail and 1 Giving USA: Charitable Donations Grew in 2012, but Slowly, Like the Economy. Web. 28 Apr Congressional Budget Office. Curtail the Deduction for Charitable Giving. Web. 04 May Zunz, Olivier. Philanthropy in America: A History. Princeton, NJ: Princeton UP, Print. 2
5 manufacturing. Philanthropy has grown to play an increasingly important role in bringing about social change. For years there has been debate about the reformation of social welfare policies. In light of this debate and the changes in policy, private charitable activity has begun to play a role in reviving troubled neighborhoods and assisting individuals who cannot make it on their own. 4 Despite the increasing importance of philanthropy in addressing social issues, the system remains deficient. One critique of the current system is that far too little charitable giving is targeted at the communities with the greatest needs. Nonetheless, charitable giving has a great potential in positively affecting social hardships, if utilized effectively. Unfortunately, optimal practices are not easily attainable. This report aims to establish a foundation for a more comprehensive understanding of current philanthropic practices, current trends in giving, and mechanisms to improve the system. To contribute to the assessment of the current philanthropic system, this report will look at the charitable giving operation in Mercer County, New Jersey. Our goal was to answer some of these questions and achieve a better understanding of the philanthropic sector, the manner of funding, and what specific causes funding supports. This is as commissioned by the Rutgers University s Edward J. Bloustein School of Planning and Public Policy in cooperation with Isles, Inc. of Princeton, New Jersey and the Mid Jersey Chamber of Commerce of Mercerville, New Jersey. This report explores demographics in the region in an effort to provide a clearer picture of the social and economic dynamics in the region. We will look at giving trends in the United States as well as giving trends in both New Jersey and Mercer County. The purpose of this report is to explore trends in the current charitable giving system, to shed light on its effectiveness, and to inform future research. 4 Alexander, L. (1997). The New Mission for Philanthropy. (Cover story). Policy Review, (85), 46. 3

6 Who is Giving and Who is Getting? Charitable Giving in Mercer County, New Jersey Limitations and Parameters of the Study During our examination of the charitable funding streams in Mercer County, the research team encountered three major limitations. The first was the lack of access to individual giving information. While aggregate data is available on contributions from individuals, we were unable to find specifics on contributions under $1 million. The second major limitation we faced was the parameters of the Foundation Center 5 data. The Foundation Center has the most reliable information detailing funding inflows and outflows as they relate to nonprofit organizations; nonetheless, the data is still less than complete. The third data constraint we encountered was the lack of information about religious giving. This is particularly significant because of the substantial amount of charitable funds that support religious giving. In large part, this is due to the United States government not requiring the reporting of grants and donations by religious organizations. These limitations are compounded by the fact that there are not enough reporting measures within the philanthropic system. Although these challenges restrict the detail of analysis in this report, we are confident that the conclusions of this study will have important practice and policy implications. Furthermore, it is our hope that the analysis generated within the described parameters of this study will set the stage for future thought, interest, and research in the field. The Landscape of the Nonprofit Sector Figure 1 Four distinct sources support philanthropy: individuals, corporations, foundations, and bequests. Individuals overwhelmingly lead. According to the Foundation Center, in percent ($ billion) of private giving came from living individuals. Foundations accounted for 15 percent ($47.43 billion) of all giving. Corporations contributed an additional 6 percent ($18.97 billion). The remaining 7 percent ($22.14 billion) of contributions came from individuals after death in the form of bequests, as shown in Figure 1. Corporate foundations are classified as foundations and not corporations; these contributions go to 501(c)(3) and 501(c)(4) organizations. According to the IRS Code, 501(c)(3) and 501(c)(4) 5 The Foundation Center is the leading source of information about philanthropy worldwide. Philanthropy Non-Profit Services About Us Foundation Center. Web. 04 May
(3) organizations take the form of either a public charity, private foundation, or private operating foundation with open membership.")
(3) charities operated in Mercer County in 2013, 7 the fourth highest county in New Jersey behind Essex,")
(3) and the 501(c)(4) organizations operating in Mercer County are combined, we find that Mercer has the second highest in the state, only behind Bergen County.")
7 organizations are nonprofit organizations that are exempt from paying federal income tax. 501(c)(3) organizations take the form of either a public charity, private foundation, or private operating foundation with open membership. 501(c)(4) organizations are civic leagues or associations that are operating exclusively for the advancement of social welfare or local groups of employees with limited membership. 6 According to the Urban Institutes National Center for Charitable Statistics, 1, (c)(3) charities operated in Mercer County in 2013, 7 the fourth highest county in New Jersey behind Essex, Bergen, and Monmouth counties. When the number of 501(c)(3) and the 501(c)(4) organizations operating in Mercer County are combined, we find that Mercer has the second highest in the state, only behind Bergen County. Figure 2 Figure 3 The 1, (c)(3) organizations in Mercer hold $29 billion in assets, the highest by far in New Jersey. More than $20 billion of these assets are held by Princeton University; however, even after removing Princeton University s assets from the figure, the remaining 501(c) (3) organizations in Mercer County hold $8.2 billion in assets. This is still the highest in the state. Figure 4 Mercer County: Demographics When analyzing the demographic data provided by the Census Bureau, 8 we found that on average, both the state of New Jersey and Mercer County are wealthier and more educated than the nation as a whole. Both New Jersey and Mercer County have higher annual per capita income and median household income, as well as lower poverty rates. As shown by Figure 2 and Figure 3, annual per capita income in New Jersey ($35,928) is 6 The Difference between 501(c)(3) and 501(c)(4) Organizations. NJ.com. Web. 29 Apr Private Foundations in Mercer County, NJ. Private Foundations in Mercer County, NJ. Web. 29 Apr Quick Facts from the US Census Bureau. Web. 04 May
 is more than $18,000")
 and New Jersey (9.9%) are both considerably lower than the national average (14.9%). In addition, both New Jersey and Mercer are more educated than the nation as whole, as shown in Figure 4.")
8 Who is Giving and Who is Getting? Charitable Giving in Mercer County, New Jersey Figure 5 Figure 6 Figure 7 almost $8,000 higher than the national average and median household income in New Jersey ($71,637) is more than $18,000 higher than the national average. In Mercer, annual per capita income ($37,246) and median household income ($73,759) are slightly higher than the state average. Furthermore, poverty rates in Mercer (10.8%) and New Jersey (9.9%) are both considerably lower than the national average (14.9%). In addition, both New Jersey and Mercer are more educated than the nation as whole, as shown in Figure 4. Looking at Mercer County as a whole, however can be quite misleading. Despite appearing to be wealthier and more educated than the national average, a closer look Mercer County shows great disparities. For instance, the city of Trenton does not share the same wealth characteristics and high levels of education as the rest of the county. As Figure 5 and Figure 6 show, Trenton has a lower annual per capita income ($17,738) and lower median household income ($36,727) than the statewide average. 9 Both annual per capita income and median household income in Trenton are approximately half of the countywide average. Similarly, the poverty rate in Trenton (23.2%) is more than twice the poverty rate in Mercer County as a whole (10.8%). In addition to the problems of poverty in Trenton, Figure 7 exemplifies the inconsistency related to education and higher education in Mercer. The percentage of high school graduates in Trenton (70.5%) is more than 15 percent below the countywide average. The issue is further amplified when looking at the percentage of people with a bachelor s degree or higher (10.9%) in Trenton, which is approximately a quarter of the countywide average. Despite being in a well-educated and quite wealthy county, Trenton remains an area of great need. As such, the need for philanthropy in Mercer County is greater than a cursory glance would suggest. 9 Data for different cities within Mercer County. American Community Survey. Data & Documentation U.S. Census Bureau. Web. 04 May
 and Hispanics/Latinos (34.")

9 Figure 8 Figure 9 As Figure 8 shows, both Mercer and New Jersey are slightly more diverse than the nation, with higher percentages of African American, Hispanics/Latino, and Asian American populations. A breakdown of the county demographics shows that Trenton is far more diverse than the rest of the county. As illustrated in Figure 9, African Americans (48.4%) and Hispanics/Latinos (34.1%) account for over 80 percent of the population in Trenton. Mercer County Tax Returns: A Snapshot of Individual Giving in 2011 While traditionally there has not been much information provided by the IRS on individual income tax data, more recently there has been a greater effort to collect and release this information. This section examines the first round of county level data released by the IRS, detailing activities in Within this report, we compare Mercer to both New Jersey and the United States. Figure 10 examines the total breakdowns of five variables with respect to the U.S., New Jersey, and Mercer County. Columns (2) and (4) examine, respectively, nominal figures on total returns claiming charitable donations, and the total amount of those claims. 10 More interestingly, Columns (3) and (5) look at these figures in percentage terms, relative to total number of returns claimed and total taxable income. In Column (3), we see that the national 10 The IRS describes contribution deductions in the following way: Taxpayers could deduct contributions to certain organizations that were religious, charitable, educational, scientific, or literary in purpose. Contributions could be in cash, property, or out-of-pocket expenses that a taxpayer paid in doing volunteer work for a qualified organization. Contributions were allowed as an itemized deduction on Schedule A. Index of Public IRS Statistics of Income. Index of /pub/irs-soi. Web. 04 May
10 Who is Giving and Who is Getting? Charitable Giving in Mercer County, New Jersey Figure 10 Mercer Residents Were Generous Figure 11 average for contributions claimed on a tax return is about 35 percent, meaning that about onethird of those filing tax returns in 2011 reported making at least one charitable contribution. Comparatively, both New Jersey and Mercer County are well above the nation in terms of numbers of contributions, to the tune of about 10 percent more of the population. In terms of amount of money given, however, New Jersey falls behind the nation in percent of income donated 11 and in average grant amount per return. Interestingly, Mercer County comes in just above the nation and well above the state in these two categories. The IRS does not break this information down further by location; but it does break it down by income levels, which can carefully be used to relate to certain areas in Mercer. Figure 11 looks at the nominal figures reported above in respect to New Jersey and Mercer, broken down by gross income. 12 This figure gives an overall snapshot of who is giving. For instance, for both New Jersey and Mercer, those with incomes between $100,000 and $200,000 were 11 Again, it is important to remember that this is as a percentage of total taxable income. 12 Information for the entire nation is strangely enough not available, as far as we can tell, for this information broken into the same groupings. As of the time of this paper, we have not been able to find comparable measures for the U.S., though we believe they are available somewhere, given the fact that they are available by county. 8
11 Figure 12 responsible for the greatest number of returns claiming contributions (Column (2)), while those making over $200,000 were responsible for the largest total amounts given. Figure 12 examines the same variables as a percentage of overall totals and looks at average donation amounts. This data paints a different picture than Figure 11. No longer is the $100,000 to $200,000 range the most prolific in terms of contribution frequency (Column (2)), but instead shows that donation percentages increase steadily with income, which is to be expected as people earn more disposable income, they are more likely to donate more, suggesting once again that people view philanthropy as a luxury. Column (3) provides an interesting comparison. While it is true that the data suggest that more income leads to more contributions (Figure 12), the percentage of money given 13 seems to follow an opposite trajectory. When looking at New Jersey as a whole, those making less than $25,000 a year give the most money out of their income (3.2%) as compared to the rest of the income categories, most of which hover almost a full percentage point below or lower. Mercer County is slightly different in that contributions of those under $25,000 remain the same (3.2%), but the percentages of tax income being contributed in other income groups is greater. In Mercer County, those making the most also contribute the most as well and at a much higher rate than the remainder of the United States, which is what we would have normally expected. 13 Relative to overall taxable income. 9


12 Who is Giving and Who is Getting? Charitable Giving in Mercer County, New Jersey Figure 13 Figure 14 The value of these data will increase substantially with the release of additional years of data. New data will provide more information on countywide-level philanthropic giving, as opposed to simply giving a snapshot of a specific year as shown in this report. Future iterations of this research should reflect this new information and may be useful for creating models predicting philanthropic trends. While total information on individual giving is unlikely to become available, a dataset is available that collects information on all donations made of $1 million or more, including individual gifts. 14 Between 2000 and 2013, there were $392 billion total donations of over $1 million in the United States. As Figure 13 shows, individuals accounted for 41 percent ($161 billion). While donations to Foundations (51.7%) were the single largest category of all million-dollar donations given by individuals nationally, Education and Higher Education received more than any other single cause. To explain, 30.7 percent ($120 billion) of milliondollar donations from individuals were allocated either to Education or Higher Education. A similar emphasis on education can be seen when looking only at million-dollar donations in New Jersey. Of the $3.4 billion of million-dollar donations received in New Jersey from 2000 to 2013, 31.9% ($1.1 billion) came from individuals. Eighty-six percent ($946 million) of all gifts over a million dollars from individuals went to either Education or Higher Education. These donations dwarf donations made to Human Services, Health, and Public/ Society Benefit combined. The relatively small amount of funds being earmarked for these causes underscore the theme that philanthropy is not necessarily aimed at addressing the needs of the neediest; rather, philanthropy is driven by the desires of those who give. 14 The Million Dollar List, compiled by the Indiana University Lilly Family School of Philanthropy, documents publicly announced gifts of $1 million or more. The Million Dollar List it is not a comprehensive record of all million dollar plus gifts Million Dollar List Initial Findings. Web. 04 May
13 Nonprofit Foundations in Mercer County, New Jersey As has been stated, the majority of philanthropic gifts come from individual donors. However, because there is limited information available about this group, this next section will focus on an analysis of the activities of nonprofit foundations. Foundations account for about 15 percent of all philanthropic giving. 15 Since activities of nonprofit foundations are more effectively tracked, we use foundation data for the next section to characterize philanthropy in Mercer County. The Foundation Center s database consists of information collected from both IRS tax returns as well as from voluntary information disclosed by individual foundations themselves. 16 It must be noted that this data is neither complete nor is it representative; it is, however, the most comprehensive database that exists related to foundation giving. The strategy of the Foundation Center is to collect data on grants from the largest grantmakers first. This is because the larger grantmakers are giving the most, and thus have a more noteworthy presence in the statistics. The Foundation Center collects many other information points for each grant that includes, but is not limited to, the total amount, the year issued, to what purpose it was given, and information on both the grantmaker and recipient. There are four types of foundations: public charities, independent foundations, operating foundations, and corporate foundations. Traditionally, the term public charities defines all grantmaking non-profits. It is important to note however, that the Foundation Center makes a distinction here, and uses the term public charities to characterize community foundations. We disaggregate the four foundation types into two main categories: private foundations and public foundation. Private foundations are those funded by private donations. Either a single individual, who bequeaths money to the organization, or one or more for-profit organizations can fund them. 17 Examples of these are independent and corporate foundations. 18 Legally, the only characteristic that separates private foundations from public foundations is the tax 15 The Foundation Center. 16 IRS Form 990 tax return data is much more complete and accessible than trying to contact each individual grant maker. The problem with IRS data is that is quite simply takes them so much time to release- as of the writing of this paper, the IRS had only released 990 forms (from which this data is collected) as late as A private foundation is technically defined as: A nongovernmental, nonprofit organization with funds (usually from a single source, such as an individual, family or corporation) and program managed by its own trustees or directors, established to maintain or aid social, educational, religious or other charitable activities serving the common welfare, primarily through grant making. U.S. private foundations are tax-exempt under Section 501(c)(3) of the Internal Revenue Code and are classified by the IRS as a private foundation as defined in the code. Glossary. Yellow Springs Community Foundation. Web. 04 May It is worth noting that corporate foundation grants (at least in our data) differ from corporate giving. A grant made by a corporation would not be captured here, but a grant made by a corporate foundation would, even though both are coming from the same place. 11

14 Who is Giving and Who is Getting? Charitable Giving in Mercer County, New Jersey Figure 15 Figure 16 Figure 17 Figure 18 forms they file; private foundations use Form 990-PF, while the public foundations use Form 990. Also within this group are operating foundations. Operating foundations, while making grants, are those that use much of their resources to operate their own charitable programs, hence the name. Public foundations are those that receive money from various donors, which then use their endowments to provide grants. 19 Public charities and community foundations fall under the 19 A public foundation is technically defined as: Public foundations, along with community foundations, are recognized as public charities by the IRS. Although they may provide direct charitable services to the public as other nonprofits do, their primary focus is on grant making. To be eligible for membership in the Council, a public foundation must grant at least $60,000 yearly and must dedicate at least 50 percent of its organizational budget to a competitive grant-making program. Glossary. Yellow Springs Community Foundation. Web. 04 May
15 Figure 19 category of public foundations. Public foundations usually have very specific missions and geographical areas of funding concentration. Within this dataset, we recorded information for foundations that provided grants, whether they were public or private foundations. Nationally, the breakdown of the number of each different type of foundation and how much each type gives (in 2011) can be seen in Figure 15 and Figure 16. For New Jersey, we show the breakdowns in Figures 17 and The remainder of this section examines the funding activities of these foundations in Mercer County. We look at foundation gifts coming into the county from the rest of the country, foundation gifts originating in Mercer County and going to the rest of the country, and foundation gifts originating and staying within Mercer County. 20 Only grant making operating foundations are included. For some operating foundations, total giving amount includes grants and program expenses; for others, total giving includes only grants. Most operating foundations qualifying distributions are paid out of administration of operating programs and not for grants. Private foundations in Puerto Rico, the Virgin Islands and American Samoa are not required to file Form 990-PF. Only a few voluntary reporters are represented. Grant making Foundations Nationwide, 2011 Stats about the Number of Foundations, Assets, Giving, and Gifts Received by All Active Grant making Foundations in the U.S.. Guide to the Foundation Center s Research Database. Web. 04 May


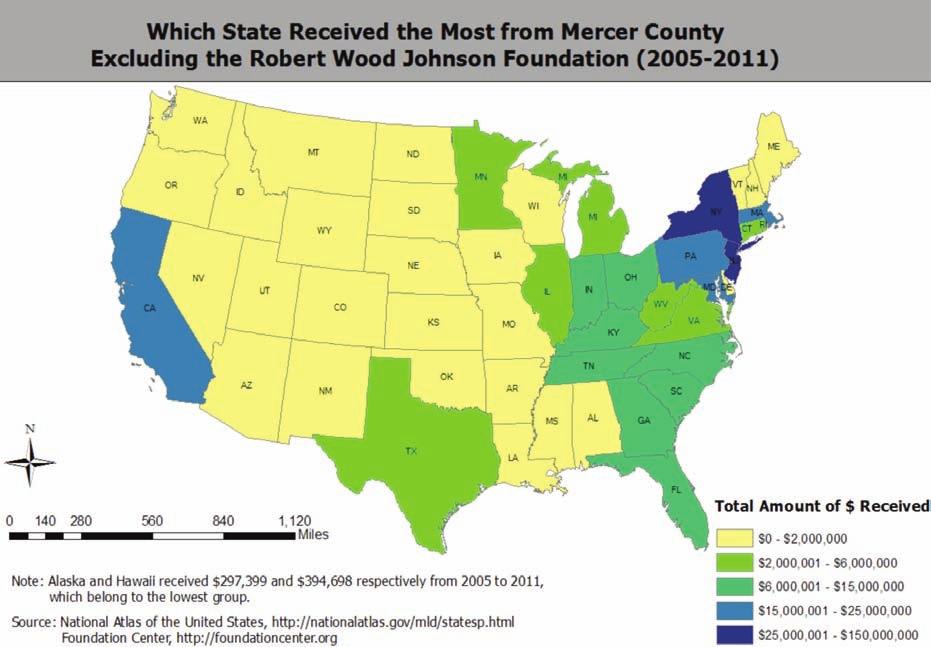
16 Who is Giving and Who is Getting? Charitable Giving in Mercer County, New Jersey Figure 20 Funding Influxes, Mercer County Figure 19 depicts a map of where foundation gifts to Mercer are coming from nationally, by state. The map shows the total volume of money received from the years 2005 to The aggregate represents the most complete set of data. In the map, states that contributed more money are shaded darker in color. Figure 21 As shown in Figure 19, four states account for a bulk of the contributions to Mercer County: New York, New Jersey, California, and Washington. While it was expected that both New Jersey and New York would be major contributors, the inclusion of California and Washington as major contributors was surprising. Initially, we believed that this could be attributable to gifts to Princeton University. However, when Princeton University was excluded from our analysis, both California and Washington remained as major contributors, as Figure 20 shows. Interestingly, contributions to Mercer County from New York were higher than contributions from New Jersey during any given year. However, when factoring in the sheer number and size of New York foundations, this result is reasonable. 21 Furthermore, from this data we can see the impact of the recent financial crisis on philanthropy, especially when looking at New York and New Jersey. Figure 21 better illustrates the impact of the recession. This graph, depicting the total foundation contributions to Mercer County over time (both including and excluding Princeton University), shows the effects of the recent recession. As the economy improved from , there is an obvious uptick in giving. Then in 2009 there is a precipitous drop in giving, attributable to the Great Recession. Additionally, giving began to rebound as the economy began recovering Foundation Center - Top 100 US Foundations by Total Giving. Web. 04 May 2014.

17 Figure 22 15
 is more of a luxury gift.")
18 Who is Giving and Who is Getting? Charitable Giving in Mercer County, New Jersey Figure 23 This trend reinforces an expected hypothesis philanthropic giving (at least, from foundations) is more of a luxury gift. More money is given when people can afford to give, and downturns in the economy have severely detrimental impacts on philanthropy. While this may be selfevident, we believe this point should be underscored due to its relevance to those applying for grants. An interesting question, and one beyond the scope of this paper, is whether or not individual giving responds in the same manner, and if so to what degree. Moving down from a national to state scale, Figure 22 represents the amount of money gifted to Mercer County from the counties of New Jersey. Most grantmakers were from the central and northern part of the state, with top givers being Mercer ($128 million), Morris ($26 million), and Monmouth ($9 million) counties. Figure 23 and Figure 24 provide a visual representation of funding by category that Mercer County received in total in 2011, including and excluding the recipient Princeton University. Figure 23 shows funding by categories in Mercer County including Princeton University by categories. We see that Education (45.5%) received the most funding, followed by Sciences (19.3%), Arts (11.0%), and Medical Services (8.5%). The category Human Services accounted for 4.9% and Religion only 0.4%. Figure 24 presents the same information, but excludes the Princeton University. When excluded, we see a similar distribution of funding, with Sciences (27.5%) receiving the most of any category, followed by Education (22.4%), Arts (15.7%), Medical Services (12.1%), and Human Services (7.0%). 16


19 Figure 24 Figure 25 Figure 26 When compared, it is observed that Science funding exceeds Education funding when Princeton University is excluded; other categories increase their relative funding proportions as well. Figure 25 and Figure 26 show the total amount of money donated by the type of foundations from 2005 to Since independent foundations contribute such a large proportion of money donated, the second graph excludes them to provide a clearer picture of public charities, community foundations, corporate foundations, and operating foundations. We can see in Figure 25 that independent foundations provide the greatest amount of donations; the figures also display the decrease in the total donations suffered in 2009, during the economic recession. The second figure (Figure 26) displays the increasing role of community foundation 17
20 Who is Giving and Who is Getting? Charitable Giving in Mercer County, New Jersey Table 1 Ranking Name of Granter Grants to Mercer Total Grants Percentage to ( ) ( ) Mercer 1 The Robert Wood Johnson Foundation $79,703,285 $2,466,957, % 2 Johnson Art and Education Foundation $13,706,590 $14,659, % 3 The Charlotte W. Newcombe Foundation $5,363,259 $14,812, % 4 The Fund for New Jersey $4,907,000 $19,500, % 5 Princeton Area Community Foundation, Inc. $4,759,852 $6,074, % 6 The Charles Evans Foundation $3,128,000 $41,178, % 7 George H. and Estelle M. Sands Foundation $2,645,700 $2,992, % 8 The Corella & Bertram F. Bonner Foundation, Inc. $2,110,243 $71,248, % 9 Harbourton Foundation $1,063,408 $1,960, % 10 Martinson Family Foundation, Inc. $1,012,700 $4,048, % 11 The Atlantic Foundation $1,000,000 $1,241, % 12 Rita Allen Foundation, Inc. $885,000 $6,485, % 13 The Gordon and Llura Gund Foundation $685,244 $47,837, % 14 Educational Ventures, Inc. $632,174 $1,316, % 15 The Olsen Foundation, a New Jersey Nonprofit Corporation $533,300 $3,506, % 16 The Kovner Foundation $525,000 $86,693, % 17 The RuthMarc Foundation, Inc. $489,500 $1,292, % 18 The Curtis W. McGraw Foundation $419,750 $896, % 19 The James Kerney Foundation $395,167 $395, % 20 The Sussman Family Foundation, Inc. $359,000 $490, % giving made after 2009; chiefly, community foundations began to donate more than corporate foundation. One possible explanation for this is that the economic recession had a stronger effect on corporations, and thereby their respective corporate foundations. Future research should further examine these kinds of donations by type, to see if that tendency changes back when the economy is fully recovered. 18

21 Figure 27 Outflows of Foundation Funds: Mercer County Analyzing the incoming funding to Mercer has allowed us to provide a picture of one facet of the charitable giving profile. Our analysis of outgoing funding in this next section of the report will further deepen our understanding of charitable giving in the region. Particularly, we are looking at how much foundations in Mercer are giving, and where. Table 1 presents the top Mercer grantors who most support Mercer County. The Robert Wood Johnson (RWJ) Foundation donated nearly $2.5 billion nationally from 2005 to Despite only 3.2 percent of its grants going to Mercer, it is still the biggest grantor in the county. This activity is juxtaposed by community foundations who give a significantly large proportion of their grants to support the county. Such organizations include the Johnson Art and Education Foundation (93.5%) and Princeton Area Community Foundation (78.4%). Similar to what was observed regarding incoming contributions, we found that grants originating from Mercer were sensitive to the economic climate. Total giving from Mercer increased from 2005 to 2008, and then proceeded to drop in 2009 and 2010 during periods of financial distress in the nation (See Figure 27). This is largely due to the impact of the Great Recession. In 2011, while we observe a slight rebound, giving did not return to pre-recession levels. Due to the size of the RWJ Foundation, it dominates the giving grants originating from Mercer. Figure 27 shows its impact in terms of the amount of dollars given by Mercer County to the United States. At any given point in time between 2005 and 2011, the RWJ Foundation 19


22 Who is Giving and Who is Getting? Charitable Giving in Mercer County, New Jersey Figure 28 Figure contributed a higher amount of grants in dollars to U.S. grantees than the rest of the foundations in Mercer County. Clearly, the RWJ Foundation is the leading foundation in Mercer County in terms of the total amount of money that RWJ gives to the U.S. In 2008 alone, the RWJ Foundation gave more money than all the other foundations combined over the previous seven years. The total given by all the foundations, excluding RWJ, during the period from 2005 to 2011 represents the 18.1 percent of the total amount of money given solely by the RWJ Foundation at the same period. Since the RWJ Foundation is the biggest grantmaker in Mercer County, it is necessary to exclude its grants when examining the performance of the other foundations. The following analysis discusses the results including and excluding RWJ. Figure 28 and Figure 29 demonstrate where foundation gifts from Mercer were going to in the nation, by state. To be consistent with the previous analysis, the total volume of money given is from the years 2005 to Notably, Washington D.C., New Jersey, California, New York, and Massachusetts are the top five beneficiaries. These five states received 53.4 percent of the total grants given by Mercer County when the RWJ Foundation is included in the analysis. When we exclude the RWJ Foundation, 59.8 percent of the total grants given by Mercer went to these five states. The RWJ Foundation gave most its grants to Washington D.C., California, and New Jersey, which changes the order of top beneficiary once excluding its gifts. New Jersey received about $371 million from 2005 to 2011 from Mercer, 12.7 percent of the total amount. When we look at Figure 29 as it relates to New Jersey and New York, excluding the RWJ Foundation, we see that only 45.6 percent of the total given by Mercer County is distributed locally ( ). When these findings are further examined, we see that New Jersey received only 16.9 percent of the total dollars allocated during this period, revealing that New York as the largest recipient of funds from grantors in Mercer County.

23 Figure 30 Figure 31 21


24 Who is Giving and Who is Getting? Charitable Giving in Mercer County, New Jersey Figure 32 Figure 33 Figure 34 Figure 35 Figure 36 22
25 It is interesting to see where Mercer County s foundations have given the most money to nationally. Considering the importance of the RWJ Foundation in relation to the rest of the foundations located in Mercer County, Figure 30 and Figure 31 display the total cumulative grants in dollars from 2005 to 2011 coming out of Mercer County. Ideally, these details should be independently examined in each year, not just cumulatively; however, we are able to draw some conclusions from the data obtained for 2007 and The total amount of grants awarded in 2011 did not reach the 2007 level, indicating that the Great Recession was likely responsible for this pattern. Despite various adverse consequences, the economic crisis increased giving locally. New Jersey saw an increase in grants made from the RWJ Foundation and other foundations as illustrated in Figures 32 and 33. In 2011, New Jersey became the biggest beneficiary of Mercer grants; in 2007 it ranked third. However, the total amount of grants received did not increase much, from $51 million in 2007 to $57 million in This trend was more evident when the RWJ Foundation grants are excluded. As shown in Figure 34 and Figure 35, both New York and North Carolina received more grant money from Mercer than New Jersey, with. New York receiving almost three times ($27 million) more than New Jersey ($8.5 million)i in that same year. That situation reversed in 2011, with New Jersey receiving $18 million, approximately $7 million more than the amount New York received. When analyzing how Mercer foundations gave back to New Jersey between 2005 and 2011, we find that Middlesex, Mercer, and Essex Counties received the most, as shown in Figure 36 and Figure 37. These three counties each received more than $20 million, approximately 87 percent of the total grants received by the state. It is worth noting that Middlesex County alone received $174 million, or nearly 50 percent of the total Mercer grants, between 2005 and This is the highest among New Jersey s 21 counties. Mercer County ranked second, receiving $128 million (35%). Using this same data while excluding the RWJ Foundation outgoing grants, as represented in Figure 36 and Figure 38, Mercer County received more money than any other county with $48.5 million (65%). Essex, with $6.8 million (9%), and Middlesex, with $5.7 million (8%) were the next largest county recipients. In other words, foundations in Mercer tended to give back to Mercer, A large portion of RWJ Foundation grants outflow to Middlesex, however;. we suggest further research be conducted to examine the details of what RWJ Foundation grants funded. As shown in Figure 39, in 2007 Middlesex County received $31 million in grants from foundations located in Mercer, while Mercer County received close to $12 million, or less than half of what Middlesex received. When we exclude the RWJ Foundation, a different story 23

26 Who is Giving and Who is Getting? Charitable Giving in Mercer County, New Jersey emerges. Mercer received approximately $5.6 million as opposed to Middlesex, which received only slightly more than half a million in grants. The RWJ Foundation gave significantly more funds back to Mercer in Figure 40 indicates it contributed more than $12 million to Mercer County, making Mercer the largest single recipient of funds in terms of total grant dollars. This was radically different from the 2007 situation. Other foundations continued to donate more funds to Mercer ($15 million) than to Middlesex ($1 million) in Generally speaking, foundations in Mercer gave generously to support education ($1.3 billion), to medical agencies ($840 million), and to human services ($191 million) from 2005 to 2011, as represented in Figure 41. About 45 percent of the aggregate amount went to fund education programs. Other foundations in Mercer followed similar giving patterns as the RWJ Foundation, though they gave more to the arts than medical services. Though less money went to education and medical services in 2011 than in 2007, these areas remained the most heavily funded categories, as shown in Figure 42 and Figure 43. Figure 43 shows of the total dollars that Mercer Country gave nationally in We see that education and medical services account for more than 74 percent of total giving. This is inclusive of the RWJ Foundation. Interestingly, these two causes remain the most heavily funded even when the RWJ Foundation is excluded, accounting for nearly 50 percent of the total amount of money given. Figure 37 Figure 38 24

27 Figure 39 Figure 40 Figure 41 Figure 42 Figure 43 25
28 Who is Giving and Who is Getting? Charitable Giving in Mercer County, New Jersey Figure 44 Figure 45 Comparison: Inflows and Outflows of Mercer Foundation Grants As Figure 44 demonstrates, the total outflow of Mercer foundation grants is at least $200 million larger than its inflow in any given year between the years 2005 to However, as we learned lasting the previous section, the RWJ Foundation has a great impact on the giving side. If grants made by the RWJ Foundation are excluded, we would find the outflow drops significantly (Figure 45), while the inflow reduces slightly. This phenomenon reveals the fact that the RWJ Foundation, a famous national foundation, donates only a small proportion to the place where it is located. Figure 46 provides a closer look at the inflow and outflow after removing the RWJ Foundation grants. We can see the inflow of foundation grants in Mercer exceeds the outflow when excluding the RWJ Foundation. 26
29 Figure 46 Figure 47 Since Princeton University is the Mercer County s biggest grant recipient, we determined to examine whether the inflow is still larger than the outflow once the grants Princeton University received were removed from the inflow. In Figure 47, the green line is the new inflow line without the impact of the RWJ Foundation and Princeton University. The total amount Mercer County received from foundation grants decreases notably when Princeton University s grants are excluded. Moreover, the conclusion that the inflow is larger than the outflow nor outflow overtakes the inflow holds true if excluding these two important players. 27
30 Who is Giving and Who is Getting? Charitable Giving in Mercer County, New Jersey Figure 48 Figure 49 Closer Look: Mercer Foundations Giving to the County Figure 48 looks at funding allocated back into the county from foundations that are also located within the county. The red lines represent how much funding each township within the county received from its native organizations. The blue represents how much the township gave to Mercer County. Figure 49 represents the impact of removing Princeton University. As expected, Princeton Township received a large amount of funding but also provided a significant amount. Additionally, we found that Trenton, the county s lowest-income area, received a significant amount of funding but gave out very little. It is interesting to note that, after removing Princeton University, the figures barely change, suggesting that the majority of funding from Mercer County foundations to Princeton Township does not go to Princeton University. The map shown in Figure 50 illustrates how much each municipality gave back to Mercer between 2005 and Princeton, in blue, gave approximately $105 million to Mercer, while other municipalities, specifically Trenton, Robbinsville, West Windsor, and Ewing, each gave out less than half a million. In terms of self-sustainability within New Jersey towns, $15 million of all foundations originating from Hamilton all stayed in Hamilton. Furthermore, Trenton also had a high self-sustainability rate: nearly 80 percent of grants originating from Trenton were written to organizations within in Trenton itself. Alternatively, Princeton kept less than half of the total it gave to Mercer. Figure 51 shows that Princeton is the only town in Mercer County which gave more than it received. Trenton, on the other hand, received much more than it gave out. 28


31 Figure 50 Figure 51 Conclusions Despite its importance both in terms of its economic significance and its role in addressing societal ills, not much is known about the specifics of philanthropy. This report set out to shed light the philanthropic sector; we attempted to characterize philanthropy as whole with special attention paid to Mercer County, New Jersey. We hope that this report will help steer future research. While conducting our research, we found answers as well as additional questions. In large part, these questions arise from the lack of transparency and data available regarding philanthropy. To further our understanding of the sector and to help improve its efficacy, it is crucial that access to this information is made public. However, despite the limitations we faced regarding access to information, we were able to make several findings that further our understanding of philanthropy, both nationally and at state and local level. Nationally, the major source of funding comes from individual giving. Consistently, over 70 percent of all charitable giving comes from individuals, dwarfing the next highest source of funding, foundations. Here, there was a prevailing belief in the public that corporations and corporate foundations were a significant source of philanthropy. While corporations and 29
32 Who is Giving and Who is Getting? Charitable Giving in Mercer County, New Jersey corporate foundations donated money towards philanthropic causes, the amounts contributed from these sources are not nearly as much as what families give by writing checks and putting money in church plates. In fact, corporations and corporate foundations account for only about 10 percent of all giving in the United States. This is important to note, not because we feel that corporations are not giving enough money, but rather that it should be understood that much of the responsibility for philanthropy still falls on the individual. As such, individual giving continues to be the most important aspect of charitable giving and we should not assume that societal issues would be solved through corporations and their foundations. Our collective sense of responsibility fosters more societal change than we often believe. Another major finding of our research was how much more funding went to religion and education than to more acute causes such as health, human services, and public societal benefits. While we do not question the value of education nor the importance of religion to the donors, we feel that this does raise a question that speaks to the very essence of philanthropy: do we give to help the needy or do we give to causes that are closer to our values? If the answer is the latter, it begs the question; is philanthropy more closely related to donor interest than it is to directly addressing the pressing needs of the community? How can we encourage donors to give to initiatives that serve the most pressing need? These questions address the very nature of philanthropy by questioning the assumptions that govern this field. To truly use philanthropy to affect societal change, we must understand the discrepancy between what we assume to be true and what the data actually proves true. We used many of these questions to frame this report, which looked at the charitable giving system in Mercer County, New Jersey. We unearthed some interesting and telling findings. Particularly, one of the more interesting findings in this study was the impact that the state of New York had in philanthropic channels within Mercer County. While we expected that New York, due to its proximity and sheer size, would be a major source of funding, we were mildly surprised to find that it provided more money to Mercer County than New Jersey itself. Additionally, we were astonished to see that much of the money given out by Mercer County foundations was not only leaving the county, but leaving New Jersey. These findings beg the question of how reasonable it is to assume that philanthropy is a local exercise. We can explain much of this by understanding the impact of two major entities in the county, Princeton University and the RWJ Foundation. The role that both these organizations have in the charitable funding streams in Mercer underscores the importance of understanding the community under analysis. Our report focused on Mercer County, which in addition to being strongly influenced by Princeton University and the RWJ Foundation is a non-homogenous community. While the county as a whole enjoys low levels of poverty, high levels of wealth, and a well-educated populace, these demographic indicators do not tell the whole story. The city of Trenton, for 30
33 example Mercer County s second largest city does not share in the wealth and high levels of education enjoyed by the rest of the county. With more than twice the poverty rate and less than half of the per capita and household income enjoyed by Mercer County as a whole, there is a demand for philanthropic programs that would benefit Trenton. This problem is further amplified by factoring in the city s low levels of education. There are considerably lower levels of high school graduates, and less than a quarter of the percent of college graduates living in Trenton. Looking at Mercer without paying special attention to Trenton is a prime example of how the problems of poverty and societal ills can be masked by surrounding communities. Additionally, there is little evidence to show that being surrounded by an abundance of resources and philanthropic communities has had any meaningful impact in Trenton. This emphasizes a major conclusion that we reached in our research: philanthropy does not necessarily provide immediate relief to those most in need of it. Additionally, to utilize philanthropy most effectively, it is important to have an in-depth understanding of communities and their nuances. As a corollary of understanding the nuances within a community, we contend that any further study of philanthropy in Mercer County should pay special attention to both the RWJ Foundation and Princeton University. Princeton University receives a major portion of funds given to the county, funds most often earmarked for education and research. While there is little argument that these funds should be categorized as funds for education, there is a difference in the type of educational funds given to Princeton University and those given to Trenton. The money given to Princeton University can hardly be categorized as helping people in need, especially when contrasted to money give to education in Trenton. Similar to the special treatment that Princeton University should receive when analyzing Mercer County, the RWJ Foundation needs to be treated as a special case. The RWJ Foundation explains how most of the money that Mercer County donates outflows to the rest of the nation. The main recipient of RWJ Foundation money is research in Washington, D.C. In light of these two factors, we can observe that two huge foundations, Princeton University and the RWJ Foundation, dominate philanthropy in Mercer County; therefore, any future study about foundation activity must take these considerations into account. 31
development assistance
 Chapter 4: Private philanthropy and development assistance In this chapter, we turn to development assistance for health (DAH) from private channels of assistance. Private contributions to development
SUMMARY OF THE ECONOMIC IMPACT OF THE NONPROFIT SECTOR IN PINELLAS COUNTY
 SUMMARY OF THE ECONOMIC IMPACT OF THE NONPROFIT SECTOR IN PINELLAS COUNTY with support from EXECUTIVE SUMMARY While considerable attention is paid to the public and private sectors of the economy, the
Volunteers and Donors in Arts and Culture Organizations in Canada in 2013
 Volunteers and Donors in Arts and Culture Organizations in Canada in 2013 Vol. 13 No. 3 Prepared by Kelly Hill Hill Strategies Research Inc., February 2016 ISBN 978-1-926674-40-7; Statistical Insights
CONDUCTED IN PARTNERSHIP WITH THE INDIANA UNIVERSITY LILLY FAMILY SCHOOL OF PHILANTHROPY
 THE 2016 U.S. TRUST STUDY OF HIGH NET WORTH PHILANTHROPY 1 CONDUCTED IN PARTNERSHIP WITH THE INDIANA UNIVERSITY LILLY FAMILY SCHOOL OF PHILANTHROPY Executive Summary Insights into the motivations, priorities
Coutts Million Dollar Donors Report 2014 RUSSIA FINDINGS
 Philanthropy is fast taking root in the lives of wealthy Russian individuals and families, as well as in the culture of corporations. Number of million dollar donations 30% gifted by individuals 20% gifted
Current Trends in Philanthropy and Charitable Giving. Eric Javier and Sevil Miyhandar, CCS Fundraising January 26, 2018
 Current Trends in Philanthropy and Charitable Giving Eric Javier and Sevil Miyhandar, CCS Fundraising January 26, 2018 Today s Presenters Eric Javier Principal & Managing Director CCS Sevil Miyhandar Managing
Report on Weingart Foundation s Grantmaking to Nonprofit Organizations Based in the Inland Empire. Executive Summary November, 2013
 Report on Weingart Foundation s Grantmaking to Nonprofit Organizations Based in the Inland Empire Executive Summary November, 2013 Background In February 2013, Weingart Foundation conducted an annual statistical
Association of Fundraising Professionals State of Fundraising 2005 Report
 Association of Fundraising Professionals State of Fundraising 2005 Report For more information, contact Walter Sczudlo (wsczudlo@afpnet.org) Or Michael Nilsen (mnilsen@afpnet.org) Association of Fundraising
Compassionate Capitalism- It is not a matter of fairness; it is a matter of economic survival for there is no greater asset than that of human capital
 Compassionate Capitalism- It is not a matter of fairness; it is a matter of economic survival for there is no greater asset than that of human capital We would like to thank Greenlining Institute and its
ABOUT THE COMMUNITY FOUNDATION FOR GREATER ATLANTA
 1 ABOUT THE COMMUNITY FOUNDATION FOR GREATER ATLANTA Since 1951, the Community Foundation for Greater Atlanta has been connecting donors, nonprofits and community leaders to strengthen the 23-county Atlanta
2014 Giving Report. A Look at Fidelity Charitable Donors and How They Give. REPORT SPOTLIGHT How Donors Approach Philanthropy as a Family
 2014 Giving Report A Look at Fidelity Charitable Donors and How They Give REPORT SPOTLIGHT How Donors Approach Philanthropy as a Family Fidelity Charitable GIVING REPORT About the Fidelity Charitable
Charting Civil Society
 Charting Civil Society A series by the Center on Nonprofits and Philanthropy THE URBAN INSTITUTE No. 24, February 2010 Grassroots Civil Society The Scope and Dimensions of Small Public Charities Elizabeth
Foundations: A Potential Source of Funding For Charities? Highlights
 Vol. 2., No. 4. - October 1995 Foundations: A Potential Source of Funding For Charities? Michael H. Hall - Director - Research Laura G. Macpherson - Research Associate Highlights The charitable purposes
EXECUTIVE SUMMARY THE ECONOMIC IMPORTANCE OF THE ARTS & CULTURAL INDUSTRIES IN SANTA FE COUNTY
 EXECUTIVE SUMMARY THE ECONOMIC IMPORTANCE OF THE ARTS & CULTURAL INDUSTRIES IN SANTA FE COUNTY Financial support for this research was provided by The McCune Charitable Foundation The Azalea Foundation
Insights Into The Kansas City Nonprofit Sector
 Insights Into The Kansas City Nonprofit Sector Research Conducted by the Midwest Center for Nonprofit Leadership Henry W. Bloch School of Management University of Missouri Kansas City Research Funded by
2001 Rural Development Philanthropy Baseline Survey ~ Updated on June 18, 2002
 2001 Development Philanthropy Baseline Survey ~ Updated on June 18, 2002 Findings of Note and Next Steps Introduction Background Defining terms Response Pool Vital Statistics Preliminary Findings of Note
2013 Lien Conference on Public Administration Singapore
 Dean Jack H. Knott Price School of Public Policy University of Southern California 2013 Lien Conference on Public Administration Singapore It s great to be here. I want to say how honored I am to participate
The Economic Impacts of Idaho s Nonprofit Organizations
 2016 REPORT www.idahononprofits.org The Economic Impacts of Idaho s Nonprofit Organizations RESEARCH REPORT Created by: Don Reading Ben Johnson Associates Boise, Idaho Steven Peterson Research Economist
The Importance of a Major Gifts Program and How to Build One
 A Marts & Lundy Special Report The Importance of a Major Gifts Program and How to Build One April 2018 2018 Marts&Lundy, Inc. All Rights Reserved. www.martsandlundy.com A Shift to Major Gift Programs For
Social Enterprise. Taking the Pulse of the Small Charity Sector. Income. Maximising Assets. Resilience. Mission. Based. Innovation. Economy.
 Mixed Income Economy Innovation Assets Mission Based Maximising Assets Social Enterprise Not-for-profit Income Sustainability Resilience Taking the Pulse of the Small Charity Sector September to November
UK GIVING 2012/13. an update. March Registered charity number
 UK GIVING 2012/13 an update March 2014 Registered charity number 268369 Contents UK Giving 2012/13 an update... 3 Key findings 4 Detailed findings 2012/13 5 Conclusion 9 Looking back 11 Moving forward
Examination of Community Foundations in Atlantic Canada
 Examination of Community Foundations in Atlantic Canada March 2014 Joshua Barrett Ryan Gibson Introduction The community foundation movement is not new to Canadian citizens, especially those residing in
HOW OHIO GIVES $5.59 BILLION INDIVIDUAL GIVING WHAT INDIVIDUALS SUPPORT. 68% of individuals had income between $50,000 $200,000 and gave $2.
 HOW OHIO GIVES DECEMBER 0 KEY FINDINGS Ohio s giving fell by percent in 0, pushed downward by a drop in individual giving that was moderated by an uptick in foundation giving.. BILLION TOTAL OHIO GIVING
Coalition for New Philanthropy
 The Coalition for is a groundbreaking initiative to advance philanthropy in African-American, Asian-American and Latino communities throughout the New York metropolitan region. The Coalition was established
Operating in Uncertain Times
 1 Operating in Uncertain Times How Economic Conditions Have Affected San Diego County s Nonprofit and Philanthropic Sectors January 2010 Authors: Laura Deitrick, PhD University of San Diego Lindsey McDougle,
HOW OHIO GIVES HOW OHIOANS GIVE
 HOW OHIO GIVES KEY FINDINGS Total giving reached a new peak in 0, rising by percent to. billion, pushed by increases in both individual and foundation giving.. BILLION TOTAL OHIO GIVING % Individual giving:.0
AN INVESTIGATION INTO WHAT DRIVES YOUR DONORS TO GIVE
 Donor Perspectives: AN INVESTIGATION INTO WHAT DRIVES YOUR DONORS TO GIVE November 2012 2000 Daniel Island Drive, Charleston, SC 29492 T 800.443.9441 E solutions@blackbaud.com W www.blackbaud.com Blackbaud
Economic Contributions of the Louisiana Nonprofit Sector: Size and Scope
 MAY 2018 Economic Contributions of the Louisiana Nonprofit Sector: Size and Scope This capstone report was completed in fulfillment of a Master of Public Service and Administration degree from the Bush
Glossary of Nonprofit Terms
 Glossary of Nonprofit Terms 501(C)(3): The section of the U.S. tax code that defines nonprofit, charitable, tax-exempt organizations; 501(c)(3) organizations are further defined as public charities, private
Charting Our Progress: August 2012, Audited Version
 Charting Our Progress: 2009 2011 August 2012, Audited Version President s Message If art is to nourish the roots of our culture, society must set the artist free to follow his vision wherever it takes
Weathering the Storm: Challenges and Opportunities Facing Colorado Nonprofits During Recession 2009 Update
 Weathering the Storm: Challenges and Opportunities Facing Colorado Nonprofits During Recession 2009 Update Weathering the Storm: 2009 Update Early in 2009, the Colorado Nonprofit Association and the Community
Philanthropic Investment in Minority-Led Nonprofits
 Spring 2008 Christian González-Rivera Research Program Coordinator Courtney Donnell Philanthropy Research Intern Adam Briones Special Contributor Sasha Werblin Special Contributor www.greenlining.org Table
ICT SECTOR REGIONAL REPORT
 ICT SECTOR REGIONAL REPORT 1997-2004 (August 2006) Information & Communications Technology Sector Regional Report Definitions (by North American Industrial Classification System, NAICS 2002) The data reported
The State of the Ohio Nonprofit Sector. September Proctor s Linking Mission to Money 471 Highgate Avenue Worthington, OH 43085
 The State of the Ohio Nonprofit Sector Proctor s Linking Mission to Money 471 Highgate Avenue Worthington, OH 43085 614-208-5403 allen@linkingmissiontomoney.com www.linkingmissiontomoney.com Table of Contents
NATIONAL LOTTERY CHARITIES BOARD England. Mapping grants to deprived communities
 NATIONAL LOTTERY CHARITIES BOARD England Mapping grants to deprived communities JANUARY 2000 Mapping grants to deprived communities 2 Introduction This paper summarises the findings from a research project
2017 Annual Giving Report
 2017 Annual Giving Report Our exceptionally generous donors gave $1.6 billion to charity in fiscal year 2017. Grants from Schwab Charitable donors reach an all-time high In fiscal year 2017, Schwab Charitable
Asset Transfer and Nursing Home Use: Empirical Evidence and Policy Significance
 April 2006 Asset Transfer and Nursing Home Use: Empirical Evidence and Policy Significance Timothy Waidmann and Korbin Liu The Urban Institute The perception that many well-to-do elderly Americans transfer
Vital Signs: Arts Funding in the Current Economy
 Grantmakers in the Arts GIAreader Vol. Ideas and Information on Arts and Culture 20 No. 2, Summer 2009 Vital Signs: Arts Funding in the Current Economy The Outlook for Foundation Giving Steven Lawrence,
2013 Assessment of U.S. Giving to International Causes
 2013 Assessment of U.S. Giving to International Causes Global Impact Report_20pg.indd 1 10/24/13 3:41 PM TABLE OF CONTENTS: Introduction Page 3 Section 1: Context of International Giving Page 4 Section
PACIFIC NORTHWEST NONPROFIT SURVEY. M.J. Murdock Charitable Trust Nonprofit Support Organizations Aggregated Results 2013
 PACIFIC NORTHWEST NONPROFIT SURVEY M.J. Murdock Charitable Trust Nonprofit Support Organizations Aggregated Results 2013 TABLE OF CONTENTS Introduction and Survey Approach...4 Survey Sample...6 Organization
PACIFIC NORTHWEST NONPROFIT SURVEY. M.J. Murdock Charitable Trust Nonprofit Support Organizations Aggregated Results 2013
 PACIFIC NORTHWEST NONPROFIT SURVEY M.J. Murdock Charitable Trust Nonprofit Support Organizations Aggregated Results 2013 Report Prepared by: William Vesneski, PhD Sarah Meyer February 2014 2 Pacific Northwest
Voluntary Sector. Community Snapshot. Introduction
 Community Snapshot Voluntary Sector Introduction The work done by voluntary organizations is intrinsically linked to the concept of community wellbeing. Various efforts have been made to measure both the
Resources Guide. Helpful Grant-Related Links. Advocacy & Policy Communication Evaluation Fiscal Sponsorship Sustainability
 Resources Guide This Resource Guide has been made available to grantees and potential grantees in preparing their proposal submissions to The SCAN Foundation (TSF), and includes the a quick and easy to
Request for Proposals. Safety-Net Services: Food and Shelter
 Request for Proposals Safety-Net Services: Food and Shelter Introduction Silicon Valley Community Foundation advances innovative philanthropic solutions to challenging problems. One of these problems is
Research Brief IUPUI Staff Survey. June 2000 Indiana University-Purdue University Indianapolis Vol. 7, No. 1
 Research Brief 1999 IUPUI Staff Survey June 2000 Indiana University-Purdue University Indianapolis Vol. 7, No. 1 Introduction This edition of Research Brief summarizes the results of the second IUPUI Staff
A Call to Action: Trustee Advocacy to Advance Opportunity for Black Communities in Philanthropy. April 2016
 A B F E A Philanthropic Partnership for Black Communities A Call to Action: Trustee Advocacy to Advance Opportunity for Black Communities in Philanthropy April 2016 1, with the assistance of Marga, Incorporated
The Economic Impacts of the New Economy Initiative in Southeast Michigan
 pwc.com/us/nes The Economic Impacts of the New Economy Initiative in Southeast Michigan The Economic Impacts of the New Economy Initiative in Southeast Michigan June 2016 Prepared for The Community Foundation
BLOOMINGTON NONPROFITS: SCOPE AND DIMENSIONS
 NONPROFIT SURVEY SERIES COMMUNITY REPORT #1 BLOOMINGTON NONPROFITS: SCOPE AND DIMENSIONS A JOINT PRODUCT OF THE CENTER ON PHILANTHROPY AT INDIANA UNIVERSITY AND THE SCHOOL OF PUBLIC & ENVIRONMENTAL AFFAIRS
Donor and Grantee Customer Satisfaction Survey Findings
 THE GREATER NEW ORLEANS FOUNDATION Donor and Grantee Customer Satisfaction Survey Findings 1055 ST. CHARLES AVE. STE 100 NEW ORLEANS, LA 70130 WWW.GNOF.ORG INTRODUCTION As a central part of our commitment
2015 Lasting Change. Organizational Effectiveness Program. Outcomes and impact of organizational effectiveness grants one year after completion
 Organizational Effectiveness Program 2015 Lasting Change Written by: Outcomes and impact of organizational effectiveness grants one year after completion Jeff Jackson Maurice Monette Scott Rosenblum June
RESILIENCE AND VULNERABILITY The State of the Nonprofit Sector in Los Angeles 2009
 RESILIENCE AND VULNERABILITY The State of the Nonprofit Sector in Los Angeles 2009 UCLA Center for Civil Society University of California, Los Angeles School of Public Affairs Previous Focus Areas Human
Welcome to the Foundation Center s. Grantseeking Basics
 Welcome to the Foundation Center s Grantseeking Basics The Foundation Center Our Mission: To strengthen the social sector by advancing knowledge about philanthropy in the U.S. and around the world. Grantseeking
CHARLES STEWART MOTT FOUNDATION AFFIDAVIT UPDATE PACKET FOR NON-U.S. GRANTEES
 CHARLES STEWART MOTT FOUNDATION AFFIDAVIT UPDATE PACKET FOR NON-U.S. GRANTEES This packet includes: INTRODUCTION and INSTRUCTIONS "AFFIDAVIT UPDATE" "PUBLIC SUPPORT SCHEDULE" "MAJOR DONOR SUPPORT" FORM
The Renaissance Charitable Gift Fund. Donor-Advised Fund Program
 The Renaissance Charitable Gift Fund Donor-Advised Fund Program www.rcgf.org TABLE OF CONTENTS Renaissance Charitable Gift Fund... Page 2 Donor-Advised Funds... Page 3 Definitions... Page 3 Donors and
Contracts and Grants between Nonprofits and Government
 br I e f # 03 DeC. 2013 Government-Nonprofit Contracting Relationships www.urban.org INsIDe this IssUe In 2012, local, state, and federal governments worked with nearly 56,000 nonprofit organizations.
Industry Market Research release date: November 2016 ALL US [238220] Plumbing, Heating, and Air-Conditioning Contractors Sector: Construction
![Industry Market Research release date: November 2016 ALL US [238220] Plumbing, Heating, and Air-Conditioning Contractors Sector: Construction](/thumbs/80/81994465.jpg "Industry Market Research release date: November 2016 ALL US [238220] Plumbing, Heating, and Air-Conditioning Contractors Sector: Construction") Industry Market Research release date: November 2016 ALL US [238220] Plumbing, Heating, and Air-Conditioning Contractors Sector: Construction Contents P1: Industry Population, Time Series P2: Cessation
Industry Market Research release date: November 2016 ALL US [238220] Plumbing, Heating, and Air-Conditioning Contractors Sector: Construction Contents P1: Industry Population, Time Series P2: Cessation
Nonprofit Sector: Orange County
 Nonprofit Sector: Kathleen Costello CSUF Gianneschi Center for Nonprofit Research at the Center for Internships & Community Engagement Dr. Shelly Arsneault Division of Politics, Administration and Justice
INFOBRIEF SRS TOP R&D-PERFORMING STATES DISPLAY DIVERSE R&D PATTERNS IN 2000
 INFOBRIEF SRS Science Resources Statistics National Science Foundation NSF 03-303 Directorate for Social, Behavioral, and Economic Sciences November 2002 TOP R&D-PERFORMING STATES DISPLAY DIVERSE R&D PATTERNS
Is Grantmaking Getting Smarter? Grantmaker Practices in Texas as compared with Other States
 Is Grantmaking Getting Smarter? Grantmaker Practices in Texas as compared with Other States OneStar Foundation and Grantmakers for Effective Organizations August 2009 prepared for OneStar Foundation: Texas
KEY FACTS ON CORPORATE FOUNDATIONS
 May 2009 KEY FACTS ON CORPORATE FOUNDATIONS Outlook for Corporate Foundation Giving Giving by the nation s nearly 2,500 grantmaking corporate foundations remained basically unchanged in 2008 at an estimated
It s a typical day in your hometown. Your alarm wakes you from a restful
 In This Chapter Chapter 1 Tuning In to the World of Nonprofit Organizations Defining the nonprofit sector Getting started with a nonprofit Encouraging volunteerism Getting the resources your nonprofit
Working Paper Series
 The Financial Benefits of Critical Access Hospital Conversion for FY 1999 and FY 2000 Converters Working Paper Series Jeffrey Stensland, Ph.D. Project HOPE (and currently MedPAC) Gestur Davidson, Ph.D.
Introduction. Methodology. Findings
 Introduction Mission-driven shared spaces are growing in number, size, and impact across North America. These buildings exist to support the efforts of the nonprofit and charitable sector by sharing or
Winter 2018 Nonprofit Fundraising Study (NFS)
") Winter 2018 Nonprofit Fundraising Study (NFS) Covering Charitable Receipts at Nonprofit Charitable Organizations in the United States and Canada in 2017 A Study From Acknowledgements The Nonprofit Research
Winter 2018 Nonprofit Fundraising Study (NFS) Covering Charitable Receipts at Nonprofit Charitable Organizations in the United States and Canada in 2017 A Study From Acknowledgements The Nonprofit Research
Summary of Findings. Data Memo. John B. Horrigan, Associate Director for Research Aaron Smith, Research Specialist
 Data Memo BY: John B. Horrigan, Associate Director for Research Aaron Smith, Research Specialist RE: HOME BROADBAND ADOPTION 2007 June 2007 Summary of Findings 47% of all adult Americans have a broadband
Geiger Gibson / RCHN Community Health Foundation Research Collaborative. Policy Research Brief # 42
 Geiger Gibson Program in Community Health Policy Geiger Gibson / RCHN Community Health Foundation Research Collaborative Policy Research Brief # 42 How Has the Affordable Care Act Benefitted Medically
Minnesota Nonprofit Economy Report
 Minnesota Nonprofit Economy Report A Statewide and Regional Analysis Northwest Minnesota Northeast Minnesota Central Minnesota Southwest Minnesota Twin Cities Metro Area Southeast Minnesota 2007 An annual
The Future of Community Foundations: The Next Decade
 The Future of Community Foundations: The Next Decade Prepared for John S. and James L. Knight Foundation July 7, 2005 Foundation Strategy Group, LLC 20 Park Plaza 50 California Street Blvd. Georges-Favon
Status Report. on the. Pell Grant Program AMERICAN COUNCIL ON EDUCATION CENTER FOR POLICY ANALYSIS
 2000 Status Report on the Pell Grant Program AMERICAN COUNCIL ON EDUCATION CENTER FOR POLICY ANALYSIS 2000 Status Report on the Pell Grant Program JACQUELINE E. KING AMERICAN COUNCIL ON EDUCATION CENTER
2010 HOLIDAY GIVING. Research and Insights into the Most Charitable Time of the Year THIS RESEARCH INDICATES:
 2010 HOLIDAY GIVING Research and Insights into the Most Charitable Time of the Year THIS RESEARCH INDICATES: 74% of US adults will give this holiday season Consumers will donate more than $48 billion in
Licensed Nurses in Florida: Trends and Longitudinal Analysis
 Licensed Nurses in Florida: 2007-2009 Trends and Longitudinal Analysis March 2009 Addressing Nurse Workforce Issues for the Health of Florida www.flcenterfornursing.org March 2009 2007-2009 Licensure Trends
Charting the Sea of Goodwill
 Charting the Sea of Goodwill MARCH 2, 2016 Phillip Carter, Senior Fellow Veterans-Serving Non-Profits Project Supported By: CNAS Veterans Data Project Supported By: Agenda Veterans Today and Tomorrow Charting
The Community Foundation Difference
 The Community Foundation Difference DESCRIBING WHAT MAKES US SPECIAL Endorsed by CFC Members May 4, 2002 301-75 rue Albert Street Ottawa ON Canada K1P 5E7 www.community-fdn.ca A Message from Community
first edition GEORGIA NONPROFIT Employment Report In the Center of the Industry
 first edition GEORGIA NONPROFIT Employment Report In the Center of the Industry www.gcn.org Georgia Nonprofit Employment Report A joint product of The Johns Hopkins Employment Data Project and the Georgia
Prospect Research on a Shoestring Budget
 Prospect Research on a Shoestring Budget AFP February 13, 2009 Ali R. McLane Consultant, Dini Partners amclane@dinipartners.com Giving in the Current Economy Giving 2009 Survey Report, Dini Partners, January
Community Foundations and United Way: Getting From Competition To Collaboration
 Community Foundations and United Way: Getting From Competition To Collaboration MONICA PATTEN Executive Director, Community Foundations ofcanada Community foundations and United Way would appear to be
The Financial Returns from Oil and Natural Gas Company Stocks Held by American College and University Endowments. Robert J.
 The Financial Returns from Oil and Natural Gas Company Stocks Held by American College and University Endowments Robert J. Shapiro September 2015 Table of Contents I. Introduction and Executive Summary.....
How to Use CDBG for Public Service Activities
 How to Use CDBG for Public Service Activities Introduction to Public Service Activities In this module we will show you how to build an effective public services program to maximize the positive impacts
the definition of insanity who are the affluent in america Today? Executive Summary Contents Wealth and Philanthropy in America White Paper
 Wealth and Philanthropy in America White Paper Wealth and Philanthropy in America Target Affluent Prospects to Sustain Your Annual and Major Gift Programs Katherine Swank, J.D., Consultant, Target Analytics,
The Philanthropy Outlook 2017 & Marts & Lundy. Indiana University Lilly Family School of Philanthropy PRESENTED BY RESEARCHED A N D WRITTEN BY
 The Philanthropy Outlook 2017 & 2018 PRESENTED BY Marts & Lundy RESEARCHED A N D WRITTEN BY Indiana University Lilly Family School of Philanthropy JANUARY 2017 THE RESEARCH TEAM Indiana University Purdue
PHILANTHROPIC SOLUTIONS. Living your values
 PHILANTHROPIC SOLUTIONS Living your values COMPREHENSIVE ADVICE AND SOLUTIONS FROM U.S. TRUST Philanthropic planning Foundation advisory services Grantmaking Charitable trusts Donor-advised funds Private
Weatherization Assistance Program PY 2013 Funding Survey
 Weatherization Assistance Program PY 2013 Summary Summary............................................................................................... 1 Background............................................................................................
TENNESSEE TEXAS UTAH VERMONT VIRGINIA WASHINGTON WEST VIRGINIA WISCONSIN WYOMING ALABAMA ALASKA ARIZONA ARKANSAS
 ALABAMA ALASKA ARIZONA ARKANSAS CALIFORNIA COLORADO CONNECTICUT DELAWARE DISTRICT OF COLUMBIA FLORIDA GEORGIA GUAM MISSOURI MONTANA NEBRASKA NEVADA NEW HAMPSHIRE NEW JERSEY NEW MEXICO NEW YORK NORTH CAROLINA
CHINA S MOST GENEROUS
 CHINA PHILANTHROPY PROJECT Shutterstock/Hung Chung Chih CHINA S MOST GENEROUS UNDERSTANDING CHINA S PHILANTHROPIC LANDSCAPE Edward Cunningham China Programs Director Ash Center for Democratic Governance
TECHNICAL ASSISTANCE GUIDE
 TECHNICAL ASSISTANCE GUIDE COE DEVELOPED CSBG ORGANIZATIONAL STANDARDS Category 3 Community Assessment Community Action Partnership 1140 Connecticut Avenue, NW, Suite 1210 Washington, DC 20036 202.265.7546
CHARITIES: THE INFRASTRUCTURE OF COMMUNITY
 CHARITIES: THE INFRASTRUCTURE OF COMMUNITY A brief to the Standing Committee of Finance of the House of Commons by The Muttart Foundation Edmonton, Alberta August 2009 EXECUTIVE SUMMARY Throughout Canada,
MAJOR GIFT FUNDRAISING:
 MAJOR GIFT FUNDRAISING: Unlocking the Potential for Your Nonprofit By Dr. Adrian Sargeant, Amy Eisenstein, ACFRE, and Dr. Rita Kottasz This project was made possible by the following sponsors: For a copy
To a Successful Planned Giving Program Thursday, May 22
 10 STEPS To a Successful Planned Giving Program Thursday, May 22 PRESENTED BY Lynn M. Gaumer, J.D. Senior Technical Consultant The Stelter Company Phil Purcell Vice President for Planned Giving and Endowment
Give Boldly FAQs. Program overview. Program guidelines
 Give Boldly FAQs Program overview Why does ArcelorMittal offer the Give Boldly The ArcelorMittal Give Boldly program provides an opportunity for the company to recognize our employees community involvement.
The Nonprofit Research Collaborative. November 2010 Fundraising Survey
 The Nonprofit Research Collaborative November 2010 Fundraising Survey Executive Summary In this ninth annual survey of nonprofit organizations (charities and foundations), respondents answered questions
Re: Rewarding Provider Performance: Aligning Incentives in Medicare
 September 25, 2006 Institute of Medicine 500 Fifth Street NW Washington DC 20001 Re: Rewarding Provider Performance: Aligning Incentives in Medicare The American College of Physicians (ACP), representing
INDIVIDUAL GIVING SURVEY (IGS) 2016
 2016") INDIVIDUAL GIVING SURVEY (IGS) 2016 Media Huddle Sharing 15 March 2017 OVERVIEW Executive Summary VOLUNTEERISM Volunteerism rate has grown over the years, with 1 in 10 individuals (9%) volunteering in
INDIVIDUAL GIVING SURVEY (IGS) 2016 Media Huddle Sharing 15 March 2017 OVERVIEW Executive Summary VOLUNTEERISM Volunteerism rate has grown over the years, with 1 in 10 individuals (9%) volunteering in
Leverage is the single word that best describes the heart of Mission Increase Foundation.
 EXECUTIVE SUMMARY Leverage is the single word that best describes the heart of Mission Increase Foundation. For Dale Stockamp and Ron Post, the businessman and ministry leader who combined their passions
An overview of the NFP Sector
 An overview of the NFP Sector To accompany coverage of Chapters 1, 12,13 & 14 in Granof & Khumawala textbook NFP Sector 1 Scope of nonprofits charitable, educational, arts not-for-profit sector the third
FY 2017 Year In Review
 WEINGART FOUNDATION FY 2017 Year In Review ANGELA CARR, BELEN VARGAS, JOYCE YBARRA With the announcement of our equity commitment in August 2016, FY 2017 marked a year of transition for the Weingart Foundation.
SUSTAIN ARTS/BAY AREA A Portrait of the Cultural Ecosystem
 SUSTAIN ARTS/BAY AREA A Portrait of the Cultural Ecosystem INTRODUCTION For more than a year, the Sustain Arts research team has located, gathered, cleaned, reconciled, integrated, and analyzed more than
Demographic Profile of the Officer, Enlisted, and Warrant Officer Populations of the National Guard September 2008 Snapshot
 Issue Paper #55 National Guard & Reserve MLDC Research Areas Definition of Diversity Legal Implications Outreach & Recruiting Leadership & Training Branching & Assignments Promotion Retention Implementation
GEM UK: Northern Ireland Summary 2008
 1 GEM : Northern Ireland Summary 2008 Professor Mark Hart Economics and Strategy Group Aston Business School Aston University Aston Triangle Birmingham B4 7ET e-mail: mark.hart@aston.ac.uk 2 The Global
IWU Impact. Measuring the Economic and Civic Contributions of Indiana Wesleyan University to Grant County
 IWU Impact Measuring the Economic and Civic Contributions of Indiana Wesleyan University to Grant County IWU Impact Measuring the Economic and Civic Contributions of Indiana Wesleyan University to Grant
IMPACTING AND PRESERVING THE FUTURE FOR ALL OF US Silicon Valley Community Foundation
 IMPACTING AND PRESERVING THE FUTURE FOR ALL OF US Silicon Valley Community Foundation LETTER FROM CEO Welcome to the new Silicon Valley Community Foundation Thanks to the commitment of people like you,