Prepared For. Prepared By
|
|
|
- Martin Barnett
- 6 years ago
- Views:
Transcription
1
2
3 Prepared For Lake of the Ozarks Council of Local Governments Prepared By Gerald McDougall, Ph.D. - Southeast Missouri State University Foster Roberts, Ph.D. - Southeast Missouri State University David Yaskewich, Ph.D. - Southeast Missouri State University John Gruidl, Ph.D. - Western Illinois University Brian Tapp, MA Crystal Jones, MBA Calvin Friedrich, MA Jakob Pallesen, MBA With Assistance From Gabrielle Penca Elizabeth Wohlschlaeger Peter Jacobsen Page 1
4 Special Thanks To Linda Conner, Executive Director Andy Draper, Regional Planner Stephanie Witthar, Planning Assistant/Loan Assistant Pam Gilbert, Administrative Assistant Margie Adams, Fiscal Officer Page 2
5 Executive Summary 6 Introduction 8 Profile of the Region 11 The Five Drivers of Entrepreneurship 29 Developing a Pipeline of Educated and Skilled Entrepreneurs 33 Cultivating Technology Exchange and Innovation 45 Improving Access to Capital 55 Promoting Awareness and Building Networks 63 Optimizing the Regulatory Environment 69 Summary 75 Recommendations 78 Appendix I - Methodology 87 Appendix II - Survey Template & Feedback 93 Appendix III - National Establishment Time Series 103 Appendix IV - Industry Clusters 111 Appendix V - Traded vs. Local Clusters 121 Appendix VI - Innovation Index 133 Sources 135 Contact Information 136 Page 3
6 Page 4
 and do not necessarily reflect the views of the Economic Development")
7 This Publication was prepared by the Institute for Regional Innovation and Entrepreneurship at Southeast Missouri State University. The statements, findings, conclusions, and recommendations are those of the author(s) and do not necessarily reflect the views of the Economic Development Administration. Page 5
8 Executive Summary Changes in the global, national and regional economic landscape have led economic development efforts in a new direction. Efforts are increasingly focused on encouraging more start-up activity at the local level. This strategy of growing your own companies has proven to be an effective approach for many communities. An entrepreneurial approach can also be used as a complement to the strategy of industrial recruitment. Furthermore, entrepreneurship is a great tradition in the United States where innovation and new ideas have been instrumental in creating wealth and a resilient economy. Recognizing this shift in strategy toward entrepreneurship, the Institute for Regional Innovation and Entrepreneurship at Southeast Missouri State University with the support of the Economic Development Administration, a unit of the United States Department of Commerce, has undertaken an initiative to facilitate economic development through entrepreneurship. The Institute is undertaking a series of Entrepreneurial Assessments done on a regional basis to help regions identify specific actions that they can take to improve the environment, and potential success, of entrepreneurs. This report represents the Entrepreneurial Assessment for the Lake of the Ozarks Council of Local Governments four county region. The main goal of the regional entrepreneurship assessment strategy is to identify and analyze key factors related to fostering a strong entrepreneurial ecosystem in the Lake of the Ozarks Council of Local Governments four county region. The entrepreneurial ecosystem describes an environment that is nurturing for emerging businesses. This system has the right mix of support, capital, networks, training, and other elements that help entrepreneurs succeed. The research is developed around an entrepreneurship policy framework. Using Dr. James Stapleton s research from the Delta Regional Authority report titled Transforming Community Economies, regional entrepreneurial ecosystems are driven by five factors: (1) Developing a Pipeline of Educated and Skilled Entrepreneurs; (2) Cultivating Technology Exchange and Innovation; (3) Improving Access to Capital; (4) Promoting Awareness and Building Networks; and (5) Optimizing the Regulatory Environment. Each of these drivers are analyzed for the Lake of the Ozarks region. A variety of data-driven tools are utilized, including: (1) a regional survey; (2) an interactive focus group; (3) the National Establishment Times Series (NETS); (4) industry clusters; (5) traded vs. local clusters; and (6) an innovation index. Based on the regional analysis, a set of recommendations have been proposed to improve the entrepreneurial ecosystem of the Lake of the Ozarks region. Areas of improvement include: Establish specialized training and educational programs Develop new and existing amenities to keep and attract young adults Invest in improvements to internet access throughout the region Survey regional businesses to determine their future workforce needs Evaluate the formatting of organized angel investors and lending groups Expand the current business plan competition Provide an easily accessible startup packages Conduct annual survey to gauge perception of the regulatory environment. Page 6


9 While the Lake of the Ozarks region shows promise on some fronts, it is necessary to understand that both private and public entities must come together and help support continued economic and entrepreneurial development efforts. Without the combined effort and ownership from stakeholders, public and private, attempts at improving the entrepreneurial ecosystem will likely prove difficult and ineffective. The analysis demonstrates that the Lake of the Ozarks region has the needed foundation to become an even more vibrant economy. In particular, the region is impressive with respect to increasing educational attainment levels, growth in Advanced Materials and Biomedical/ Biotechnical industry clusters, and showing support for economic development initiatives. Through an active and strong partnership, the public sector and private sector can create an improved entrepreneurial ecosystem which will stimulate more business development in the region. In order to facilitate this cooperation, it is suggested that economic development professionals and city/county officials meet regularly to discuss and implement regional economic and entrepreneurship development opportunities. MISSOURI LAKE OF THE OZARKS COUNCIL OF LOCAL GOVERNMENTS REGIONAL MAP Page 7
10 Introduction Economic development is a critical issue for Missouri. Many communities are seeking to improve their local economy by adding new jobs and increasing incomes. In the past, economic development was done largely by recruiting large companies to locate in the region. The new businesses brought jobs and good wages to residents. However, with changes in the global economy, recruitment alone is not sufficient to address the economic needs of most communities. Analyzing the entrepreneurial ecosystem is important for several reasons. For one, it has now become evident that young, small growth-firms are responsible for the vast majority of net new jobs in the country (Haltiwanger et al., 2013). Additionally, it is clear that the old economic development method of focusing solely on recruiting large firms is less likely to be effective in today s economic environment. This is particularly true for rural economies (Macke et al., 2014). A much better understanding of what it takes to develop and foster economic growth through an entrepreneurship focused approach is now available to economic developers and policy makers. Young, small growth firms are major job creators, so supporting the entrepreneurial ecosystem is a vital economic development strategy The purpose of this report is two-fold. The first objective is to gain a better understanding of the entrepreneurial ecosystem in the Lake for the Ozarks region. This is achieved through a data driven process in which key factors related to the entrepreneurial ecosystem are identified. The second objective is to develop actionable recommendations based on the findings from the first objective. These recommendations will help guide the region s efforts towards fostering long-term economic and entrepreneurial development initiatives. The research conducted for this report is focused on the geographical region of Lake of the Ozarks. The region is comprised of four counties: Camden, Laclede, Miller, and Morgan. These four counties are collectively referred to as the Lake of the Ozarks CLG region or LOCLG. The report has five sections. First, there is a brief description of the methodology, including data tools used in the study to analyze the drivers of entrepreneurship. Second, the Regional Profile is presented. The regional profile was developed to help the reader get an easy, broad overview of the current economic and entrepreneurial climate in the Lake of the Ozarks CLG region. In the third section, each of the drivers are explained based on how they will support and foster long-term entrepreneurial success for the region. The fourth and most important section of the report analyzes the status of each driver and examines its strengths and weaknesses within the Lake of the Ozarks CLG region. For example, in analyzing the driver called Developing a Pipeline of Educated and Skilled Entrepreneurs, it is considered whether there is adequate business counseling and training available to entrepreneurs. In the fifth and final section, the outcomes from the analysis are summarized and presented with recommendations based on the analysis. Page 8
11 Methodology Six different data driven tools are used to analyze the entrepreneurial and innovative activities that support the entrepreneurial ecosystem in the region. These data tools include: 1. A regional survey 2. An interactive focus group 3. The National Establishment Times Series (NETS) 4. Industry cluster analysis 5. Traded vs. local cluster analysis 6. An innovation index. Detailed explanations of each data tool are provided in Appendix I. Throughout the analysis, these tools will be used to highlight key factors related to strengths and challenges faced by the Lake of the Ozarks CLG s entrepreneurial ecosystem. The first two data tools are based on the views of business owners, public officials, entrepreneurs, and other community leaders as to how the entrepreneurial ecosystem is working. The next four tools use objective data sets to measure variables related to economic and entrepreneurial dynamics. The four objective data tools will primarily serve as data support to help highlight trends and patterns of the region s entrepreneurial ecosystem. The main section of the report applies the data tools to the entrepreneurship policy framework (Stapleton, 2012). The policy framework is comprised of five key drivers related to developing and fostering a healthy entrepreneurial ecosystem. The five drivers are: Policy Framework Developing a Pipeline of Educated and Skilled Entrepreneurs Cultivating Technology Exchange and Innovation Improving Access to Capital Promoting Awareness and Building Networks Optimizing the Regulatory Environment Source: Transforming Community Economies, Dr. James Stapleton (2012) Page 9
12 Page 10
13 County Overview Profile of the Region Camden County is the largest county in the Lake of the Ozarks CLG region with approximately 43,731 residents. The county has experienced significant population growth which appears to be caused mostly by retirees moving to the area. It is therefore noteworthy that in 2013 the county was ranked as the 4th best retirement community in Missouri by the Missouri Senior Report. Camden County has the strongest economic base in the region with income levels close to the state average. Educational attainment in the adult population has also seen a success story with a significant increase in residents with higher level degrees. Additionally, the county has also seen the slowest loss of young adults in the region. While the county has gained only approximately 540 jobs between 2002 and 2013, a major shift in the job structure has occurred. In 2013, 80% of jobs in the region were found in small and medium companies with fewer than 100 employees. This was up from 74% in Larger establishments with more than 100 employees lost a total of 1,398 jobs over this time period, but this was counterbalanced by a gain from small and medium sized establishments of 1,938 jobs. In other words, the importance of small and medium sized establishments as job creators and providers has increased over the last decade. The county s economy has largely been driven by the retail trade, health care, tourism/ accommodation and food services sectors. The health care sector appears to be the strongest in terms of historic growth, while tourism has declined over the past decade. One of the great assets benefiting the entrepreneurial ecosystem in Camden County is the SCORE chapter. Another valuable asset is the State Fair Community College in Osage Beach. Laclede County is the second largest county in terms of population size with approximately 35,571 residents. The overall population growth has been slightly higher than the Missouri average over the last decade, and the county has the highest share of young adults in the region. The county also has the highest labor force participation in the region, with a 60.4% participation rate. The county s productivity is very strong with the highest regional GDP per worker at $60,679. The total number of jobs in the county grew by approximately 486 from 2002 to Most of the growth came from a large increase in jobs from small sized businesses with 2 to 99 employees, while businesses with 100 to 499 employees added a few jobs. The largest employers with over 500 employees lost over 2,000 jobs between 2002 and In 2002, 62% of jobs were in companies with fewer than 100 employees, which increased to 71% by Historically the county has had a strong presence of large establishments, but this appears to be changing towards a county with fewer large employers and more small/medium businesses. The county s main economic driver has historically been in the manufacturing sector, with a particular strength from the transportation equipment manufacturing cluster. Other large industry sectors include retail trade and health care. Page 11
14 The city of Lebanon also has a SCORE chapter through the Lebanon Chamber of Commerce. Another valuable asset is the Ozarks Technical Community College campus in Lebanon. Miller County is the third largest county in the region. The county experienced the slowest population growth in the region and has experienced a significant decline of young adults over the last two decades. On the upside the county had the second highest labor force participation rate at 60.1% and low unemployment rate of 5.7% (as of November, 2014). Jobs in the county increased by approximately 710 jobs between 2002 and The new jobs came from an even mix of establishments with 2 to 9, 10 to 99, and 100 to 499 employees. In 2002 there were roughly 750 jobs in the only large company in the county. By 2013, this company had either decreased in size or closed down and no companies with over 500 employees were found in the county*. The share of jobs in small and medium sized establishments with fewer than 100 employees increased from 77% in 2002 to 83% in Industry data indicates that the strongest sector in terms of jobs is related to education and information dissemination firms. Other economic driver sectors include retail trade, construction, manufacturing, and health care. One of the important assets in the county is the State Fair Community College campus in Eldon. Morgan County is the smallest in the region in terms of population. The county has a very high share of retirees and the lowest share of young adults in the region. The biggest challenges in the county appear to be the decline in young adults and the decline in higher educational attainment levels. While the county gained 989 jobs between 2002 and 2013, the additional jobs came from small establishments with 2 to 9 employees and medium/large establishments with 100 to 499 employees. The medium sized establishments with 10 to 99 employees decreased by nearly 450 jobs over this time period. The share of jobs from small establishments with fewer than 100 employees decreased from 88% in 2002 to 81% in It should be noted, however, that no jobs were identified in large establishments with more than 500 employees**. Manufacturing, construction, retail trade, and the health care sector are the biggest economic drivers in the county. The table below highlights the support organizations in the region. Contact information for each of them is identified throughout the report. Regional Support Organizations Lake of the Ozarks Council of Local Governments Lake of the Ozarks West Chamber of Commerce Eldon Community Foundation Camden County MU Extension SBTDC SCORE - Lake of the Ozarks Eldon Area Chamber of Commerce Lake Area Chamber of Commerce Camdenton Area Chamber of Commerce Lebanon Area Chamber of Commerce Versailles Area Chamber of Commerce Community Foundation of the Lake Camdenton Department of Economic Developnent Lake of the Ozarks Regional Economic Development Council Lebanon Regional Economic Development, Inc. Economic Development Advisory Committee *As of January 29, 2015, a company in Miller County was identified with more than 500 total employees. **As of January 29, 2015, a company on Morgan County was identified with more than 500 total employees. Page 12

15 Demographic Dynamics An overview of the demographic makeup of the Lake of the Ozarks CLG region is an important element in the regional assessment. Developing and implementing new strategic initiatives cannot be done without consideration of the people living in the region. Understanding population, age dynamics, basic economic factors, and educational attainment differences between counties in the region will help ensure that recommendations are relevant both on regional and local levels. Camden Laclede Miller Morgan Source: U.S. Census - American Community Survey 2012 In the four counties included in the Lake of the Ozarks CLG region, two stand out in terms of population numbers: Camden and Laclede County. These two counties make up 64% of the total regional population. This is important because population size is a good indicator of available human resources, and when a strategy is developed on a regional scale it can prove very helpful to know from where the largest pool of resources can be drawn. However, it is not enough to simply look at the current population to understand population dynamics. Population trends, as shown in Table 1.1, are important to consider because they indicate the foundation of a region s economic well-being. A growing population shows increased human resources and indicates that residents believe the region is worth living and staying in. A declining population can have a negative effect on the region s available human capital. The biggest challenge with this declining population trend is to identify why residents are leaving or why people from other regions are not moving into the Lake of the Ozarks CLG region. This will be discussed further throughout the report. Overall, as shown in Table 1.1 the region has grown at a pace slightly faster than the state of Missouri since Camden County has grown at a substantially higher rate than the other counties increasing by 18% from 2000 to As shown below, a majority of the growth comes from an increase in the population over the age of 55, while younger generations have only grown marginally, or in the case of 35 to 44 year olds, even declined in total numbers. The same trend of growth in the older population and a decline in younger generations holds true for all the other counties as well. Page 13
16 Table LOCLG - Population Trends (2000 Census and 2012 ACS) 2000 Census ACS 2012 Change Percent Change LOCLG 112, ,599 12, % Camden County 37,051 43,731 6, % Laclede County 32,513 35,507 2, % Miller County 23,564 24,882 1, % Morgan County 19,309 20,479 1, % Missouri 5,595,211 6,021, , % Source: U.S. Census In addition to population trends, it is also relevant to look at age dynamics. It is generally considered helpful to have a relatively large share of young adults combined with a good portion of experienced adults. Having a high share of 15 to 24 year olds can be a good source of longterm human capital, while a good share of 25 to 34 year olds indicates access to current human capital, and a strong share of 35 years or older can be an important contributor of experience and knowledge. In other words, a balanced population with respect to age groups is important when discussing available human resources. When looking at the age dynamics in Table 1.2 for the Lake of the Ozarks CLG region, the first thing to notice is the high ratio of residents older than 55 in Camden and Morgan County. In these counties this age group is more than 10 percent higher than the state average. As a result the younger age brackets going from 0 to 44 year olds are all below the state average, indicating a relatively small portion of children, young adults, and adults in Camden and Morgan counties. In the other two counties, Laclede and Miller, the young adult age brackets, 15 to 24 and 25 to 34, are slightly below the state rate, albeit less so than the Camden and Morgan. The percent of adults between 35 and 54 is comparable to the state rate for Laclede and Miller counties. The implication of this is that a lack of young adults could potential hurt the region s ability to invest in and develop its long-term human capital resources. An overabundance of an older generation may be a good source of experienced professionals, but transferring that knowledge to the next generation will require serious efforts and investment on the part of both public and private entities. Table LOCLG - Population Age Dynamics to to to to to LOCLG 18.3% 11.3% 10.2% 11.5% 14.7% 34.0% Camden County 15.7% 10.2% 9.1% 10.5% 15.0% 39.6% Laclede County 20.4% 12.4% 11.9% 12.5% 14.5% 28.2% Miller County 20.3% 12.0% 11.1% 12.6% 14.9% 29.0% Morgan County 17.5% 11.3% 8.8% 10.4% 14.1% 38.0% Missouri 19.5% 14.0% 13.0% 12.6% 14.7% 26.2% Source: U.S. Census - American Community Survey 2012 Page 14
17 Economic Dynamics The data in Table 1.3 shows median household income is far below the state median in Laclede, Miller, and Morgan County, while Camden is close to state median. Per capita income follows the same pattern, with the same three counties being below state level, and Camden close to it. The labor force numbers do not follow that pattern, however. All counties fall below the state average, but Laclede and Miller come closer than Camden, with Morgan being the furthest below. Income measures should of course not be considered in a vacuum, but rather in the context of cost of living measures. According to missourieconomy.org, the 2013 Missouri average cost of living index was 96.3 (100 being the national average). The counties in the Lake of the Ozarks CLG region s cost of living index were 97 for Camden County, 94.5 for Laclede County, 94.5 for Miller County, and 95.4 for Morgan County. The lower cost of living index numbers help counterbalance some portions of the lower income levels, but the overall region still suffers from low income levels. Beyond income and labor force dynamics, it is also relevant to consider poverty rates. The relationship between entrepreneurship and poverty is challenging, but nonetheless relevant. A region s poverty rate is expected to have a negative relationship with its level of entrepreneurial activity and innovation. The direction of causality in this relationship can work in both directions. A higher poverty rate can be the cause of less innovation if low income levels discourage the development of new firms and the expansion of existing ones while encouraging would-be entrepreneurs to move out of the area. At the same time, weak levels of innovative activity can cause weak job growth and contribute to a higher poverty rate. With the exception of Camden, there is not much variation among the region s rates. Laclede, Miller, and Morgan all have a relatively high poverty rate, each slightly above 20%. At 16%, Camden scores very close to the state average. One of the contributing factors to the higher poverty rates may be a lack of well-paid job opportunities, and an excess of low-wage/minimum wage jobs in the region. Other factors may be relevant too, but to combat the poverty issue it would be worthwhile to investigate opportunities for developing more well-paid jobs. Table LOCLG - Economic Perspective Median Household Income Per Capita Income In Labor Force, percent of person age 16+ Poverty Rate (3 year average ) LOCLG $39,542 $20, % 18.4% Camden County $44,577 $23, % 16.0% Laclede County $39,101 $19, % 21.0% Miller County $34,763 $19, % 20.9% Morgan County $35,446 $18, % 22.2% Missouri $47,333 $25, % 15.8% Source: U.S. Census - American Community Survey 2012 Page 15
18 Another aspect of the economic landscape is the region s unemployment rates. If unemployment rates are high and businesses are hesitant to hire, it is likely to have an adverse effect on a region s ability to retain current un/underemployed residents and attract new talent. The unemployment rates shown below in Table 1.4 are therefore indicators of the strength of the labor market. At 10.5% the Lake of the Ozarks CLG region had an average unemployment rate much higher than the state and U.S. average, indicating that the region as a whole had struggled with getting back on track in the post-recession years. The variation in average unemployment among counties is relatively low, ranging from 10.2% to 10.7%. Camden County scored the lowest at 10.2% average unemployment. Focused efforts towards reducing unemployment is an important component in any effort focused on improving a regional economy, but in the case of fostering an entrepreneurial economy it plays a key role in providing the best circumstances for new business development to take place. However, it should be noted that there were improvements from one year to another in all counties. Table LOCLG - Unemployment Rate, 3-year average ( ) Unemp. Rate 2010 Unemp. Rate 2011 Unemp. Rate 2012 Average Unemp. Rate Unemp. Rate, Nov LOCLG 11.5% 10.9% 8.9% 10.5% 5.9% Camden County 10.9% 10.6% 9.0% 10.2% 6.1% Laclede County 11.5% 11.0% 9.0% 10.5% 6.2% Miller County 12.0% 11.1% 8.8% 10.7% 5.7% Morgan County 12.3% 11.2% 8.7% 10.7% 5.7% Missouri 9.3% 8.4% 7.0% 8.3% 5.1% U.S. 9.6% 8.9% 8.1% 8.9% 5.8% Source: statsamerica.org Using three year averages helps provide a broader picture of general economic trends and stability. However, it is nonetheless helpful to look at the three year average in the context of more current unemployment data. According to the Bureau of Labor Statistics the unemployment rates in November 2014, for each county were 6.1% in Camden, 6.2% in Laclede, 5.7% in Miller, and 5.7% in Morgan County. This compares to a Missouri rate of 5.1% and national rate of 5.8%. Page 16
19 Educational Dynamics Looking at educational attainment the data in Table 1.5 shows some serious regional challenges. The percent of people age 25 or older with at least a high school diploma is below average in Laclede, Miller, and Morgan, all at the lower end of 80%. In contrast, Camden is above the state average in this category. When looking at the percent of people with a bachelor s degree or higher, all counties are below the state average, although Camden County s average is still well above the other counties. This pattern continues with percent of the population with a master s degree or higher being very low for all counties except Camden. The importance of educational attainment in the regional population will be discussed in more detail in the Developing a Pipeline of Educated and Skilled Entrepreneurs driver section. Table LOCLG - Educational Attainment, percent of person age High School or higher Bachelor s degree or higher Master s degree or higher LOCLG 84.9% 16.1% 5.6% Camden County 90.0% 20.8% 7.9% Laclede County 80.7% 13.4% 4.3% Miller County 84.8% 13.8% 4.8% Morgan County 80.4% 13.3% 3.8% Missouri 87.2% 25.8% 9.6% Source: U.S. Census - American Community Survey 2012 Job Dynamics When looking at regional jobs, the data in Tables 1.6a/b shows that employment increased by approximately 2,721 jobs between 2002 and Establishments with 2 to 9 employees added a total of 3,686 jobs, 10 to 99 sized establishments added 1,250 jobs, and 100 to 499 sized establishments added 1,316 new jobs. Self-employment also increased, but less so with only 404 new jobs. However, this was counterbalanced by a decline in jobs from large establishments with 500 or more employees, which declined by 3,935 jobs from 2002 to In other words, the majority of new jobs came from establishments with 2 to 9, 10 to 99, and 100 to 499 employees. From this data it becomes apparent that the bulk of jobs by 2013 were found in small and medium sized establishments. By 2013, 40.4% of jobs came from establishments with 10 to 99 employees, and if jobs from the 2 to 9 bracket are added, the rate goes up to 73.5%. Establishments with 500 or more employees only accounted for 3.6% in 2013, down from a high of 10.7% in Self-employment increased steadily from 2002 to 2008, but then declined again in In 2010 the self-employed reached a high of 5,709 jobs. The 2009 decline may be explained, in part, by the general downturn in the economy, followed by many long-term unemployed people by 2010 being forced to become self-employed because jobs became harder to find. The subsequent decline in self-employment in 2011 to 2013 may then be a healthy indicator that fewer individuals had to resort to self-employment as a source of income. The importance of this should not be understated. Entrepreneurs play a vital role in economic development and job creation. But, this role works better when market conditions allow those who truly want to go into Page 17
20 business for themselves to do so. Sometimes it may be caused by necessity, but for the most part it should be driven by a personal and professional desire. Overall, the data provides strong evidence for the view that small and medium sized businesses are the main job providers and creators. Therefore, economic development investments should include providing meaningful support for these establishments. This also indicates that while the traditional approach to job creation by attracting large outside employers is important, a transition of resources should be considered to solely support entrepreneurship. Development efforts should therefore be supplemented by more relevant strategies that focus on helping new businesses start and existing businesses grow. A full overview of job trends and dynamics is provided in appendix III. Table 1.6a - LOCLG - Total Regional Jobs Establishment Size Total 56,477 55,018 55,855 57,861 58,733 60,021 Self-employed 2,407 2,452 2,822 3,844 4,174 4,727 2 to 9 15,895 15,835 16,258 17,488 17,860 18, to 99 22,660 22,762 23,088 23,185 23,470 23, to 499 9,453 8,442 8,660 9,617 9,802 9, ,062 5,527 5,027 3,727 3,427 3,427 Table 1.6b - LOCLG - Total Regional Jobs (continued) Establishment Size Total 60,583 57,472 59,982 60,092 59,688 59,198 Self-employed 5,091 4,353 5,709 4,621 3,492 2,811 2 to 9 19,758 18,670 20,573 20,497 20,549 19, to 99 23,756 22,588 21,999 22,609 22,786 23, to 499 9,851 9,734 9,574 10,238 10,734 10, ,127 2,127 2,127 2,127 2,127 2,127 Source: youreconomy.org, National Establishment Times Series Page 18
21 Industry Dynamics NETS data also provides a clear picture of jobs within different industry sectors. This data provides an overview of high employment industries, which for the Lake of the Ozarks CLG region include Retail Trade, Manufacturing, Accommodation and Food Services, Health Care & Social Assistance, Educational Services, Other Services, and Public Administration. These industries are what would typically be expected in most rural regions because they can be considered necessity industries. The exception being manufacturing, which in the case of the Lake of the Ozarks CLG region may provide a strong foundation for future economic and entrepreneurial development strategies. The majority of the job losses in manufacturing occurred from 2002 to 2009, followed by relative stability around 8,000 jobs. While traditional manufacturing struggled for years throughout the country, it is now becoming increasingly apparent that more specialized and/or niche manufacturing industries can be fostered. When a region already has a strong base of manufacturing companies and jobs, moving towards this trend becomes more realistic. Another trend to take note of is the high increase in the education and public administration industries. Investing in these areas may also prove valuable for long-term economic and entrepreneurial development strategies. A full overview of industry trends from 2002 to 2013 is provided in appendix III. Table LOCLG - Top 7 Regional Industries by Employment ( ) Industry Change Retail Trade 8,010 8, Manufacturing 10,682 7,825-2,857 Accommodation and Food Services 7,135 6, Health Care and Social Assistance 4,581 5, Educational Services 3,461 4,588 1,127 Other Services (except Public Administration) 3,267 4, Public Administration 1,954 4,007 2,053 Source: youreconomy.org, National Establishment Times Series Page 19
22 Cluster Dynamics Industry Clusters Industry cluster data recognizes that industries in related sectors tend to cluster together geographically. An industry cluster will include the core industries that produce related or similar goods. Upstream industries include suppliers of inputs to the core industries. A cluster will also include support industries that offer various specialized services to the core industries. Finally, a cluster will include downstream industries, which are the ultimate customers of the core industries. These typically include wholesale and retail establishments. Looking at the cluster dynamics for the Lake of the Ozarks CLG region, the goal is to identify clusters with the most growth potential. There are four key criteria for identifying such clusters: (1) Location Quotient (LQ) above 1; (2) LQ is growing; (3) relative high employment numbers; and (4) growth in employment numbers. Industry clusters of particular interest are those that meet at least three of the four criteria. The LQ is a measure of the relative employment in a cluster as compared to the national employment average. In other words, a regional LQ higher than 1 indicates a higher concentration of employment in a specific cluster, as compared to the overall national employment. The data in Table 1.8 shows four main industry clusters that meet this requirement. It should be noted that the order of the industry clusters in Table 1.8 does not necessarily represent level of importance. The biomedical/biotechnical cluster includes companies working in areas such as medicine manufacturing, laboratory instrument manufacturing, medical equipment supplier manufacturing, health and personal care stores, scientific research and development services, etc. The advanced materials cluster includes companies working in areas such as industrial gas manufacturing, soap and detergent manufacturing, synthetic rubber manufacturing, paint manufacturing, metal foundries and refinement etc. The primary metal manufacturing cluster companies work with iron and steel mills, metal forging, steel foundries, metal refining, etc. The Transportation Equipment Manufacturing cluster includes industries automobile manufacturing, vehicle parts manufacturing, aircraft manufacturing, bicycle/motorcycle manufacturing etc. These clusters present themselves as the most likely candidates for strong regional economic impact and long-term competitive strengths. The implication of this relates to how the region should invest in promoting and developing the business environment. To reap the biggest long-term benefits investments should be focused on supporting and fostering factors related to these industries. For example, organizing an annual innovations in modern manufacturing conference would be a way to help ensure long-term development of those clusters centered on manufacturing. Another example would be to identify specific companies within any of the clusters and then investigate what challenges they are facing that the public sector can help meet. One of the clusters that does not appear as a top regional industry cluster is the Arts, Entertainment, Recreation and Tourism cluster. This is somewhat unexpected due to the historic prevalence of tourism in the region. The data (See appendix IV for details) shows a decline in the regional LQ from 1.92 to 1.53 as well as a decline in employment from 3,098 to 2,307. While all counties have experienced declines in both LQ and employment individually, it is in Camden County that the biggest challenge appears to lay. The majority of the current employment in this cluster is still found in Camden County, but the decline has been severe, dropping in employment from 2,057 to 1,648. Crosschecking this negative trend with the jobs data based on NAICS industries, the trend appears real. This negative trend is backup by looking at the Page 20


23 comparable NAICS industry which is Arts, Entertainment, and Recreation, where the regional jobs declined from 1,605 in 2002 to 1,275 in A full overview of all industry cluster data is provided in appendix IV. Table LOCLG - Top 4 Regional Industry Clusters Cluster LQ 2002 LQ 2012 Change Emp Emp Change Biomedical/biotechnical ,061 3, Advanced Materials , Primary Metal Manufacturing Transportation Equipment Manufacturing ,105 1, Source: clustermapping.us Traded vs. Local Clusters Besides looking at industry clusters, employment can also be divided into clusters based on traded vs. local clusters. Traded clusters are groups of related industries that sell their goods and services beyond the local market to other regions, states, or nations. Local clusters are groups of industries that only sell within their local market boundaries. The top 10 traded and local clusters have been identified. The top 10 traded clusters are important to consider when looking for ways to create longterm economic impact because they provide the strongest foundation for potential economic impact. These clusters should be considered top candidates for future investment and investigation into exporting opportunities. Providing relevant support for companies in these clusters is likely to have higher payoffs than in other clusters. Relevant support should primarily be focused on ways to help these companies expand further into new regions and markets. For example, some companies may benefit from having access to expert consulting on national and global exporting and importing issues. Others may need help with expanding into new geographical regions. Traded Local Source: clustermapping.us Traded clusters provide the strongest foundation for potential economic impact because they bring money into the region by doing business beyond the regional boundaries. As such they should be prioritized in any economic development strategy. However, healthy, growing local clusters should not be ignored. They provide the necessary regional foundation for making an area s amenities attractive. A thriving entrepreneurial ecosystem can and should take advantage of both traded and local clusters because each provides opportunities for economic growth and development. In other words, without local real estate development, financial services, and education, etc., it is nearly impossible to create the proper circumstances for e- commerce, manufacturing exports, tourism, or other traded clusters to prosper. Page 21
24 Overall, Figure 1.2 shows that 30% of regional employment is in traded cluster companies. This is lower than the national rate of 36% employment in traded clusters. A full overview of all traded and local clusters is provided in appendix V. The employment trends identified in the Traded vs. Local Clusters (Tables 1.9a/b) can appear difficult to consolidate with the general NAICS industry job trends and Industry Cluster trends. This is because each industry tool uses unique definitions for what type of firms are included, so even when the names appear similar the actual definitions might differ substantially. For example, jobs in the manufacturing industry based on NAICS definitions shows a decline from 10,682 jobs in 2002 to 7,825 jobs in Comparing this to the Industry Cluster tool the data differs because here the industry is limited to a set of specific types of manufacturing firms. Some manufacturing jobs are identified in the Primary Metal Manufacturing, others in Transportation Equipment Manufacturing, and then others in Advanced Materials, etc. Some of these Industry Clusters show positive job trends while others show negative job trends. Comparing this to the Traded vs. Local Cluster job data and definitions change again leading to new categories of manufacturing jobs. Some of the Traded Clusters where manufacturing jobs are likely to be counted include Production Technology and Heavy Machinery, Upstream Metal Manufacturing, Lighting and Electric Equipment, and several others. Again, some of these Industry Clusters show positive job trends while others show negative job trends. Other industries are easier to analyze and detect patterns in. For example, tourism-related industries shows declining trends in all the data tools. The Hospitality and Tourism Traded Cluster shows a regional decline of 719 from 2004 to The NAICS industry the Arts, Entertainment, and Recreation declined by 330 jobs from 2002 to And, the Arts, Entertainment, Recreation and Tourism Industry Cluster declined by 791 jobs from 2002 to The overreaching goal of using three data tools to discuss industry trends is to emphasize the importance of looking at job trends from more than one angle. While the different definitions from each industry tool can come across as confusing or inconsistent, the upside is that it gives the reader a chance to appreciate the fact that firms and jobs can be defined and put in many boxes depending on how one looks at an industry. Page 22
25 Top 10 Regional Traded Clusters Table 1.9a - LOCLG - Top 10 Regional Traded Clusters Based on Employment Cluster Name change Production Technology and Heavy Machinery 1,725 2,555 2,680 2,565 2, Hospitality and Tourism 2,040 1,856 1,900 1,582 1, Water Transportation 1,475 1,866 1,555 1,151 1, Distribution and Electronic Commerce 1,402 1,395 1,445 1,760 1, Business Services , Automotive , Transportation and Logistics Upstream Metal Manufacturing Financial Services Lighting and Electrical Equipment 1,500 1,500 1, ,140 Source: clustermapping.us Top 10 Regional Local Clusters Table 1.9b - LOCLG - Top 10 Regional Local Clusters Based on Employment Cluster Name change Local Health Services 3,544 3,708 4,690 4,906 5,124 1,580 Local Hospitality Establishments 4,083 4,788 4,464 4,126 4, Local Real Estate, Construction, and Development Local Retailing of Clothing and General Merchandise Local Motor Vehicle Products and Services 4,480 5,109 5,310 3,922 3, ,335 2,815 2,776 2,741 2, ,808 2,655 2,632 2,291 2, Local Commercial Services 1,487 1,689 1,429 1,427 1, Local Food and Beverage Processing and Distribution Local Community and Civic Organizations 1,652 1,496 1,394 1,274 1, ,068 1,076 1,280 1,329 1, Local Financial Services 1,052 1,095 1,101 1,120 1, Local Household Goods and Services 1,097 1,033 1, Source: clustermapping.us Page 23
26 Innovation Index Dynamics Considering innovative dynamics provides an overview of key factors related to a region s entrepreneurial activities and innovation potential. Key components of the Innovation Index are highlighted throughout the report when discussing the drivers of the policy framework. The Innovation Index is presented in full here to help the reader appreciate the region s strengths and challenges related to fostering an entrepreneurial ecosystem based on innovative activities. The scores for the Innovation Index and the four components are shown in Table In the Index a score of 100 is the national average. Therefore, scores above 100 indicate a region has more innovative activities than the national average and scores below 100 indicate less innovative activities.the relevant components of the index and the indication of the appropriate framework drivers will be discussed in greater detail beginning on page 23. In general, the data shows the region lags noticeably behind on three components: Human Capital, Economic Dynamics, and Productivity & Employment. The biggest challenges in these areas appear to be low attainment of bachelor s or master s degrees, few people employed in high-tech jobs, no venture capital invested in the region, few large firms operating in the region, weak job growth when compared to population growth, and little patent activity. Some challenges are more relevant to rural areas than others. For example, low educational attainment is something that a region can truly do something about if efforts are put into place to improve access to higher educational institutes. But on the other hand, it is of little value to discuss the lack of available venture capital in the region because this type of investment money is almost exclusively found in large metro areas, such as Silicon Valley, New York, Boston, etc. The same goes for the low level of patent activity, which is of little relevance when discussing innovative activities in rural areas. The strongest component is Economic Well-Being, where the region surpasses the state average and is nearly at the national level. The region excels in Economic Well-Being due to an extraordinarily high Average Net Migration Rate. At a rate of 43.7 per 10,000 residents, the high migration rate indicates that the region is attractive enough to draw in job seekers and families at a much higher rate than the state average of 1.8. However, taking into consideration that the young adult population has decreased, the high net internal migration is likely caused, in part, by an increase in the retirement age population. The change in per capita income is also over the state average slightly, but in every other category the region is behind the state and nation. The influx of so many new residents from other areas is, by far, the biggest reason for the region s success in Economic Well-being. County level data for the Innovation Index is provided in appendix VI. Page 24
27 Table LOCLG - Innovation Index LOCLG Missouri U.S. Innovation Index Human Capital % of Adult Pop. with some College or Associate s Degree (2012) 30.7% 31.8% 30.6% % of Adult Pop. with Bachelor s Degree or Higher (2012) 16.9% 28.0% 30.2% % Change in Young Adult Pop. ( ) -0.4% -0.5% -0.2% Average High-Tech Employment Share ( ) 1.7% 3.7% 4.7% Tech-based Knowledge Occupations Share (2011) 10.6% 12.0% 12.2% Economic Dynamics Average VC Investment per $10,000 GDP ( ) $0.00 $3.69 $39.92 Broadband Density (2012) Average Annual % Change in Broadband Providers ( ) 16.2% 19.3% 23.2% Average Establishment Churn ( ) 76.0% 76.1% 76.4% Average Small Establishments per 10,000 Workers ( ) Average Large Establishments per 10,000 Workers ( ) Productivity & Employment % Change in High-tech Employment Share ( ) 4.3% 0.5% -0.1% Job Growth-to-Population Growth Ratio ( ) Gross Domestic Product per Worker (2011) $54,308 $62,193 $74,540 % Change in Gross Domestic Product per Worker ( ) 0.82% 0.61% 1.11% Average Patents per 1,000 Workers ( ) Economic Well-Being Poverty Rate, 3-year Average ( ) 18.4% 15.8% 15.7% Unemployment Rate, 3-year Average ( ) 10.5% 8.3% 8.9% Ave Net Internal Migration Rate per 10,000 Residents ( ) % Change in Per Capita Personal Income ( ) 3.5% 3.2% 3.6% % Change in Average Wage and Salary Earnings ( ) 3.0% 3.1% 3.4% % Change in Average Proprietors Income ( ) 0.8% 1.5% 1.2% Source: statsamerica.org Page 25
28 Entrepreneurial Perception The last piece of the regional profile looks at responses from the open-ended question on the regional survey. On this question, respondents were asked to consider their entire regional business environment and list and explain the most important regional issue(s) that should be addressed to improve the region s business climate and community. The analysis of the feedback revealed several themes. These themes were centered around regional collaboration by both public and private institutions, focus on growing and supporting local businesses, and access to professional/technical training and education opportunities. Additional concerns were ensuring access to capital funding and promoting more year round attractions for both locals and tourists. Three quotes have been selected to give examples of each theme. More work must be done to include all stakeholders in the region for future job growth and regional development Having a clear roadmap of how entrepreneurs or startups can get help in starting and growing their businesses Post-secondary education including technical schools and community colleges Also, based on the feedback, a word cloud has been generated highlighting the most common terms used. The size of the word represents the frequency in which it was used. All responses to this survey question have been provided in appendix II. Survey Word Cloud Area Needs Capital Funding Cooperation Economic Education Family Growing Incentives Jobs Lake Local Lots Major Theme Park Morgan County Opportunities Resources Small Town Work Closer Work Force Source: Regional Survey (2014) Page 26
29 Region at a Glance Observation Strengths Challenges Population Total regional population approximately 124,615. Largest county is Camden, with 43,731 residents. Strong net internal migration rate in overall region, meaning more people move into versus out of region. Low percent of young adults between 15 and 34 in all counties, as compared with Missouri percent. Income and Poverty Overall relatively low income levels and high poverty, as compared to Missouri levels. Camden County has strongest income levels and lowest poverty rate, close to Missouri levels. Miller and Morgan counties have lowest income levels and highest poverty rates. Education Large variation in educational attainment levels between counties. Camden County has educational attainment levels fairly close to Missouri levels. Laclede, Miller, and Morgan counties lag farther behind on educational attainment, as compared to Missouri averages. Job Growth Overall increase of 2,721 jobs from 2002 to Small and medium sized establishments have added substantial number of jobs. Larger establishments with more than 500 employees have lost jobs since Important Industry Factors The educational services and public administration industries have been the biggest job creators since Manufacturing is still strong with respect to employment, and most of the job losses occurred prior to Educational services and public administration have grown substantially. Redirecting economic development focus towards industries that are prospering, like production technology and heavy machinery, while still helping industries like tourism that have struggled the past decade. Innovation Levels Relatively low Human Capital and Economic Dynamics scores, and relatively strong Productivity & Employment and Economic Well-Being scores, as compared to Missouri scores. High net internal migration rates, and high changes in income levels over time. Low higher educational attainment levels, negative change in young adult population, lack of high-tech jobs, lagging internet access, and a problematic balance of small versus large establishments. Page 27
30 Page 28

31 The Five Drivers of Entrepreneurship Source: Transforming Community Economies, Dr. James Stapleton (2012) Page 29
.")
32 The Small Business and Entrepreneurship Policy Framework is a strategic development tool created by the Delta Regional Authority as a roadmap for creating and fostering entrepreneurial ecosystems in local communities (Stapleton, 2012). The five key drivers of the framework are: (1) Developing a Pipeline of Educated and Skilled Entrepreneurs; (2) Cultivating Technology Exchange and Innovation; (3) Improving Access to Capital; (4) Promoting Awareness and Building Networks; and (5) Optimizing the Regulatory Environment. Using the framework as a strategic roadmap helps keep the focus on relevant issues facing today s entrepreneurial ecosystems. The long-term goals are to help spur job growth through entrepreneurial activity, foster an innovative business environment, and create long-term regional competitive strengths. Each component of the framework provides insight into what is currently happening in the Lake of the Ozarks CLG region, as well as provides ideas for new initiatives that could help foster the entrepreneurial ecosystem. Long-term goals: Job Growth Foster Innovation Create Regional Competitive Strengths For the framework to have its intended impact it is important to understand that it must interact with broader economic development policies. Furthermore, for the recommendations to be successfully implemented, a diverse group of stakeholders must work toward common goals and mutually beneficial relationships must be established. Stakeholders include entrepreneurs and innovators, existing businesses (both large and small), elected officials and policy makers (local, state, and federal), educational institutions, social networks, and community advocates. Each driver is explained below: Developing a Pipeline of Educated and Skilled Entrepreneurs A high level of focus on providing education and training for potential and existing entrepreneurs has been a proven way to advance the entrepreneurial ecosystem. The educational component should exist on all levels of formal and informal education, from the elementary school classroom, to college majors and minors, to publicly available support programs, to local networking groups. Providing resources for individuals to learn and apply the knowledge and skills necessary to succeed as an entrepreneur is a key component of creating an entrepreneurial ecosystem that can create new jobs, attract new industries, and spur economic growth. Cultivating Technology Exchange and Innovation To help foster an innovative economy a region must understand and invest in technological advances and opportunities. This must happen through collaboration among educational institutions, companies, public policy makers, and entrepreneurs. This exchange of new knowledge and ideas is a key factor in creating the optimal circumstances for economic growth among small and medium sized establishments. The entrepreneurial ecosystem benefits in many ways from a high level of technology exchange and innovation, among which is the ability to attract and grow new competitive industries that will meet future market demands. Page 30
33 Improving Access to Capital A region s ability to provide the needed funding for new ventures, as well as growing companies, is essential to a healthy entrepreneurial ecosystem. Access to traditional bank financing is just one way to help entrepreneurs develop and grow. Attracting investors, whether they are angel investors, venture capitalists, or larger companies looking for new ideas, is also an important factor in ensuring the right type of funding can be accessed by entrepreneurs. Additionally, rural regions can benefit greatly from establishing gap financing tools such as revolving loan funds, intermediary lending programs, micro-loans, etc. Promoting Awareness and Building Networks Promoting an entrepreneurial culture where entrepreneurs are valued and the community is willing to support local establishments is another key aspect of a successful entrepreneurial ecosystem. This may be achieved through developing local networking opportunities, creating mentorship programs, informing the public about the social and economic impact of entrepreneurship, and engaging entrepreneurs to address the region s greatest opportunities. Optimizing the Regulatory Environment Helping entrepreneurs navigate and succeed within legal boundaries is the final key driver of a strong entrepreneurial ecosystem. This means that entrepreneurs should have easy access to information and help with understanding regulations and policies that affect their businesses. It also means that public officials should investigate the potential barriers that exist for entrepreneurs to thrive. A dialogue must be cultivated where both entrepreneurs and policy makers can meet and understand each other s needs and wants. The next section examines the strengths and weaknesses of the Lake of the Ozarks CLG region with respect to each of these drivers. This examination will help define impactful and actionable recommendations for the improvement of the entrepreneurial ecosystem. Page 31
34 Page 32
35 Developing a Pipeline of Educated and Skilled Entrepreneurs A critical component of a strong entrepreneurial ecosystem is how well the region s entrepreneurial skills and market opportunities are matched. To assess this driver, specific survey questions and focus group feedback related to the issue are discussed. To further support these results, multiple factors from the data tools are used to identify how well the region is doing with respect to educating and training its entrepreneurial workforce. The outcome from this framework driver will guide the discussion of actionable recommendations in the final section of the report. Survey One of the most common ways to help develop a pipeline of entrepreneurs is to have programs that train entrepreneurs throughout the region, like small business development centers and community college programs that teach business and trade skills. Unfortunately survey respondents rated the region s effectiveness of regional programs to train entrepreneurs very low. In fact, only 9% of respondents rated this question Good or Excellent. The other 91% gave a rating of Poor or Fair. This reveals that the Lake of the Ozarks region needs to strongly focus on creating new or perfecting existing programs that aim to train prospective entrepreneurs. One way to do this is through approaching regional community colleges like State Fair Community College and Ozarks Technical Community College. Survey respondents rated community colleges as very important in the region s ability to innovate. Nearly 94% of respondents rated community/technical colleges as somewhat important, important, or very important to the region s ability to innovate. Interestingly, older respondents viewed community/ technical colleges as more important than younger respondents. Survey participants were also asked the following open ended question to allow them to speak freely about their opinion of the Lake of the Ozarks region: Considering your entire regional business environment, please list and explain the most important regional issue or issues that should be addressed to improve your region's business climate and community Quotes Need to promote technical education and entrepreneurship The region lacks the ability to retain top talent creating a less educated, skilled and qualified workforce Page 33
36 Focus Group Two focus group sessions were performed to get a better understanding of the perceptions of stakeholders in the region and to listen to their recommendations. These focus group sessions took place on September 17, 2014 in Lake Ozark and September 18, 2014 in Camdenton at their Area Chamber of Commerce buildings. At the end of the focus group discussion we asked participants to list three recommendations for improving the entrepreneurial ecosystem in the Lake of the Ozarks region. Much like the respondents of the survey, focus group participants suggested emphasizing education and training as one of the most important tools to help current and future entrepreneurs. One of the focus groups recommendations was to connect technology and entrepreneurship in community colleges. There are a number of ways to explore this recommendation including expanding the technology related certificates at State Fair Community College and Ozarks Technical Community College, partnering with local industries to explore what technical skills they need from employees (this is explored in next section), and exploring the creation or expansion of community colleges in the region. Regional Priorities Education & training efforts Connect technology and entrepreneurship On the next page is a map of the state, which shows the location of every public two and four year college. There is a clear lack of four year colleges and only three identified two year colleges in the Lake of the Ozarks region. A long term strategy to help improve the region s ability to develop a pipeline of educated and skilled entrepreneurs could be to fill in the empty space of the map around the Lake of the Ozarks region with a new community college or satellite of an existing college. This will help both the residents of the LOCLG region as well as the adjacent communities to the west. Page 34


37 PUBLIC 2 AND 4 YEAR COLLEGES IN MISSOURI Source: Institute for Regional Innovation and Entrepreneurship (2014) 4 year college 2-year college/technical college Page 35
38 Data Support In order to better understand the foundation of education and training opportunities in the Lake of the Ozarks CLG region, several data resources were reviewed. These resources include jobs dynamics from NETS, cluster dynamics, and Innovation Index components. National Establishment Time Series The NETS data identifies employment trends in the educational services industry. This data (Appendix III) shows a positive trend of increasing jobs in the education sector. Between 2002 and 2013 the industry went from 3,461 jobs to 4,588 jobs, an increase of 1,127 jobs. The educational services industry includes jobs in elementary through tertiary educational institutions, technical and trade schools, and educational support services. The NETS data also provides a breakdown of jobs in the industry based on establishment size. This is important because not all relevant education may come from major institutions. Specialized education is often provided by smaller establishments, so looking at jobs based on establishment size is a good indicator of the variation of educational services offered. Of particular interest is the number of jobs from smaller establishments. Here, the data shows 13 self-employed and 128 jobs in 2-9 sized establishments by While this does show that smaller, and perhaps, more specialized educational service providers are present in the region, the numbers are still relatively low. Ensuring support for specialized education and training companies may help the region improve its human capital skills and knowledge base, which often translates into stronger GDP per capita. Cluster Dynamics The industry cluster data also has a section focused on education and knowledge creation. This data differs from the traditional industry data because it defines the sector in a different way. The education and knowledge creation cluster includes postsecondary educational services, as well as newspaper publishers, periodical publishers, book publishers, Internet publishing and broadcasting, and other information services. This way the data not only considers access to traditional education, but also indirect education that reaches the public through information sharing mechanisms. Looking at this industry cluster the data in Table 2.1 shows the location quotient (LQ) and employment for 2002 and While the LQ is less than 1, it has still shown a small increase by 0.05 over the time period. This indicates that regional employment in the cluster has improved relative to national employment. Actual employment in the cluster also shows a positive trend, increasing from 1,248 to 1,357, an increase of 109 jobs. The employment numbers are lower than what was found in the NETS data s industry section, because the cluster defines the industry using different parameters (see appendix IV for detailed industry cluster definitions). In addition to the overall regional education and knowledge creation cluster, the data in Table 2.1 also provides insight into each individual county. On a per county basis it becomes apparent that the majority of employment in this cluster stems from Miller County, which in 2012 accounted for 755 of the total regional employment. Miller County also showed the greatest level of improvement in both LQ and actual employment. Laclede County is second in terms of employment with 441 jobs in 2012, but both LQ and actual employment had decreased since The remaining two counties showed low employment and weak LQs. This indicates that the resources and assets relevant to education and knowledge creation are largely found in Page 36
39 Miller County, so for the other counties to benefit they must either invest more heavily in this area or pursue ways to collaborate with existing resources from Miller County. Table LOCLG - Education & Knowledge Creation Industry Cluster LQ2002 LQ2012 Change Emp.2002 Emp.2012 Change LOCLG ,248 1, Camden Laclede Miller Morgan Source: statsamerica.org Considering the two industry data tools together it becomes clear the educational industry has grown steadily for more than a decade and the region should consider this a very valuable asset to utilize in economic and entrepreneurial development efforts. Innovation Index The third data tool to look at when discussing the educational framework driver comes from the Innovation Index. Growth in the educational sector based on jobs is only one side of the issue. While access to educational services goes a long way in supporting an educated population, it is also important to look at the actual levels of educational attainment by the population. The data in Table 2.2 shows the Lake of the Ozarks CLG region is below state and national levels of educational attainment. While the percent of the adult population with some college or an associate s degree is on par with the national level, it is still slightly below the state level. The second component, percent of adult population with a bachelor s degree or higher, is far below the state and national average. For the purpose of measuring relevant educational attainment in the population, the data defines an adult as being between 25 and 64 years of age. Taking these two measures together it appears that the adult population in the region is somewhat undereducated. While not all entrepreneurs need formal education to succeed, the lack of a highly educated population becomes problematic when support resources are negatively affected. Entrepreneurs must utilize many support services to run their ventures successfully and these typically require a higher degree of formal education. For example, access to accountants, lawyers, human resource specialists, industry experts, etc. Table LOCLG - Educational Attainment Percent of Adult Population with some college or an Associate s Degree, 2012 Percent of Adult Population with a Bachelor s Degree or Higher, 2012 LOCLG 30.7% 16.9% Missouri 31.8% 28.0% U.S. 30.0% 30.2% Source: statsamerica.org Page 37
40 To gain even more insight into the educational attainment levels in the region, educational attainment has been analyzed over a time period (Tables 2.3 and 2.4). The time period selected for this is 2007 and Using a relatively short time frame should help indicate whether or not the new adults that grew into the age bracket between 2007 and 2012 are adding more educational attainment to the population or less, and whether or not the old adults who grew out of the age bracket over the time period were pulling the percentages down. In other words, if the 20 to 24 year-olds in 2007, who by 2012 were included in the data, were achieving higher levels of education it should increase the overall average for the age bracket. On the opposite end, if the year-olds in 2007, who were out of the age bracket by 2012, were less educated it should also increase the overall average for the whole age bracket. This means that if the educational attainment rates go up it must be caused by either one or both trends. Additionally, county level data has also been identified to determine what, if any, variation there might be between the counties. Looking at the data in Table 2.3 and 2.4 it becomes apparent that for the region as a whole both actual numbers and relative numbers (percentage) of educational attainment levels have improved. This is true for both adults with some college or an associate s degree and adults with a bachelor s degree or higher. However, Laclede County experienced a decline in both actual and relative numbers of adults with some college or an associate s degree, even though the population grew. The good news is that this might have been caused by the strong increase in adults with a bachelor s degree or higher. In other words, it appears that more people completed their bachelor s degree by 2012 than had done so in The only county to experience a decrease in both actual and relative number of adults with a bachelor degree or higher was Morgan County. While the adult population decreased a little bit, the relative number of adults with a bachelor s degree declined more. The situation Morgan County is experiencing is called a brain drain, which means that the most educated members of the workforce are moving away to areas that have jobs that can support their newly acquired educational skills. This is an issue that should be considered by the Lake of the Ozarks CLG region. Overall, it appears that Camden and Miller County improved the most on both measures, with both actual and relative increases in the educational attainment levels of the 25 to 64 year olds. Table LOCLG - Adult Population with some College or an Associate s Degree Pop. age with some college or an associate s degree % Pop. age with some college or an associate s degree % LOCLG 62,270 17, % 64,017 19, % Camden 21,097 6, % 22,923 8, % Laclede 18,090 5, % 18,290 4, % Miller 12,958 3, % 12,755 3, % Morgan 10,125 2, % 10,049 2, % Source: statsamerica.org Page 38
41 Table LOCLG - Adult Population with a Bachelor s Degree or Higher Pop. age with bachelor s degree or higher % Pop. age with bachelor s degree or higher % LOCLG 62,270 9, % 64,017 10, % Camden 21,097 3, % 22,923 4, % Laclede 18,090 2, % 18,290 2, % Miller 12,958 1, % 12,755 1, % Morgan 10,125 1, % 10,049 1, % Source: statsamerica.org Beyond having an educated population to ensure a strong pipeline of educated and skilled entrepreneurs, change in the young adult population also plays an important role. For the Lake of the Ozarks CLG region to be able to invest in its workforce and entrepreneurs there must be a pool of human resources to educate and train. These should preferably be young adults who stay in the region or who relocate to the region from other areas of the country. Fast-growing populations can be signs of innovative economies. High population growth rates result from strong labor markets with growing opportunities. Geographic regions with struggling economies often experience population declines, especially among younger age groups. Research shows that this indicator has a significant effect on GDP per worker growth. Figure Percent Change in Young Adult Population, % -0.5% -0.2% -0.5% -0.4% -0.3% -0.1% 0.0% LOCLG MO. U.S. Source: statsamerica.org Page 39
42 This data in Figure 2.3 examines the changes in young adult populations between 1997 and For the purpose of this analysis, a young adult is defined as someone between the ages 25 and 44. This is the main age group needed for a region to stay competitive in the present and future. It s also the first age group to move away when a region can no longer offer attractive amenities and opportunities. While the state of Missouri experienced a significant decline of -0.5% in the young adult population, the decline in the Lake of the Ozarks CLG region was similar at -0.4%. This translates into approximately 1,787 fewer young adults in 2012 than in Part of this may be explained by an aging population, but the relatively high rate still indicates some more fundamental problems with the region s ability to keep the young adult population interested in working and residing in the region. Looking at each county by itself the data shows that Miller and Morgan counties experienced the worst declines, while Laclede County was slightly better at -0.3%, and Camden County experienced almost no loss of young adults with -0.1% change. Camden County s relatively low decline may be contributed, in part, to stronger educational attainment and income levels. In other words, the economic environment in Camden might be stronger than the surrounding counties, which leads it to be more attractive for educated young adults and allows for better job opportunities. Table LOCLG - Young Adult Population Trends Percent Change in Young Adult Population, LOCLG -0.4% Camden -0.1% Laclede -0.3% Miller -0.8% Morgan -0.8% Source: statsamerica.org An additional factor to consider is the job growth-to-population growth ratio. Measuring job growth relative to population growth indicates whether or not a region is creating jobs faster than the population is changing. A value above 1 indicates that job opportunities are growing faster than the rate at which people are populating the region. Put differently, if a region is able to add jobs at a fast rate it signifies that the availability of skills and knowledge is increasing. As Figure 2.4 shows, between 1997 and 2011 the Lake of the Ozarks CLG region experienced a job growth-to-population growth ratio equal to This should translate into roughly only 1 additional jobs for every 9 additional residents in the population from 1997 to This is by no means a positive trend for the region. A growing population should be followed by a growing number of jobs, so for the region to only add 1 additional job per 10 additional residents is a problematic trend. In actual numbers, the region added 2,248 jobs, while it grew by 20,121 residents from 1997 to The data used on this measure is based on Bureau of Economic Analysis employment data and Census population numbers, which is why the number of jobs differs slightly for the NETS data. Page 40
43 Figure Job Growth-to-Population Growth Ratio, LOCLG MO U.S. Source: statsamerica.org Looking at the job growth-to-population ratio in each county in Table 2.6, the variation among the counties ranges from to A difference between the counties this large deserves additional attention. Miller had the lowest ratio at -0.67, which was caused by a decline in jobs while the population grew. The same was true for Morgan and Laclede counties, at and respectively. The only county to pull the regional ratio up was Camden, with a ratio of 0.51, or 1 new job per 2 new residents. In actual numbers, Camden County added 5,298 additional jobs while the population grew by 10,352. Table LOCLG - Job Growth-to-Population Growth Ratio ( ) Additional jobs from 1997 and 2011 Additional residents from 1997 to 2011 Job Growth-to- Population Growth Ratio LOCLG 2,248 20, Camden 5,298 10, Laclede , Miller -1,547 2, Morgan -1,023 2, Source: statsamerica.org Beyond considering job and population growth, it is also important to consider migration trends. By expanding employment opportunities, highly innovative economies are more likely to attract new residents compared to economies that are less innovative. This variable shows the average net internal migration per 10,000 residents between 2000 and The term, internal migration, refers to migration within the United States. A positive value means more people moved to a geographic region from other regions in the U.S. than to those who moved away. Since only internal migration within the US is considered, the national value will be zero. Page 41
44 Figure 2.5 shows that between 2000 and 2012, the Lake of the Ozarks CLG region experienced an annual average net inflow of residents at a rate of 43.7 residents per 10,000 people in the total population. This average net migration rate is much higher than the comparable rate for the state of Missouri, which experienced an inflow of 1.8 residents per 10,000 people in the total population. Figure Average Net Internal Migration Rate per 10,000 Residents, LOCLG MO U.S. Source: statsamerica.org As Table 2.7 shows, the variation in internal migration among the counties is quite large, but positive for all counties. Camden County had the highest average of 66.6, followed by Morgan County at Laclede and Miller counties had averages of 33.3 and 25.0, respectively. Overall, this indicates good population trends for the region, but as the data showed earlier these population growth trends have not translated into much economic growth through more jobs. Table LOCLG - Average Net Internal Migration Rate per 10,000 Residents ( ) Average Net Internal Migration Rate LOCLG 43.7 Camden 66.6 Laclede 33.3 Miller 25.0 Morgan 38.6 Source: statsamerica.org Page 42
45 Developing a Pipeline of Educated and Skilled Entrepreneurs Summary The results from the survey and focus group combined with the data shows that the region has both strong building blocks and challenges with respect to developing a pipeline of educated and skilled entrepreneurs. Ensuring access to education and training opportunities for entrepreneurs and the workforce is something residents in the region know must be invested in. The educational attainment data indicates an overall improvement in this area, but the region must continue to invest in improved access and quality of education and training opportunities. The biggest challenges appear to be the decline in young adults and lack of job growth. The summary matrix below provides a snapshot for regional stakeholders to view this driver s key strengths, challenges, and opportunities. These will help guide the analysis towards the final recommendations discussed in the recommendations section starting on page 78. A list of existing public education and training providers in the region is provided in Table 2.8. Strengths Access to education and training is viewed as an important factor for regional development (P ). Growth in educational services industry (P. 36). Miller County shows strongest growth in education and knowledge creation cluster (P ). Overall increase in higher educational attainment levels (P ). Camden shows strongest trend of increase in educational attainment levels (P ). High net internal migration rate (P ). Challenges Negative perception of effectiveness of the region s training programs (P. 33). Lack of higher educational institutions in the region (P ). Laclede and Morgan counties shows slight decline in the education and knowledge creation cluster (P ). Low levels of current higher educational attainment throughout the region (P.37-39). Decline in young adult population (P ). Low/negative job to population growth ratio in Laclede, Miller, and Morgan counties (P ). Opportunities Provide specialized and technical education and training opportunities to under/ unemployed. Entrepreneurship in school curriculums (start early!). Utilize existing programs such as Junior Achievement. Continue to improve access to higher education through remote learning opportunities such as satellite campuses, and/or online classes. Expand investments in amenities directly focused on keeping and attracting young adults to the region. Page 43
46 Lebanon Career Center Linn Creek Career Center Table LOCLG - Public Education and Training Service Providers Name Address Phone Lake Career Technical Center 2639 South Jefferson Avenue Suite 1, Lebanon, MO Business Park Road, Linn Creek, MO Dare Boulevard, Camdenton, MO (417) (573) (573) Eldon Career Center 112 South Pine Street, Eldon, MO (573) State Fair Community College - Osage Beach State Fair Community College - Versailles Ozarks Technical Community College - Lebanon State Technical College of Missouri Stone Crest Mall, 3797 Osage Beach Parkway, Osage Beach, MO West Newton Street, Versailles, MO Highway Mm, Lebanon, MO One Technology Drive, Linn, MO (573) (573) (417) (573) Page 44
47 Cultivating Technology Exchange and Innovation Economic success is often driven by our ability to develop new products and services that meet real market demands. For this to take place there needs to be an underlying foundation from which entrepreneurs, businesses, and innovators can build. This is often achieved by creating platforms that encourage knowledge and idea sharing. To assess this component, questions were identified in the survey, as well as specific feedback from the focus group dealing directly with such issues. To further support these results, multiple factors from the data tools were used to shed light on how well the region is doing with respect to fostering technology based job opportunities and ensuring modern infrastructure is available. The outcome from this framework driver will guide the discussion of relevant recommendations in the final section of the report. Survey The survey asked participants to rate the availability of information technology professionals in the region. Overall, respondents rated this question fairly low, but there were some differences in opinion. For example, a majority of respondents who work in Miller County rated the availability of IT professionals as Good, while the majority of residents in other counties rated the availability as Fair. It is also worthy to note that younger survey respondents (under 50) rated this question much higher than older respondents. Although it was mentioned in the previous section that the region does not have a locally controlled higher education institution, there are a number of opportunities for individuals in the region to learn new technical skills. Ozark Technical Community College, for example, has a location in Lebanon that provides one year certificates in manufacturing technology and industrial maintenance technology as well as an Associate of Arts in Technology. State Fair Community College has locations in Eldon and Lake of the Ozarks, where they have many technology-focused certificates and degree programs including Welding Technology, Construction Technology, Computer Information Systems, and even Solar Electric Installation. The importance of these types of programs is supported by a series of forums conducted in the fall of 2008 by the Center for Workforce Development at the Ozarks Technical Community College. Links to these reports are provided at the end of appendix II, but below are a number of key highlights from the reports: All 5 industries (construction, manufacturing, transportation, tourism, and healthcare) listed availability of a skilled workforce among their top three industry challenges Construction industry highlighted their biggest trade skills need in electrical, mechanical, carpentry, plumbing, and masonry Manufacturing industry named welders, grinder, draftsmen, engineers, and maintenance as their largest skill shortage Healthcare industry has the most severe employment shortage in nurses, pharmacists, and physicians Page 45
48 Focus Group The two focus groups conducted in Lake Ozark and Camdenton revealed internet broadband access as a concern for the region and its ability to cultivate technology exchange and innovation. Focus group participants suggested the region invest more to expand broadband access, particularly to the areas that are falling behind. The focus group s perception of the weakness of broadband access matches up with the data. The region lags the state and national average in broadband access. To continue to fall behind the rest of Missouri and the rest of the country in broadband access is analogous to only having dirt roads for transportation while everyone else has access to interstate highways. The solution for this problem is one that involves significant public-private cooperation and an acknowledgement that internet access is becoming less of a luxury and more of a public good similar to roads, bridges, and education. One opportunity in the region is Camden County, where broadband access per 1,000 residents is as high as the state and national average (see figure 3.1 and table 3.2). Given that the Internet has become an indispensable tool for realizing a range of human rights, combating inequality, and accelerating development and human progress, ensuring universal access to the Internet should be a priority for all States. - United Nations Report of the Special Rapporteur on the promotion and protection of the right to freedom of opinion and expression, Frank La Rue Data Support There are many ways a region can support the facilitation of technology exchange and innovation. To better understand how the region is currently doing with respect to this driver, a series of data tools can be utilized. However, it should be noted that when discussing technology exchange and innovation it is necessary to look beyond the obvious tech industry, and instead spread a wider net that considers multiple aspects of technology and innovation. Therefore the data considered relevant for this driver will at times look at factors other than just high-tech areas. National Establishment Times Series The first step when looking at industry data is to identify areas of high job growth. While job growth does not equal technological development or innovative activity by itself, it does give an indication of where it might be most likely for these things to be fostered. Between 2002 and 2013 the biggest job creating industries related to technology and innovation were Public Administration at 2,053 jobs, Educational Services at 1,127, and Professional, Scientific, and Technical Services at 284 jobs. It is important to note that educational services was among these because technological development and innovation is often developed through collaboration between public (educational institutions) and private enterprises. For the region to see growth in this industry is a good indicator. Job growth in the Public Administration sector may not typically be considered relevant to technological development and innovation, but the reality is that a lot of jobs in this industry are related to administering public programs and efforts that affect both residents, but also the private business environment. More jobs in this industry Page 46
49 may provide better chances of providing better quality services to a wide variety of people in the entrepreneurial ecosystem. The growth in the professional jobs sector includes employment in such areas as engineering, graphic design, computer programming, marketing, consulting, research and development, and many more. These are all areas where companies often compete by developing and implementing better innovation solutions (often driven by technological advances). While these industries are not necessarily the typical tech/innovation industries, the fact that they are growing and creating jobs is what makes them important. When the human resources in an industry grow, and presumably the talent and skills improve, the odds of new ideas being developed and implemented increases. No guarantees can be made, but through concerted efforts by public and private entities it may be possible to provide relevant support. Cluster Dynamics Beyond looking at industries with high potential for technology exchange and innovation, a more detailed look at specific growing industry clusters is identified in Table 3.1. This will provide insights into areas where the region may be able to foster a competitive advantage based on technological development and innovative activities. It is therefore relevant to look at all growing industry clusters, as well as clusters that typically rely on some level of innovative activity. The advanced materials industry cluster is considered both because it has grown in terms of employment and because it includes a lot of specialized manufacturing areas that typically serve as strong foundations for innovative developments. This industry cluster includes companies working in such diverse fields as basic chemical manufacturing, plastic manufacturing, steel product manufacturing, machine shops, fiber optic cable manufacturing, and many more. However, all of the growth in the advanced materials industry cluster can be attributed to Laclede County. Camden, Miller, and Morgan counties actually saw slight declines in employment in this cluster. The agribusiness industry cluster is important because of its role in the regional economy and because it is an industry with enormous potential for innovative technology development. Innovations in agriculture can include precision farming and crop technology. Precision farming is bringing big data into the industry at a fast pace. Crop technology will continue to focus on creating high resistant seeds. In other words, the agribusiness industry cluster is taking advantage of technological advances and will continue to do so. The challenge is that this cluster experienced a decline from 2002 to 2012 in terms of employment. The only county to add jobs was Morgan, albeit only a small increase of 37. The biomedical/biotechnical industry cluster also plays an important role in the regional economy, in part because of the growing demand for medicine and treatment options in an aging population. This industry cluster includes firms operating in medicine manufacturing, laboratory instrument manufacturing, health and personal stores, and more. While each of the counties experienced growth in employment in this industry cluster, roughly 79% of the current total employment is in Camden and Laclede counties. The education and knowledge creation cluster provides an important input into today s information and knowledge driven economy, where more and more firms rely on up to date information to stay competitive. This cluster includes tertiary educational institutions, specialized training, newspaper publishers, book publishers, and internet publishers and broadcasting. Roughly half of the employment in this cluster is found in Miller County, with Page 47
50 Laclede in second. Camden and Morgan counties show very little employment data in this cluster. The IT and telecommunications cluster is important because it provides much of the foundation for higher level innovation to occur. This cluster includes computer equipment manufacturing, electronic component manufacturing, software publishers, data processing services, and many more tech-based industries. Unfortunately the IT & telecommunications cluster appears not to have been thriving in the Lake of the Parks CLG region. The majority of loss in employment stems from Laclede County, which declined by 991 jobs from 2002 to However, half of the current jobs are still found in that county, while the other counties have shown no growth in the cluster either. The primary metal manufacturing industry cluster is part of the manufacturing supercluster, so it only considers employment directly in the primary metal manufacturing industry. While the region does not show a high number of employment, with only 334 in 2012, the fact that is has grown in actual employment and the LQ, indicates that there could be a strong foundation for future development in this area. The key is to identify the relevant businesses, what their experience and knowledge level is, and what specific challenges and opportunities they see in the near and long term future. Roughly two thirds of the employment is in Laclede County, and the remaining one third is in Morgan County. See appendix IV for more detail on both county level data and definitions of industry clusters. Table LOCLG - Tech and Innovation Driven Industry Clusters LQ2002 LQ2012 Change Emp Emp Change Advanced materials Agribusiness, food processing & technology , Biomedical/biotechnical ,061 3, Education & knowledge creation ,248 1, IT & telecommunications , ,225 Primary metal manufacturing Source: statsamerica.org Innovation Index The third data source to consider with respect to technology exchange and innovation factors is the Innovation Index components. The index identifies multiple aspects of regional innovative capacity based on trends and patterns in technological areas. Among these are how well the region is doing with respect to ensuring Internet access to the population, patent activity, and employment in tech-based and high-tech industries. The first consideration focuses on broadband access. Broadband density refers to the level of Internet access in the region. Internet accessibility is generally considered important in fostering entrepreneurship and innovation because it provides access to information, knowledge, ideas, broad communication, and e-commerce, as well as serve as the most effective and efficient marketing tool for low budget entrepreneurs. There are two measures, Page 48
51 both from the Federal Communication Commission (FCC), to gauge Internet usage. One measure is the level of Internet penetration, or broadband density. This measure is residential broadband fixed connections per 1,000 households in The second measure is a proxy for the rate of Internet adoption. This indicator is defined as the change in the number of broadband providers available to residents in a given county from 2000 to Figure Broadband Density, 2012 Figure Average Annual Percent Change in Broadband Providers, % % % % 7.5% 15% 22.5% 30% LOCLG MO. U.S. Source: statsamerica.org LOCLG MO U.S. As Figures 3.2 and 3.2 show, broadband density in the Lake of the Ozarks CLG region is somewhat behind Missouri and national levels. The region has also been lagging behind on seeing new implementation for broadband providers, causing it to fall behind on overall accessibility. However, it should be noted that Camden County shows very strong data on both of the measures, while the remaining three counties are the ones lagging behind overall. One of the biggest concerns with low internet access is that today more and more commerce relies on using the internet as a means for communication and transactions. Table LOCLG - Broadband Trends Broadband Density, 2012 Average Annual Percent Change in Broadband Providers, LOCLG % Camden % Laclede % Miller % Morgan % Source: statsamerica.org Page 49

52 The next factor related to technology exchange and innovation is the share of technology-based knowledge occupations present in the region. Technology-based knowledge occupations are defined by six occupation clusters, which include information technology; engineering; health care and medical science practitioners and scientists; mathematics, statistics, data and accounting; natural science and environmental management; and postsecondary education and knowledge creation. Occupations within these categories require significant human capital investment and have a higher propensity to be involved with the development of innovations. Figure Technology-Based Knowledge Occupations Share of Total Employment, % 12% 12.2% 0% 4% 8% 11% 15% LOCLG MO U.S. Source: statsamerica.org The Lake of the Ozarks CLG region shows smaller than the state and national averages for technology-based knowledge occupations. Figure 3.3 shows that in 2011 these occupations represented 10.6% of overall employment in the region. However, this is still a relatively strong share within an area such as the Lake of the Ozarks CLG region. The county data shows that Camden, Miller, and Morgan counties have the lowest shares ranging between 9% and 9.6%, while Laclede is higher than both state and national average shares with 12.9%. The higher share in Laclede County might be explained, in part, by its relatively high employment in the IT and communication industry cluster. Lastly, technology exchange and innovation is affected by high-tech employment and the rate at which the employment share is growing. High-tech sectors require educated and skilled workers. Innovative economies with significant endowments of human capital are expected to have a larger share of employment in high-tech sectors. Research shows that hightech firm employment and growth is overwhelmingly found in urban centers, leaving a technology gap between rural and urban areas. The high-tech sector is defined by Moody s as comprised of such industries as telecommunications, internet providers, computer manufacturing, and scientific laboratories, to name a few. This variable measures the average high-tech employment share in the region. The average share of high-tech employment from 1997 through 2012 was 1.7% in the Lake of the Ozarks Page 50

53 CLG region, which was much smaller than both Missouri and U.S. averages. At the county level (appendix VI), only Morgan County stands out for having a lower share of high-tech employment with only 0.9%, while the remaining three counties range between 1.6 and 1.8%. Figure Average High-Tech Employment Share, % 3.7% 4.7% 0.0% 1.3% 2.5% 3.8% 5.0% LOCLG MO U.S. Source: statsamerica.org Developing and supporting high-tech employment opportunities in rural regions is difficult for many reasons, some of them being related to lack of resource inputs such as tech-talent, existing tech-based companies, technology infrastructure, and tech-focused education. Hightech companies also tend to establish their core functions (e.g. HQ, R&D, employee training facilities) in or close to areas with existing technology clusters such as Silicon Valley, Boston, New York, or more recently St. Louis. This makes it harder for rural communities to attract hightech resources from the outside, so they may be forced to foster their own internally grown hightech community. Just as having a strong pool of technology workers available is essential, it is also important to consider the growth in actual employment related to high-tech industries. A high level of growth in high-tech employment is a good indicator of how well a region had done with respect to creating jobs related to developing and implementing new technologies, and thus how innovative it is. Research shows this indicator has a significant effect on GDP per worker growth. The variable measures the average annual change in these jobs from 1997 to The data in Table 3.3 shows that the Lake of the Ozarks CLG region had a very high rate of change at 4.3%, compared to 0.5% at the state level and -0.1% at the national level. From the perspective of each individual county, Miller County had the highest rate of change at 5.6% and also the highest share by 2012 at 2.3%. The lowest rate of change was found in Morgan County with 2.8% and by 2012 the total was still only at 0.9%. With such a high degree of variation between the counties it is important to avoid trying to implement a one-size-fits-all solutions, but rather focus on providing the needed resources and support to those counties struggling while giving attention to more pressing matters in those counties where the change in high-tech is thriving. Page 51
54 Table LOCLG - High-Tech Employment High-Tech Employment Share, 1997 High-Tech Employment Share, 2012 Average Annual Percent Change in High-Tech Employment Share, LOCLG 1.0% 1.9% 4.3% Camden 1.0% 2.1% 4.9% Laclede 1.2% 1.8% 3.1% Miller 1.0% 2.3% 5.6% Morgan 0.6% 0.9% 2.8% Missouri 3.6% 3.9% 0.5% U.S. 4.8% 4.7% -0.1% Source: statsamerica.org Cultivating Technology Exchange and Innovation Summary Determining which technological advances and innovations in which to invest can be very challenging, especially when new technological developments arrive at a staggering speed. Communities benefit from investing in technology-focused industries, regional broadband access, and support resources relevant to cultivating technology exchange and innovation, especially when building on current strengths and opportunities. Part of the challenge lies in understanding that technological developments and innovation can come from a wide range of industries, not just the traditional tech industry. Advances in health care, biomedical, manufacturing, and education industries are often driven by technology and innovation. On the other hand, it should also be noted that a strong foundation for technology and innovation-based developments must be cultivated through efforts such as ensuring high-speed internet access to the vast majority of the region s residents and businesses. Furthermore, educational and training institutions need to understand the importance of teaching the role of technology and innovation across all fields of study. Existing companies in manufacturing fields should be supported by identifying manufacturing extension centers, manufacturing networks, and collaboration between regional and state companies. These, and more, efforts are needed to ensure strong advancement in the technology and innovation area. The summary matrix below provides a snapshot for regional stakeholders to view this driver s key strengths, challenges, and opportunities. These will help guide the analysis towards the final recommendations discussed in the recommendations section starting on page 78. Page 52
55 Strengths Increase in Public Administration, Educational Services, and Professional, Scientific & Technical Services industries (P ). Growth in Advanced Materials and Biomedical/Biotechnical industry cluster (P ). Small growth in Primary Metal Manufacturing industry cluster (P ). Challenges Decline in Agribusiness, food processing & technology industry cluster (P ). Decline in IT & telecommunications industry cluster (P ). Low broadband access in Laclede, Miller, and Morgan counties (P ). Low share of high-tech jobs (P ). Strong broadband access in Camden County (P. 49). High share of tech-based jobs in Laclede County (P. 50). Opportunities Invest in stronger broadband access in low access counties. Review statewide and regional plans to identify potential support and collaboration for broadband deployment initiatives at Leverage increase in technology and innovation based industries to promote more techfocused job development. Form a network of manufacturers in flexible manufacturing. Promote collaboration between public administration, educational institutes, and private sector growth industries. Update survey study done in 2008 on an annual basis to track changes in specific education and training needs within the workforce. Page 53
56 Page 54
57 Improving Access to Capital One of the biggest challenges facing new startups and small growth firms is how to finance their ventures. This is particularly true in today s economic environment where banks are more conservative in their lending policies. In other words, the requirements that must be met to borrow money for risky investments, like financing a startup, are more difficult to meet today than they were in the past. But considering the fact that it is precisely the small growth firms that create most jobs in the country, the importance of ensuring access to capital has never been more relevant. Relevant questions from the survey, as well as feedback from the focus group is used to highlight some of the regional challenges related to this driver. Data from other tools is used to emphasize the role of capital in the region s entrepreneurial ecosystem. Survey Access to capital was a major emphasis in the survey and is an important aspect of the region s entrepreneurial ecosystem. The survey revealed that banks are perceived as doing a fairly good job of providing capital to entrepreneurs. 30% of respondents said the availability of capital from banks is Good, 52% of respondents rated the availability as Fair, and 18% rated the availability as Poor. Survey respondents rated the availability of risk capital from investors very low. 10% of respondents rated risk capital from investors as Good, 54% rated it Fair, and 36% gave a rating of Poor. Unfortunately, in both the case of risk capital from investors and capital from banks not a single respondent gave a rating of Excellent. The survey also asked respondents to rate how important a number of entities are to their region s ability to innovate in the future. The survey indicates that residents of the Lake of the Ozarks region feel that banks, angel investors, and venture capital firms are all very important to the region s future prosperity. 98% of respondents rated banks as somewhat important, important, or very important to the region s ability to innovate. Venture capital firms and angel investors were rated somewhat important, important, or very important by 92% and 93% of respondents, respectively. This shows there is a great deal of agreement among respondents as to focusing on increasing capital availability as a high priority for the region. One of the financing resources made available in the region through the Lake of the Ozarks CLG is a Certified Development Company (CDC) with a 504 loan program. The CDC s name is Central Ozarks Development, Inc. and is located in Camdenton. The 504 loan program is regulated by the U.S. Small Business Administration and is intended to provide financing opportunities for small businesses. Money from a 504 loan can be used to help finance a variety of activities including purchasing land or buildings, investing in improvements to utilities, streets, parking lots, and landscaping, and construction of new facilities or renovation of existing facilities. This also means that the money may not be used to finance inventory, repaying other debts, or investment in rental real estate. Another financing resource in the region is a Revolving Loan Fund (RLF) which is made available through the Lake of the Ozarks Council of Local Governments and the Central Ozarks Development, Inc. Businesses eligible for use of the RLF must located in one of the region s four counties. Page 55
58 Table 4.1 provides a brief overview of the number of bank offices in each county along with the total deposits. This is highlighted to help provide an overview of where most traditional banking resources are located in the region. Table Regional Banking Information County Number of Regional Offices Deposits ($000) Camden County ,980 Laclede County ,529 Miller County ,272 Morgan County ,434 Source: fdic.gov Focus Group The focus group advised concentrating on small business loan funds as a great tool to help small businesses in the startup and expansion phase. While the region already has existing loan funds, the 504 program and the revolving loan fund, partnerships with additional organizations could help the region increase its accessibility to risk capital. One of the organizations that could be a potential partner for the region is Justine PETERSEN. The company has six loan products in their portfolio and could be a valuable partner for the region to increase the number of lending opportunities for entrepreneurs and small businesses. Loan funds are a good form of risk capital to fill gaps in bank lending once the project has reached the banks risk threshold. But, there are other gaps that exist for businesses that have ideas with great potential but don t have the ability to borrow. One solution for these types of problems is risk equity and one way to organize it is through access to angel investors. The focus group identified creating or partnering with an organized investor network as key to the region s ability to attract (and keep) high growth potential enterprises. A group of angel investors is beneficial because it standardizes the process, increases deal quality and flow, and is a great networking opportunity with both angel investors in your region and other groups across the nation. Angel Capital Association is an industry alliance of over 100 angel investor groups that offers resources and training for groups of individuals interested in starting their own angel investor group. There are dozens of groups in the Midwest including two in St. Louis, two in Kansas City, and one in Columbia. The Lake of the Ozarks close proximity to the angel network in Columbia creates a unique opportunity for learning and even as a possible financing source. Data Support Analyzing market factors related to access to capital in the region can provide a better understanding of the challenges faced by economic developers, business owners, and entrepreneurs. This is done using various data tools identifying industry and cluster trends, as well as looking at general economic factors. Page 56
59 National Establishment Times Series The first data tool looks at job trends in the finance and insurance industry, which is a good indicator of how well the region is doing with respect to providing financial instruments to support the region s residents and businesses. A growing number of jobs in this industry can be taken as a positive indicator of the region being able to better meet the demand for regional capital needs. The finance and insurance industry includes jobs in monetary authoritiescentral banks, credit intermediation and related activities, securities, commodity contracts, and other financial investments and related activities, insurance carriers and related activities, and fund, trusts, and other financial vehicles. The jobs data in this industry from 2002 to 2013 shows a substantial increase of 424 jobs, going from 1,464 jobs in 2002 to 1,888 jobs in It is notable that almost all of the job increase occurred from 2002 to 2007 after which it has been relatively stable, with a minor drop around 2009 during the recession, followed by a small increase in recent years. Beyond looking at just the total number of jobs it also pays to consider job trends based on establishment size. From this data the hope is to find a good balance between bigger and smaller establishment sizes. Bigger banks and insurance companies are important when entrepreneurs and larger companies are focusing on large scale initiatives that require a lot of investment and backing. Smaller banks and insurance companies are important when new and small businesses are trying to establish themselves and/or grow, in which case smaller and more local financial institutions tend to be helpful resources for capital needs. Here the data shows an almost even distribution between establishments with 2-9 employees and establishments with employees. In other words, there are clearly both small and mediumsized financial and insurance institutions in the Lake of the Ozarks CLG region. There is also a large financial and insurance company that employs approximately 100 people. Cluster Dynamics While the finance and insurance industry as a whole shows a positive trend with respect to job creation, the next step is to look at the industry from a cluster perspective. Using industry cluster data the cluster identifies the LQ and employment in business and financial services. The description of this cluster includes a broader view of the industry than the traditional industry approach used in the NETS section. Here the industry cluster includes private employment in internet services providers, data processing services, non-depository credit intermediation, securities, commodity contracts, and other financial investments and related activities, insurance carriers, funds, trusts, and other financial vehicles, legal services, accounting, tax preparation, bookkeeping, and payroll services, among others. While all of the areas do not directly deal with access to capital, most of them at least have some indirect influence. For example, legal services are often needed to ensure proper contracts are written between lender and borrower. Tax services are also needed to ensure proper tracking and filing of business financial activities. Looking at the Lake of the Ozarks region s business and financial services cluster the data shows a weak LQ, with barely any change between 2002 and This indicates a somewhat stagnant industry cluster that has not developed much over time. The employment data is a little better with an increase of 21 jobs, going from 1,224 in 2002 to 1,245 in So while the region does not appear to have a strong foundation for creating a competitive advantage in this industry cluster, at least it plays a significant role in employing the population. Page 57
60 Considering the business and financial industry cluster on a county by county basis the data shows some variation between counties. The only county to show improvement in LQ was Miller County, which increased by The highest LQ was found in Camden County at 0.47, despite having decreased by Camden County was also the biggest cluster in terms of employment at 667 employees in Overall, this cluster does have some significant employment numbers, which indicates a healthy foundation for the entrepreneurial ecosystem with respect to having access to financial resources. At first glance it appears problematic that the LQ for this industry is so low, but it is fairly common for non-metro regions to have LQ s below 0.5 in this cluster. Table LOCLG - Business and Financial Services Industry Cluster LQ2002 LQ2012 Change Emp.2002 Emp.2012 Change LOCLG ,224 1, Camden Laclede Miller Morgan Source: statsamerica.org In addition to the industry cluster tool, the finance industry can also be viewed from a traded vs. local cluster perspective. This data indicates how much of the industry that deals with financial transactions that goes beyond the region (traded) and how much only impacts the local market. Establishments included in the financial services traded cluster are involved in aiding the transaction and growth of financial assets for businesses and individuals. These firms include securities brokers, dealers, and exchanges, credit institutions, and financial investment support. Insurance firms are located in a separate Insurance Services cluster. Establishments included in the local clusters are ones that facilitate financial transactions for both businesses and individuals, such as deposit-taking institutions, third-party administrative services for pension and welfare funds, insurance agencies, tax preparation services, and payment collection agencies. The data on these two measures show that the majority of jobs, approximately 76%, in the financial sector are found in local cluster establishments. The data also shows an increase of 97 employees in the traded financial services cluster, while employment in the local financial cluster had a small decrease of 24 employees from 2004 to The implication of this is that more financial business is done with entities outside of the region, which might be taken as a positive development. Having financial expertise on a broad geographical scope can help a region leverage money from across the state and country, as well as help establish larger networks that can improve access to financial resources for regional entities. Page 58
61 Table LOCLG - Financial Services Employment 2004 Employment 2008 Employment Change Traded Local 1,052 1,101 1, Source: clustermapping.us When taken together, the NETS data, the industry cluster data, and the traded vs. local cluster data, it appears that the Lake of the Ozarks CLG region has a decent foundation of financial institutions, which is a good sign. However, it does not look as if the financial market has grown much which could be problematic in the long run. Innovation Index Lastly, it is important to look at more alternative measures of access to capital. The existence of private investors or venture capital groups is important when looking at access to risk capital, which is often harder to obtain than traditional banking sources. Furthermore, while it is not typical to consider a private individual s income as a source of market capital, it should still be discussed in the context of market health and small investment opportunities. Similarly, changes in proprietor s income can be considered an indicator of potential reinvestment capital. When proprietors (business owners) make more money they will not only be able to buy more from other businesses (good for the regional economy), but they will also be able to invest in their own business as well as new business opportunities. The challenge is that the Lake of the Ozarks CLG region sees no venture capital invested in the region. There are also no identifiable angel investor groups in the region. In other words, there appears to be no formal investor groups investing money into new or growing ventures. There may be private investors throughout the region, but these are difficult to identify and tend only to invest within the primary network and regional boundaries. This may be seen as a sign that the area is not being considered attractive by big investors. However, an area can still have a thriving entrepreneurial culture without much interest from big outside investors, provided there are other local sources for entrepreneurs to finance their ventures. Three such indirect sources are per capita personal income, wage and salary earnings, and proprietor s income. Looking at these numbers in Tables it becomes clear that on all measures the Lake of the Ozarks CLG region is low compared to state and national levels. But this is not necessarily what matters the most, because the overall cost of living is also lower in the region, which balances out at least some of the difference between the region, state and nation. What is more important is the rate of change in the three measures. If the region is growing faster than the state and/or nation it can be considered a strong measure of positive economic development. The rate of change, or percent change, is relatively strong on two measures, per capita personal income and average wage and salary earning. Change in average proprietor s income on the other hand is somewhat low compared to both state and national change. Overall, it is good news the region is improving with respect to personal and salary income measures, but the low rate of change in proprietor s income could be a sign of a struggling business environment. Page 59
62 Table LOCLG - Per Capita Personal Income (indirect measure of potential investment capital) Per Capita Personal Income, 1997 Per Capita Personal Income, 2011 Percent Change in Per Capita Personal Income, LOCLG $18,650 $31, % MO. $24,104 $39, % U.S. $25,654 $43, % Source: statsamerica.org Table LOCLG - Average Wage & Salary Earning (Indirect measure of potential investment capital) Average Wage and Salary Earnings, 1997 Average Wage and Salary Earnings, 2011 Change in Average Wage and Salary Earnings, LOCLG $19,326 $29, % MO. $27,555 $42, % U.S. $30,093 $48, % Source: statsamerica.org Table LOCLG - Average Proprietor s Income (Indirect measure of potential investment capital) Average Proprietor s Income, 1997 Average Proprietor s Income, 2011 Change in Average Proprietors Income, LOCLG $15,652 $17, % MO. $21,302 $26, % U.S. $25,187 $29, % Source: statsamerica.org Page 60
63 Access to Capital For small businesses to grow and thrive they must have access to financing options that fit their needs. The specific needs often differ due to factors such as business model, growth model, industry trends, business size, etc. No businesses are completely alike, so financing options must be varied. While access to traditional bank financing is often adequate, some entrepreneurs need access to gap financing, private investors, or even crowdfunding. It is therefore important to consider all of the region s financing options. There are many banks in the region that may provide lending options for small and medium sized businesses. There is also at least two gap financing tool, a Certified Development Company with a 504 loan program and a Revolving Loan Fund through the Lake of the Ozarks Council of Government and the Central Ozarks Development, Inc. Other alternative sources of financing, however, are harder to find. Some private investors may exist in the region, but no formal investor groups have been identified. It is noteworthy that people in the region view access to capital as important for the region s ability to grow in the future. In other words, the support for improving financing options appears to be present in the region, so the next step is to ensure that existing options are made available and new options are developed. The summary matrix below provides a snapshot for regional stakeholders to view this driver s key strengths, challenges, and opportunities. These will help guide the analysis towards the final recommendations discussed in the recommendations section starting on page 78. Strengths Ensuring access to financing resources is viewed as important part of the region s long-term success (P. 55). The Central Ozarks Development, Inc. and Lake of the Ozarks CLG have a Certified Development Company with a 504 loan program and a Revolving Loan Fund (P. 55). Growth in finance and insurance industry (P. 56). Challenges Stagnant financial services industry cluster (P ). Zero capital invested by formal investor groups in the region (P.59). Low income levels on both personal and professional measures (P ). Slow growth in proprietor s income (P ). High percent change in personal income (P ). Opportunities Formalize investor group(s) to encourage more open investor activity. Information sharing mechanism focused on providing up-to-date information on a broad array of financing resources for small businesses. Continue developing gap funding through existing and new loan programs. Page 61
64 Regional Alternative Access to Capital Resources Name Type Phone Community Foundation of the Lake Community Foundation (573) Eldon Community Foundation Community Foundation (573) Centennial Investors Angel Fund (573) Camdenton Department of Economic Development Lake of the Ozarks Regional Economic Development Council City Department (573) Regional Council (573) Justine PETERSEN Microloan Provider (314) Lebanon Regional Economic Development, Inc. Non-Profit (417) Lake of the Ozarks Council of Local Governments Planning Commission (573) Central Ozarks Development, Inc. Certified Development Company (573) Page 62
65 Promoting Awareness and Building Networks The approach to economic and entrepreneurial ecosystem development must be grounded in a belief that the region and regional communities can grow their own, rather than trying to attract businesses and jobs from elsewhere. This is partially achieved by developing an entrepreneurial culture where local companies and business leaders are celebrated, residents are aware and proud of local businesses, and both public and private entities publicly support entrepreneurial endeavors. This can be achieved in many ways, but as a starting point it is important to consider how the region is doing with respect to supporting both large and small establishments, and ensuring that a large share of establishments are local. Survey The survey asked respondents a number of questions about their perception of how the Lake of the Ozark region culturally supports new and existing business owners. One such question asked respondents how much they agree or disagree with the following statement: The business culture in the region understands failure as part of the learning and innovation process. Unfortunately, 56% of respondents felt this question was very false or mostly false, only 44% said it was mostly true, and no one said it was very true. This shows the region s cultural outlook on entrepreneurship is lagging. This is not uncommon in more rural communities where if a business venture fails all of your neighbors know about it. One way to address this deficiency is to actively promote the successes of risk takers in the region more often and highlight the struggles they had to overcome and the failures they made along the way towards success. Another survey question asked respondents if the region celebrates the growth of companies, not just the absolute size of companies. 56% of respondents felt this question was mostly true or very true and only 44% felt it was mostly false or very false. This is a good sign of residents appreciating the successes of their downtown and local small businesses. The region should view this as an opportunity to help change the culture so that failure can more readily be understood as part of the innovating process addressed in the first survey question. Focus Group The most popular recommendation at the focus group meetings was to have the region focus on entrepreneurship mentoring, training, and selfsupport. Lake of the Ozarks Senior Core of Retired Executives (SCORE) is a great asset to the region and their experience and knowledge need to be Regional Priorities Support the Entrepreneurial Culture Mentoring, training, & selfsupport utilized as much as possible to help new entrepreneurs. Not only do they provide business advice and mentoring, but they also have a business plan competition that gives out $2,000 in prize money to start-up phase businesses. SCORE is a volunteer based mentoring program that helps connect aspiring entrepreneurs with experienced business professionals. Two SCORE chapters are located in the Lake of the Ozarks CLG region. One in Camdenton through their Chamber of Commerce and the other in Lebanon through their Chamber of Commerce. Actively working with programs such as SCORE Page 63
66 to help promote the importance of entrepreneurship is not only beneficial to entrepreneurs, but can also help bring attention to the importance of support mechanisms. An additional resources is the Camden County SBTDC Extension office which helps businesses at every stage. The SBTDC provides professional business analysis and consulting for clients. Another positive initiative in the region is the Economic Development Advisory Committee (EDAC) which meets every other month and includes members from each county. The EDAC consists of 33 members with 52% representing the private sector and 48% representing the public sector, community leaders, workforce development professionals, and higher education. Data Support Identifying relevant data for this driver is challenging because of the informal nature of awareness and networks. However, some data indicators can be discussed in the context of ensuring the right input for developing strong networks and promoting awareness about the importance of entrepreneurs and entrepreneurial activity. These indicators are related to the presence of small and large businesses as well as ownership of businesses in the region. Innovation Index Having both small and large establishments is important to establishing a strong foundation of both formal and informal networks. Business networks generally impact regions through individual and collaborative efforts. For example, having many small establishments provides the foundation for establishing merchant groups, downtown organizations, etc., while having large establishments provides the foundation for more professional networks, experienced mentors, bigger investments in community wide initiatives, etc. A great example of valuable investments into communities by a large corporation comes from Chattanooga, Tennessee, where Volkswagen has implemented the Volkswagen Academy in partnership with Chattanooga State Community College (Chattanooga State, 2014). The purpose of the program is to help train the workforce and students with skills and knowledge applicable to the automotive industry. Not only does this benefit both the community college and Volkswagen, but the long term effect is a highly specialized workforce that can contribute new ideas and developments across many industries. While the Lake of the Ozarks region does not have Volkswagen or some other international company to invest in the region, a similar investment was made by a local manufacturing company, Johnson Controls. The company partnered with State Fair Community College to offer specific classes needed to train the company s workforce. All equipment needed to train the workforce is provided by Johnson Controls. The data in Figures 5.1 and 5.2 shows the Lake of the Ozarks CLG region has a very high rate of small establishments while large establishments are few. The number of average small establishments varies throughout the region s counties (appendix VI) with Morgan County at a high of small establishments per 10,000 workers, and Laclede at the smallest with small establishments per 10,000 workers. There is also a great deal of variation in the presence of large establishment between the counties. Morgan County appears to have no large establishments, while Laclede has the most with 1.33 large establishments per 10,000 workers. Camden and Miller counties have 0.49 and 0.43, respectively. Overall, the data indicates a potentially unhealthy balance between small and large establishments in the region. Page 64
67 Figure Average Small Establishments per 10,000 Workers, Figure Average Large Establishments per 10,000 Workers, LOCLG MO U.S. Source: statsamerica.org LOCLG MO U.S. Resident vs nonresident (NETS) A region with a strong entrepreneurial culture should show signs of having a high ratio of jobs in resident versus nonresident establishments. Resident establishments are those where the headquarters are located within the same state as the establishment. It could be within the same region as well, but the data only identifies it as being within state borders. For example, in the Lake of the Ozarks CLG region a resident establishment may have their HQ in Camden or it could be in St Louis or any other city in Missouri. On the contrary, nonresident establishment are those where HQ is located in a different state, but a franchise is located in the region. The importance of looking at jobs with respect to headquarters location has to do primarily with potential effort and impact. A resident establishment is more likely to have the state s, and thus the region s, best interest at heart. Their operations are affected by the state s economy and as such may be more likely to be a source of stable jobs and focused efforts towards creating a stronger state and local economy. Nonresident establishments are less likely to be overly concerned with regional economic development and prosperity, because their main concern will be more focused within the state of their own headquarters. In % of jobs in the region were found in resident establishments. This is up from 83% resident jobs in The increase in the rate of resident jobs stems mostly from an overall decrease in nonresident jobs, which fell by 3,283 jobs between 2002 and The majority of loss in nonresident jobs came from declines in large establishment with 100 to 499 and 500+ employees. Total resident jobs only decreased by 51 jobs. However, the data does show that resident jobs from self-employment and 2 to 9 establishments increased 3,451 jobs, while resident jobs from Page 65
68 500+ establishments decreased by 3,935 jobs. Establishments with 10 to 99 decreased by 234 jobs, while 100 to 499 increased by 769 jobs. The general implication here is that more and more jobs from small and medium sized establishment are considered residents, which is a very positive indicator. This will help provide a stronger foundation for building networks where businesses are focused on improving the economic conditions of the region. Table LOCLG - Resident vs. Nonresident Establishment Jobs Resident Jobs Nonresident Jobs Establishment Size Percent Change Percent Change Self-Employed 2,249 2,676 19% % 2 to 9 14,862 17,886 20% % 10 to 99 20,512 20,278-1% 2,100 2,400 14% 100 to 499 8,770 9,539 9% 4,875 3,523-28% ,062 2,127-65% 2, % Total 52,455 52,506 0% 10,385 7,102-32% Source: youreconomy.org Promoting Awareness and Building Networks Summary Creating a culture where entrepreneurs and small businesses are valued as important job creators and drivers of the regional economy can be challenging. Residents must be made aware of their role in the regional economy and policy makers must understand how to support them. Additionally, entrepreneurs and small businesses must understand how they can collaborate and benefit from each other. In other words, the region must develop and invest in creating strong networks. While the survey results indicated that the region has difficulty understanding failure as a natural part of the entrepreneurial ecosystem, there seems to be a generally positive view of the role of entrepreneurs and small businesses in the region. A positive view of entrepreneurship and small business is very important when efforts are taken towards investing in new initiatives focused on creating strong entrepreneurial networks. The next step is to build on those positive views and attitudes by engaging stakeholders from all areas of the region. Getting the people with knowledge, experience, and a desire to support the entrepreneurial ecosystem together in a room to discuss who and how networks can be developed will help guide the efforts in the best direction. It is through discussion and collaboration that networks are built and sustained. Stakeholders should include small business owners, successful entrepreneurs, chambers of commerce, policy makers, and regional leaders. In addition to establishing strong entrepreneurial networks, it is also important to consider the possibility of collaborating with broader networks. This may be achieved through participating in industry associations, developing industry-related conferences, and collaborating with small communities in other states who face similar challenges. Page 66
69 The summary matrix below provides a snapshot for regional stakeholders to view this driver s key strengths, challenges, and opportunities. These will help guide the analysis towards the final recommendations discussed in the recommendations section starting on page 78. Strengths Positive view of the role of entrepreneurs in the region (P. 63). Two SCORE chapters are present in the region (One in Camdenton and one in Lebanon) (P. 63). Camden County has a SBTDC office available to entrepreneurs (P. 64). The region has an Economic Development Advisory Committee that meets every other month (P. 64). Challenges Business failure appears not to be understood as a natural aspect of entrepreneurship and innovation (P. 63). Lack of healthy balance between small and large establishments in Camden, Miller, and Morgan counties (P ). Significant loss in jobs from nonresident establishments (P ). Good balance between small and large establishments in Laclede County (P.64-65). Increase in resident jobs from small and medium sized establishments (P ). Opportunities Invest in improving networks and coaching programs for entrepreneurs, by developing the existing SCORE chapters and SBTDC office. Collaborate between counties to share knowledge, experience and expertise by business leaders from small and large establishments. Attract industry associations to help facilitate information and knowledge sharing between firms within and outside of the region. Create industry related annual conference. County commissioner s meeting. Could be held on a bi-annual schedule to discuss relevant issues and challenges in the short and long-term. Expand Ralph Stonebraker Business Plan Award to reach a wider section of entrepreneurs in the region. Identify successful regional entrepreneurs and develop entrepreneurial network. Page 67
70 Regional Network Resources Name Type Phone SCORE - Lake of the Ozarks SCORE (573) Eldon Area Chamber of Commerce Chamber (573) Lake Area Chamber of Commerce Chamber (573) Lake of the Ozarks West Chamber of Commerce Chamber (573) Camdenton Area Chamber of Commerce Chamber (573) Lebanon Area Chamber of Commerce Chamber (417) Versailles Area Chamber of Commerce Chamber (573) Camden County MU Extension SBTDC SBTDC (573) Camden County MU Extension Center Extension (573) Miller County MU Extension Center Extension (573) Morgan County MU Extension Center Extension (573) Laclede County MU Extension Center Extension (417) Page 68
71 Optimizing the Regulatory Environment Entrepreneurs and small businesses do not operate in a separate market away from local, state, and federal policy makers. Economic development efforts must ensure that the regulatory burdens put on small businesses do not adversely affect their ability to compete and grow. While there must be some requirements related to running a business of any size, it must be kept in mind that small businesses often lack the resources and knowledge to navigate complex tax codes, registration processes, and other industry specific requirements. It is therefore important to provide the necessary support mechanism and strive for transparency when dealing with regulations affecting small businesses. Survey The survey also sought to gauge people s perceptions on how local government contributes to or in some cases hinders the success of entrepreneurs. One question asked was whether "local government institutions eagerly partner with the private sector to promote new business development." 19% rated this question very false, 41% said mostly false, 39% said mostly true, and 1% said very true. A couple survey questions asked respondents to rate the region s performance in regulatory environment factors. The first was to rate state and local government regulations that support small businesses. 67% of respondents rated this question either poor or fair, and 33% rated this question good or excellent. Another question asked to rate the effectiveness of government-sponsored growth incentives (tax breaks, seed funding, etc.), which was rated even worse with 74% giving a rating of poor or fair and only 26% giving a good or excellent rating. These responses demonstrate a perception among the region that local government could be a lot more effective in helping the private sector. Survey respondents made a few comments about ways to improve public-private cooperation: PUBLIC SUPPORT FOR SMALL BUSINESS RENOVATE HISTORIC DOWNTOWN IMPROVE GROWTH INCENTIVES Develop a new resident program. Work with local governments to better understand regulations that impact businesses. Business Incentives. Lake area needs a regional group that brings together east side, west side, and all the individual city and county governments to form a comprehensive resource sharing and planning committee. Too many small groups working independently of each other. Page 69
72 Focus Group The focus group made a number of suggestions for the private sector and local government to promote new business creation. The first suggestion was to explore renovating historic downtown retail space and to look at ways to improve existing historic downtowns in the region. There are a number of federal and state historic tax credits available for historic preservation projects as well as grants available from the Missouri State Historic Preservation Office (DNR, 2015). The focus groups final two recommendations were to have more development ready business sites and to explore the creation of a downtown business incubator. Although somewhat similar, they differ in that business incubators focus on smaller early-stage businesses needing both office space and technical support while development ready business sites are mainly for larger business attraction and expansion projects. Both incubators and business site are important aspects of an entrepreneurial ecosystem because to focus one but not the other could cause opportunities to be missed. Data Support In the same way that objective data was difficult to identify in the previous driver, so it is for this driver. However, some indirect, state level data trends can be discussed in the context of how well the regulatory environment is performing with respect to supporting the entrepreneurial ecosystem. One approach is to discuss some of the barriers that may exist for potential and existing entrepreneurs, such as licensing requirements and taxation. Licensing Barriers At the federal and state level laws are created that influence small businesses and entrepreneurs in their capacity to do business in the market place. Some markets are easy to enter and require little formal investment other than knowledge, experience and a desire to do business. Dog-walking, babysitting, online blogging, etc. are examples of markets with relatively easy market entry. They may not provide the biggest opportunities for making large profits, but for some they can serve as extra income or as a flexible job. On the other hand, some markets are harder to enter because of additional regulations or restrictions required before opening a business. These requirements are generally considered licenses. Licensing requirements often include a minimum number of years of education, initial and/or yearly fees, passing one or more exams, and continuous education and training to stay licensed. While licenses are put in place in large part to protect the consumer from scams and unfairly low-quality services, it is also true that licenses can slow or block entrepreneurial activity and thus job creation. Recent research shows that in the 1970s, roughly 10 percent of jobs required the individual to have a license, but by 2008 this had increased to almost 30 percent (Kleiner, 2014). As the Kaufmann Foundation recently pointed out, more licensing requirements likely result in fewer entrepreneurs starting businesses in those markets. This allows incumbent firms to charge higher prices, which may be good for them, but bad for overall business creation. Some professions in Missouri that require licenses include barbers, real estate salesperson, manicurists, and funeral directors, among others. For job creation licenses can be stifling, which is just as important to acknowledge as the potential for innovative activity. To help evaluate the conditions in Missouri for how licensing requirements affect entrepreneurs, Thumbtack and the Kauffman Foundation have collaborated on a Small Business Friendliness Page 70
73 Survey that identifies how unfriendly or friendly is your state or local government with regards to licensing forms, requirements and fees?. The survey has been conducted for three years, starting in 2012 and draws its conclusion from over 200 small business owners throughout Missouri. In 2014 the state as a whole was graded a C, indicating that Missouri s regulatory environment could be friendlier towards small businesses. The grading scale follows the standard scale from A to F. The survey seems to indicate that the regulatory environment is not perceived in a very positive light when it comes to the burden of licensing. The reason this is brought up, despite the fact the individual regions have little power to change licensing laws, is that information and support can be developed and provided to help ensure that any would-be entrepreneur has the best odds of navigating any barriers to entry. The goal should not only be focused on trying to change the regulations, but also on how to accommodate and provide helpful services towards decreasing the barriers to entry based on licensing requirements. One of the tools that should be available for regional entrepreneurs is an information package that highlights key information about regulatory issues. This should also include relevant information about regional resources that can help entrepreneurs and small businesses navigate regulatory requirements. For further information about specific licensing requirements in Missouri go to CareerOneStop s webpage at Click on the Licensed Occupations link and search for the specific licenses in Missouri. Additional Regulatory Factors Besides surveying how friendly or unfriendly the state is with respect to licensing issues, the Small Business Friendliness survey also asks small business owners a series of questions related to the regulatory environment in the state. Table 6.1 highlights eleven areas where state and local government regulation s affect small businesses. This survey reflects the overall state s regulatory environment and as such may not reflect exactly how small business owners in the Lake of the Ozarks CLG region feel. But, it does say something about what individual regions must consider when they want to improve their own regulatory environment and develop successful economic and entrepreneurial development efforts. Overall, the survey indicates that small business friendliness is not doing too well in Missouri. Only two areas received A level grades, Environmental and Zoning related regulations. The worst grade was related to training and networking programs. As discussed in the Promoting Awareness and Building Networks and Developing a Pipeline of Educated and Skilled Entrepreneurs drivers, these areas are also very important for the Lake of the Ozarks CLG region. It is also important to point out that this survey deals with the perception of these areas. This is important because a negative perception does not always mean that something is actually wrong. Very often negative views are based on lack of or limited information about an issue. On the other hand, negative perceptions can also help guide policy makers towards specific issues that small business owners would like to see changed or improved. In addition, it could mean that more education on specific issues is needed with Missouri residents. While Missouri did not receive a top grade by small business owners, it should not go unnoticed that the state s economic development agency was named the best in the nation (Office of Missouri Governor, 2014). The honor was given due to the economic development agency s efforts on marketing of the state to employers, efforts for attracting new business and assisting existing state employers. Over 30 factors were used in the selection process to rank all 50 Page 71
74 states. Missouri was also ranked 8th on the Pollina Corporate Top 10 Pro-Business States in 2014 (American Economic Development Institute, 2014), adding credibility to the state s overall strong business and regulatory environment. Table Missouri Small Business Friendliness Survey (2014) Grade Survey Question Overall friendliness In general, how would you rate your state s support of small business owners? B- C C Ease of starting a business Ease of hiring How difficult or easy do you think it is to start a business in your state? B B- C How difficult or easy is it to hire a new employ at your business? C+ B C- Regulations Health & safety Employment, labor & hiring Tax code Licensing Environmental Zoning Training & networking programs How unfriendly or friendly is your state or local government with regard to business regulations generally? How unfriendly or friendly is your state or local government with regard to health and safety regulations? How unfriendly or friendly is your state or local government with regard to employment, labor & hiring regulations? How unfriendly or friendly is your state or local government with regard to tax code and tax-related regulations? How unfriendly or friendly is your state or local government with regard to licensing forms, requirements and fees? How unfriendly or friendly is your state or local government with regard to environmental regulations? How unfriendly or friendly is your state or local government with regard to zoning or land use regulations? Does your state or local government offer helpful training or networking programs for small business owners? C+ C+ B- C- B B C+ C C- B- B- C+ C+ B- C+ C- C+ A C- B A- N/A D+ F Source: Page 72
75 Optimizing the Regulatory Environment Summary Understanding how the regulatory environment affects small business owners can be difficult, in part because it is very difficult to measure any direct long-term impact from tax regulations, licensing requirements, or other regulatory requirements. In addition, most issues related to the legal environment are decided upon at the state or federal level. This means that local policy makers and stakeholders have two main tasks to consider. First, how are regulations perceived by the region s businesses and residents? Second, how much pressure can and should they put on state and federal lawmakers to ensure fair regulations are put in place? The goal should be to help inform state and federal lawmakers about the specific needs faced by rural communities, and then ensure that the region s businesses have access to information and support to help navigate regulatory requirements. In the Lake of the Ozarks region the biggest challenge appears to be that many residents have a negative view of current government-sponsored support programs and incentives. If residents and business owners are unhappy with how state and federal lawmakers are treating them, it should be the purpose of local policy makers to help facilitate an open debate about the most pressing issues. The summary matrix below provides a snapshot for regional stakeholders to view this driver s key strengths, challenges, and opportunities. These will help guide the analysis towards the final recommendations discussed in the recommendations section starting on page 78. Finally, a table of public official s contact information is provided on page 74. Strengths Support for initiatives including renovation programs for downtown areas, development ready business sites, and studying the feasibility of implementing an incubator (P. 70). Challenges Regional perception of public support and regulations is less than positive (P. 69). State wide the perception of licensing and taxation is perceived negatively (P ). Missouri s Economic Development Agency named best in the nation in 2014 (P. 71). Opportunities Encourage and participate in debate about how to create fair and helpful regulations and incentive programs. Develop startup package for easy access to all regulatory requirements related to small businesses. This should also be used as a tool to help educate entrepreneurs and business owners about specific legal issues. Develop a survey focused on regulatory issues and perceptions by small business owners in the region, to help identify specific challenges experienced by regional entrepreneurs. Use Small Business Friendliness Survey as template for regional survey questions, which will also allow for comparisons of outcomes with state level results. Page 73
76 Public Officials Name Type Address Phone Roy Blunt U.S. Senator 2740 B East Sunshine, Springfield, MO (417) Claire McCaskill U.S. Senator 324 Park Central West, Ste. 101, Springfield, Missouri (417) Blaine Leutkemeyer Vicki Hartzler U.S. House of Representatives (MO-3) U.S. House of Representatives (MO-4) 2117 Missouri Boulevard, Jefferson City, MO North Adams Street, Lebanon, MO (573) (417) Mike Kehoe State Senate - District W Capitol Ave., Rm. 220, Jefferson City, Missouri (573) Dan Brown State Senate - District W Capitol Ave., Rm. 422, Jefferson City, Missouri (573) Mike Parson State Senate - District W Capitol Ave., Rm. 420, Jefferson City, Missouri (573) David Wood Rocky Miller Diane Franklin Sandy Crawford Mike Bernskoetter State Representative - District 58 State Representative - District 124 State Representative - District 123 State Representative - District 129 State Representative - District West Capitol Avenue, Room 115-A, Jefferson City MO West Capitol Avenue, Room 233-B, Jefferson City MO West Capitol Avenue, Room 206-B, Jefferson City MO West Capitol Avenue, Room 207-B, Jefferson City MO West Capitol Avenue, Room 414, Jefferson City MO (573) (573) (573) (573) (573) Page 74
77 Summary To help summarize to the general strengths, challenges, and opportunities in the region, three summary tables are provided below. Each table is intended to give a brief, but focused, overview of the main outcomes of the analysis. Regional Strengths Developing a Pipeline of Educated and Skilled Entrepreneurs The major strengths in the region come from the general increase in educational attainment combined with the positive perception of the importance of educating and training the regional population. An increase in jobs in education-related industries may also prove valuable for the future of the region. Overall, the region needs to leverage these positive trends and build upon them to ensure continued improvements to education and training opportunities. Cultivating Technology Exchange and Innovation Advanced Materials, Biomedical/Biotechnical, and Primary Metal Manufacturing industry clusters appear to be the best candidates for technological and innovative developments. Providing support and connecting the key players in these clusters should be a regional priority. Improving Access to Capital The importance of ensuring entrepreneurs and small businesses have access to capital is recognized in the region. The first step towards improving the funding options is to understand the need for it. Additionally, the presence of a Certified Development Company with a 504 loan program and a Revolving Loan Fund shows there are already some options available. Also, the recent creation of a business plan completion with cash prizes (discussed in the Promoting Awareness and Building Networks driver ) is also a good sign that more capital for entrepreneurs is becoming available. Promoting Awareness and Building Networks Entrepreneurs and small businesses appear to be valued members of the business landscape. Having two SCORE chapters in the region is also a very positive indicator of communities willingness to help and mentor the region s entrepreneurs and future leaders. Optimizing the Regulatory Environment The supportive views of implementing public programs shows a willingness to invest in the region s attributes and opportunities. Also, the fact that Missouri s Department of Economic Development was ranked number one in the country in 2014 speaks to the overall state s ability to invest in economic development initiatives. This is something that benefits all counties in the state. Page 75
78 Regional Challenges Developing a Pipeline of Educated and Skilled Entrepreneurs The lack of higher educational institutes, negative view of current training programs, and decline in young adult population presents itself as the biggest challenges in the region. Without a strong foundation of well-educated young adults, future economic and entrepreneurial efforts will be more difficult to succeed at. Cultivating Technology Exchange and Innovation Low broadband access in Laclede, Miller, and Morgan counties combined with a decrease in several tech-related industries appear to be the most challenging issues facing the region going forward. Improving Access to Capital Slow increase in income levels and a lack of formalized investor groups may be the biggest challenges to the region. Promoting Awareness and Building Networks If communities do not show an understanding and support of business failures as a natural part of the entrepreneurial ecosystem, it may discourage some from participating and taking the needed risks. Optimizing the Regulatory Environment Overall state and local regulations as well as state sponsored growth initiatives are not perceived in a favorable light. Page 76
79 Regional Opportunities Developing a Pipeline of Educated and Skilled Entrepreneurs The region faces multiple opportunities to invest in improvements for educating and training entrepreneurs, business owners, the workforce, and other stakeholders. In particular, the region would benefit from developing specialized training based on regional market needs. It should also be considered how the region can invest in new and existing amenities relevant to the young adult population. Cultivating Technology Exchange and Innovation The biggest opportunity may be to invest in regional improvements to broadband access. Additionally, key players in technology and innovation driven industries should be identified and provided with the support they need to grow and create jobs. The region would also benefit from updating the 2008 business industries survey to get a more current insight into the needs by the region s employers. Improving Access to Capital The opportunities related to this driver deal primarily with continuing to establish alternative funding options, developing networks and partnerships with investor groups outside of the region, and ensuring proper information sharing about financing opportunities. Promoting Awareness and Building Networks The region has a great opportunity to build on the presence of the two SCORE chapters. Networks and mentoring opportunities provided through such programs must be available throughout the region. This should be done along with efforts to attract attention from outside organizations such as industry associations, investor groups, entrepreneurship focused foundations, etc. Optimizing the Regulatory Environment The most important opportunity is to invest time and effort towards developing a healthy dialogue between the public and private sector to discuss wants and needs related to regulations and incentive programs. This should be backed up by an annual survey measuring the perception of how business friendly the region is. Additionally, a startup package that is provided both in a physical format and a web-based format could be developed to help inform and educate entrepreneurs and businesses about regulatory issues, regional opportunities, and available resources. Page 77
80 Recommendations Developing a Pipeline of Educated and Skilled Entrepreneurs Recommendation 1 Invest in development of entrepreneurship programs to be implemented at multiple educational levels, from middle school to high school curriculum. This could be in the form of experiential learning for high school students, where students are paired with entrepreneurial companies and spend a set number of days working with and studying how the company utilizes entrepreneurial approaches to business development. It could also be a studentmentor program to match high school students with business mentors in various industries. This could be implemented into existing class curriculum. The goal would be to expose students at an early age to specific industries and future job opportunities, by connecting them on a personal level with experienced professionals. This could provide a broader and more indepth experience than traditional internship programs. It may also help students to better navigate their higher education and career choices. Example 1 Multiple youth entrepreneurship programs have been developed for schools to use. One of these is the CEO program developed by Midland Institute for Entrepreneurship s Creating Entrepreneurial Opportunities in Effingham, Illinois, The program is funded by business investors and is open to high schools juniors and seniors. It serves both private and public schools and it utilizes the region s own businesses as classrooms. One of the most impressive aspects of the program is that every student member is connected with a mentor from the business community. Example 2 Other programs include the REAL Program for Youth in North Carolina ( our_programs) and the E-Discovery Challenge from the University of Kentucky ( Ag/CLD/KECI/edisc/exp2.htm). The REAL Program for Youth is designed to be used in a variety of settings so it can be adapted to fit the needs and wants of teachers and students. The focus is on team building, understanding community, entrepreneurial thinking, money basics, and business basics. The E-Discovery Challenge was developed and tested in fifteen rural Kentucky counties for elementary and middle schools classrooms.students are given seed money to develop a business idea and sell their product or service at a school or community event. After the sales event the students pay back the seed (loan) money to the school but keep any profits for themselves. Example 3 Junior Achievement also provides a great example and resource of how entrepreneurship and business skills can be taught at multiple educational levels. Page 78
81 Recommendation 2 Develop specialized training programs to help undereducated residents find new job opportunities based on regional market needs. Explore expansion of existing college satellite campuses and use results from new Business and Industry Focus Group Report as a resource in reviewing academic programs. Example 1 In 2013, Three Rivers College launched a Mobile Training Lab. The two travel units were purchased with a $200,000 grant from the Delta Regional Authority. Both mobile labs are equipped with high-tech equipment, allowing specialized training and education to go where the need/demand is (e.g. manufacturing companies, businesses, or educational institutes). Example 2 An alternative approach is to develop a workforce preparation program that links regional high schools students with regional businesses through internship programs. Such a program should emphasize the importance of educating and training the youth with the needed knowledge and skills that regional businesses believe will be in high demand in the near and long-term future. Grafton County s North County Workforce Education Program is a great example of such a program ( %20Sustainability/2014_RAC_case-studies.pdf P. 8) Example 3 Utilize existing providers of training programs such as the FastTrack programs offered by The Kauffman Foundation. FactTrack includes programs such as NewVenture, TechVenture, and GrowthVenture. These programs can be offered through a locally trained affiliate and help entrepreneurs develop their skills and knowledge. Page 79
82 Recommendation 3 Invest in relevant amenities and programs to make the region more attractive for young adults. While a major determinant for many young adults is job prospects, the broader community context cannot be ignored. Relevant amenities that help foster a vibrant community can range from movie theaters to water parks to cafes to shopping malls. There are two main ways to invest in relevant amenities. One is to identify entrepreneurs trying to open establishments that tend to attract young adults (e.g. concert venue or recreational health facility). The other is to determine a broad need that will be attractive to a wide range of residents, including young adults (e.g. a water park or nature trails). Example 1 Develop a survey to gauge the specific wants and needs of young adults. This should also include the next generation of young adults and identify what would make them more likely to stay in the region long-term. An example of such a survey was conducted in Northwest Ohio P1LightPerceptionsof.pdf Example 2 A comprehensive list of programs and strategies for attracting and retaining youth and young adults in rural communities have been developed by the Rural Development Division in Canada. The list begins on page 17 in the link. www1.agric.gov.ab.ca/$department/ deptdocs.nsf/all/csi14329/$file/attracting-and-retaining-people.pdf Page 80
83 Cultivating Technology Exchange and Innovation Recommendation 1 Invest in improvements to broadband access throughout the region, as well as public access to internet in public buildings. This is particularly needed in Laclede, Miller, and Morgan counties. Example 1 Kennett, Missouri invested in a municipally owned and controlled fiber network, City Light Gas and Water (CLGW) that provides fiber internet access to over 1,000 residential homes and businesses. Kennett s CLGW also provides free wi-fi access points at public parks and at the Kennett Airport. Example 2 In 2002, Tryon, North Carolina, a small city of less than 2,000 decided that high-quality internet access to residents, schools, and businesses, was a city priority. Without the support of private internet providers, the city took action and applied for state grants to create a state of the art fiber-optic network. To ensure that schools, residents, and businesses had access to the high-speed internet at affordable rates, a 501(c)3 nonprofit organization was created to manage the network. Recommendation 2 With the large decline in jobs in the IT and Telecommunications industry, there could be an opportunity for providing the displaced workers with the tools on how to create their own technology based companies. This should be done with an eye towards promoting more collaboration between public administration, educational institutes, and private growth industries. In other words, such entities should provide the foundation for developing and implementing new training programs. Example 1 OnShore is an information technology services company located in Macon, Missouri. OnShore provides a great example of how a small business can approach the technology sector by utilizing local talent. The success of OnShore shows that IT services such as IT consulting, software development, data services, etc. can be delivered to clients on a national level by a small company in rural America. Example 2 Recommendation 2, example 1 from Developing a Pipeline of Educated and Trained Entrepreneurs driver would also benefit training opportunities in the context of IT and telecommunications work. Page 81
84 Recommendation 3 Based on the prevalence of manufacturing firms the region could benefit from investigating the possibility of developing a network of manufacturers focusing on supporting and promoting flexible manufacturing techniques. Flexible manufacturing helps manufacturing companies meet fast changing demands, provide customized solutions, serve a wider range of buyers, and stay competitive. This could be extended by investigating the feasibility of implementing a manufacturing-focused incubator. Example 1 A recently developed network focusing on flexible manufacturing is the Illinois FlexNet. While this network is relatively new and have not had time to prove impact, it could serve as a great source for partnering. Developing and learning together and from each other will increase the chance of long-term positive impact on the manufacturing industries in rural America. Example 2 The most prominent example of a manufacturing-focused incubator is the TechShop concept. TechShop is a maker-space where members get access to high-quality machines and tools. Members can use the machines and tools to develop prototypes and scale-models. A TechShop is expected to open in St. Louis in Recommendation 4 Update 2008 Business and Industry Focus Group Report to identify current needs. This should be done on an ongoing basis, preferably annually. Because Advanced Materials and Primary Metal Manufacturing industry cluster are rapidly growing, these industry clusters need to be a large part of any new Industry Focus Group Report in order to find out how to better train their current and future workforce. OTCManufacturingFocusGroupReport.pdf Page 82
85 Improving Access to Capital Recommendation 1 Identify and develop relationships with angel investor network in other parts of the state to help connect entrepreneurs with potential investors and build networks for future entrepreneurs to benefit from. This should lead to forming regional investor groups focusing on entrepreneurs in the Lake of the Ozarks region. Example 1 Efforts are already in the works with Lake of the Ozarks Council of Local Governments currently in discussion with an angel investor group in Columbia, Missouri to see if they could develop a partnership with their regional investors and entrepreneurs. Recommendation 2 Continue developing gap funding programs, such as the 504 loan program and the Revolving Loan Fund. Other alternative financing vehicles should also be considered, including seed money from the business plan competent (discussed in the Promoting Awareness and Building Networks recommendation section). Providing a wide variety of funding options to meet the many different business needs and situations is a core component of fostering longterm growth in the entrepreneurial ecosystem. Example 1 Organizing a crowdfunding mechanism can be a way to highlight specific regional areas and businesses (non-profit and for-profit) that are in need of capital. Popular sites such as kickstarter and indiegogo can help individual businesses, but a regionally focused crowdfunding website can help bring attention to the importance of regional participation. Recommendation 3 Develop a detailed capital resources inventory list. This should identify all relevant resources for investment capital including seed money, angel investors, venture capital groups, revolving loan funds, micro lending programs, SBA offices, crowdsourcing mechanisms, traditional banks, and any others that can be identified. The list should be made readily available to any entrepreneurs or small business owners. Example 1 Fox Cities Regional Partnership in Wisconsin provides an example of what such a resource list could look like Their list includes an overview of all the financial resources available in the region. Page 83
86 Promoting Awareness and Building Networks Recommendation 1 Create industry related annual conferences as a form of offseason income for the tourism industry. Conference candidates of industries that are already present in the Ozarks include hospitality, manufacturing, advanced materials, and healthcare. Example 1 The Institute for Regional Innovation and Entrepreneurship hosts an annual entrepreneurship focused conference, the REAL14, This conference will be continued with a new key theme every year to help promote the role of entrepreneurship and industry in the region. Recommendation 2 Expand Ralph Stonebraker Business Plan Award to reach a wider section of entrepreneurs in the Lake of the Ozarks region. In the long run the business plan competition could be held in each county every year, with a region wide competition for the winners in each county. Example 1 Multiple business plan competitions are held every year throughout Missouri. Some of these include the MADE in Missouri in Marshall ( the 1ST50K in Cape Girardeau ( and the high school student based competition The Missouri Entrepreneurship Challenge ( Example 2 Another opportunity is to connect with Springfield s The efactory and explore the idea of having the 1 million cups event somewhere in a Lake of the Ozarks CLG county 2 to 4 times a year. Page 84
87 Recommendation 3 Continue developing the two SCORE chapters to widen the reach of small business coaching and consulting. One way to continue improving on the SCORE chapters is to consider leveraging the region s human capital from retired business professionals. With the large share of residents aged 55 or older there is likely a strong pool of experienced and knowledgeable former business professionals. Engaging this population segment can prove a valuable source to entrepreneurs and small businesses. Example 1 When the small town of Brevard, North Carolina, saw three large employers close down, the region s community leaders came together and created the Retiree Resource Network. This network identified retired business professionals in the region who were willing to help coach and consult entrepreneurs and small businesses in the area. The city had a large share of retired people and realizing the true value of this the new program was able to get 68 individuals to volunteer their time and knowledge. Utilizing these individuals in a meaningful way helped re-create the lost jobs and keep the local economy alive. programs/cednc/stbi/cases/pdf/brevard.pdf. The basic idea of maximizing the value of the region s existing human capital assets can be applied to improving the quality and quantity of coaching and consulting opportunities offered in the Lake of the Ozarks CLG region. Page 85
88 Optimizing the Regulatory Environment Recommendation 1 Develop startup package website with key information concerning business licenses, legal requirements, etc. The purpose would be to have a one-stop-shop with all the information needed by entrepreneurs and small businesses to meet all regulatory requirements to do business. Example 1 Entrepreneurship Nevada at This site is not specific to legal issues, but provides a more general overview of resources. A similar website should be developed for the Lake of the Ozarks CLG region where potential and existing entrepreneurs can access relevant information about regional small business resources. Recommendation 2 Conduct annual survey to gauge small business owner s perception of the regulatory environment. This will help track the general attitude and perception of how well public institutions are supporting them. It will also help identify what areas of the regulatory environment small businesses feel needs to be improved the most. Results should be presented to community leaders and policy makers on an annual basis. Example 1 Use the Small Business Friendliness Survey methodology to guide the questions and format of the survey. Using the same structure will help benchmark the results of the region s regulatory environment against Missouri and other states. The methodology of the survey can be found at friendliness_2014.pdf Page 86
89 Appendix I - Methodology Six different data driven tools are used to analyze the entrepreneurial and innovative activities that support the entrepreneurial ecosystem in the region. These data tools include: (1) a regional survey; (2) an interactive focus group; (3) the National Establishment Times Series (NETS); (4) industry clusters; (5) traded vs. local clusters; (6) an innovation index. Throughout the analysis these tools will be used to highlight key factors related to strengths and challenges faced by the Lake of the Ozarks CLG s entrepreneurial ecosystem. The first two data tools are primarily subjective in that they capture individual views and attitudes towards various factors related to the entrepreneurial ecosystem. In contrast, the remaining four tools are objective in that they capture measurable variables related to economic dynamics. The four objective data tools will primarily serve as data support to help highlight trends and patterns that can shed light on the region s entrepreneurial ecosystem. The main section of the report takes the findings from the data tools and applies them to the policy framework (Stapleton, 2012). The policy framework is comprised of five key drivers related to developing and fostering a strong, competitive entrepreneurial ecosystem. The five drivers are: Policy Framework Developing a Pipeline of Educated and Skilled Entrepreneurs Cultivating Technology Exchange and Innovation Improving Access to Capital Promoting Awareness and Building Networks Optimizing the Regulatory Environment Source: Transforming Community Economies, James Stapleton (2012) Page 87
90 Data tools 1. Survey Surveys were sent out to regional stakeholders to learn more about their attitudes, perceptions, and priorities concerning the region s strengths and weaknesses in supporting entrepreneurs. Stakeholders include policy makers, business owners, former business owners, and economic developers. Participants were asked dozens of questions from which responses were collected and analyzed. For example, participants were asked to rate the regional importance of various entities including regional universities, banks, business suppliers, etc. The report will highlight differences in opinions between respondents, particularly those who have started their own business and those who have not. This will help highlight a number of disconnects between the attitudes, perceptions, and priorities of the different types of regional stakeholders. 2. Focus Group In order to get more detailed conversational feedback from regional stakeholders, two interactive focus group sessions were held on September 17 and 18, This session began with a presentation of a portion of the data analysis, specifically the components of the Innovation Index. After this, the focus group was conducted utilizing a game called Up and Out: Entrepreneurship Edition to help facilitate and guide an interactive conversation. The game provides participants with dozens of examples of ways participants could potentially make improvements to the region s entrepreneurial ecosystem. By the end of the game, participants narrowed down the list of potential implementation strategies from 48 to 16. This report will focus on overlaps in participant s recommendations for improvements that could be made to the region s entrepreneurial ecosystem. 3. National Establishment Time Series The National Establishment Time Series (NETS) data provides detailed insights into job dynamics in the region. The main question to look at when using this data is, where are most new and existing jobs concentrated?. To answer this question the data shows the number of jobs broken down by establishment size. The size breakdown is as follows: self-employed, 2 to 9 employees, 10 to 99 employees, 100 to 499 employees, and 500 plus employees. The data covers the time period from 2002 to When discussing this data it is important to understand the definition of an establishment. An establishment is considered a business unit that provides goods or services at a single physical location. This means that if a company has two or more locations in the region, each location and corresponding jobs are counted separately. Additionally, the data looks at jobs rather than just full-time employees, so it includes part-time employees, undocumented workers, and people working more than one job. This way the data captures a more detailed overview of actual job dynamics. An additional use of the data comes from an industry overview of job dynamics. This data shows total jobs from 2002 to 2013 in each industry based on two digit North American Industry Classification System (NAICS) codes. NAICS is the standard system used by Federal statistical agencies in classifying and tracking business establishments. Page 88

91 Using this data helps identify how well the region is doing with respect to fostering small and medium sized establishments. Proving that new jobs come from small and medium sized establishments is vital to understanding the importance of investing in the entrepreneurial ecosystem. Full data sets have been provided in appendix III. 4. Industry Cluster Industry cluster analysis recognizes that industries in related sectors tend to cluster together geographically. A cluster will include the core industries that produce related or similar goods. Upstream industries include suppliers of inputs to the core industries. A cluster will also include support industries that offer various specialized services to the core industries. Finally, a cluster will include downstream industries, which are the ultimate customers of the core industries. These typically include wholesale and retail establishments. A key advantage of using industry clusters for analysis, instead of standard industry breakdowns based on traditional NAICS codes, is industry clusters can help identify existing and potential areas of competitive advantage for the region. Based on Porter s diamond, the competitive advantage derives from four factors: Source: The competitive Advantage of Nations, Michael Porter (1990) 1) Factor or input conditions Talent attraction, access to skilled labor pools, access to specialized suppliers, educational institutes with expert faculty, supportive infrastructure, etc. 2) Demand conditions Higher than average home-market demand leading to faster and better innovations and product improvements that can be transferred to other markets. 3) Related and supporting industries Close relationships between interrelated noncompeting industries or suppliers in related industries, where the firms in the core cluster can gather unique know-how, have direct access to unique resources, and benefit from established supplier and customer channels. Page 89
92 4) Firm strategy, structure and rivalry Management practices favored in a specific region, laws and regulations unique to the state or nation, public and private investment practices and efforts to support certain industries, and the culture of competition and cooperation that may lead to new and innovative relationships and business practices. Every cluster in a region will have unique characteristics, but these four conditions will be important to all clusters and the ultimate ability of its component firms to compete in the national and global economy. 22 industry clusters have been identified as the most likely to provide the potential foundation for regional competitive advantages to be developed. A detailed description of each cluster and full dataset are provided in appendix IV. Industry Cluster Names Advanced Materials Agribusiness, Food Processing & Technology Apparel & Textiles Arts, Entertainment, Recreation & Visitor Industries Biomedical/Biotechnical Business & Financial Services Chemicals & Chemical-Based Products Defense & Security Education & Knowledge Creation Energy Forest & Wood Products Glass & Ceramics Information Technology & Telecommunications Transportation & Logistics Mining Printing & Publishing Primary Metal Manufacturing Fabricated Metal Product Manufacturing Machinery Manufacturing Computer & Electronic Products Manufacturing Electrical Equipment, Appliance & Component Manufacturing Transportation Equipment Manufacturing Identifying industry clusters with the most potential for developing regional competitive advantage is achieved by calculating a location quotient (LQ). The formula for the LQ is: Fraction of a region s employment in industry cluster A Fraction of the nation s employment in industry cluster A If the LQ for a specific cluster is greater than 1, the region employs a higher proportion of people in that industry than the national average. The region is also more likely to have a competitive advantage in that cluster, which has the potential to be an important driver of regional growth and development. In addition to the LQ, the industry cluster also identifies employment in each cluster. This is important because a strong, growing LQ is not necessarily equal to high actual employment numbers. So if a cluster has a high LQ score but low employment numbers, it should not be the Page 90
93 single largest focus of job creation in the long-term. However, it may still be a good source of economic impact provided the firms in the cluster have high revenue-to-employee ratios. By being a region with a cluster of high revenue per employee and a high LQ, you are likely to have opportunities for complementary businesses to have job growth. Applying the industry cluster data to the policy framework for entrepreneurship helps identify areas that support some drivers and areas that fail to support other drivers. A detailed description of each industry cluster and data overview of each county s industry clusters is provided in appendix IV. 5. Cluster Mapping Analysis The cluster mapping tool focuses on the difference between traded and local clusters. Traded clusters are groups of related industries that sell their goods and services beyond the local market to other regions, states, or nations. Companies within the traded clusters tend to compete in larger geographical market areas, leading the way for more potential impact on regional economic performance. On the other hand, local clusters are groups of industries that only sell within their local market boundaries. They can be found in almost any region of the country, regardless of any competitive advantages of a particular location. Typically, local clusters provide the region with the majority of jobs, but are limited in terms of potential economic impact. They compete against other local entities and are unlikely to provide much potential for sustainable economic growth. The cluster mapping tool groups 778 six-digit NAICS (North American Industry Classification System) industries into 51 traded cluster categories, and 310 NAICS industries into 16 local cluster categories (all mutually exclusive). The cluster mapping data is helpful when discussing the regional profile, as well as when identifying important aspects of economic impact on some policy framework drivers. A description of each traded and local cluster and the full dataset are provided in appendix V. 6. Innovation Index Entrepreneurship involves creating new ideas and implementing those ideas in a practical and successful business. Therefore, at its core, entrepreneurship is about innovation. Although wit is not understood exactly how new ideas and innovation are created and implemented, it is clear that there are certain characteristics of a place that contribute to an innovative culture. For example, the environment in Silicon Valley is clearly one that encourages people to be creative and innovative in their businesses. In Silicon Valley, entrepreneurs are highly respected and there are institutions, such as venture capital firms, that support them in starting a new business. The Innovation Index captures some characteristics of a place and culture that make it more likely for entrepreneurship to occur. For example, having an influx of people, particularly young people, moving into a region is associated with innovation and new firm development. Page 91
94 The Innovation Index analysis will use aggregated regional data to identify the state of innovation in the region as a whole. The data for the region will be compared to innovation levels of Missouri and the U.S. The Innovation Index is composed of four main components, each with its own degree of impact on the overall Innovation Index score: Human Capital, Economic Dynamics, and Productivity & Employment each count for 30%, while Economic Well-Being counts for 10% of the overall Innovation Index score. These four main components each have their own sub-components with individual degrees of impact. The benchmark for each main component, as well as the overall innovation score, is the national average score which will always stand at 100. Applying the sub-components of the Innovation Index to the policy framework drivers helps provide insight into innovative activities related to the drivers, as well as show where the foundation for innovation lies in the region. The overall index score and scores from the four main components will be discussed in the regional profile. Page 92
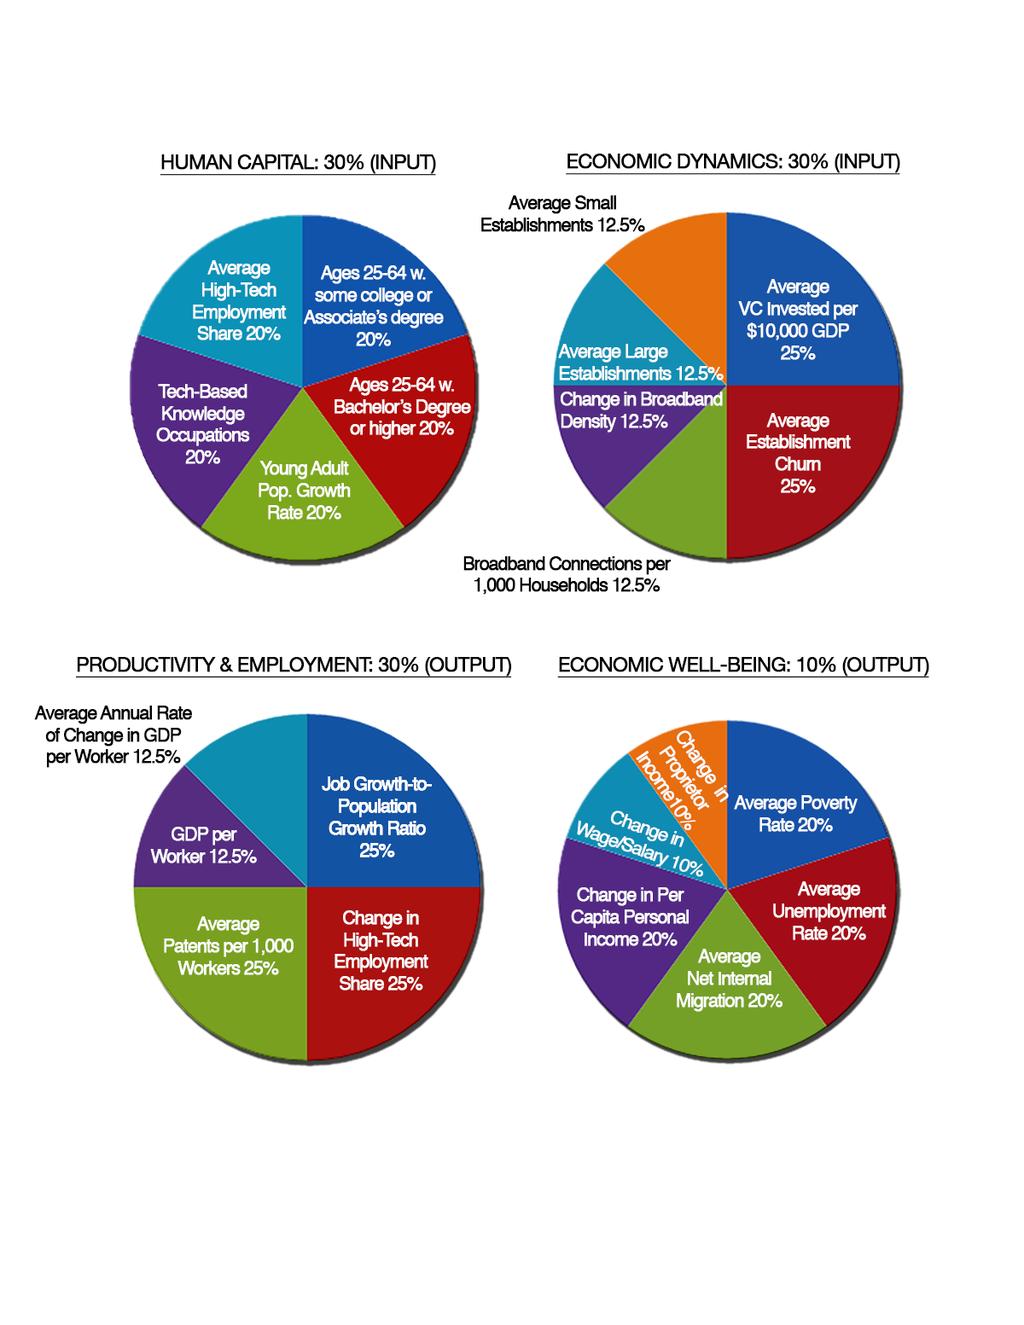
95 Page 93


96 Appendix II - Survey Template & Feedback Survey Template Demographics Please complete this brief background section. Please keep in mind that the information you supply will remain anonymous, and will be analyzed only in combination with other responses. The region considered in this survey covers the Lake of the Ozarks Council of Government s 4 county service area, including Camden, Laclede, Miller, and Morgan County. 1. In what County do you work? 2. How long have you lived in the region? 3. Are you male or female? Page 94


97 4. What category below includes your age? 5. Which of the following categories best describes your employment status? 6. Have you started your own business? Page 95
98 Business Environment In this section we are interested in learning about how each of the following factors affects your ability to conduct business. 7. Please rate the region s current performance on each factor The region s overall quality of life. The overall quality of the region s community and technical colleges. The availability of regional college and university internship programs. The quality of technical assistance offered by regional colleges and universities to businesses. The quality of collaboration between businesses and regional college/universities. 8. Please rate the region s current performance on each factor The availability of top managers in the region. The availability of information tech professionals in the region. The availability of risk capital from investors in the region. The availability of risk capital from angel investors in the region. The availability of capital from banks in the region. Page 96

99 9. Please rate the region s current performance on each factor State and local governmental regulations that support small businesses. The level of taxation of small businesses. The effectiveness of governmentsponsored growth incentives. The effectiveness of regional programs to help startup businesses The effectiveness of regional programs to train entrepreneurs Page 97


100 Innovation Networks In this section, we are interested in understanding how relationships with other regional entities help your region to innovate. Innovation includes developing and commercializing new products as well as making improvements to existing products, services, or business processes. 10. Overall, how important are each of the following entities to your region s ability to innovate? Community/Technical Colleges Other businesses in your region Regional Business Suppliers Banks Venture Capital Firms Angel Investor Business Incubators Industry or Cluster Associations Entrepreneurial Networks Small Business and Technology Development Center Page 98


101 Regional Norms and Attitudes In this section, we are interested in learning about the dynamics of the business and civic environment of your region. 11. Please rate the following statements on how true or false they are in your region? New residents can easily integrate into the regional business community The region is a welcoming, tolerant, and attractive place for people of diverse backgrounds Leaders in the region are responsive to the needs of all the regional residents, irrespective of ethnicity, cultural heritage, gender, or lifestyle The business culture in the region understands failure as part of the learning and innovation process People from different industry and economic sectors frequently interact in the region The region celebrates the growth of companies, not just the absolute size of companies Artists and business-people frequently interact in the region Local government institutions eagerly partner with the private sector to promote new business development Business leaders in the region treat entrepreneurs, start-ups, and new companies as fill partners in all aspects of industry cooperation Business leaders proactively share information and resources when possible Regional residents actively participate in community development organizations and projects Successful business people in the region actively invest in economic development projects and start-up ventures Page 99
102 12. Consider your entire regional business environment, please list and explain the most important regional issue(s) that should be addressed to improve your region s business climate and community Areas around the lake need to work closer together GO GO City, Agency Cooperation. Growing our business. Business partnerships. More work must be done to include all stakeholders in the region for future job growth and regional development- within respective communities and region as a whole. High taxes mainly from the federal government. The high cost of health insurance is a big problem for the local residents. One of the biggest things State government could do for our area is to delay the stating of primary and secondary education until labor day, as it used to be. The local community leaders are hard to meet and get to know. It would have been good to have a mentor when we started our business. communication in the community. organizations with common goals should be working together and more training for individuals. Education and continue education are lacking which leads to low wages Incentives for business Continuing positive financing opportunities that are available Businesses and their supporting organizations need to work closer on a daily basis to enhance the total business community-not just talk about it! Post - secondary education including technical schools and community colleges. Information and awareness of resources available Accessibility of convenient highways and poorly trained and educated workforce Need to change the mind set of leaders in the community to understanding change is good "not bad". Most think is a family area and it has changed to party ground for the those who visit here. Somewhere they lost the family values that made this area what it was years ago. Its every man for himself and the businesses that have been here a long time try to block new businesses that would create competition. The local governments favor the "good ol' boys and get in the way of expansion. Local govt has a preoccupation with tax revenue rather than economic opportunity lower real estate prices more in line with the reality of today's economic climate. LAKE AREA- NEEDS MORE FAMILY ORIENTED THINGS/BUSINESS FOR TOURIST TO COME TO THE AREA- IE BRANSON The addition of a major theme park to increase year around visits to the lake. This is a tourist area and second home and retirement area. just get some more businesses in the community business growth in Morgan County The lake of the ozarks strip needs to be redeveloped and there needs to be a regional growth plan established for the new road corridors and interchanges. Page 100
103 Here; we need to branch out and broaden the scope. We have a lot of industry. You can build boats, work at a metal fabrication facility or you can build air compressors. New businesses are needed. This would possibly help in bringing new technical and computer jobs. Need to promote technical education and entrepreneurship Understanding economic development and who is responsible for promoting it. Understanding that what looked good in 1970 doesn't look good now. Jobs Need companies/factory/industry that will employee lots of people Develop a new resident program. Work with Local governments to better understand regulations that impact businesses. Improve networking opportunities for the existing and new business persons. cooperation of local govt. leaders, for a common goal... Capital formation and technology stable work force Not enough skilled people to handle lots of employment opportunities The Bagnell Dam needs major repairs and better dam lighting. The current lites are too small and look silly. The entire dam area needs a face lift. Educated applicant pool Business need to look all around the county not just at the lake to help improve the way of life in Morgan County. Business need to look at small town and see how to invest in these small towns. Bring Business back to them and help breath new life into these small town and creating well paying jobs to help improve the way of life in the County and cities. We need to focus on not only the Lake and the bar business but the restaurant business, and business to bring in the 50 somethings back to the lake. The party atmosphere at the lake is the only thing I feel brings in the youth back (do we really always want to be know at the area with the Party Cove.. A need for the entertainment industry to come to the lake would be helpful. A place for adults to go and watch a play, get good food, watch a show maybe like a country act or even a rock and roll act would may be help bring back the middle aged and the young. I know recently the winery near Osage Beach has brought in some older country acts to their venue and may be that will be a start. I fell that a modernized arena for concerts sporting event would help bring in bigger acts that would help out the local business. A big name act performing at the lake would bring in money to the Hotels, the Restaurants, and the bar business, but it will take a modern in door or outdoor arena to bring this type of business to the area. This means you also need to start to clean up the area. Older building need to be tore down and tax breaks given to those who want to build in that old place and bring in a modern building and a modern business. Lake area needs a regional group that brings together east side, west side, and all the individual city and county governments to form a comprehensive resource sharing and planning committee. Too many small groups working independently of each other currently Public Transportation Job training Need more jobs in this area need local government to step up get more jobs, factories, and businesses in this area. Offer incentives to do so. Our local government is more worried about beautiful town, than jobs in this area. Need them to step up. renting out buildings do not have jobs if just for storage, jobs effect everything in this area from rentals to daycare, to food pantry. Lack of cohesive business camaraderie without bias towards competition. & Lack of skilled work force. Sorry, these are both equally important. Business Incentives Page 101
104 The need for major industry in the area or a major theme park operating year around; not an amusement park. I feel like one of the important factors would be to attract some more production job makers to our area. We have people that want to work and the availability of jobs will enable them to be part of our economy and productive members of our communities. The promotion of the small town businesses would be the greatest help. These businesses cannot always afford mass advertising and cannot get their names out to the general public without help, and without advertising of businesses the small towns are soon forgotten. Incentives for businesses Access and connectivity of high-speed resources Availability of capital funding options 1. Quality of and trained workforce 2. Finding new businesses that are not resort or seasonally oriented. 3. Having a clear roadmap of how entrepreneurs or startups can get help in starting and growing their businesses. Who to go to in what order. Many of the local resources like SCORE, SBA, Chamber of Commerces, UM Extension Council Business Development, EDAC, etc. are confusing as to the services they offer and how they are different. The region lacks the ability to retain top talent creating a less educated, skilled and qualified workforce. Lack of capital funding with the lenders not prepared to lend to non property secured. Tourism focused versus a healthy mix of non tourism businesses. We have the availability for more Agricultural businesses. We have the availability for more Manufacturing businesses. We have certain industries, in my opinion, that we are not capitalizing or expanding on (i.e. Hotel, Golf, Fishing). Center for Workforce Development 2008 Forum Links OTCConstructionFocusGroupReport.pdf OTCManufacturingFocusGroupReport.pdf OTCTransportationFocusGroupReport.pdf OTCHealthcareFocusGroupReport.pdf OTCTourismFocusGroupReport.pdf Page 102
105 Appendix III - National Establishment Time Series LOCLG - Total Regional Jobs by Industry NAICS Agriculture, Forestry, Fishing and Hunting Mining, Quarrying, and Oil and Gas Extraction Utilities Construction 4,068 3,929 4,043 4,277 4,495 4,451 Manufacturing 10,682 10,481 9,634 9,619 9,355 9,441 Wholesale Trade 1,884 1,774 1,756 1,813 1,798 1,890 Retail Trade 8,010 7,800 8,345 8,530 9,027 8,972 Transportation and Warehousing 1,228 1,230 1,270 1,243 1,204 1,281 Information Finance and Insurance 1,464 1,544 1,641 1,725 1,770 1,850 Real Estate and Rental and Leasing 1,615 1,631 1,754 1,801 1,886 2,007 Professional, Scientific, and Technical Services 1,683 1,721 1,828 1,964 1,973 2,134 Management of Companies and Enterprises Admin. and Support and Waste Management 1,638 1,591 2,282 3,762 4,205 4,524 Educational Services 3,461 3,204 3,105 3,153 3,110 3,123 Health Care and Social Assistance 4,581 4,048 4,173 4,208 4,253 4,550 Arts, Entertainment, and Recreation 1,605 1,437 1,321 1,258 1,247 1,290 Accommodation and Food Services 7,135 6,881 6,867 6,913 6,760 6,599 Other Services (Except Public Administration) 3,267 3,339 3,328 3,221 3,216 3,326 Public Administration 1,954 2,108 2,274 2,208 2,270 2,287 Undefined Total Jobs 56,477 55,018 55,855 57,861 58,733 60,021 Source: youreconomy.org, National Establishment Times Series Page 103
106 LOCLG - Total Regional Jobs by Industry (continued) NAICS Agriculture, Forestry, Fishing and Hunting ,065 1,026 1,286 1,322 Mining, Quarrying, and Oil and Gas Extraction Utilities Construction 4,590 3,998 4,053 4,012 3,958 3,480 Manufacturing 8,613 8,027 7,991 8,057 8,020 7,825 Wholesale Trade 1,893 1,818 1,963 1,910 1,867 1,754 Retail Trade 9,198 8,831 8,680 8,424 8,474 8,200 Transportation and Warehousing 1,335 1,207 1,276 1,348 1,306 1,212 Information Finance and Insurance 1,849 1,626 1,739 1,854 1,868 1,888 Real Estate and Rental and Leasing 2,133 1,893 2,048 2,046 1,943 1,715 Professional, Scientific, and Technical Services 1,847 1,683 2,015 2,025 2,198 1,967 Management of Companies and Enterprises Admin. and Support and Waste Management 5,332 5,433 6,417 5,469 4,188 3,436 Educational Services 3,180 3,337 3,327 3,823 4,041 4,588 Health Care and Social Assistance 4,638 4,320 4,475 4,635 4,881 5,037 Arts, Entertainment, and Recreation 1,516 1,389 1,371 1,346 1,338 1,275 Accommodation and Food Services 6,370 6,005 5,770 5,354 5,552 6,175 Other Services (Except Public Administration) 3,430 3,368 4,040 4,289 4,302 4,069 Public Administration 2,351 2,404 2,488 3,144 3,222 4,007 Undefined Total Jobs 60,583 57,472 59,982 60,092 59,688 59,198 Source: youreconomy.org, National Establishment Times Series Page 104
107 LOCLG - Resident vs. Nonresident Establishment Jobs Resident Jobs 1 2 to 9 10 to to Total ,249 14,862 20,512 8,770 6,062 52, ,292 14,872 20,426 7,607 5,527 50, ,647 15,325 20,596 7,825 5,027 51, ,663 16,573 20,960 8,819 3,727 53, ,990 16,918 21,124 9,132 3,427 54, ,536 17,704 21,106 9,058 3,427 55, ,912 18,659 21,405 9,181 2,127 56, ,192 17,464 20,212 9,064 2,127 53, ,526 18,823 19,570 8,904 2,127 54, ,462 18,718 19,744 9,008 2,127 54, ,335 18,734 19,862 9,504 2,127 53, ,676 17,886 20,278 9,539 2,127 52,506 Source: youreconomy.org, National Establishment Times Series Page 105
108 LOCLG - Resident vs. Nonresident Establishment Jobs Resident Jobs 1 2 to 9 10 to to Total ,100 4,875 2,650 10, ,053 4,326 2,650 9, ,951 4,337 2,150 9, ,079 5, , ,159 5, , ,976 4, , ,138 4, , ,498 4, , ,562 4, , ,824 4, , ,451 3, , ,400 3, ,102 Source: youreconomy.org, National Establishment Times Series Page 106
109 NAICS Code Definitions An overview of each NAICS code name and description of sub-industries considered a part of the overall industry. NAICS Name Agriculture, Forestry, Fishing and Hunting Mining, Quarrying, and Oil and Gas Extraction Utilities Construction Manufacturing Description Crop Production (including grain, vegetable, fruit, tobacco, cotton, and sugar farming) Animal Production and Aquaculture (including cattle, pig, poultry, and sheep production) Forestry and Logging Fishing, Hunting, and Trapping Support Activities for Agriculture and Forestry Oil and Gas Extraction Mining (including coal, iron ore, silver, copper, lead, etc.) Support Activities for Mining Utilities (including electric power generation, natural gas, and water, sewage and other systems) Construction of buildings Heavy and Civil Engineering Construction Specialty Trade Contractors (including roofing, framing, electrical, plumbing, etc.) Food manufacturing Beverage and Tobacco Product Manufacturing Textile Mills Textile Product Mills Apparel Manufacturing Leather and Allied Product Manufacturing Wood Product Manufacturing Paper Manufacturing Printing and Related Support Activities Petroleum and Coal Products Manufacturing Chemical Manufacturing Plastic and Rubber Products Manufacturing Nonmetallic Mineral Product Manufacturing Primary Metal Manufacturing Fabricated Metal Product Manufacturing Machinery Manufacturing Computer and Electronic Product Manufacturing Electrical Equipment. Appliance and Component Manufacturing Transportation Equipment Manufacturing Furniture and Related Products Manufacturing Miscellaneous Manufacturing Page 107
110 NAICS Name Whole Sale Retail Trade Transportation and Warehousing Information Description Merchant Wholesalers, durable goods (including cars, furniture, commercial equipment, industrial machinery, etc.) Merchant Wholesalers, nondurable goods (including paper, apparel, drugs, groceries, etc.) Wholesale Electronic Markets and Agents and Brokers Motor Vehicle and Parts Dealers Furniture and Home Furnishing Stores Electronic and Appliance Stores Building Material and Garden Equipment and Supplies Dealers Food and Beverage Stores Health and Personal Care Stores Gasoline Stores Clothing and Clothing Accessories Stores Sporting Goods, Hobby, Musical Instruments, and Book Stores General Merchandise Stores Miscellaneous Stores (including florists, office supplies, pet supplies, etc.) Nonstore retailers (including electronic shopping, vending machines, etc.) Air Transportation Rail Transportation Water Transportation Truck Transportation Transit and Ground Passenger Transportation Pipeline Transportation Scenic and Sightseeing Transportation Support Activities for Transportation Postal Service Warehousing and Storage Publishing Industries (Except Internet) Motion Picture and Sound Recording Industries Broadcasting (except Internet) Telecommunications Data Processing, Hosting, and Related Services Other Information Services Page 108
111 NAICS Name Finance and Insurance Real Estate and Rental and Leasing Professional, Scientific, and Technical Services Management of Companies and Enterprises Administrative and Support and Waste Management and Remediation Services Educational Services Description Monetary Authorities-Central Bank Credit Intermediation and Related Activities Securities, Commodity Contracts, and Other Financial Investments and Related Activities Insurance Carriers and Related Activities Funds, Trusts, and Other Financial Vehicles Real Estate Rental and Leasing Services Lessors of Nonfinancial Intangible Assets (except copyrighted works) Legal Services Accounting, Tax Preparation, Bookkeeping, and Payroll Services Architectural, Engineering, and Related Services Specialized Design Services Computer Systems Design and Related Services Management, Scientific, and Technical Consulting Services Scientific Research and Development Services Advertising, Public Relations, and Related Services Other Processional, Scientific, and Technical Services Offices of Bank Holding Companies Corporate, Subsidiary, and Regional Managing Offices Administrative and Support Services (including office admin., facility admin., employment services, collection agencies, travel agencies, investigation services, etc.) Waste Management and Remediation Services (including waste collection, waste treatment, waste landfill, materials recovery services, etc.) Elementary and Secondary Schools Junior Colleges Colleges, Universities, and Professional Schools, Business Schools and Computer and Management Training Technical and Trade Schools Other Schools and Instruction Educational Support Services Page 109
112 NAICS Name Health Care and Social Assistance Arts, Entertainment, and Recreation Accommodation and Food Services Other Services (except public administration) Public Administration Description Ambulatory Health Care Services (including physicians, dentist, outpatient care centers, home health care services, and other health practitioner offices) Hospitals Nursing and Residential Care Facilities Social Assistance (including child and youth services, family services, community food services, temporary shelters, child day care services, etc.) Performing Arts, Spectators Sports, and Related Industries Museums, Historical Sites, and Similar Institutions Amusement, Gambling, and Recreation Industries Accommodation Food Services and Drinking Places Repair and Maintenance (including automobile, electronics, industrial machinery, etc. repair) Personal and Laundry Services (including hair and nail salons, funeral homes, pet care, parking lots, etc.) Religious, Grantmaking, Civic, Professional, and Similar Services Private Households Executive, Legislative, and Other General Government Supports Justice, Public Order, and Safety Activities Administration of Human Resource Programs Administration of Environmental Quality Programs Administration of Housing Programs, Urban Planning, and Community Development Administration of Economic Programs Space Research and Technology National Security and International Affairs Page 110
113 Appendix IV - Industry Clusters Regional & County Level Industry Clusters LOCLG - Cluster LQ2002 LQ2012 Change Emp.2002 Emp.2012 Change Advanced materials , Agribusiness, food proc. & tech , Apparel & textiles Arts, entertainment, rec. tourism ,098 2, Biomedical/biotechnical ,061 3, Business & financial services ,224 1, Chemicals Defense & security ,926 2, Education & knowledge creation ,248 1, Energy ,024 1,953-1,071 Forest & wood products Glass & ceramics IT & telecomm , ,225 Transportation & logistics Manufacturing Supercluster ,499 3,622-1,877 Primary metal mfg Fabricated metal mfg Machinery mfg , Computer mfg Electric equip. mfg , ,157 Transportation equip. mfg ,105 1, Mining Printing & publishing Source: statsamerica.org Page 111
114 Camden County - Cluster LQ2002 LQ2012 Change Emp.2002 Emp.2012 Change Advanced materials Agribusiness, food proc. & tech Apparel & textiles Arts, entertainment, rec. tourism ,057 1, Biomedical/biotechnical ,482 1, Business & financial services Chemicals Defense & security Education & knowledge creation Energy Forest & wood products Glass & ceramics IT & telecomm Transportation & logistics Manufacturing Supercluster Primary metal mfg Fabricated metal mfg Machinery mfg Computer mfg Electric equip. mfg Transportation equip. mfg Mining Printing & publishing Source: statsamerica.org Page 112
115 Laclede County - Cluster LQ2002 LQ2012 Change Emp.2002 Emp.2012 Change Advanced materials Agribusiness, food proc. & tech Apparel & textiles Arts, entertainment, rec. tourism Biomedical/biotechnical ,006 1, Business & financial services Chemicals Defense & security ,755 1, Education & knowledge creation Energy , Forest & wood products Glass & ceramics IT & telecomm , Transportation & logistics Manufacturing Supercluster ,922 2,855-1,067 Primary metal mfg Fabricated metal mfg Machinery mfg Computer mfg Electric equip. mfg , Transportation equip. mfg ,706 1, Mining Printing & publishing Source: statsamerica.org Page 113
116 Miller County - Cluster LQ2002 LQ2012 Change Emp.2002 Emp.2012 Change Advanced materials Agribusiness, food proc. & tech Apparel & textiles Arts, entertainment, rec. tourism Biomedical/biotechnical Business & financial services Chemicals Defense & security Education & knowledge creation Energy Forest & wood products Glass & ceramics IT & telecomm Transportation & logistics Manufacturing Supercluster Primary metal mfg Fabricated metal mfg Machinery mfg Computer mfg Electric equip. mfg Transportation equip. mfg Mining Printing & publishing Source: statsamerica.org Page 114
117 Morgan County - Cluster LQ2002 LQ2012 Change Emp.2002 Emp.2012 Change Advanced materials Agribusiness, food proc. & tech Apparel & textiles Arts, entertainment, rec. tourism Biomedical/biotechnical Business & financial services Chemicals Defense & security Education & knowledge creation Energy Forest & wood products Glass & ceramics IT & telecomm Transportation & logistics Manufacturing Supercluster Primary metal mfg Fabricated metal mfg Machinery mfg Computer mfg Electric equip. mfg Transportation equip. mfg Mining Printing & publishing Source: statsamerica.org Page 115
118 Cluster Definitions The initial digits refer to the NAICS code associated with the specific sub-industry. Advanced Materials Clay and ceramic and refractory minerals mining Rubber and plastics footwear manufacturing Coated and laminated packaging paper and plastics film manufacturing All other converted paper product manufacturing Petroleum lubricating oil and grease manufacturing 3251 Basic chemical manufacturing 3252 Resin, synthetic rubber, and artificial synthetic fibers and filaments manufacturing Pesticide and other agricultural chemical manufacturing 3254 Pharmaceutical and medicine manufacturing (except ) 3255 Paint, coating, and adhesive manufacturing 3256 Soap, cleaning compound, and toilet preparation manufacturing Plastics packaging film and sheet (including laminated) manufacturing Unlaminated plastics film and sheet (except packaging) manufacturing Unlaminated plastics profile shape manufacturing Polystyrene foam product manufacturing All other plastics product manufacturing Other rubber product manufacturing Vitreous china, fine earthenware, and other pottery product manufacturing Porcelain electrical supply manufacturing Clay refractory manufacturing Nonclay refractory manufacturing Gypsum product manufacturing Abrasive product manufacturing Ground or treated mineral and earth manufacturing Mineral wool manufacturing 3311 Iron and steel mills and ferroalloy manufacturing 3312 Steel product manufacturing from purchased steel 3313 Alumina and aluminum production and processing (except ) 3314 Nonferrous metal (except aluminum) production and processing 3315 Foundries Iron and steel forging Metal stamping Powder metallurgy part manufacturing Plate work manufacturing Sheet metal work manufacturing Other fabricated wire product manufacturing Machine shops Metal coating, engraving (except jewelry and silverware), and allied services to manufacturers Electroplating, plating, polishing, anodizing, and coloring Industrial valve manufacturing Ball and roller bearing manufacturing Other ordnance and accessories manufacturing Industrial pattern manufacturing All other miscellaneous fabricated metal product manufacturing All other industrial machinery manufacturing Office machinery manufacturing Other commercial and service industry machinery manufacturing 3335 Metalworking machinery manufacturing (except ) Air and gas compressor manufacturing Other computer peripheral equipment manufacturing Radio and television broadcasting and wireless communications equipment manufacturing Other communications equipment manufacturing 3344 Semiconductor and other electronic component manufacturing 3345 Navigational, measuring, electromedical, control instruments manufacturing (except , 8) Electric lamp bulb and part manufacturing Relay and industrial control manufacturing Fiber optic cable manufacturing Current-carrying wiring device manufacturing Other motor vehicle electrical and electronic equipment manufacturing All other motor vehicle parts manufacturing Other guided missile and space vehicle parts and auxiliary equipment manufacturing Laboratory apparatus and furniture manufacturing Surgical and medical instrument manufacturing Surgical appliance and supplies manufacturing Gasket, packing, and sealing device manufacturing Testing laboratories 5417 Scientific research and development services Agribusiness, food proc. & tech. 111 Crop production 112 Animal production 1141 Fishing 1151 Support activities for crop production 1152 Support activities for animal production 311 Food manufacturing 312 Beverage and tobacco product manufacturing 3253 Pesticide, fertilizer, and other agricultural chemical manufacturing Agricultural implement manufacturing Food product machinery manufacturing Farm and garden machinery and equipment merchant wholesalers 4245 Farm product raw material merchant wholesalers Farm supplies merchant wholesalers Page 116
119 Apparel & Textiles 313 Textile mills 314 Textile product mills 315 Apparel manufacturing Commercial screen printing Synthetic dye and pigment manufacturing Artificial and synthetic fibers and filaments manufacturing Abrasive product manufacturing Mattress manufacturing Upholstered household furniture manufacturing Fastener, button, needle, and pin manufacturing 4243 Apparel, piece goods, and notions merchant wholesalers (except 42434) Graphic design services Other specialized design services Media representatives Display advertising Direct mail advertising Advertising material distribution services Other services related to advertising Arts, Entertainment, Recreation, & Tourism Sporting and athletic goods manufacturing Doll, toy, and game manufacturing Sporting and recreational goods and supplies merchant wholesalers 487 Scenic and sightseeing transportation 512 Motion picture and sound recording industries 515 Broadcasting (except internet) 5615 Travel arrangement and reservation services 711 Performing arts, spectator sports, and related industries 712 Museums, historical sites, and similar institutions 713 Amusement, gambling, and recreation industries 7211 Traveler accommodation 7212 RV (recreational vehicle) parks and recreational camps Biomedical/Biotechnical 3254 Pharmaceutical and medicine manufacturing Optical instrument and lens manufacturing Electromedical and electrotherapeutic apparatus manufacturing Analytical laboratory instrument manufacturing Irradiation apparatus manufacturing 3391 Medical equipment and supplies manufacturing Medical, dental, and hospital equipment and supplies merchant wholesalclusteers 446 Health and personal care stores 5417 Scientific research and development services Hazardous waste collection Hazardous waste treatment and disposal 621 Ambulatory health care services (except 6211, 6212, 6213) Business & Financial Services Digital printing Manifold business forms printing 518 Internet service providers, web search portals, and data processing services 5222 Nondepository credit intermediation 5223 Activities related to credit intermediation 523 Securities, commodity contracts, and other financial investments and related activities 524 Insurance carriers and related activities 525 Funds, trusts, and other financial vehicles 5313 Activities related to real estate (except ) 533 Lessors of nonfinancial intangible assets (except copyrighted works) 5411 Legal services 5412 Accounting, tax preparation, bookkeeping, and payroll services 5413 Architectural, engineering, and related services 5414 Specialized design services 5415 Computer systems design and related services 5416 Management, scientific, and technical consulting services 5418 Advertising and related services Marketing research and public opinion polling Commercial photography Chemicals 325 Chemical manufacturing 326 Plastics and rubber products manufacturing 327 Nonmetallic mineral product manufacturing 4246 Chemical and allied products merchant wholesalers 4247 Petroleum and petroleum products merchant wholesalers Page 117
120 Defense & Security Uranium-radium-vanadium ore mining Power and communication line and related structures construction Explosives manufacturing Fluid power valve and hose fitting manufacturing Small arms ammunition manufacturing Ammunition (except small arms) manufacturing Small arms manufacturing Other ordnance and accessories manufacturing Other communications equipment manufacturing Search, detection, navigation, guidance, aeronautical, and nautical system and instrument manufacturing 3364 Aerospace product and parts manufacturing 3366 Ship and boat building Military armored vehicle, tank, and tank component manufacturing Surgical appliance and supplies manufacturing 4231 Motor vehicle and motor vehicle parts and supplies merchant wholesalers Transportation equipment and supplies (except motor vehicle) merchant wholesalers 5415 Computer systems design and related services Research and development in the physical, engineering, and life sciences 5616 Investigation and security services Other personal and household goods repair and maintenance 922 Justice, public order, and safety activities Regulation and administration of transportation programs 927 Space research and technology 928 National security and international affairs Education & Knowledge Creation 611 Educational services Newspaper publishers Periodical publishers Book publishers 516 Internet publishing and broadcasting 519 Other information services Energy 211 Oil and gas extraction 2121 Coal mining 213 Support activities for mining (except ) Uranium-radium-vanadium ore mining 2211 Electric power generation, transmission and distribution 2212 Natural gas distribution Steam and air-conditioning supply 2371 Utility system construction 2379 Other heavy and civil engineering construction (includes dams and hydroelectric facilities) Electrical contractors Plumbing, heating, and air-conditioning contractors Petroleum refineries All other petroleum and coal products manufacturing Petrochemical manufacturing Industrial gas manufacturing Gum and wood chemical manufacturing (include coke and charcoal) Cyclic crude and intermediate manufacturing Ethyl alcohol manufacturing (includes ethanol manuf.) Power boiler and heat exchanger manufacturing Metal tank (heavy gauge) manufacturing Mining and oil and gas field machinery manufacturing Heating equipment (except warm air furnaces) manufacturing (includes solar & hydronic heating equipment Mfg) Turbine and turbine generator set units manufacturing Semiconductor and related device manufacturing Other measuring and controlling device manufacturing 3353 Electrical equipment manufacturing 3359 Other electrical equipment and component manufacturing Coal and other mineral and ore merchant wholesalers Electrical apparatus and equipment, wiring supplies, and related equipment merchant wholesalers Other electronic parts and equipment merchant wholesalers Plumbing and heating equipment and supplies (hydronics) merchant wholesalers 4247 Petroleum and petroleum products merchant wholesalers 447 Gasoline stations Fuel dealers 486 Pipeline transportation Miscellaneous intermediation (includes mineral and oil royalties dealing) Miscellaneous financial investment activities (includes oil and gas lease brokers) Construction, mining, and forestry machinery and equipment rental and leasing 533 Lessors of nonfinancial intangible assets (except copyrighted works) Engineering services Geophysical surveying and mapping services Testing laboratories Environmental consulting services Other scientific and technical consulting services Research and development in the physical, engineering, and life sciences Regulation and administration of communications, electric, gas, and other utilities Page 118
121 Forest & Wood Products 113 Forestry and logging 1153 Support activities for forestry Framing contractors Siding contractors Flooring contractors Finish carpentry contractors Roofing contractors 321 Wood product manufacturing 322 Paper manufacturing Books printing Gum and wood chemical manufacturing 3255 Paint, coating, and adhesive manufacturing Abrasive product manufacturing Saw blade and handsaw manufacturing Sawmill and woodworking machinery manufacturing Paper industry machinery manufacturing Power-driven handtool manufacturing 337 Furniture and related product manufacturing (except , , ) Musical instrument manufacturing Burial casket manufacturing 4232 Furniture and home furnishing merchant wholesalers 4233 Lumber and other construction materials merchant wholesalers Glass & Ceramics 3271 Clay product and refractory manufacturing 3272 Glass and glass product manufacturing 3273 Cement and concrete product manufacturing Ground or treated mineral and earth manufacturing All other miscellaneous nonmetallic mineral product manufacturing 3328 Coating, engraving, heat treating, and allied activities IT & Telecommunications Electrical contractors Mechanical power transmission equipment manufacturing Semiconductor machinery manufacturing 3341 Computer and peripheral equipment manufacturing 3342 Communications equipment manufacturing 3343 Audio and video equipment manufacturing 3344 Semiconductor and other electronic component manufacturing Automatic environmental control manufacturing for residential, commercial, and appliance use Instruments and related products manufacturing for measuring, displaying, and controlling industrial process variables Instrument manufacturing for measuring and testing electricity and electrical signals Analytical laboratory instrument manufacturing Watch, clock, and part manufacturing 3346 Manufacturing and reproducing magnetic and optical media 3353 Electrical equipment manufacturing 3359 Other electrical equipment and component manufacturing Computer and computer peripheral equipment and software merchant wholesalers Other electronic parts and equipment merchant wholesalers 5112 Software publishers 517 Telecommunications (except 5175) 518 Internet service providers, web search portals, and data processing services 5415 Computer systems design and related services Other management consulting services 5417 Scientific research and development services Regulation and administration of communications, electric, gas, and other utilities Transportation & Logistics 481 Air transportation 482 Rail transportation 483 Water transportation 484 Truck transportation Commuter rail systems 4855 Charter bus industry All other ground passenger transportation 486 Pipeline transportation 488 Support activities for transportation 492 Couriers and messengers 493 Warehousing and storage Manufacturing Supercluster 331 Primary metal manufacturing 332 Fabricated metal product manufacturing (except , 3, 4, 5) 333 Machinery manufacturing 334 Computer and electronic product manufacturing 335 Electrical equip, appliance and component manufacturing 336 Transportation equipment manufacturing Page 119
122 Mining 2122 Metal ore mining 2123 Nonmetallic mineral mining and quarrying Support activities for metal mining Support activities for nonmetallic minerals 482 Rail transportation Construction, mining, and forestry machinery and equipment rental and leasing Printing & Publishing 323 Printing and related support activities Printing ink manufacturing Sign manufacturing 511 Publishing industries (except Internet) Radio broadcasting Cable and other subscription programming 516 Internet publishing and broadcasting News syndicates All other information services Graphic design services Marketing consulting services 5418 Advertising and related services Marketing research and public opinion polling Commercial photography Page 120
123 Appendix V - Traded vs. Local Clusters Full Regional Cluster Mapping Data Traded Clusters - LOCLG Employment Cluster Name Production Technology and Heavy Machinery 1,725 2,555 2,680 2,565 2,690 Hospitality and Tourism 2,040 1,856 1,900 1,582 1,321 Water Transportation 1,475 1,866 1,555 1,151 1,231 Distribution and Electronic Commerce 1,402 1,395 1,445 1,760 1,203 Business Services , Automotive , Transportation and Logistics Upstream Metal Manufacturing Financial Services Lighting and Electrical Equipment 1,500 1,500 1, Wood Products Downstream Metal Products Marketing, Design, and Publishing Construction Products and Services Education and Knowledge Creation Furniture Plastics Agricultural Inputs and Services Performing Arts Food Processing and Manufacturing Source: clustermapping.us Page 121
124 Traded Clusters - LOCLG Source: clustermapping.us Employment Cluster Name Trailers, Motor Homes, and Appliances Printing Services Environmental Services Livestock Processing Leather and Related Products Apparel Insurance Services Nonmetal Mining Metalworking Technology Recreational and Small Electric Goods Forestry n/a n/a Communications Equipment and Services Information Technology and Analytical Instruments Textile Manufacturing Oil and Gas Production and Transportation n/a n/a n/a Downstream Chemical Products n/a Medical Devices 10 n/a Footwear n/a Jewelry and Precious Metals n/a n/a Vulcanized and Fired Materials n/a n/a 10 n/a n/a Biopharmaceuticals 10 n/a n/a n/a n/a Totals 13,710 14,616 15,204 12,230 12,009 Page 122
125 Local Clusters - LOCLG Employment Cluster Name Local Health Services 3,544 3,708 4,690 4,906 5,124 Local Hospitality Establishments 4,083 4,788 4,464 4,126 4,237 Local Real Estate, Construction, and Development Local Retailing of Clothing and General Merchandise 4,480 5,109 5,310 3,922 3,538 2,335 2,815 2,776 2,741 2,888 Local Motor Vehicle Products and Services 2,808 2,655 2,632 2,291 2,432 Local Commercial Services 1,487 1,689 1,429 1,427 1,662 Local Food and Beverage Processing and Distribution 1,652 1,496 1,394 1,274 1,479 Local Community and Civic Organizations 1,068 1,076 1,280 1,329 1,260 Local Financial Services 1,052 1,095 1,101 1,120 1,028 Local Household Goods and Services 1,097 1,033 1, Local Personal Services (Non-Medical) Local Entertainment and Media Local Logistical Services Local Utilities Local Education and Training Local Industrial Products and Services Totals 27,154 28,912 29,722 27,385 27,816 Source: clustermapping.us Page 123
126 Traded Cluster Definitions Traded Cluster Name Aerospace Vehicles and Defense Agricultural Inputs and Services Apparel Automotive Business Services Coal Mining Communications Equipment and Services Cluster Description Establishments in this cluster manufacture aircraft, space vehicles, guided missiles, and related parts. This cluster also contains firms that manufacture the necessary search and navigation equipment used by these products. This cluster includes establishments primarily engaged in farming and related services. Farming includes soil preparation, planting, cultivation, harvest, fertilizer creation, and post-harvest activities. It also includes services that supply farm labor, support for animal production, and additional operations management. The establishments in this cluster are focused on manufacturing clothing and fabric accessories (for example, hats, gloves, and neckties) for men, women, and children. This cluster includes establishments along the value chain that are necessary for manufacturing cars, trucks, and other motorized land-based transportation equipment (other than motorcycles). This includes metal mills and foundries, manufacturers of metal automotive parts, and manufacturers of completed automobiles. Firms in this cluster include establishments and services primarily designed to support other aspects of a business or to assist unrelated companies. This includes corporate headquarters. Professional services such as consulting, legal services, facilities support services, computer services, engineering and architectural services, and placement services. All for-hire ground passenger transportation services are also present in this cluster. This cluster includes establishments that mine coal and provide services to support coal mining. This cluster involves goods and services used for communications. This includes cable, wireless, and satellite services, as well as telephone, broadcasting, and wireless communications equipment. Page 124
127 Traded Cluster Name Construction Products and Services Distribution and Electronic Commerce Downstream Chemical Products Downstream Metal Products Education and Knowledge Creation Electric Power Generation and Transmission Cluster Description The establishments in this cluster supply construction materials, components, products, and services. Construction materials and components include those made of sand, stone, gravel, asphalt, cement, concrete, and other earthen substances. Construction products include pipes and heat exchangers. Construction services include the construction of pipelines for water, sewers, oil and gas, power, and communication, as well as building services for homes and industrial buildings. This cluster consists primarily of traditional wholesalers as well as mail order houses and electronic merchants. The companies in this cluster mostly buy, hold, and distribute a wide range of products such as apparel, food, chemicals, gasses, minerals, farm materials, machinery, and other merchandise. The cluster also contains firms that support distribution and electronic commerce operations, including packaging, labeling, and equipment rental and leasing. Establishments in this cluster manufacture complex chemical products for end users. These products include adhesives, beauty products, soaps, cleaners, film processing chemicals, dyes, paints, explosives, and lubricating oils. This cluster contains establishments that manufacture metal containers, prefabricated metal structures, and end user metal products. These end user products include ammunition, kitchenware, hardware, metal bathroom fixtures, and similar metal products used in home finishing such as doors, windows and ornamentation. This cluster contains all educational and training institutions, as well as related supporting establishments. It also includes research and development institutions in biotechnology, physical sciences, engineering, life sciences, and social sciences. This cluster contains establishments primarily engaged in generating and distributing electric power. This includes power generated from alternative energy sources such as hydroelectric power, nuclear electric power, and solar and wind generated electric power. Page 125
128 Traded Cluster Name Environmental Services Financial Services Fishing and Fishing Products Food Processing and Manufacturing Footwear Forestry Furniture Hospitality and Tourism Cluster Description This cluster contains establishments primarily engaged in collection, treatment, processing, and disposal of hazardous and non-hazardous waste. This cluster contains establishments involved in aiding the transaction and growth of financial assets for businesses and individuals. These firms include securities brokers, dealers, and exchanges; credit institutions; and financial investment support. Insurance firms are located in a separate Insurance Services cluster. Establishments in this cluster are engaged primarily in catching fish and other seafood and processing the catch for consumption. This cluster includes firms involved in the processing of raw food materials and the manufacturing of downstream food products for end users. This includes millers and refineries of rice, flour, corn, sugar, and oilseeds. These upstream products contribute in part to producing specialty foods, animal foods, baked goods, candies, teas, coffees, beers, wines, other beverages, meats, packaged fruits and vegetables, and processed dairy products. Establishments in this cluster are those that manufacture men s and women s shoes, boots, slippers, and other footwear (including athletic shoes). This cluster also contains the upstream finished leather used in making footwear. Establishments in this cluster are those that involve growing and harvesting trees. It also includes support services for these activities. This cluster contains establishments that manufacture furniture, cabinets, and shelving for residential homes and offices. It also includes establishments that produce manufactured homes. The products in this cluster can be made of wood, metal, plastic, and/or textiles. This cluster contains establishments related to hospitality and tourism services and venues. This includes sport venues, casinos, museums, and other attractions. It also includes hotels and other accommodations, transportation, and services related to recreational travel such as reservation services and tour operators. Page 126
129 Traded Cluster Name Information Technology and Analytical Instruments Insurance Services Jewelry and Precious Metals Leather and Related Products Lighting and Electrical Equipment Livestock Processing Marketing, Design, and Publishing Medical Devices Metal Mining Cluster Description This cluster consists of information technology and analytical products such as computers, software, audio visual equipment, laboratory instruments, and medical equipment. The cluster also includes the standard and precision electronics used by these products (for example, circuit boards and semiconductor devices). This cluster consists of firms providing a range of insurance types, as well as support services such as reinsurance and claims adjustment. Establishments in this cluster manufacture jewelry, silverware, and fine tableware. This cluster also includes the upstream manufacture of jewelry parts and the processing of gemstones. This cluster consists of manufacturers of luggage and handbags made of leather and fabric. It also includes producers of personal and assorted other leather goods, as well as mills that produce textile bags and related products made from canvas. This cluster contains firms involved in the manufacture of electrical equipment and electronic components. The companies in this cluster manufacture wire for communications, wiring devices, fiber optic cables, switchboards, lighting fixtures, motors, transformers, and related products. This cluster contains establishments engaged in processing meat from livestock and livestock wholesaling. This cluster consists of establishments involved in design services (physical and graphical), marketing (including advertising creation, marketing research, media buying, and public relations), and publishing (both in hard copy and on the internet). Establishments in this cluster primarily manufacture surgical, medical, dental, optical, ophthalmic, and veterinary instruments and supplies. Establishments in this cluster mine various metals including iron, gold, silver, lead, copper, and uranium. It also includes firms involved in supporting metal mining activities. Page 127
130 Traded Cluster Name Metalworking Technology Music and Sound Recording Nonmetal Mining Oil and Gas Production and Transportation Paper and Packaging Performing Arts Plastics Printing Services Cluster Description The establishments in this cluster manufacture machine tools and process metal for use in metal working. The cluster also contains the downstream manufacture of metal fasteners and hand tools. Establishments in this cluster are primarily involved in the production and distribution of music and other sound recordings. Establishments in this cluster mine earthen materials other than metals. This includes stone, granite, sand, clay, borate, and other minerals. The cluster also includes support for the nonmetal mining activities. This cluster includes firms involved in locating, extracting, refining, and transporting oil and gas. This includes companies that manufacture the equipment necessary to extract oil and gas, as well as companies that provide support services for oil and gas operations and pipeline transport. This cluster contains the paper mills and manufacturers of paper products used for shipping, packaging, containers, office supplies, personal products, and similar products. This cluster contains services that produce, promote, and support live artistic performances. Live performances include those by theater companies, dance troupes, musicians, and independent artists. Establishments in this cluster manufacture plastic materials, components, and products. The plastics and foams are manufactured for packaging, pipes, floor coverings, and related plastic products. The cluster also includes the upstream manufacturing of plastic materials and resins, as well as the industrial machines used to manufacture plastics. Establishments in this cluster are primarily engaged in commercial printing, digital printing, and binding. The cluster includes upstream products and services necessary for printing (for example, ink and prepress services). It also includes end products such as books, greeting cards, business forms, and related goods. Page 128
131 Traded Cluster Name Production Technology and Heavy Machinery Recreational and Small Electric Goods Textile Manufacturing Trailers, Motor Homes, and Appliances Transportation and Logistics Upstream Chemical Products Upstream Metal Manufacturing Video Production and Distribution Cluster Description Establishments in this cluster primarily manufacture machines designed to produce parts and devices used in the production of downstream products. This cluster also includes end use heavy machinery such as air and material handling equipment. The machines are used for industrial, agricultural, construction, commercial industry, and related purposes. This cluster contains establishments that manufacture end use products for recreational and decorative purposes. These products include games, toys, bicycles, motorcycles, musical instruments, sporting goods, art supplies, office supplies, shades, and home accessories. This cluster also incorporates firms that produce small, simple electric goods like hairdryers, fans, and office machinery. This cluster contains textile mills that primarily produce and finish fabrics for clothing, carpets, upholstery, and similar uses. The textiles include yarn, thread, fibers, hosiery, knits, and other specialty fabrics. This cluster includes establishments that manufacture trailers, campers, and motor homes, as well as major household appliances. This cluster contains all air, rail, bus, and freight transportation services. It also includes related operation services and support activities such as inspections, maintenance, repairs, security, and loading/unloading. This cluster consists of firms that manufacture basic organic and inorganic chemicals and gases. The chemicals are usually separate elements that could be used as inputs for more complex downstream chemical products. The establishments in this cluster manufacture upstream metal products such as pipes, tubes, metal closures, wires, springs, and related products. The cluster includes iron and steel mills and foundries, as well as related metal processing techniques. The establishments in this cluster are primarily involved with the production and distribution of motion pictures and other video. This includes specialized viewing venues such as drive-in theaters. Page 129
132 Traded Cluster Name Vulcanized and Fired Materials Water Transportation Wood Products Cluster Description This cluster contains firms that manufacture construction and other materials out of earthen substances such as clay, sand, and rubber at extremely high temperatures. The production processes create goods made of tile, brick, ceramic, glass, and rubber (including refractories and tires). This cluster contains all establishments involved in transporting people and goods over water. The cluster includes boat building, transportation, operations, and other support services. The establishments in this cluster are primarily engaged in making upstream wood materials and manufacturing non-furniture wood products. Upstream establishments include sawmills, plywood and hardwood manufacturers, cut stock manufacturers, and wood preservation services. Downstream establishments produce windows, doors, flooring, wood containers, prefabricated wood buildings, and related product Local Cluster Definitions Local Cluster Name Local Food and Beverage Processing and Distribution Local Personal Services (Non- Medical) Local Health Services Cluster Description This cluster contains firms that sell food and beverages at the wholesale and retail levels. Products sold include meat, seafood, fruit and vegetables, general groceries, tobacco, alcoholic beverages, and specialty foods. The cluster also includes related distribution methods such as vending and direct selling. Establishments in this cluster provide local personal services including self-service laundry, hair care, photofinishing, repair services, and child care. This cluster also contains pet stores and retail stores for certain personal merchandise such as cosmetics. Firms in this cluster include local health care establishments and services such as hospitals, medical laboratories, home and residential care, and funeral services and crematories. This cluster also includes pharmacies and optical goods retail stores. Page 130
133 Local Cluster Name Local Utilities Local Logistical Services Local Household Goods and Services Local Financial Services Local Motor Vehicle Products and Services Local Retailing of Clothing and General Merchandise Local Entertainment and Media Local Hospitality Establishments Cluster Description Establishments in this cluster provide local communications services, energy distribution, as well as sanitary services for sewage and waste treatment. This cluster primarily contains establishments that offer local passenger transportation and local transportation of freight and goods, including moving companies and couriers. This cluster also includes local storage facilities, truck and RV leasing, and passenger car rental services. This cluster contains local establishments and services designed to support individual households such as landscape services, electronics repair, as well as retail stores for appliances, hardware, gardening, and furniture. This cluster contains local establishments that facilitate financial transactions for both businesses and individuals, such as deposit-taking institutions, thirdparty administrative services for pension and welfare funds, insurance agencies, tax preparation services, and payment collection agencies. Establishments in this cluster consist of local motor vehicle wholesalers and dealers, as well as auto repair services, gas stations, parking lots, car washes, and vehicle towing. This cluster consists of local retail stores, department stores, and warehouse clubs that sell apparel, jewelry, luggage, sewing supplies, and general merchandise. Establishments in this cluster primarily sell or otherwise distribute various media locally. The cluster includes newspaper publishers, radio and TV broadcasting stations, and movie theaters. It also contains local retail establishments that sell or rent books, music, movies, sport and hobby goods, and electronics. Establishments in this cluster primarily consist of local hospitality establishments that serve food and beverages (alcoholic and non-alcoholic), as well as recreational facilities including country clubs, fitness clubs, and bowling centers. This cluster also contains gift and souvenir retail stores. Page 131
134 Local Cluster Name Local Commercial Services Local Education and Training Local Community and Civic Organizations Local Real Estate, Construction, and Development Local Industrial Products and Services Cluster Description This cluster contains local professional establishments that provide legal services, accounting services, temporary help, and office administrative activities. This cluster also contains building support and security services, commercial printing and signmaking, professional laundry services (including drycleaning), testing laboratories, and office supply stores. Establishments in this cluster include local educational institutions. These include schools for elementary and secondary education, technical and vocational training, fine arts instruction, as well as automobile driving. Establishments in this cluster primarily consist of local social service organizations such as community food and housing services and advocacy organizations. This cluster also contains grantmaking foundations, business associations, and political and religious organizations. Establishments in this cluster primarily provide local real estate services, general contracting, and specialty contracting for the building, purchasing, and renting of homes and related local infrastructure. This cluster also contain firms that support land development, concrete manufacturing, highway and street construction, as well as building equipment distribution This cluster primarily consists of firms that provide maintenance, wholesaling, and distribution for local industrial goods and services. This cluster also includes consumer rental and leasing for electronics, appliances, and general equipment. Page 132
135 Appendix VI - Innovation Index LOCLG - Human Capital - Innovation Index Human Capital % of Adult Pop. w. some College or Associate s Degree (2012) % of Adult Pop. w. Bachelor s Degree or Higher (2012) % Change in Young Adult Pop. ( ) Ave, High- Tech Employment Share ( ) Tech-based Knowledge Occupation Share (2011) Camden % 21.4% -0.1% 1.7% 9.6% Laclede % 14.5% -0.3% 1.8% 12.9% Miller % 14.5% -0.8% 1.6% 9.0% Morgan % 13.8% -0.8% 0.9% 9.6% LOCLG % 16.9% -0.4% 1.7% 10.6% MO % 28.0% -0.5% 3.7% 12.0% U.S % 30.2% -0.2% 4.7% 12.2% Source: statsamerica.org LOCLG - Economic Dynamics - Innovation Index Economic Dynamics Ave. VC Invest. per $10,000 GDP ( ) Broadband Density (2012) Ave. Annual % Change in Broadband Providers ( ) Ave. Estab. Churn ( ) Ave. Small Estab. per 10,000 Workers ( ) Ave. Large Estab. per 10,000 Workers ( ) Camden 89.8 $ % 78.4% Laclede 91.0 $ % 73.3% Miller 84.9 $ % 76.0% Morgan 79.4 $ % 73.3% LOCLG 86.4 $ % 76.0% MO 91.0 $ % 76.1% U.S. 100 $ % 76.4% Source: statsamerica.org Page 133
136 LOCLG - Productivity & Employment- Innovation Index Productivity & Employment % Change in High-tech Emp. Share ( ) Job Growthto-Population Growth Ratio ( ) GDP per Worker (2011) % Change in GDP per Worker ( ) Ave. Patents per 1,000 Workers ( ) Camden % 0.51 $52, % 0.22 Laclede % $60, % 0.08 Miller % $53, % 0.03 Morgan % $47, % 0.12 LOCLG % 0.11 $54, % 0.13 MO % 0.28 $62, % 0.23 U.S % 0.49 $74, % 0.50 Source: statsamerica.org LOCLG - Economic Well-Being Innovation Index Economic Well- Being Poverty Rate, 3- year Ave. ( ) Unemp. Rate, 3- year Ave. ( ) Ave. Net Internal Migration Rate/10,000 Residents ( ) % Change in Per Capita Personal Income ( ) % Change in Ave. Wage and Salary Earnings ( ) % Change in Ave. Proprietors Income ( ) Camden % 10.2% % 3.2% 0.8% Laclede % 10.5% % 2.9% 0.4% Miller % 10.7% % 2.8% 1.0% Morgan % 10.7% % 3.4% 2.0% LOCLG % 10.5% % 3.0% 0.8% MO % 8.3% % 3.1% 1.5% U.S % 8.9% % 3.4% 1.0% Source: statsamerica.org Page 134
137 Sources American Economic Development Institute (2014), Pollina Corporate Top 10 Pro-Business States for Business-States-for-2014.pdf Bureau of Labor Statistics Chattanooga State Community College (2014) - DNR (2015) Missouri Department of Natural Resources - Edward Lowe Foundation Haltiwanger, John, Jarmin, Ron, and Miranada, Javier (2013) - Who Creates Jobs? Small Versus Large Versus Young, The Review of Economics and Statistics Indiana Business Research Center Macke Donald, Markley, Deborach, and Fulwider, John (2014) - Energizing Entrepreneurial Communities A Pathway to Prosperity, Center for Rural Entrepreneurship Missouri Senior Report (2013) - University of Missouri and Department of Health and Senior Services - MoneyTree by National Venture Capital and PricewaterhouseCoopers, Office of Missouri Governor, Jay Nixon (2014), Gov. Nixon congratulates the Missouri Department of Economic Development on being named the best economic development agency in the country - gov.mo.gov/news/archive/gov-nixon-congratulates-missouri-department-economic-development-beingnamed-best Porter, Michael (1990), The Competitive Advantage of Nations. Stapleton, James (2012) - Transforming Community Economies, Delta Regional Authority U.S. Census U.S. Cluster Mapping Kleiner, Morris M. (2014), Why License a Florist?, New Yowk Times. opinion/why-license-a-florist.html?_r=0 Page 135
138 Contact Information Institute for Regional Innovation and Entrepreneurship Southeast Missouri State University 920 Broadway Cape Girardeau, MO (573) Page 136

139 www. eda. gov U. S. Depa r t mentofcommer c e 1401Cons t i t ut i onav enue, NW S ui t e71014 Wa s hi ngt on, DC20230 Phone: ( 202)
Economic Trends and Florida s Competitive Position
 Economic Trends and Florida s Competitive Position presented to Florida Department of Economic Opportunity Small Business Forum presented by John Kaliski Cambridge Systematics, Inc. March 22, 2012 Presentation
energy industry chain) CE3 is housed at the
 CE3 is housed at the") ESTABLISHING AN APPALACHIAN REGIONAL ENERGY CLUSTER Dr. Benjamin J. Cross, P.E., Executive in Residence, Ohio University Voinovich School of Leadership and Public Affairs, February 2016 Value Proposition
ESTABLISHING AN APPALACHIAN REGIONAL ENERGY CLUSTER Dr. Benjamin J. Cross, P.E., Executive in Residence, Ohio University Voinovich School of Leadership and Public Affairs, February 2016 Value Proposition
How Technology-Based Start-Ups Support U.S. Economic Growth
 How Technology-Based Start-Ups Support U.S. Economic Growth BY J. JOHN WU AND ROBERT D. ATKINSON NOVEMBER 2017 Policymakers should focus on spurring highgrowth, technologybased start-ups. These firms,
Economic Development Strategic Plan Executive Summary Delta County, CO. Prepared By:
 Economic Development Strategic Plan Executive Summary Delta County, CO Prepared By: 1 Introduction In 2015, Region 10, a 501(c)(3) Economic Development District that services six counties in western Colorado,
Questions and Answers Florida Department of Economic Opportunity Employment and Unemployment Data Release July 2018 (Released August 17, 2018)
") Questions and Answers Florida Department of Economic Opportunity Employment and Unemployment Data Release July 2018 (Released August 17, 2018) 1. What are the current Florida labor statistics and what
Questions and Answers Florida Department of Economic Opportunity Employment and Unemployment Data Release July 2018 (Released August 17, 2018) 1. What are the current Florida labor statistics and what
BUSINESS INCUBATION COMMUNITY READINESS ASSESSMENT Dalton-Whitfield County. October 17, 2012 Erin Rosintoski
 BUSINESS INCUBATION COMMUNITY READINESS ASSESSMENT Dalton-Whitfield County October 17, 2012 Erin Rosintoski 1 Outline 1. Introduction & Process 2. Data Collection 3. Analysis 4. Recommendations 2 Incubation
STATE ENTREPRENEURSHIP INDEX
 University of Nebraska - Lincoln DigitalCommons@University of Nebraska - Lincoln Business in Nebraska Bureau of Business Research 12-2013 STATE ENTREPRENEURSHIP INDEX Eric Thompson University of Nebraska-Lincoln,
The New Carolina Initiative
 The New Carolina Initiative Professor Michael E. Porter Harvard Business School New Carolina Annual Celebration September 22, 2011 For further material on regional competitiveness and clusters: www.isc.hbs.edu/econ-clusters.htm
Lakes Region Planning Commission SWOT Analysis & Recommendations
 Lakes Region Planning Commission SWOT Analysis & Recommendations The results of a SWOT survey administered to the CEDS Committee were presented to the Committee in late April, at which time they were discussed
U.S. Hiring Trends Q3 2015:
 U.S. Hiring Trends Q3 2015: icims Quarterly Report on Employer & Job Seeker Behaviors 2017 icims Inc. All Rights Reserved. Table of Contents The following report presents job creation and talent supply
SAN FRANCISCO 2014 UPDATE
 SAN FRANCISCO 2014 UPDATE SAN FRANCISCO 2014 UPDATE Executive Summary and Introduction 4 TABLE OF CONTENTS Overview of the 2007 Economic Strategy 6 Economic Strategy Framework: Sustainable Prosperity Framework
REPORT ON AMERICA S SMALL BUSINESSES
 THE MEGAPHONE OF MAIN STREET: REPORT ON AMERICA S SMALL BUSINESSES presented by Contact SCORE: media@score.org 703.487.3677 www.score.org 2017 Volume 1 TABLE OF CONTENTS Executive Summary...2 What Makes
The 2012 Texas Rural Survey: Economic Development Strategies and Efforts
 The 2012 Texas Rural Survey: Economic Development Strategies and Efforts Gene L. Theodori and Cheryl L. Hudec The Rural Reality Rural areas are home to many of the industrial, agricultural, cultural, and
SHASTA EDC BUSINESS PLAN
 SHASTA EDC BUSINESS PLAN 2016-2017 TABLE OF CONTENTS Vision, Mission, Principles & Values 3 Responsibilities & Focus 4 Company Recruitment 5-7 Business Expansion & Retention 8 Entrepreneurial Development
STATE AND REGIONAL DEVELOPMENT STRATEGY East Central Region BACKGROUND THE REGION
 BACKGROUND STATE AND REGIONAL DEVELOPMENT STRATEGY East Central Region Since 1999, the Illinois Department of Commerce and Economic Opportunity (formerly The Illinois Department of Commerce and Community
Reclaiming Prosperity in Boise Designing a Sustainable Future in the New West. Planning in the West Conference Boise, ID Mark Muro June 4, 2010
 Reclaiming Prosperity in Boise Designing a Sustainable Future in the New West Planning in the West Conference Boise, ID Mark Muro June 4, 2010 A time of reckoning Challenges and emerging opportunities
Economic Trends and Florida s Competitive Position
 Economic Trends and Florida s Competitive Position presented to Florida Department of Economic Opportunity Strategic Plan Regional Stakeholder Forum presented by John Kaliski Cambridge Systematics, Inc.
Digital Economy.How Are Developing Countries Performing? The Case of Egypt
 Digital Economy.How Are Developing Countries Performing? The Case of Egypt by Nagwa ElShenawi (PhD) MCIT, Egypt Produced for DIODE Network, 217 Introduction According to the OECD some of the most important
Regional Projections to 2040: Methodology and Results. Stephen Levy, CCSCE Presentation to ABAG Regional Planning Committee April 4, 2012
 Regional Projections to 2040: Methodology and Results Stephen Levy, CCSCE Presentation to ABAG Regional Planning Committee April 4, 2012 Overview Best Practice Methodology for Regional Projections Developing
of American Entrepreneurship: A Paychex Small Business Research Report
 2018 Accelerating the Momentum of American Entrepreneurship: A Paychex Small Business Research Report An analysis of American entrepreneurship during the past decade and the state of small business today
2017 SURVEY OF ENTREPRENEURS AND MSMES IN VIETNAM
 2017 SURVEY OF ENTREPRENEURS AND MSMES IN VIETNAM Building the capacity of MSMEs through technology and innovation 2017 SURVEY OF ENTREPRENEURS AND MSMES IN VIETNAM I 1 2017 SURVEY OF ENTREPRENEURS AND
The Economic Impacts of the New Economy Initiative in Southeast Michigan
 pwc.com/us/nes The Economic Impacts of the New Economy Initiative in Southeast Michigan The Economic Impacts of the New Economy Initiative in Southeast Michigan June 2016 Prepared for The Community Foundation
GREATER PHOENIX ECONOMIC SNAPSHOT Chris Camacho, President & CEO
 GREATER PHOENIX ECONOMIC SNAPSHOT Chris Camacho, President & CEO 1 2 THE GREATER PHOENIX ECONOMIC COUNCIL GREATER PHOENIX About the Greater Phoenix Economic Council (GPEC) 3 Our mission is to attract quality
New Brunswick Information & Communications Technology Sector Strategy
 N E W B R U N S W I C K New Brunswick Information & Communications Technology Sector Strategy alue-added Food 2012-2016 Information and Communications Technology Biosciences Aerospace Biosciences Aerospace
THE HEALTHCARE CLUSTER
 Prepared by: Iryna Lendel The Center for Economic Development Maxine Goodman Levin College of Urban Affairs as part of: The CSU Presidential Initiative for Economic Development THE HEALTHCARE CLUSTER IN
NYC Quarterly Labor Market Brief
 Bronx NYC Quarterly Labor Market Brief Employment and labor force highlights in New York City and its five boroughs This brief was prepared for the New York City Workforce Funders by NYCLMIS CUNY Graduate
Case: Building on Economic Assets in Akron, Ohio after the Decline of the Tire Industry 1
 Case: Building on Economic Assets in Akron, Ohio after the Decline of the Tire Industry 1 COMMUNITY PROFILE Once known as the rubber capital of the world, Akron has had to reinvent its economic base and
NYC Quarterly Labor Market Brief
 Q2 2018 Queens NYC Quarterly Labor Market Brief Employment and labor force highlights in New York City and its five boroughs This brief was prepared for the New York City Workforce Funders by NYCLMIS CUNY
2012 CEDS PLAN. Comprehensive Economic Development Strategy Committee. July 12, Treasure Coast Regional Planning Council
 2012 CEDS PLAN Comprehensive Economic Development Strategy Committee July 12, 2012 Treasure Coast Regional Planning Council Topics of Discussion: CEDS 2012 Project Portal Draft 2012 CEDS Plan CEDS Project
The role of education in job seekers employment histories
 The role of education in job seekers employment histories February 2018 Traditional labor market theories assume that higher levels of education and greater work experience produce better employment outcomes
County Commissioners Association of Ohio
 County Commissioners Association of Ohio Lunch and Learn: County Economic Development Essentials February 10, 2015 Mark Barbash Executive Vice President Finance Fund February 10, 2015 Presentation by Mark
City of Tacoma Community & Economic Development Department Business Plan: Prosperity on Purpose for the City of Destiny*
 City of Tacoma Community & Economic Development Department Business Plan: Prosperity on Purpose for the City of Destiny* City Vision The City of Tacoma will be recognized as a livable and progressive international
State Profile on Job Creation and Economic Growth. Colorado
 State Profile on Job Creation and Economic Growth Colorado NATIONAL GOVERNORS ASSOCIATION CHAIR S INITIATIVE Growing State Economies Growing State Economies, the National Governors Association Chair s
Prosperity and Growth Strategy for Northern Ontario
 Technology Companies Communities Prosperity and Growth Strategy for Northern Ontario A plan for economic development, inclusiveness and success April 9, 2018 Prosperity and Growth Strategy for Northern
Results of the Clatsop County Economic Development Survey
 Results of the Clatsop County Economic Development Survey Final Report for: Prepared for: Clatsop County Prepared by: Community Planning Workshop Community Service Center 1209 University of Oregon Eugene,
What Job Seekers Want:
 Indeed Hiring Lab I March 2014 What Job Seekers Want: Occupation Satisfaction & Desirability Report While labor market analysis typically reports actual job movements, rarely does it directly anticipate
Chapter 9: Economic Development
 Chapter 9: Economic Development 9.0 Accomplishments Since 2007 As the economic driver for the State, New Castle County continues to review development regulations and offer additional incentives and enhancements
The Upper Peninsula of Michigan: Opportunities for growth and development in the economy!
 The Upper Peninsula of Michigan: Opportunities for growth and development in the 2007-2015 economy! Prepared on Jan 16, 2009 for Operation Action Upper Peninsula By Tawni Hunt Ferrarini, PhD, Sam M. Cohodas
Economic Development Strategy
 2018-2022 Economic Development Strategy www.oro-medonte.ca/business 2 Fred Hummel - Sculptor Table of Contents Lake Simcoe Regional Airport Executive Summary... Page 5 Economic Development in Oro-Medonte...
Industry Market Research release date: November 2016 ALL US [238220] Plumbing, Heating, and Air-Conditioning Contractors Sector: Construction
![Industry Market Research release date: November 2016 ALL US [238220] Plumbing, Heating, and Air-Conditioning Contractors Sector: Construction](/thumbs/80/81994465.jpg "Industry Market Research release date: November 2016 ALL US [238220] Plumbing, Heating, and Air-Conditioning Contractors Sector: Construction") Industry Market Research release date: November 2016 ALL US [238220] Plumbing, Heating, and Air-Conditioning Contractors Sector: Construction Contents P1: Industry Population, Time Series P2: Cessation
Industry Market Research release date: November 2016 ALL US [238220] Plumbing, Heating, and Air-Conditioning Contractors Sector: Construction Contents P1: Industry Population, Time Series P2: Cessation
CEDS ADVISORY COMMITTEE SWOT FOUR PRIORITY GOALS WORKFORCE & EDUCATION
 CEDS ADVISORY COMMITTEE SWOT FOUR PRIORITY GOALS WORKFORCE & EDUCATION Large, educated and growing young professional population UNC Charlotte, strong technical institutes and private colleges Strong community
U.S. Startup Outlook 2017
 U.S. Startup Outlook 2017 A SILICON VALLEY BANK SURVEY OF U.S. ENTREPRENEURS ABOUT BUSINESS CONDITIONS AND POLICY PRIORITIES @SVB_Financial #StartupOutlook Strength in the Innovation Sector Silicon Valley
European Startup Monitor Country Report Portugal
 European Startup Monitor Country Report Portugal Introduction Throughout Europe, Startup ecosystems have become a serious and inspiring movement to fight back unemployment, stimulate the local economy,
Q4 & Annual 2017 HIGHER EDUCATION. Employment Report. Published by
 Q4 & Annual 2017 HIGHER EDUCATION Employment Report Published by ACE FELLOWS ENHANCE AND ADVANCE FELLOWS PROGRAM American Council on Education HIGHER EDUCATION. With over five decades of success, the ACE
ENTREPRENEURSHIP IN IRELAND Global Entrepreneurship Monitor (GEM)
") ENTREPRENEURSHIP IN 2017 Global Entrepreneurship Monitor (GEM) A SURVEY OF ENTREPRENEURSHIP IN GLOBAL ENTREPRENEURSHIP MONITOR (GEM) THE 2017 SURVEY OF ENTREPRENEURSHIP IN PAULA FITZSIMONS Fitzsimons Consulting
ENTREPRENEURSHIP IN 2017 Global Entrepreneurship Monitor (GEM) A SURVEY OF ENTREPRENEURSHIP IN GLOBAL ENTREPRENEURSHIP MONITOR (GEM) THE 2017 SURVEY OF ENTREPRENEURSHIP IN PAULA FITZSIMONS Fitzsimons Consulting
GUIDELINES OF ENTREPRENEURSHIP FOR INDIAN YOUTH
 GUIDELINES OF ENTREPRENEURSHIP FOR INDIAN YOUTH OBJECTIVES There are approximately 100 million unemployed and underemployed young people aged 16 to 30 years in our country. At least 20% of these young
E c o n o m i c D e v e l o p m e n t P r o b l e m s a n d O p p o r t u n i t i e s
 Economic Development Problems and Opportunities The regional problems and opportunities will drive the strategy for development in the future. This section will identify past, present, and projected future
September 14, 2009 Nashville, Tennessee
 Your New Jobs May Be Homegrown: Entrepreneurship as an Economic Development Strategy Brian Dabson Governor s Conference on Economic and Community Development Nashville, Tennessee Public perception of entrepreneurs
NYC Quarterly Labor Market Brief
 New York City NYC Quarterly Labor Market Brief Employment and labor force highlights in New York City and its five boroughs This brief was prepared for the New York City Workforce Funders by NYCLMIS CUNY
Economic Development Plan For Kent County, Maryland
 Economic Development Plan For Kent County, Maryland October 2013 FINAL Submitted by: Kent County Economic Development Advisory Board File: Economic Development Office: EDAB_Plan_final_2013_10_02.doc Economic
GEM UK: Northern Ireland Summary 2008
 1 GEM : Northern Ireland Summary 2008 Professor Mark Hart Economics and Strategy Group Aston Business School Aston University Aston Triangle Birmingham B4 7ET e-mail: mark.hart@aston.ac.uk 2 The Global
CITY OF PROVIDENCE: ECONOMIC CLUSTER STRATEGY. Presentation to City Council Final Analysis November 18 th, 2015
 CITY OF PROVIDENCE: ECONOMIC CLUSTER STRATEGY Presentation to City Council Final Analysis November 18 th, 2015 CONTENTS I. Goals and Preview II. III. IV. Economic Foundation Clusters and Actions Recommendations
Metro Denver and Northern Colorado Key Industry Clusters Executive Summary
 Metro Denver and Northern Colorado Key Industry Clusters Executive Summary This study is based on the concept of industry clusters, which are geographic concentrations of interconnected companies and institutions
The University of British Columbia
 The following information is an excerpt from the Letter of Intent submitted to the J.W. McConnell Family Foundation in response to the RECODE Request for Proposals of Spring 2014. The University of British
ECONOMIC DEVELOPMENT PROGRAMS
 ECONOMIC DEVELOPMENT PROGRAMS K ENTUCKY CABINET FOR ECONOMIC DEVELOPMENT: (502) 564-7670 - The Cabinet is the primary state agency in Kentucky responsible for creating new jobs and new investment in the
Transforming Brevard County:
 Transforming Brevard County: Our First Year Plan Version 1.00 Brevard County, Florida July 2010 Prepared by Purdue Center for Regional Development. This document Includes content licensed and distributed
Economic Development Element
 CHAPTER 6 66.1001(2)(f) Wis. Stat.: Economic Development Element Economic development element: A compilation of objectives, policies, goals, maps and programs to promote the stabilization, retention or
Chicago Scholarship Online Abstract and Keywords. U.S. Engineering in the Global Economy Richard B. Freeman and Hal Salzman
 Chicago Scholarship Online Abstract and Keywords Print ISBN 978-0-226- eisbn 978-0-226- Title U.S. Engineering in the Global Economy Editors Richard B. Freeman and Hal Salzman Book abstract 5 10 sentences,
EXECUTIVE SUMMARY. Global value chains and globalisation. International sourcing
 EXECUTIVE SUMMARY 7 EXECUTIVE SUMMARY Global value chains and globalisation The pace and scale of today s globalisation is without precedent and is associated with the rapid emergence of global value chains
2014 was yet another great year!
 215 216 Forecast for Ottawa County 214 was yet another great year! George A. Erickcek Brian Pittelko W.E. Upjohn Institute for Employment Research February 3, 215 1 Outline The national economy is speeding
Growing Your Own Economy. Dell Gines, MBA, CEcD Federal Reserve Bank of Kansas City Sr. Community Development Advisor
 Growing Your Own Economy Dell Gines, MBA, CEcD Federal Reserve Bank of Kansas City Sr. Community Development Advisor The Federal Reserve Bank The views in this presentation do not necessarily represent
Allegany County Chamber of Commerce Strategic Marketing Plan
 Allegany County Chamber of Commerce Strategic Marketing Plan Prepared by: Tom Helmstetter Paul Ruddell Jack Wickham Nicole Wigfield Marketing Management Frostburg State University Spring 2008 1 Objective
Smart Specialisation in the Region of Attica
 Logo area Smart Specialisation in the Region of Attica Intermediate Authority of Attica Region WIRE2014 / 12-06-2014 The producer of 45% of the National GDP ATTICA IS A METROPOLITAN AREA Geopolitically
MYOB Business Monitor. November The voice of Australia s business owners. myob.com.au
 MYOB Business Monitor The voice of Australia s business owners November 2009 myob.com.au Quick Link Summary Over half of Australia s business owners expect the economy to begin to improve over the next
APEC Best Practices Guidelines on Industrial Clustering for Small and Medium Enterprises
 APEC Best Practices Guidelines on Industrial Clustering for Small and Medium Enterprises Prepared by the APEC Symposium on Industrial Clustering for SMEs Taipei 9 March 2005 Advantages of Industrial Clustering
SUPPORTING ENTREPRENEURS. A Longitudinal Impact Study of Accion and Opportunity Fund Small Business Lending in the U.S.
 SUPPORTING ENTREPRENEURS A Longitudinal Impact Study of Accion and Opportunity Fund Small Business Lending in the U.S. April 2018 A Letter from Accion & Opportunity Fund Dear Partners, Friends and Supporters:
Snohomish County Labor Area Summary April 2017
 Anneliese Vance-Sherman, Ph.D., Regional Labor Economist Washington State Workforce Information and Technology Services Division Phone: 425-258-6300 Mobile: 360-630-1232 Email: avancesherman@esd.wa.gov
Analytical Report on Trade in Services ICT Sector
 Republika e Kosovës Republika Kosova-Republic of Kosovo Qeveria-Vlada-Government Ministria e Tregtisë dhe Industrisë - Ministarstvo Trgovine i Industrije - Ministry of Trade and Industry Departamenti i
ENTREPRENEURSHIP. Training Course on Entrepreneurship Statistics September 2017 TURKISH STATISTICAL INSTITUTE ASTANA, KAZAKHSTAN
 ENTREPRENEURSHIP Training Course on Entrepreneurship Statistics 18-20 September 2017 ASTANA, KAZAKHSTAN Can DOĞAN / Business Registers Group candogan@tuik.gov.tr CONTENT General information about Entrepreneurs
Chapter 02 Sources of Innovation
 Chapter 02 Sources of Innovation True/False 1. Sometimes knowing a field too well can stifle creativity. Page: 19 2. The organization s structure, routines, and incentives can thwart individual creativity,
US Startup Outlook Key insights from the Silicon Valley Bank Startup Outlook Survey
 US Startup Outlook 2018 Key insights from the Silicon Valley Bank Startup Outlook Survey LETTER FROM SVB CEO US STARTUP OUTLOOK 2018 2 Startups enter 2018 with confidence For the ninth year, Silicon Valley
Measuring an Entrepreneurial Ecosystem
 Measuring an Entrepreneurial Ecosystem September 2016 Today s Presenter: Caroline Taich 2 Caroline Taich Senior Partner, Solution Development, JumpStart Inc. Leads the design and growth of a portfolio
EXECUTIVE SUMMARY THE ECONOMIC IMPORTANCE OF THE ARTS & CULTURAL INDUSTRIES IN SANTA FE COUNTY
 EXECUTIVE SUMMARY THE ECONOMIC IMPORTANCE OF THE ARTS & CULTURAL INDUSTRIES IN SANTA FE COUNTY Financial support for this research was provided by The McCune Charitable Foundation The Azalea Foundation
Broadband KY e-strategy Report
 Broadband KY e-strategy Report Utilizations and Impacts of Broadband for Businesses, Organizations and Households This report was prepared by Strategic Networks Group in partnership with. May 24, 2012
Embracing Tomorrow Azerbaijan 3 December 2012 Jan Sturesson Global Leader Government & Public Services PwC
 www.pwc.com/az Azerbaijan Jan Sturesson Global Leader Government & Public Services Agenda 1. Where do we stand now? - Competitiveness & Development 2.What lies ahead? - Implementing visions and strategies
SOCIO-ECONOMIC STATEMENT FOR DÚN LAOGHAIRE-RATHDOWN
 SOCIO-ECONOMIC STATEMENT FOR DÚN LAOGHAIRE-RATHDOWN Dún Laoghaire-Rathdown Socio-Economic Statement 2015 TABLE OF CONTENTS INTRODUCTION... 1 LOCAL ECONOMIC AND COMMUNITY PLAN VISION... 1 HIGH LEVEL GOALS
THE CPA AUSTRALIA ASIA-PACIFIC SMALL BUSINESS SURVEY 2016
 THE CPA AUSTRALIA ASIA-PACIFIC SMALL BUSINESS SURVEY GENERAL REPORT FOR AUSTRALIA, CHINA, HONG KONG, INDONESIA, MALAYSIA, NEW ZEALAND, SINGAPORE AND VIETNAM Legal notice CPA Australia Ltd ( CPA Australia
Verde Valley Economic Development Strategy. Prepared for VVREO April 6, 2018
 Verde Valley Economic Development Strategy Prepared for VVREO April 6, 2018 How it all came together Working Group Regional Input Market Assessment o o o Questionnaire Stakeholder interviews Economic Development
Reclaiming Prosperity in Boise: Designing a Sustainable Future in the New West
 Lectures/Events (BMW) Brookings Mountain West 6-4-2010 Reclaiming Prosperity in Boise: Designing a Sustainable Future in the New West Mark Muro Brookings Institution, mmuro@brookings.edu Follow this and
Q HIGHER EDUCATION. Employment Report. Published by
 Q1 2018 HIGHER EDUCATION Employment Report Published by ACE FELLOWS ENHANCE AND ADVANCE HIGHER EDUCATION. American Council on Education FELLOWS PROGRAM With over five decades of success, the American Council
REQUEST FOR PROPOSALS
 REQUEST FOR PROPOSALS This is a Request for Proposals (RFP) from individuals or firms interested in providing professional services on a contract basis for the proposed project described below. Proposals
Economic Trends, Outlook and Key Innovation and Entrepreneurship Indicators
 Economic Trends, Outlook and Key Innovation and Entrepreneurship Indicators Massachusetts and Northeast US Presented to Massachusetts Economic Development Council Northeastern Economic Developers Association
Greater Richmond. Relocation Council. April 12, 2016
 Greater Richmond Relocation Council April 12, 2016 Economic Development Organizations State Virginia Economic Development Partnership Region Greater Richmond Partnership Local City of Richmond Dept. of
GEM UK: Northern Ireland Report 2011
 GEM UK: Northern Ireland Report 2011 Mark Hart and Jonathan Levie The Global Entrepreneurship Monitor (GEM) is an international project involving 54 countries in 2011 which seeks to provide information
Building Effective Startup Ecosystems. Presented by: Tim Rowe February 16, 2017
 Building Effective Startup Ecosystems Presented by: Tim Rowe February 16, 2017 WHAT IS INNOVATION, REALLY? Not innovation: water bicycle Never employed by society Real innovation: hybrid electric engine
New Zealand Startup Ecosystem Analysis
 New Startup Ecosystem Analysis 1 About this Research Early-stage tech startups are highly dependent on their surrounding startup ecosystem. If we can create healthier startup ecosystems, we can generate
Survival Rates of Rural Businesses: What the Evidence Tells Us
 4th Quarter 2016 31(4) Survival Rates of Rural Businesses: What the Evidence Tells Us Steven Deller and Tessa Conroy JEL Classifications: R11, O18, M21 Keywords: Business Survival, Economic Development
Economic Impact of the proposed The Medical University of South Carolina
 Economic Impact of the proposed The Medical University of South Carolina Conducted by: Center for Business Research Charleston Metro Chamber of Commerce PO Box 975, Charleston SC 29402 April 2016 Background
THE ECONOMIC IMPACT OF $1.4 BILLION OF UNIVERSITY CONSTRUCTION PROJECTS ON THE STATE OF ARIZONA
 THE ECONOMIC IMPACT OF $1.4 BILLION OF UNIVERSITY CONSTRUCTION PROJECTS ON THE STATE OF ARIZONA 0BA Report from the Office of the University Economist 1BJune 2008 Dennis Hoffman, Ph.D. Professor of Economics,
Positioning the Commonwealth for Healthy Economic Growth
 Positioning the Commonwealth for Healthy Economic Growth Top Ten for Educational Attainment Top Ten for Higher Ed Top Ten for Public Schools Attractive Small Sites Advantageous Mid-Atlantic Location Low
Three Generations of Talent:
 Indeed Hiring Lab I CA Research Bulletin I December 2014 Three Generations of Talent: Who s Searching for Jobs Today 1 Indeed Table of Contents: Each Generation Brings Unique Strengths to the Labour Market...
The Challenges & Opportunities of Doing Business in Connecticut
 The Challenges & Opportunities of Doing Business in Connecticut Catherine Smith Commissioner November 23, 2015 State of the State 74,500 new jobs created since 2011 Budget growth rate has been 3.1% per
Updating the San Francisco Economic Strategy
 Updating the San Francisco Economic Strategy Ted Egan, Chief Economist Office of Economic Analysis May 17, 2011 Background Authorized by the voters with Proposition I in 2004. Provide a comprehensive analysis
PLAN: Dudley Square June 2017 Planning Process Recap
 PLAN: Dudley Square June 2017 Planning Process Recap PLAN: Dudley is a community development plan which envisions the future of Dudley Square through the development of publicly-owned parcels. #3cba92
Vermont Competitiveness: Creating a State Economic Strategy
 Vermont Competitiveness: Creating a State Economic Strategy Professor Michael E. Porter Harvard Business School April 10, 2012 For further material on regional competitiveness and clusters: www.isc.hbs.edu/econ-clusters.htm
GLI S STRATEGY FOR REGIONAL ECONOMIC GROWTH 2020 STRATEGIC GOALS 2017 TACTICAL GOALS - VISION -
 GLI S STRATEGY FOR REGIONAL ECONOMIC GROWTH 2020 STRATEGIC GOALS 2017 TACTICAL GOALS - VISION - FALL 2016 GLI S VISION GREATER AND LOUISVILLE GOALS FOR 2020 CREATING, GROWING AND RELOCATING BUSINESSES...
GREATER AKRON. bigger. bolder. better Chuck Jones, President, Firstenergy, Chairman of the Board, The Greater Akron Chamber
 Accelerate GREATER Akron. The Greater Akron Chamber, its members, investors and all its strategic partners have accomplished big things. Now we ARE ready to turn the corner with greater energy, into more
Benchmarking the Rhode Island Knowledge Economy
 Benchmarking the Rhode Island Knowledge Economy November 2011 November, 2011 Dear Friends, In the 21st century, knowledge and innovation drive economic change and progress. It s increasingly clear that
Employee Telecommuting Study
 Employee Telecommuting Study June Prepared For: Valley Metro Valley Metro Employee Telecommuting Study Page i Table of Contents Section: Page #: Executive Summary and Conclusions... iii I. Introduction...
North America Update
 North America Update Executive Summary works on helping LinkedIn become a primary source of insights and ideas that guide leaders decisions on workforce development across the globe. The team does this