RURAL HOUSING PERSPECTIVES Joe Belden, Housing Assistance Council. Southern Legislative Conference Oklahoma City, Oklahoma July 12, 2008
|
|
|
- Luke Horton
- 5 years ago
- Views:
Transcription
1 RURAL HOUSING PERSPECTIVES Joe Belden, Housing Assistance Council Southern Legislative Conference Oklahoma City, Oklahoma July 2, 28

2 Section 52 Guaranteed Homeownership Loans Obligation State ALABAMA ARKANSAS FLORIDA GEORGIA KENTUCKY LOUISIANA MARYLAND MISSISSIPPI MISSOURI NORTH CAROLINA OKLAHOMA SOUTH CAROLINA TENNESSEE TEXAS VIRGINIA WEST VIRGINIA 657, ,342,572 83,452, ,4, $67,68 $48,472 $,322 $54,866 $25,25 $8,893 $32,553 $49,649 $7,583 $6,92 $68,68 $34,828 $4,688 $34,646 $2,34 $52,74 National Total 35,322 $3,663,597
3 Persistent Poverty Counties, 96-2 US States Persistent Poverty Status Source: USDA ERS and HAC Tabulations of 2 Census of Population and Housing, Demographic Profile 3. Persistent Poverty County
4 Homes in or Near Foreclosure - April 28 State ALABAMA ARKANSAS FLORIDA GEORGIA KENTUCKY LOUISIANA MARYLAND MISSISSIPPI MISSOURI NORTH CAROLINA OKLAHOMA SOUTH CAROLINA TENNESSEE TEXAS VIRGINIA WEST VIRGINIA Units ,883 58, , ,278 29, ,76 78,248 25, Source: Realtty trac, July 28 l
5 State Rural % Rural Population Alabama,769, Arkansas,36, Florida,34, Georgia 2,362, Kentucky 2,72, Louisiana,35, Maryland 527,3 9.4 Mississippi,822, Missouri 2,2, North Carolina 3,24, Oklahoma,468,9 4.4 South Carolina,98, Tennessee 2,3, Texas 3,7, Virginia,589,43 2. West Virginia,32,
6
7 Rural Poverty Total Persons % Total Rural Persons in % Rural State in Poverty Poverty in Poverty Poverty Alabama 698, , Arkansas 4, , Florida,952, , Georgia,33, , Kentucky 62, , Louisiana 85, , Maryland 438, , Mississippi 548, , Missouri 637, , North Carolina 958, , Oklahoma 49, , South Carolina 547, , Tennessee 746, ,98 5. Texas 3,7, , Virginia 656, , West Virginia 35, ,74 9.8
8
9 Homeownership Rate State Total Homeownership % Rural Homeownership % Alabama Arkansas Florida Georgia Kentucky Louisiana Maryland Mississippi Missouri North Carolina Oklahoma South Carolina Tennessee Texas Virginia West Virginia
10
11 2.4 84, ,232 West Virginia , ,37 Virginia , ,443 Texas , ,666 Tennessee 27.4, ,32 South Carolina , ,678 Oklahoma , ,555 North Carolina 5.2 5, ,39 Missouri , ,52 Mississippi 6.7 2, ,48 Maryland 2.7, ,92 Louisiana 2. 74, ,63 Kentucky , ,649 Georgia , ,72 Florida , ,29 Arkansas , , Alabama Homes Homes State % Manufactured % Manufactured Rural Total Manufactured Homes
12
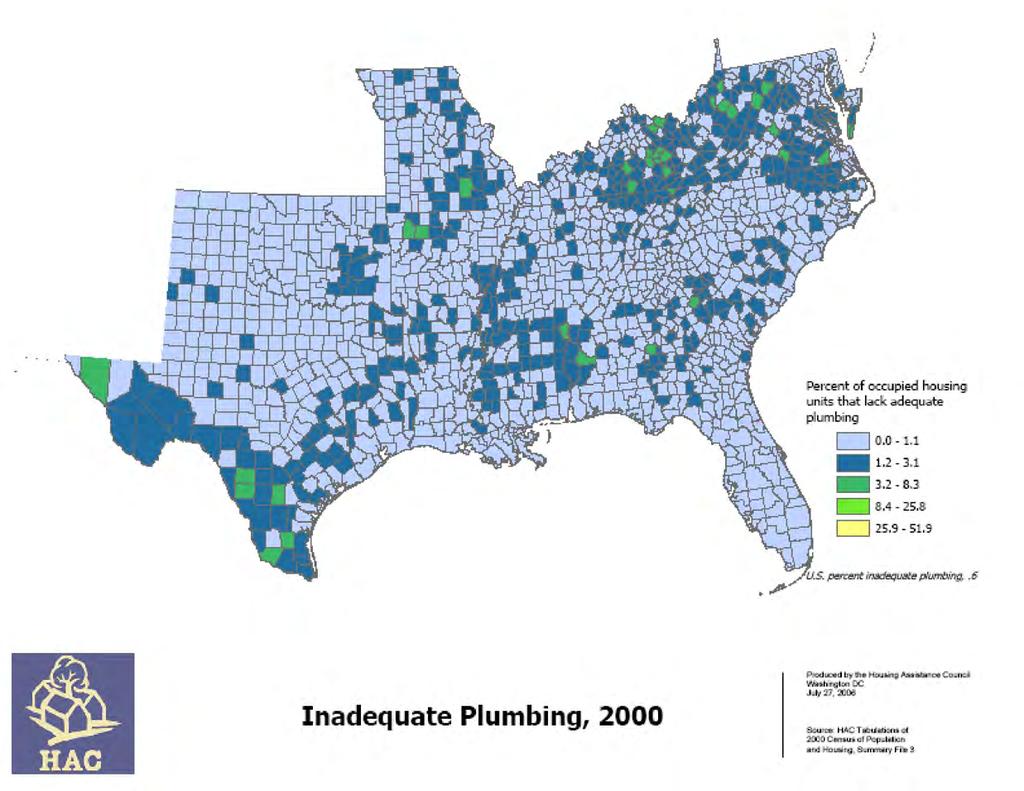
13 .36 5,63. 7,45 West Virginia.57 9, ,55 Virginia.3 3, ,853 Texas.93 7,8.64 4,34 Tennessee.95 3, ,52 South Carolina.7 4,3.56 7,546 Oklahoma.8 9, ,295 North Carolina.86 6,57.54,923 Missouri.2 6, ,5 Mississippi.72, ,33 Maryland.78 3,762.65,77 Louisiana.4, ,947 Kentucky.8 6, ,7 Georgia.58 2, ,34 Florida.2 5, ,327 Arkansas.86 5,726.63,5 Alabama % Lacking Plumbing % Lacking Plumbing State Rural Units Total Units Inadequate Plumbing
14
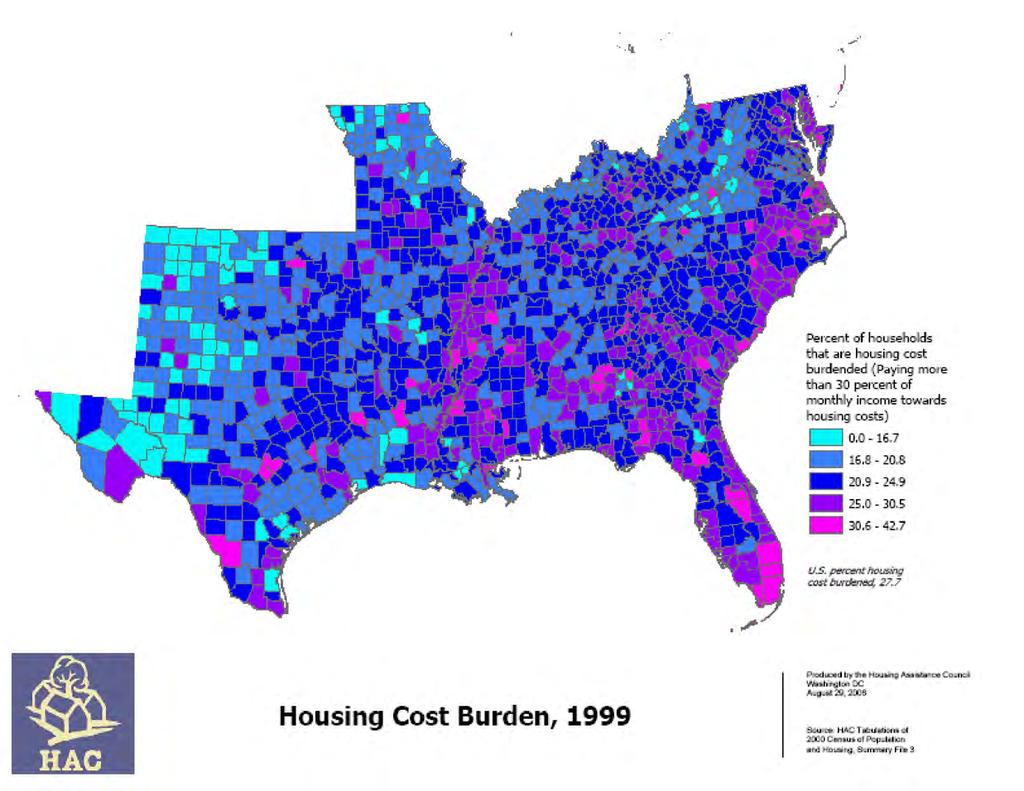
15 Housing Affordability State Total Cost Burdened Households (%) Rural Cost Burdened Households (%) Alabama Arkansas Florida Georgia Kentucky Louisiana Maryland Mississippi Missouri North Carolina Oklahoma South Carolina Tennessee Texas Virginia West Virginia
16
17 High Cost Loans Total Rural State High Cost Loans % High Cost Loans % Alabama 37, , Arkansas 2, , Florida 9, , Georgia 83, , Kentucky 26, , Louisiana 37, , Maryland 59, , Mississippi 26, , Missouri 54, , North Carolina 56, , Oklahoma 28, , South Carolina 3, , Tennessee 5, , Texas 59, , Virginia 6, ,6 6.4 West Virginia 9, ,
18
19 Decline in USDA Housing Programs Selected USDA Rural Housing Program Production FY FY 25 Units Built Section 55 Rental Housing Units Section 52 Homeownership Units
20
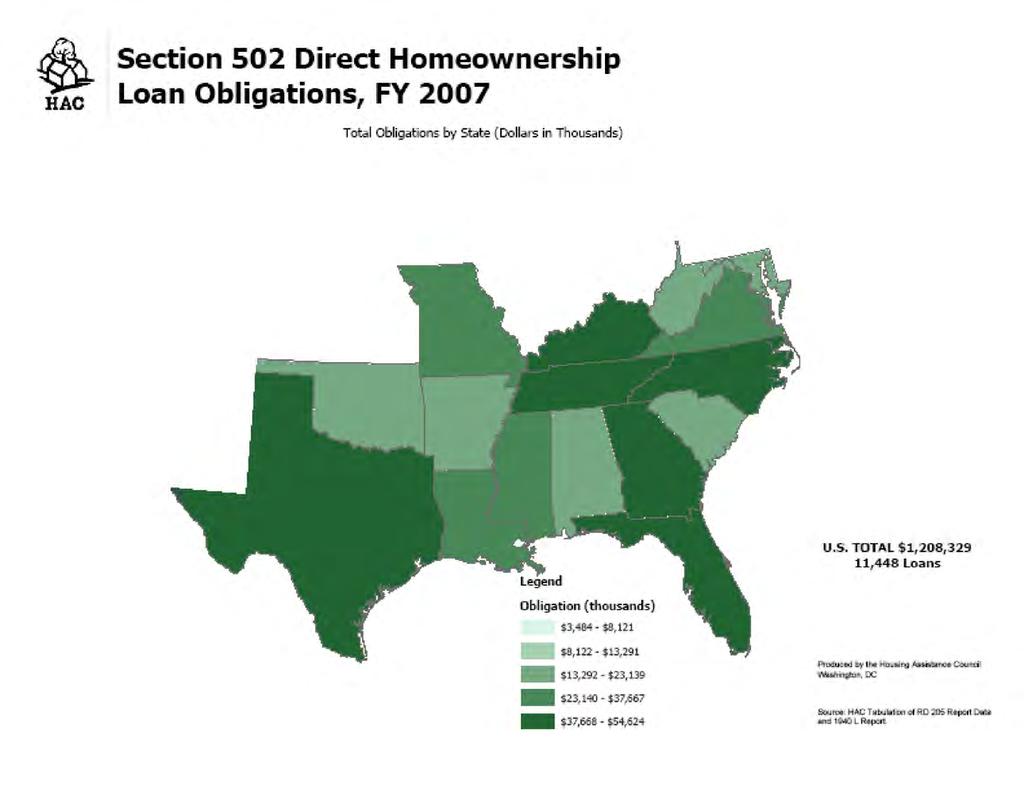
21 Section 52 Direct Homeownership Loans Obligation State ALABAMA ARKANSAS FLORIDA GEORGIA KENTUCKY LOUISIANA MARYLAND MISSISSIPPI MISSOURI NORTH CAROLINA OKLAHOMA SOUTH CAROLINA TENNESSEE TEXAS VIRGINIA WEST VIRGINIA $23,39 $22,69 $54,624 $4,54 $42,838 $35,74 $9,33 $34,5 $33,566 $44,347 $2,63 $2,75 $4,83 $46, $3,667 $7,988 National Total,448 $,28,329
22
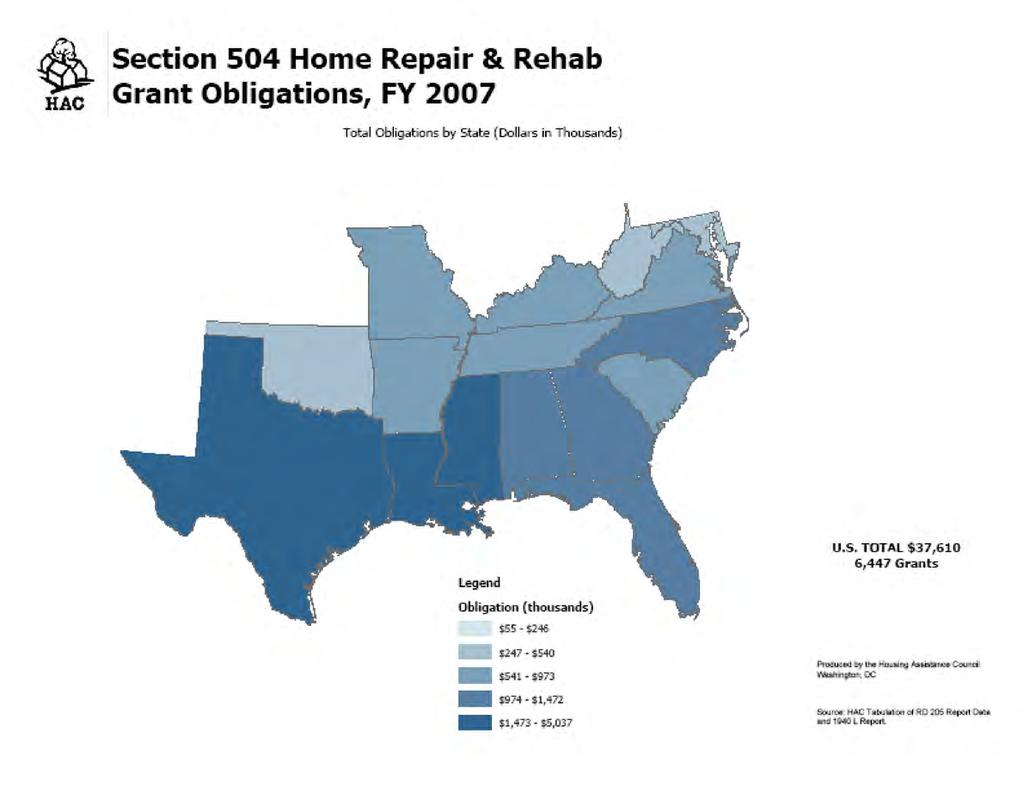
23 $35,77 5,939 $37,6 6,447 National Total $ $476 7 WEST VIRGINIA $ $ VIRGINIA $, $2, TEXAS $ $93 24 TENNESSEE $469 6 $692 8 SOUTH CAROLINA $35 53 $ OKLAHOMA $2, $, NORTH CAROLINA $2,8 346 $92 25 MISSOURI $, $2, MISSISSIPPI $237 3 $ MARYLAND $97 53 $5,37 42 LOUISIANA $2, $97 95 KENTUCKY $,4 44 $,7 77 GEORGIA $ $, FLORIDA $682 3 $763 5 ARKANSAS $,88 65 $,96 95 ALABAMA State Obligation Loans Obligation Grants Section 54 Rehab Loans Section 54 Rehab Grants
24
25
26 $78,784 8 $2,4 24 National Total $ $ WEST VIRGINIA $392 5 $ VIRGINIA $78 $ TEXAS $865 4 $ TENNESSEE $6,28 2 $8 SOUTH CAROLINA $2,3 5 $, OKLAHOMA $8,883 6 $225 NORTH CAROLINA $542 2 $ MISSOURI $586 2 $, MISSISSIPPI $ $ MARYLAND $3,3 4 $ LOUISIANA $ $ KENTUCKY $2,653 2 $ GEORGIA $,435 2 $ FLORIDA $476 $, ARKANSAS $ $ ALABAMA State Obligation Loans Obligation Loans Section 55 Rental (Rehab) Section 55 Rental (New)
27
28
29 $3,43 93 National Total $34 WEST VIRGINIA $ VIRGINIA $23 TEXAS $47 3 TENNESSEE $25 SOUTH CAROLINA $345 3 OKLAHOMA $49 3 NORTH CAROLINA $83 2 MISSOURI $ MISSISSIPPI $472 MARYLAND $492 2 LOUISIANA $25 KENTUCKY $25 GEORGIA $,69 FLORIDA $86 6 ARKANSAS $ ALABAMA State Obligation Grants Section 523-Self-Help
30
31 Section 538 Guaranteed Rental Loans Obligation State ALABAMA ARKANSAS FLORIDA GEORGIA KENTUCKY LOUISIANA MARYLAND MISSISSIPPI MISSOURI NORTH CAROLINA OKLAHOMA SOUTH CAROLINA TENNESSEE TEXAS VIRGINIA WEST VIRGINIA $2,445 $,5 $7 $3,925 $2,9 $ $3,97 $ $ $8 $,24 $ $8,84 $4,33 $ $4,55 National Total 86 $9,356
32
Unemployment Rate (%) Rank State. Unemployment
 Rank State. Unemployment") States Ranked by February 2018 Unemployment Rate Seasonally Adjusted Unemployment Unemployment Unemployment 1 Hawaii 2.1 19 Alabama 3.7 33 Ohio 4.5 2 New Hampshire 2.6 19 Missouri 3.7 33 Rhode Island 4.5
States Ranked by February 2018 Unemployment Rate Seasonally Adjusted Unemployment Unemployment Unemployment 1 Hawaii 2.1 19 Alabama 3.7 33 Ohio 4.5 2 New Hampshire 2.6 19 Missouri 3.7 33 Rhode Island 4.5
Unemployment Rate (%) Rank State. Unemployment
 Rank State. Unemployment") States Ranked by November 2015 Unemployment Rate Seasonally Adjusted Unemployment Unemployment Unemployment 1 North Dakota 2.7 19 Indiana 4.4 37 Georgia 5.6 2 Nebraska 2.9 20 Ohio 4.5 37 Tennessee 5.6
States Ranked by November 2015 Unemployment Rate Seasonally Adjusted Unemployment Unemployment Unemployment 1 North Dakota 2.7 19 Indiana 4.4 37 Georgia 5.6 2 Nebraska 2.9 20 Ohio 4.5 37 Tennessee 5.6
Unemployment Rate (%) Rank State. Unemployment
 Rank State. Unemployment") States Ranked by April 2017 Unemployment Rate Seasonally Adjusted Unemployment Unemployment Unemployment 1 Colorado 2.3 17 Virginia 3.8 37 California 4.8 2 Hawaii 2.7 20 Massachusetts 3.9 37 West Virginia
States Ranked by April 2017 Unemployment Rate Seasonally Adjusted Unemployment Unemployment Unemployment 1 Colorado 2.3 17 Virginia 3.8 37 California 4.8 2 Hawaii 2.7 20 Massachusetts 3.9 37 West Virginia
Unemployment Rate (%) Rank State. Unemployment
 Rank State. Unemployment") States Ranked by August 2017 Unemployment Rate Seasonally Adjusted Unemployment Unemployment Unemployment 1 North Dakota 2.3 18 Maryland 3.9 36 New York 4.8 2 Colorado 2.4 18 Michigan 3.9 38 Delaware 4.9
States Ranked by August 2017 Unemployment Rate Seasonally Adjusted Unemployment Unemployment Unemployment 1 North Dakota 2.3 18 Maryland 3.9 36 New York 4.8 2 Colorado 2.4 18 Michigan 3.9 38 Delaware 4.9
Unemployment Rate (%) Rank State. Unemployment
 Rank State. Unemployment") States Ranked by March 2016 Unemployment Rate Seasonally Adjusted Unemployment Unemployment Unemployment 1 South Dakota 2.5 19 Delaware 4.4 37 Georgia 5.5 2 New Hampshire 2.6 19 Massachusetts 4.4 37 North
States Ranked by March 2016 Unemployment Rate Seasonally Adjusted Unemployment Unemployment Unemployment 1 South Dakota 2.5 19 Delaware 4.4 37 Georgia 5.5 2 New Hampshire 2.6 19 Massachusetts 4.4 37 North
Unemployment Rate (%) Rank State. Unemployment
 Rank State. Unemployment") States Ranked by September 2017 Unemployment Rate Seasonally Adjusted Unemployment Unemployment Unemployment 1 North Dakota 2.4 17 Indiana 3.8 36 New Jersey 4.7 2 Colorado 2.5 17 Kansas 3.8 38 Pennsylvania
States Ranked by September 2017 Unemployment Rate Seasonally Adjusted Unemployment Unemployment Unemployment 1 North Dakota 2.4 17 Indiana 3.8 36 New Jersey 4.7 2 Colorado 2.5 17 Kansas 3.8 38 Pennsylvania
Unemployment Rate (%) Rank State. Unemployment
 Rank State. Unemployment") States Ranked by December 2017 Unemployment Rate Seasonally Adjusted Unemployment Unemployment Unemployment 1 Hawaii 2.0 16 South Dakota 3.5 37 Connecticut 4.6 2 New Hampshire 2.6 20 Arkansas 3.7 37 Delaware
States Ranked by December 2017 Unemployment Rate Seasonally Adjusted Unemployment Unemployment Unemployment 1 Hawaii 2.0 16 South Dakota 3.5 37 Connecticut 4.6 2 New Hampshire 2.6 20 Arkansas 3.7 37 Delaware
Unemployment Rate (%) Rank State. Unemployment
 Rank State. Unemployment") States Ranked by September 2015 Unemployment Rate Seasonally Adjusted Unemployment Unemployment Unemployment 1 North Dakota 2.8 17 Oklahoma 4.4 37 South Carolina 5.7 2 Nebraska 2.9 20 Indiana 4.5 37 Tennessee
States Ranked by September 2015 Unemployment Rate Seasonally Adjusted Unemployment Unemployment Unemployment 1 North Dakota 2.8 17 Oklahoma 4.4 37 South Carolina 5.7 2 Nebraska 2.9 20 Indiana 4.5 37 Tennessee
Unemployment Rate (%) Rank State. Unemployment
 Rank State. Unemployment") States Ranked by November 2014 Unemployment Rate Seasonally Adjusted Unemployment Unemployment Unemployment 1 North Dakota 2.7 19 Pennsylvania 5.1 35 New Mexico 6.4 2 Nebraska 3.1 20 Wisconsin 5.2 38 Connecticut
States Ranked by November 2014 Unemployment Rate Seasonally Adjusted Unemployment Unemployment Unemployment 1 North Dakota 2.7 19 Pennsylvania 5.1 35 New Mexico 6.4 2 Nebraska 3.1 20 Wisconsin 5.2 38 Connecticut
Unemployment Rate (%) Rank State. Unemployment
 Rank State. Unemployment") States Ranked by July 2018 Unemployment Rate Seasonally Adjusted Unemployment Unemployment Unemployment 1 Hawaii 2.1 19 Massachusetts 3.6 37 Kentucky 4.3 2 Iowa 2.6 19 South Carolina 3.6 37 Maryland 4.3
States Ranked by July 2018 Unemployment Rate Seasonally Adjusted Unemployment Unemployment Unemployment 1 Hawaii 2.1 19 Massachusetts 3.6 37 Kentucky 4.3 2 Iowa 2.6 19 South Carolina 3.6 37 Maryland 4.3
TABLE 3c: Congressional Districts with Number and Percent of Hispanics* Living in Hard-to-Count (HTC) Census Tracts**
 Census Tracts**") living Alaska 00 47,808 21,213 44.4 Alabama 01 20,661 3,288 15.9 Alabama 02 23,949 6,614 27.6 Alabama 03 20,225 3,247 16.1 Alabama 04 41,412 7,933 19.2 Alabama 05 34,388 11,863 34.5 Alabama 06 34,849 4,074
living Alaska 00 47,808 21,213 44.4 Alabama 01 20,661 3,288 15.9 Alabama 02 23,949 6,614 27.6 Alabama 03 20,225 3,247 16.1 Alabama 04 41,412 7,933 19.2 Alabama 05 34,388 11,863 34.5 Alabama 06 34,849 4,074
TABLE 3b: Congressional Districts Ranked by Percent of Hispanics* Living in Hard-to- Count (HTC) Census Tracts**
 Census Tracts**") Rank State District Count (HTC) 1 New York 05 150,499 141,567 94.1 2 New York 08 133,453 109,629 82.1 3 Massachusetts 07 158,518 120,827 76.2 4 Michigan 13 47,921 36,145 75.4 5 Illinois 04 508,677 379,527
Rank State District Count (HTC) 1 New York 05 150,499 141,567 94.1 2 New York 08 133,453 109,629 82.1 3 Massachusetts 07 158,518 120,827 76.2 4 Michigan 13 47,921 36,145 75.4 5 Illinois 04 508,677 379,527
Child & Adult Care Food Program: Participation Trends 2017
 Child & Adult Care Food Program: Participation Trends 2017 February 2018 About FRAC The Food Research and Action Center (FRAC) is the leading national organization working for more effective public and
 3+ 3+ N = 155, 442 3+ R 2 =.32 < < < 3+ N = 149, 685 3+ R 2 =.27 < < < 3+ N = 99, 752 3+ R 2 =.4 < < < 3+ N = 98, 887 3+ R 2 =.6 < < < 3+ N = 52, 624 3+ R 2 =.28 < < < 3+ N = 36, 281 3+ R 2 =.5 < < < 7+
MAP 1: Seriously Delinquent Rate by State for Q3, 2008
 MAP 1: Seriously Delinquent Rate by State for Q3, 2008 Seriously Delinquent Rate Greater than 6.93% 5.18% 6.93% 0 5.17% Source: MBA s National Deliquency Survey MAP 2: Foreclosure Inventory Rate by State
Child & Adult Care Food Program: Participation Trends 2016
 Child & Adult Care Food Program: Participation Trends 2016 March 2017 About FRAC The Food Research and Action Center (FRAC) is the leading national organization working for more effective public and private
Rutgers Revenue Sources
 Rutgers Revenue Sources 31.2% Tuition and Fees 27.3% State Appropriations with Fringes 1.0% Endowment and Investments.5% Federal Appropriations 17.8% Federal, State, and Municipal Grants and Contracts
The American Legion NATIONAL MEMBERSHIP RECORD
 The American Legion NATIONAL MEMBERSHIP RECORD www.legion.org 2016 The American Legion NATIONAL MEMBERSHIP RECORD 1920-1929 Department 1920 1921 1922 1923 1924 1925 1926 1927 1928 1929 Alabama 4,474 3,246
Child & Adult Care Food Program: Participation Trends 2014
 Child & Adult Care Food Program: Participation Trends 2014 1200 18th St NW Suite 400 Washington, DC 20036 (202) 986-2200 / www.frac.org February 2016 About FRAC The Food Research and Action Center (FRAC)
STATE INDUSTRY ASSOCIATIONS $ - LISTED NEXT PAGE. TOTAL $ 88,000 * for each contribution of $500 for Board Meeting sponsorship
 Exhibit D -- TRIP 2017 FUNDING SOURCES -- February 3, 2017 CORPORATE $ 12,000 Construction Companies $ 5,500 Consulting Engineers Equipment Distributors Manufacturer/Supplier/Producer 6,500 Surety Bond
States Ranked by Annual Nonagricultural Employment Change October 2017, Seasonally Adjusted
 States Ranked by Annual Nonagricultural Employment Change Change (Jobs) Change (Jobs) Change (Jobs) 1 Texas 316,100 19 Nevada 36,600 37 Hawaii 7,100 2 California 256,800 20 Tennessee 34,800 38 Mississippi
Estimated Economic Impacts of the Small Business Jobs and Tax Relief Act National Report
 Regional Economic Models, Inc. Estimated Economic Impacts of the Small Business Jobs and Tax Relief Act National Report Prepared by Frederick Treyz, CEO June 2012 The following is a summary of the Estimated
Index of religiosity, by state
 Index of religiosity, by state Low Medium High Total United States 19 26 55=100 Alabama 7 16 77 Alaska 28 27 45 Arizona 21 26 53 Arkansas 12 19 70 California 24 27 49 Colorado 24 29 47 Connecticut 25 32
Critical Access Hospitals and HCAHPS
 Critical Access Hospitals and HCAHPS Michelle Casey, MS Senior Research Fellow and Deputy Director University of Minnesota Rural Health Research Center June 12, 2012 Overview of Presentation Why is HCAHPS
2015 State Hospice Report 2013 Medicare Information 1/1/15
 2015 State Hospice Report 2013 Medicare Information 1/1/15 www.hospiceanalytics.com 2 2013 Demographics & Hospice Utilization National Population 316,022,508 Total Deaths 2,529,792 Medicare Beneficiaries
5 x 7 Notecards $1.50 with Envelopes - MOQ - 12
 5 x 7 Notecards $1.50 with Envelopes - MOQ - 12 Magnets 2½ 3½ Magnet $1.75 - MOQ - 5 - Add $0.25 for packaging Die Cut Acrylic Magnet $2.00 - MOQ - 24 - Add $0.25 for packaging 2535-22225 California AM-22225
Fiscal Research Center
 January 2018 Georgia s Rankings Among the States: Budget, Taxes and Other Indicators ABOUT THE FISCAL RESEARCH CENTER Established in 1995, the (FRC) provides nonpartisan research, technical assistance
How North Carolina Compares
 How North Carolina Compares A Compendium of State Statistics January 2013 Prepared by the N.C. General Assembly Program Evaluation Division Program Evaluation Division North Carolina General Assembly Legislative
November 24, First Street NE, Suite 510 Washington, DC 20002
 820 First Street NE, Suite 510 Washington, DC 20002 Tel: 202-408-1080 Fax: 202-408-1056 center@cbpp.org www.cbpp.org November 24, 2008 TANF BENEFITS ARE LOW AND HAVE NOT KEPT PACE WITH INFLATION But Most
Percent of Population Under Age 65 Uninsured, 2013, 2014, and 2015
 Exhiit 1 Percent of Population Under Age 65 Uninsured, 13, 14, and 15 13 14 15
All Approved Insurance Providers All Risk Management Agency Field Offices All Other Interested Parties
 United States Department of Agriculture Farm Production and Conservation Risk Management Agency Beacon Facility Mail Stop 080 P.O. Box 49205 Kansas City, MO 644-6205, 207 INFORMATIONAL MEMORANDUM: PM-7-06
Current Medicare Advantage Enrollment Penetration: State and County-Level Tabulations
 Current Advantage Enrollment : State and County-Level Tabulations 5 Slide Series, Volume 40 September 2016 Summary of Tabulations and Findings As of September 2016, 17.9 million of the nation s 56.1 million
Fiscal Research Center
 January 2017 Georgia s Rankings Among the States: Budget, Taxes and Other Indicators ABOUT THE FISCAL RESEARCH CENTER Established in 1995, the (FRC) provides nonpartisan research, technical assistance
Cooperative Program Allocation Budget Receipts Southern Baptist Convention Executive Committee August 2015
 Cooperative Program Allocation Budget Receipts August 2015 Cooperative Program Allocation Budget Current Current $ Change % Change Month Month from from Contribution Sources 2014-2015 2013-2014 Prior Year
Cooperative Program Allocation Budget Receipts Southern Baptist Convention Executive Committee March 2018
 Cooperative Program Allocation Budget Receipts March 2018 Cooperative Program Allocation Budget Current Current $ Change % Change Month Month from from Contribution Sources 2017-2018 2016-2017 Prior Year
Cooperative Program Allocation Budget Receipts Southern Baptist Convention Executive Committee January 2014
 Cooperative Program Allocation Budget Receipts January 2014 Cooperative Program Allocation Budget Current Current $ Change % Change Month Month from from Contribution Sources 2013-2014 2012-2013 Prior
Cooperative Program Allocation Budget Receipts Southern Baptist Convention Executive Committee April 2015
 Cooperative Program Allocation Budget Receipts April 2015 Cooperative Program Allocation Budget Current Current $ Change % Change Month Month from from Contribution Sources 2014-2015 2013-2014 Prior Year
Cooperative Program Allocation Budget Receipts Southern Baptist Convention Executive Committee March 2015
 Cooperative Program Allocation Budget Receipts March 2015 Cooperative Program Allocation Budget Current Current $ Change % Change Month Month from from Contribution Sources 2014-2015 2013-2014 Prior Year
Cooperative Program Allocation Budget Receipts Southern Baptist Convention Executive Committee May 2016
 Cooperative Program Allocation Budget Receipts May 2016 Cooperative Program Allocation Budget Current Current $ Change % Change Month Month from from Contribution Sources 2015-2016 2014-2015 Prior Year
Cooperative Program Allocation Budget Receipts Southern Baptist Convention Executive Committee December 2015
 Cooperative Program Allocation Budget Receipts December 2015 Cooperative Program Allocation Budget Current Current $ Change % Change Month Month from from Contribution Sources 2015-2016 2014-2015 Prior
How North Carolina Compares
 How North Carolina Compares A Compendium of State Statistics March 2017 Prepared by the N.C. General Assembly Program Evaluation Division Preface The Program Evaluation Division of the North Carolina General
PRESS RELEASE Media Contact: Joseph Stefko, Director of Public Finance, ;
 PRESS RELEASE Media Contact: Joseph Stefko, Director of Public Finance, 585.327.7075; jstefko@cgr.org Highest Paid State Workers in New Jersey & New York in 2010; Lowest Paid in Dakotas and West Virginia
FY 2014 Per Capita Federal Spending on Major Grant Programs Curtis Smith, Nick Jacobs, and Trinity Tomsic
 Special Analysis 15-03, June 18, 2015 FY 2014 Per Capita Federal Spending on Major Grant Programs Curtis Smith, Nick Jacobs, and Trinity Tomsic 202-624-8577 ttomsic@ffis.org Summary Per capita federal
Fiscal Research Center
 January 2016 Georgia s Rankings Among the States: Budget, Taxes and Other Indicators ABOUT THE FISCAL RESEARCH CENTER Established in 1995, the (FRC) provides nonpartisan research, technical assistance
The Regional Economic Outlook
 The Regional Economic Outlook Presented by: Mark McMullen, Director of Government Svcs Prepared for: FTA Revenue Estimating Conference September 15, 2008 Recent Economic Performance 2 1 The Job Market
THE NATIONAL ORGANIZATION OF PROFESSIONAL BLACK NATURAL RESOURCES CONSERVATION SERVICE EMPLOYEES (NOPBNRCSE)
") THE NATIONAL ORGANIZATION OF PROFESSIONAL BLACK NATURAL RESOURCES CONSERVATION SERVICE EMPLOYEES (NOPBNRCSE) THE ORGANIZATION SCHOLARSHIP PROGRAM 2013 A Partnership between The Organization and The 1890
THE NATIONAL ORGANIZATION OF PROFESSIONAL BLACK NATURAL RESOURCES CONSERVATION SERVICE EMPLOYEES (NOPBNRCSE) THE ORGANIZATION SCHOLARSHIP PROGRAM 2013 A Partnership between The Organization and The 1890
EXHIBIT A. List of Public Entities Participating in FEDES Project
 EXHIBIT A List of Public Entities Participating in FEDES Project Alabama Alabama Department of Economic and Community Affairs Alabama Department of Industrial Relations Alaska Department of Labor and Workforce
2016 INCOME EARNED BY STATE INFORMATION
 BY STATE INFORMATION This information is being provided to assist in your 2016 tax preparations. The information is also mailed to applicable Columbia fund non-corporate shareholders with their year-end
WikiLeaks Document Release
 WikiLeaks Document Release February 2, 2009 Congressional Research Service Report 98-968 The Hill-Burton Uncompensated Services Program Barbara English, Knowledge Services Group May 9, 2006 Abstract. The
Introduction. Current Law Distribution of Funds. MEMORANDUM May 8, Subject:
 MEMORANDUM May 8, 2018 Subject: TANF Family Assistance Grant Allocations Under the Ways and Means Committee (Majority) Proposal From: Gene Falk, Specialist in Social Policy, gfalk@crs.loc.gov, 7-7344 Jameson
Table 8 Online and Telephone Medicaid Applications for Children, Pregnant Women, Parents, and Expansion Adults, January 2017
 Table 8 Online and Telephone Medicaid Applications for Children, Pregnant Women, Parents, and Expansion Adults, January 2017 State Applications Can be Submitted Online at the State Level 1 < 25% 25% -
Voter Registration and Absentee Ballot Deadlines by State 2018 General Election: Tuesday, November 6. Saturday, Oct 27 (postal ballot)
") Voter Registration and Absentee Ballot Deadlines by State 2018 General Election: All dates in 2018 unless otherwise noted STATE REG DEADLINE ABSENTEE BALLOT REQUEST DEADLINE Alabama November 1 ABSENTEE
Voter Registration and Absentee Ballot Deadlines by State 2018 General Election: All dates in 2018 unless otherwise noted STATE REG DEADLINE ABSENTEE BALLOT REQUEST DEADLINE Alabama November 1 ABSENTEE
Fiscal Year 1999 Comparisons. State by State Rankings of Revenues and Spending. Includes Fiscal Year 2000 Rankings for State Taxes Only
 Fiscal Year 1999 Comparisons State by State Rankings of Revenues and Spending Includes Fiscal Year 2000 Rankings for State Taxes Only January 2002 1 2 published annually by: The Minnesota Taxpayers Association
Interstate Turbine Advisory Council (CESA-ITAC)
") Interstate Turbine Advisory Council (CESA-ITAC) Mark Mayhew NYSERDA for Val Stori Clean Energy States Alliance SWAT 4/25/12 Today CESA ITAC, LLC - What, who and why The Unified List - What, why, how and
Interstate Turbine Advisory Council (CESA-ITAC) Mark Mayhew NYSERDA for Val Stori Clean Energy States Alliance SWAT 4/25/12 Today CESA ITAC, LLC - What, who and why The Unified List - What, why, how and
SPONSORSHIP OPPORTUNITIES
 SPONSORSHIP OPPORTUNITIES 2017 Annual Conference August 20-22 Charlotte, NC Mission Statement: SEDC will provide useful information and dynamic leadership to economic development practitioners throughout
Table 6 Medicaid Eligibility Systems for Children, Pregnant Women, Parents, and Expansion Adults, January Share of Determinations
 Table 6 Medicaid Eligibility Systems for Children, Pregnant Women, Parents, and Expansion Adults, January 2017 Able to Make Share of Determinations System determines eligibility for: 2 State Real-Time
Interstate Pay Differential
 Interstate Pay Differential APPENDIX IV Adjustments for differences in interstate pay in various locations are computed using the state average weekly pay. This appendix provides a table for the second
Annex A: State Level Analysis: Selection of Indicators, Frontier Estimation, Setting of Xmin, Xp, and Yp Values, and Data Sources
 Annex A: State Level Analysis: Selection of Indicators, Frontier Estimation, Setting of Xmin, Xp, and Yp Values, and Data Sources Right to Food: Whereas in the international assessment the percentage of
Location Factors in the Food Processing Industry
 Location Factors in the Food Processing Industry 2011 Meet the Consultants Forum- Atlanta May 12-13 Robert Pittman, Co Founder & Principal Janus Economics, LLC Atlanta, Georgia 404 431 1255 rpittman@januseconomics.com
Weekly Market Demand Index (MDI)
") VOL. 8 NO. 28 JULY 13, 2015 LOAD AVAILABILITY Up 7% compared to the Weekly Market Demand Index (MDI) Note: MDI Measures Relative Truck Demand LOAD SEARCHING Up 18.3% compared to the TRUCK AVAILABILITY
VOL. 8 NO. 28 JULY 13, 2015 LOAD AVAILABILITY Up 7% compared to the Weekly Market Demand Index (MDI) Note: MDI Measures Relative Truck Demand LOAD SEARCHING Up 18.3% compared to the TRUCK AVAILABILITY
CRMRI White Paper #3 August 2017 State Refugee Services Indicators of Integration: How are the states doing?
 CRMRI White Paper #3 August 7 State Refugee Services Indicators of Integration: How are the states doing? Marci Harris, Julia Greene, Kilee Jorgensen, Caren J. Frost, & Lisa H. Gren State Refugee Services
THE METHODIST CHURCH (U.S.)
") THE METHODIST LIBRARY CONFERENCE JOURNALS COLLECTION PAGE: 1 ALABAMA 1939-58 ALABAMA WEST FLORIDA 1959-1967 ALASKA MISSION 1941, 1949-1967 ATLANTA 1939-1951 BALTIMORE CALIFORNIA ORIENTAL MISSION 1939-1952
THE METHODIST LIBRARY CONFERENCE JOURNALS COLLECTION PAGE: 1 ALABAMA 1939-58 ALABAMA WEST FLORIDA 1959-1967 ALASKA MISSION 1941, 1949-1967 ATLANTA 1939-1951 BALTIMORE CALIFORNIA ORIENTAL MISSION 1939-1952
Students Serving on Local School Boards February 2009 (39 Responding State Associations)
") Students Serving on Local School Boards February 2009 (39 Responding State Associations) Does your state have students serving on local school boards? State Yes How are the student board members selected/elected?
Students Serving on Local School Boards February 2009 (39 Responding State Associations) Does your state have students serving on local school boards? State Yes How are the student board members selected/elected?
Sentinel Event Data. General Information Copyright, The Joint Commission
 Sentinel Event Data General Information 1995 2015 Data Limitations The reporting of most sentinel events to The Joint Commission is voluntary and represents only a small proportion of actual events. Therefore,
Grants 101: An Introduction to Federal Grants for State and Local Governments
 Grants 101: An Introduction to Federal Grants for State and Local Governments Introduction FFIS has been in the federal grant reporting business for a long time about 30 years. The main thing we ve learned
Colorado River Basin. Source: U.S. Department of the Interior, Bureau of Reclamation
 The Colorado River supports a quarter million jobs and produces $26 billion in economic output from recreational activities alone, drawing revenue from the 5.36 million adults who use the Colorado River
STATE AGRICULTURAL ORGANIZATIONS SUPPORTING S. 744 AS APPROVED BY THE SENATE AGRICULTURE COMMITTEE
 STATE AGRICULTURAL ORGANIZATIONS SUPPORTING S. 744 AS APPROVED BY THE SENATE AGRICULTURE COMMITTEE ALABAMA ALASKA ARIZONA Alabama Department of Agriculture & Industries* Alabama Poultry & Egg Association
Virginia s Economic Future: Bright Ideas for Manufacturing Competitiveness. June 22, George Mason University
 Virginia s Economic Future: Bright Ideas for Manufacturing Competitiveness June 22, 2015 @ George Mason University Southern States MFG Share of Total GSP (2013) 25.0% 23.4% 20.0% 15.0% 10.0% 17.8% 13.4%
AMERICAN ASSOCIATION FOR AGRICULTURAL EDUCATION FACULTY SALARIES
 AMERICAN ASSOCIATION FOR AGRICULTURAL EDUCATION 1999-2000 FACULTY SALARIES Contents Page Summary Data for 1999-2000 Faculty FTEs by Region Nine-month appointments (Table 1)...2 Twelve-month appointments
Acm769 AG U.S. WATER BAPTISMS, 2017¹ Page 1
 Acm769 AG U.S. WATER BAPTISMS, 2017¹ Page 1 Baptisms Baptisms Pct Baptisms Pct Baptisms Pct Alabama 2,552 2,944-392 -13.3 3,146-594 -18.9 2,501 51 2.0 Alaska 511 392 119 30.4 443 68 15.3 505 6 1.2 Appalachian
Sentinel Event Data. General Information Q Copyright, The Joint Commission
 Sentinel Event Data General Information 1995 2Q 2014 Data Limitations The reporting of most sentinel events to The Joint Commission is voluntary and represents only a small proportion of actual events.
Fiscal Year 2005 Comparisons. Includes Fiscal Year 2006 Rankings for State Taxes Only
 Fiscal Year 2005 Comparisons Includes Fiscal Year 2006 Rankings for State Taxes Only October 2007 Published annually since 1969 (except FY2001 and FY2003) by: The Minnesota Taxpayers Association 85 East
Is this consistent with other jurisdictions or do you allow some mechanism to reinstate?
 Topic: Question by: : Forfeiture for failure to appoint a resident agent Kathy M. Sachs Kansas Date: January 8, 2015 Manitoba Corporations Canada Alabama Alaska Arizona Arkansas California Colorado Connecticut
HOPE NOW State Loss Mitigation Data December 2016
 HOPE NOW State Loss Mitigation Data December 2016 Table of Contents Page Definitions 2 Data Overview 3 Table 1 - Delinquencies 4 Table 2 - Foreclosure Starts 7 Table 3 - Foreclosure Sales 8 Table 4 - Repayment
HOPE NOW State Loss Mitigation Data September 2014
 HOPE NOW State Loss Mitigation Data September 2014 Table of Contents Page Definitions 2 Data Overview 3 Table 1 - Delinquencies 4 Table 2 - Foreclosure Starts 7 Table 3 - Foreclosure Sales 8 Table 4 -
STATE ENTREPRENEURSHIP INDEX
 University of Nebraska - Lincoln DigitalCommons@University of Nebraska - Lincoln Business in Nebraska Bureau of Business Research 12-2013 STATE ENTREPRENEURSHIP INDEX Eric Thompson University of Nebraska-Lincoln,
HOME HEALTH AIDE TRAINING REQUIREMENTS, DECEMBER 2016
 BACKGROUND HOME HEALTH AIDE TRAINING REQUIREMENTS, DECEMBER 2016 Federal legislation (42 CFR 484.36) requires that Medicare-certified home health agencies employ home health aides who are trained and evaluated
Food Stamp Program State Options Report
 United States Department of Agriculture Food and Nutrition Service Fourth Edition Food Stamp Program State s Report September 2004 vember 2002 Program Development Division Program Design Branch Food Stamp
Assist users with FAEIS Generate reports for users
 1 Provides human interface component to FAEIS. Collaborate with reporting institution s data entry users to collect data Verify data collection with Deans of reporting institutions Assist users with FAEIS
GROWING THE MIDDLE: SECURING THE FUTURE LOS ANGELES
 GROWING THE MIDDLE: SECURING THE FUTURE LOS ANGELES 02.21.18 MANUEL PASTOR @Prof_MPastor THE WIDENING GAP 1 THE WIDENING GAP INEQUALITY: HOW CALIFORNIA RANKS Household* Gini Coefficient, 1969 Mississippi
Food Stamp Program State Options Report
 United States Department of Agriculture Food and Nutrition Service Fifth Edition Food Stamp Program State s Report August 2005 vember 2002 Program Development Division Food Stamp Program State s Report
Appalachian State University L500030AppStUBlkVinyl. University of Alabama L500030AlabmaBlkVinyl. Arizona State University L500030ArizStBlkVinyl
 University of Alabama at Birmingham L500030AlaBirBlkVinyl University of Alabama L500030AlabmaBlkVinyl Appalachian State University L500030AppStUBlkVinyl Arizona State University L500030ArizStBlkVinyl University
How. January. Prepared by
 How North Carolina Compares A Compendium of State Statisticss January 2011 Prepared by the N.C. General Assembly Program Evaluation Division Prefacee The Program Evaluation Division of the North Carolina
Pipeline Safety Regulations and the Effects on Operator Qualification Programs. March 28, 2017
 Pipeline Safety Regulations and the Effects on Operator Qualification Programs March 28, 2017 Community Assistance and Technical Services (CATS) Name Change Community Liaison (CL) Effective: January 1,
2010 College Football
 2010 College Football Thursday, September 2, 2010 Southern Miss. v. South Carolina 6:30 PM 9:30 PM ESPN Thursday, September 2, 2010 USC at Hawaii 10:00 PM 1:00 AM ESPN Friday, September 3, 2010 Arizona
FORTIETH TRIENNIAL ASSEMBLY
 FORTIETH TRIENNIAL ASSEMBLY MOST PUISSANT GENERAL GRAND MASTER GENERAL GRAND COUNCIL OF CRYPTIC MASONS INTERNATIONAL 1996-1999 -
Benefits by Service: Outpatient Hospital Services (October 2006)
") Page 1 of 8 Benefits by Service: Outpatient Hospital Services (October 2006) Definition/Notes Note: Totals include 50 states and D.C. "Benefits Covered" Totals "Benefits Not Covered" Totals Is the benefit
Page 1 of 8 Benefits by Service: Outpatient Hospital Services (October 2006) Definition/Notes Note: Totals include 50 states and D.C. "Benefits Covered" Totals "Benefits Not Covered" Totals Is the benefit
Arizona State Funding Project: Addressing the Teacher Labor Market Challenge Executive Summary. Research conducted by Education Resource Strategies
 Arizona State Funding Project: Addressing the Teacher Labor Market Challenge Executive Summary Research conducted by Education Resource Strategies Key findings 1. Student outcomes in Arizona lag behind
Table 1 Elementary and Secondary Education. (in millions)
") Revised February 22, 2005 WHERE WOULD THE CUTS BE MADE UNDER THE PRESIDENT S BUDGET? Data Table 1 Elementary and Secondary Education Includes Education for the Disadvantaged, Impact Aid, School Improvement
Revised February 22, 2005 WHERE WOULD THE CUTS BE MADE UNDER THE PRESIDENT S BUDGET? Data Table 1 Elementary and Secondary Education Includes Education for the Disadvantaged, Impact Aid, School Improvement
Nielsen ICD-9. Healthcare Data
 Nielsen ICD-9 Healthcare Data Healthcare Utilization Model The Nielsen healthcare utilization model has three primary components: demographic cohort population counts, cohort-specific healthcare utilization
Percentage of Enrolled Students by Program Type, 2016
 Percentage of Enrolled Students by Program Type, 2016 Doctorate 4% PN/VN 3% MSN 15% ADN 28% BSRN 22% Diploma 2% BSN 26% n = 279,770 Percentage of Graduations by Program Type, 2016 MSN 12% Doctorate 1%
SECTION 1: UPDATES ON 5 YEAR PLAN
 Office of Program Support, Administration on Intellectual and Developmental Disabilities SECTION 1: UPDATES ON 5 YEAR PLAN PROGRAMMATIC CHANGES TO THE UCEDD 5-YEAR PLAN There are no changes to the goals
Statutory change to name availability standard. Jurisdiction. Date: April 8, [Statutory change to name availability standard] [April 8, 2015]
![Statutory change to name availability standard. Jurisdiction. Date: April 8, [Statutory change to name availability standard] [April 8, 2015]](/thumbs/83/87461560.jpg "Statutory change to name availability standard. Jurisdiction. Date: April 8, [Statutory change to name availability standard] [April 8, 2015]") Topic: Question by: : Statutory change to name availability standard Michael Powell Texas Date: April 8, 2015 Manitoba Corporations Canada Alabama Alaska Arizona Arkansas California Colorado Connecticut
Topic: Question by: : Statutory change to name availability standard Michael Powell Texas Date: April 8, 2015 Manitoba Corporations Canada Alabama Alaska Arizona Arkansas California Colorado Connecticut
FOOD STAMP PROGRAM STATE ACTIVITY REPORT
 FOOD STAMP PROGRAM ACTIVITY REPORT Federal Fiscal Year 2004 Food Stamps Make America Stronger United States Department of Agriculture Food and Nutrition Service Program Accountability Division February
Weights and Measures Training Registration
 Weights and Measures Training Registration Please fill out the form below to register for Weights and Measures training and testing dates. NIST Handbook 44, Specifications, Tolerances and other Technical
national assembly of state arts agencies
 STATE ARTS AGENCY GRANT MAKING AND FUNDING Each of America's 50 states and six jurisdictions has a government that works to make the cultural, civic, economic and educational benefits of the available
Department of Defense INSTRUCTION
 Department of Defense INSTRUCTION NUMBER 4715.02 August 28, 2009 Incorporating Change 2, August 31, 2018 USD(A&S) SUBJECT: Regional Environmental Coordination References: (a) DoD Instruction 4715.2, DoD
THOMAS USAF S SPECIAL REPORT HIGHLIGHTING THE NURSING HOME INDUSTRY
 THOMAS USAF S SPECIAL REPORT HIGHLIGHTING THE NURSING HOME INDUSTRY September 12, 2013 THOMAS USAF The USDA & SBA Health Care Experts When you think Health Care, think Thomas USAF Group, LLC! Over the
TENNESSEE TEXAS UTAH VERMONT VIRGINIA WASHINGTON WEST VIRGINIA WISCONSIN WYOMING ALABAMA ALASKA ARIZONA ARKANSAS
 ALABAMA ALASKA ARIZONA ARKANSAS CALIFORNIA COLORADO CONNECTICUT DELAWARE DISTRICT OF COLUMBIA FLORIDA GEORGIA GUAM MISSOURI MONTANA NEBRASKA NEVADA NEW HAMPSHIRE NEW JERSEY NEW MEXICO NEW YORK NORTH CAROLINA
ADMINISTRATIVE OFFICE OF THE UNITED STATES COURTS
 ADMINISTRATIVE OFFICE OF THE UNITED STATES COURTS JAMES C. DUFF Director WASHINGTON, D.C. 20544 July 2,2009 Honorable Joseph R. Biden, Jr. President United States Senate Washington, DC 20510 Dear Mr. President: