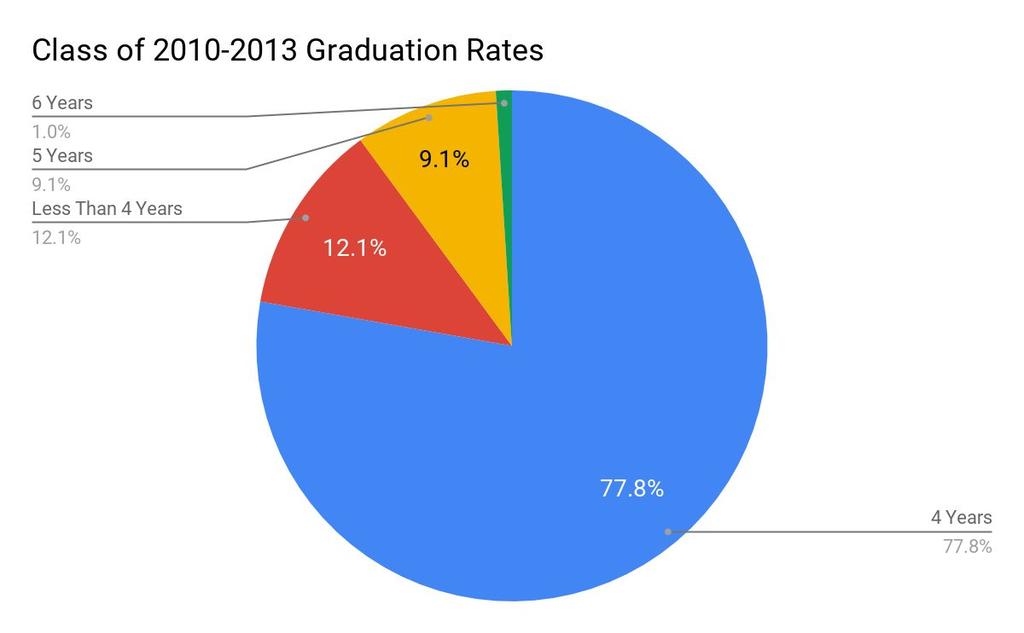
Chatham High School Annual Report on Graduates Class of 2017
|
|
|
- Ella Lang
- 6 years ago
- Views:
Transcription
1 Chatham High School Annual Report on Graduates Class of 2017 Presented By: Douglas Walker Assistant Principal
2 Presentation Objectives Apprise members of the Board of Education and public of the post-secondary plans of our most recent graduates. Highlight areas of focus regarding post-secondary processes within the high school counseling department. Respond to questions.

3 Post High School Plans
4 College Placement By Type of Institution Competitive Category Total Percent Most % Highly 47 16% Very 84 28% Competitive 37 12% Less/Non 8 3% Special/Other 2 <1% 85%
5 GPA Distribution GPA # of Students < Area of Focus: Help students and families see that not all students have a straight-a average; in fact, the vast majority do not.
6 College Placement by GPA Area of Focus: Help students and families see that ALL students have a range of options. Competitive Category Most Highly Very Competitive Less/Non Special / Other GPA Range High-performing students choose to attend institutions of all types. It is not necessary to have a 4.0+ GPA to get into college, even the very best colleges.


7 College Placement By Type of Institution GPA: GPA: GPA: Area of Focus: Help students and families see that students in the middle and lower GPA bands attend the full range of institutions.
8 Barron s Competitive Ratings Most Competitive Boston College Lafayette College Villanova University Northeastern University University of Virginia Lehigh University Tulane University University of Michigan Georgetown University All of the Ivy League Highly Competitive American University Ithaca College Fordham University TCNJ Muhlenberg College University of Pittsburgh Gettysburg College Virginia Tech
9 Barron s Competitive Ratings Very Competitive Fairfield University University of Delaware Penn State University of Vermont Syracuse University Rutgers University James Madison University Quinnipiac University Competitive High Point University Susquehanna University University of Rhode Island Montclair State University Seton Hall University Pace University NJIT University of Arizona
10 Four Year College Placement By Region Region East* 60% 63% 61% 64% New Jersey 8% 10% 15% 7% South 17% 13% 12% 16% Midwest 8% 7% 4% 5% West 4% 2% 3% 3% Other 1% 2% 3% 2% Southwest** 2% 3% 2% 3% *New England, Delaware, District of Columbia, Maryland, New York, Pennsylvania **Arizona, Colorado, New Mexico, Texas, Utah
11 Four Year College Placement by Public & Private Sector Sector Public 37% 35% 40% 38% Private 63% 65% 60% 62%
12 Special Education Snapshot Special Education--Combined Classes of 2016 and 2017 Plans N % 4 Yr 60 71% 2 Yr 11 13% Other 6 7% Employment 7 8% Area of Focus: Reassure special education students and families that their paths will result in positive outcomes!
13 Basic Skills Snapshot (Students who received BSI support in 7th grade) BSI--Classes of 2016 and 2017 Plans N % 4 Yr 49 93% 2 Yr 3 6% Other 1 2% Employment 0 0% Area of Focus: Reassure basic skills students and families that their paths will result in positive outcomes!
14 College Applications & Acceptances 2438 Applications 1362 Acceptances 848 Early Action o 546 Accepted 101 Early Decision o 64 Accepted 13 Early Decision II o 5 Accepted 7.71 Average applications per student 3.95 Average acceptances per student 56% - Average acceptance of total applications per student
15 College Applications & Acceptances Number of Applications Number of Students Percentage Accepted % % % % % Area of Focus: Point out to students and families that there is a point of diminishing returns in terms of acceptance rates and number of applications.
16 Colleges Receiving 30 Or More Applications Northeastern Univ - 54 Univ of Delaware - 47 Fairfield University - 44 Rutgers Univ-New Brunswick - 43 Pennsylvania State University - 34 Boston College - 34 Univ of Michigan - 33 New York University - 33 Boston Univ - 43 Tulane University - 33 Providence College - 41 Fordham University - 32 Miami Univ, Ohio - 37 Lehigh University - 32 Loyola University Maryland - 37 Villanova University - 31 University of Maryland, College Park - 36 Wake Forest Univ - 30
17 Colleges Receiving 20 Or More Applications University of Vermont - 29 University of Virginia - 28 Tufts University - 27 Clemson University - 27 Bucknell University - 26 Elon University - 26 Univ of Massachusetts, Amherst 25 Gettysburg College - 24 The University of Scranton - 24 The George Washington Univ - 24 Saint Joseph's University - 23 Quinnipiac University - 23 Univ of Rhode Island - 23 The Univ of North Carolina at Chapel Hill - 23 Indiana University at Bloomington - 22 Lafayette College - 22 Marist College - 22 Univ of Southern California - 22 University of Richmond - 22 Vanderbilt University - 20

18 Percentage of Schools Applied

19 Percentage of Schools Applied Area of Focus: Broaden the exposure students have to colleges and universities not historically popular with Chatham families.

20 College Admission Rep Visits 151 Visits This Fall

21 Did you know... The University of Hartford D1 sports and all games are FREE for students Housing guaranteed for all 4 years, housing with 24 hour quiet hours Automatic consideration for merit money, no extra application to fill out! All majors have the opportunity to study abroad! A 7 year Physical Therapy Program BS in Health Science and Dr. Of Physical Therapy 100% job placement upon graduation 98% of students pass first time DPT exam
22
23
24
25 College Board AP Scholar Designation Designation Criteria AP Scholar Scores of 3 or higher on three or more AP exams AP Scholar w/honors Average of at least 3.25 on all tests taken and 3 or higher on 4 or more of these exams AP Scholar W/Distinction Average of at least 3.5 on all AP exams taken, and scores of 3 or higher on 5 or more National AP Scholar US students who receive an average score of at least 4 on all tests taken and scores of 4 or higher on eight or more 27 29
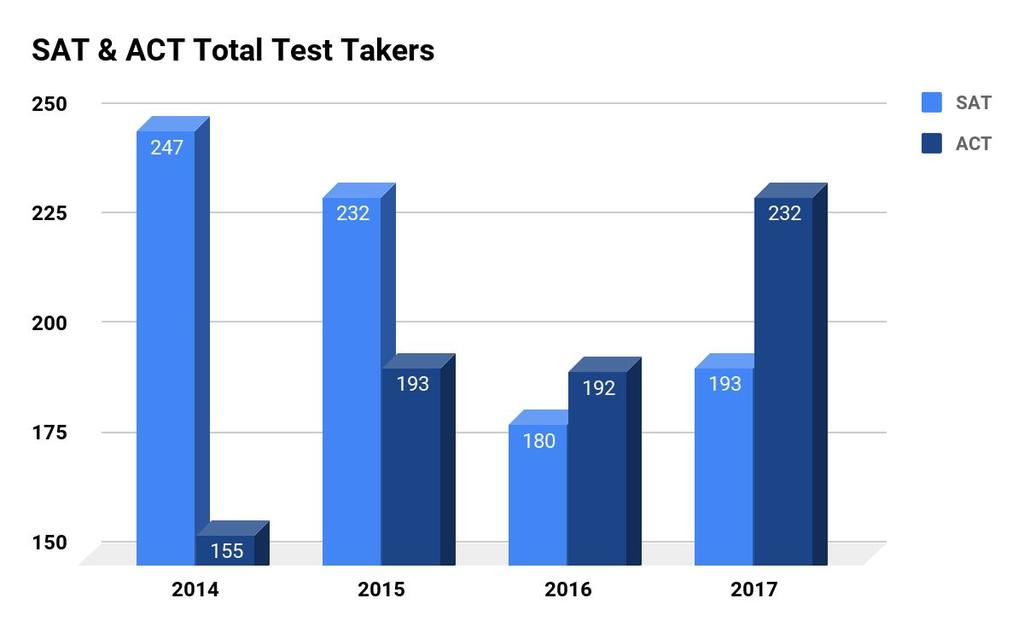
26 Mean SAT Scores, Class of 2017

27 Mean Scores SAT Subject Tests
28
29
30 Alumni
31 Most Common Institutions of Enrollment in the Fall Immediately Following High School Graduation Since 2010 Name Rank Total County College of Morris 1 76 Villanova University 2 54 Penn State Univ 3 44 Rutgers 4 32 Loyola 5 30 Boston College 6 29 Univ Delaware 7 29 College of New Jersey 8 27 Gettysburg College 9 25 Lehigh University 10 25
32 Thank You
WHERE THE CLASS OF 2012 ATTENDS COLLEGE College Choices (Number attending is based upon where final transcript was mailed.)
") WHERE THE CLASS OF 2012 ATTENDS COLLEGE College Choices (Number attending is based upon where final transcript was mailed.) American University (4) Amherst College (1) Arcadia University (2) Arizona State
WHERE THE CLASS OF 2012 ATTENDS COLLEGE College Choices (Number attending is based upon where final transcript was mailed.) American University (4) Amherst College (1) Arcadia University (2) Arizona State
2013 Ranking System Details
 2013 Ranking System Details WHY CHANGE THE RANKING SYSTEM? The purpose of instituting a new ranking system is to have a system that more accurately ranks teams against other teams in the league. In previous
College Matriculation ( )
") College Matriculation (2014-2018) American University (2) Amherst College Assumption College (9) Babson College (5) Bard College (3) Barnard College (5) Bates College (4) Baylor University Bennington College
College Matriculation (2014-2018) American University (2) Amherst College Assumption College (9) Babson College (5) Bard College (3) Barnard College (5) Bates College (4) Baylor University Bennington College
WHERE THE CLASS OF 2014 ATTENDS COLLEGE
 WHERE THE CLASS OF 2014 ATTENDS COLLEGE Albany College of Pharmacy (1) Albright College (1) American University (6) Arizona State University (1) Auburn University (2) Bard College (1) Bentley University
Where the Class of 2016 Attends College
 Where the Class of 2016 Attends College Albany College of Pharmacy (1) Albright College (1) Alvernia University (1) American Musical and Dramatic Academy (AMDA) (1) American University (5) Amherst College
1. The University of Alabama 2. Alvernia University 3. American University 4. Appalachian State University 5. Arcadia University 6.
 1. The University of Alabama 2. Alvernia University 3. American University 4. Appalachian State University 5. Arcadia University 6. Arizona State University 7. The University of Arizona 8. Auburn University
WHERE THE CLASS OF 2015 ATTENDS COLLEGE
 Adelphi University (1) American University (7) Appalachian State University (1) Arcadia University (2) Arizona State University (1) Art Center College of Design (1) Auburn University (2) Babson College
The Prout School Colleges to Which Our 2017 Graduates Have Been Accepted
 Adelphi University Albany College of Pharmacy American University American University of Paris Anna Maria College Arcadia University Assumption College Babson University Barry University Boston College
DOCTORAL/RESEARCH INSTITUTIONS RECEIVING FULBRIGHT AWARDS FOR
 DOCTORAL/RESEARCH INSTITUTIONS RECEIVING FULBRIGHT AWARDS FOR 2015-2016 Those institutions highlighted in blue are listed in the Chronicle of Higher Education Institution State Grants Applications Harvard
HINGHAM HIGH SCHOOL CLASS OF 2015
 American University 3 1 2 Arizona State University 3 2 Arkansas State University 1 1 Assumption College 5 0 Ball State University 1 0 Bard College 2 0 2 Barnard College 1 0 1 Bates College 1 1 1 Bentley
Sears Directors' Cup Final Standings
 1 Stanford 662.5 5 59.5 2 63.0 4 61.0 3 61.5 1 64.0 57 0.0 54 0.0 971.5 2 North Carolina 565.0 53.0 17 44.5 19 46.0 8 57.0 41 17.5 16 0.0 7 58.0 9 54.5 789.5 3 UCLA 485.5 118.0 7 58.0 1 64.0 5 58.5 3 61.5
Oxbridge Class of 2018 College Acceptances as of 4/2/18
 Oxbridge Class of 2018 College Acceptances as of 4/2/18 Abilene Christian University Alvernia University American University Appalachian State University Arizona State University Arizona State University
U.S. Track & Field and Cross Country Coaches Association
 Men Arizona State University Belmont University Binghamton University Boston University Bradley University Brigham Young University Brown University Bucknell University Central Michigan University Colgate
CSCAA NCAA Division I Scholar All-America Teams
 College Swimming Coaches Association of America- For Immediate Release March 5, 2014 Contact: Joel Shinofield, Executive Director (540) 460-6563; joel@cscaa.org CSCAA NCAA Division I Scholar All-America
Table 2 Overall Heterodox-Adjusted Rankings for Ph.D.-Granting Institutions in Economics
 ing Economics Departments in a Contested Discipline 23 Heterodox-Adjusted ings for Ph.D.-Granting Institutions in Economics ) ) Harvard U 43 1 (1) 5.47 1 (1) UC Berkeley 56 2 (2) 4.08 4 (4) Princeton U
Class of 2018 College Acceptance List
 Class of 2018 College Acceptance List Listed below are the colleges, universities and other institutions of higher learning that members of the Methacton High School Class of 2018 report that they have
Class 2018 Charts and Graphs. Overall Breakdown by Various Categories
 Class 2018 Charts and Graphs Overall Breakdown by Various Categories Public vs. Private Public vs. Private by State Geographical Distribution New York State Geographical Distribution New York City Distribution
WOMEN S BASKETBALL COMPOSITE SCHEDULE
 WOMEN S BASKELL Tuesday, November 6 Duquesne at TCU Tuesday, November 13 Indiana State at Saint Louis 5:30 pm ESPN+ Loyola (MD) at George Mason 4:00 pm ESPN+ Canisius at St. Bonaventure ESPN+ Sacred Heart
Decline Admission to Boston College Law School Fall 2018
 Decline Admission to Boston College Law School Fall 2018 We are sorry to hear that you will not be attending Boston College Law School. Please complete and submit this form to formally decline your admission
Oak Park Class of 2011 Post Graduation Plans
 Oak Park Class of 2011 Post Graduation Plans Total 4 Yr Colleges 173 Public In-state 94 Private In-state 20 Public Out-of-state 28 Private Out-of-state 27 Non U.S. 4 Yr Colleges 4 2 Yr Colleges 99 Public
Class of 2017 Acceptances College Acceptances Attending
 Class of 2017 Acceptances College Acceptances Attending The University of Alabama 6 2 Allegheny College 2 1 American International College 1 0 American University 9 3 Arizona State University 2 0 The University
New Explorations into Science Technology + Math
 New Explorations into Science Technology + Math College Acceptances Class of 2012 Adelphi University Adelphi University (College of Arts & Sciences) Adelphi University (School of Business) Alabama State
Appalachian State University L500030AppStUBlkVinyl. University of Alabama L500030AlabmaBlkVinyl. Arizona State University L500030ArizStBlkVinyl
 University of Alabama at Birmingham L500030AlaBirBlkVinyl University of Alabama L500030AlabmaBlkVinyl Appalachian State University L500030AppStUBlkVinyl Arizona State University L500030ArizStBlkVinyl University
US News and World Report Rankings Graduate Economics Programs Ranked in 2001
 The following list reports the rankings done in 1995 by William H. Kaempfer and Chao Jing of the University of Colorado at Boulder. Their list compiles six earlier studies into an aggregate ranking. Rankings
TROJAN SEXUAL HEALTH REPORT CARD. The Annual Rankings of Sexual Health Resources at American Colleges and Universities. TrojanBrands.
 TROJAN SEXUAL HEALTH The Annual Rankings of Sexual Health Resources at American Colleges and Universities PRESENTED BY TOP 10 1 UNIVERSITY OF GEORGIA 2 OREGON STATE UNIVERSITY 3 UNIVERSITY OF MICHIGAN
COLLEGE/UNIVERSITY VISIT CLUSTERS
 COLLEGE/UNIVERSITY VISIT CLUSTERS The groupings of colleges and universities below are by no means exhaustive; these ideas are meant to serve as good starting points when beginning a college search. Happy
Bloomsburg University of Pennsylvania Borough of Manhattan Community College of the CUNY Boston College
 Bloomsburg University of Pennsylvania Borough of Manhattan Community College of the CUNY Boston College California Institute of Technology California Institute of the Arts Calvary Chapel Bible College
Class 2017 Charts and Graphs. Overall Breakdown by Various Categories
 Class 2017 Charts and Graphs Overall Breakdown by Various Categories Public vs. Private Public vs. Private by State Geographical Distribution New York State Geographical Distribution New York City Distribution
 3+ 3+ N = 155, 442 3+ R 2 =.32 < < < 3+ N = 149, 685 3+ R 2 =.27 < < < 3+ N = 99, 752 3+ R 2 =.4 < < < 3+ N = 98, 887 3+ R 2 =.6 < < < 3+ N = 52, 624 3+ R 2 =.28 < < < 3+ N = 36, 281 3+ R 2 =.5 < < < 7+
COLLEGE BASKETBALL. Jamaican Classic Montego Bay
 COLLEGE BASKETBALL 2017-18 SCHEDULE DATE GAME TIME FRI 11/10 Veterans Classic at the U.S. Naval Academy Memphis vs. Alabama 6:30 Pittsburgh vs. Navy 9:00 SUN 11/12 Princeton at Butler 6:00 MON 11/13 College
U.S. Psychology. Departments
 Table of Contents Department Ratings Links Home U.S. Psychology Distinguished Strong Good Departments This page ranks United States doctoral programs in psychology based on the 1995 study conducted by
Binghamton University Bloomsburg University of Pennsylvania Borough of Manhattan Community College of the CUNY
 Adelphi University Albany College of Pharmacy and Health Sciences Albright College American International College American University Arcadia University Arizona State University Artist Makeup Academy Auburn
U.S. Patents Awarded in 2005 Top 20 Universities
 U.S. Awarded in 2005 1 California Institute of Technology 172 2 Massachusetts Institute of Technology 133 3 U. of Wisconsin at Madison 89 4 Johns Hopkins U. 81 5 U. of Michigan at Ann Arbor 80 6 U. of
Drink Mats Grill Mats
 Alabama A&M Alabama State Alabama-ALogo 14000 12115 15500 Alabama at Birmingham Alabama at Huntsville Alabama-Elephant Logo 9064 Appalachian State Arizona 10328 Arizona State 10329 Arkansas 14015 12116
WELCOME TO THE 65TH ANNUAL COLLEGE NIGHT 2016! AT SCOTCH PLAINS-FANWOOD HIGH SCHOOL Tuesday, November 1, 2016 at 7:00 P.M. Don't Miss It!!!
 WELCOME TO THE 65TH ANNUAL COLLEGE NIGHT 2016! AT SCOTCH PLAINS-FANWOOD HIGH SCHOOL Tuesday, November 1, 2016 at 7:00 P.M. Don't Miss It!!! As of 10/14/16 Name of College/University or Branch of Military
Organization Albany College of Pharmacy and Health Sciences Albright College Alfred University Allegheny College Alvernia University American College
 Organization Albany College of Pharmacy and Health Sciences Albright College Alfred University Allegheny College Alvernia University American College Dublin American University Arcadia Univeresity ASU
COLLEGE ACCEPTANCE AND MATRICULATION SCHOLARSHIPS & AWARDS
 Palos Verdes High School Profile The represented the 13 th graduating class since the school re-opened in 2003. In the 2016-17 academic year the total enrollment at Palos Verdes High School was 1698 students.
Board of Visitors Committee on Financial Affairs. November 20, 2015
 Board of Visitors Committee on Financial Affairs November 20, 2015 William & Mary Committee on Financial Affairs Resolution 11 Continuation: William & Mary Promise Resolution 12 Resolution 13 Receipt of
WELCOME TO THE 66 TH ANNUAL COLLEGE NIGHT 2017!! AT SCOTCH PLAINS-FANWOOD HIGH SCHOOL Wednesday, November 1, 2017 AT 7:00 PM. Don t Miss It!!!!
 WELCO TO THE 66 TH ANNUAL COLLEGE NIGHT 2017!! AT SCOTCH PLAS-FANWOOD HIGH SCHOOL Wednesday, November 1, 2017 AT 7:00 PM Don t Miss It!!!! As of 10/3/2017 146 schools are in attendance: College/University
Undergraduate Schools Represented in Student Body
 Undergraduate Schools Represented in Student Body Undergraduate Colleges and Universities represented at Tulane Law School (2008-2009): Alabama Auburn University 2 Birmingham Southern College 1 Samford
COLLEGE BASKETBALL. Jamaican Classic Montego Bay
 COLLEGE BASKETBALL 2017-18 SCHEDULE DATE GAME TIME FRI 11/10 Veterans Classic at the U.S. Naval Academy Memphis vs. Alabama 6:30 Pittsburgh vs. Navy 9:00 SUN 11/12 Princeton at Butler 6:00 MON 11/13 College
Domestic Student Recruiting Strategies
 Domestic Student Recruiting Strategies Jim Sherwood Associate Dean for Graduate Studies University of Massachusetts Lowell The Chicago Conference for Associate Deans of Research at Small and Mid-Sized
Academy(of(the(Holy(Angels(
 ! Academy(of(the(Holy(Angels( http://www.holyangels.org1!! 1 11 1879; One of the oldest private schools in New Jersey. Middle States Association of Schools and College, National Blue Ribbon School of Excellent.
TABLE 3c: Congressional Districts with Number and Percent of Hispanics* Living in Hard-to-Count (HTC) Census Tracts**
 Census Tracts**") living Alaska 00 47,808 21,213 44.4 Alabama 01 20,661 3,288 15.9 Alabama 02 23,949 6,614 27.6 Alabama 03 20,225 3,247 16.1 Alabama 04 41,412 7,933 19.2 Alabama 05 34,388 11,863 34.5 Alabama 06 34,849 4,074
living Alaska 00 47,808 21,213 44.4 Alabama 01 20,661 3,288 15.9 Alabama 02 23,949 6,614 27.6 Alabama 03 20,225 3,247 16.1 Alabama 04 41,412 7,933 19.2 Alabama 05 34,388 11,863 34.5 Alabama 06 34,849 4,074
TABLE 3b: Congressional Districts Ranked by Percent of Hispanics* Living in Hard-to- Count (HTC) Census Tracts**
 Census Tracts**") Rank State District Count (HTC) 1 New York 05 150,499 141,567 94.1 2 New York 08 133,453 109,629 82.1 3 Massachusetts 07 158,518 120,827 76.2 4 Michigan 13 47,921 36,145 75.4 5 Illinois 04 508,677 379,527
Rank State District Count (HTC) 1 New York 05 150,499 141,567 94.1 2 New York 08 133,453 109,629 82.1 3 Massachusetts 07 158,518 120,827 76.2 4 Michigan 13 47,921 36,145 75.4 5 Illinois 04 508,677 379,527
Public Accounting Report
 Public Accounting Report THE INDEPENDENT NEWSLETTER OF THE ACCOUNTING PROFESSION SINCE 1978 AUGUST 2018 VOLUME XLII, NO. 8 IN THIS ISSUE 2 2018 Top 50 Undergraduate Accounting Programs 3 Top 25 Undergraduate
Sun Mon Tue Wed Thu Fri Sat Virginia Tech. 13 San Diego State Miami (OH) Indiana University Texas Christian University Penn State
 Indiana University Texas Christian University Penn State") Beacon Hill Staffing Group Campus Calendar 2017 (***For a complete alphabetized list of campus visits, please scroll to the end of the calendar) September * denotes on-campus interviews scheduled for that
Beacon Hill Staffing Group Campus Calendar 2017 (***For a complete alphabetized list of campus visits, please scroll to the end of the calendar) September * denotes on-campus interviews scheduled for that
President Dennis Assanis
 President Dennis Assanis Strategic Planning Where are we now? Where do we want to go? Identify peer institutions for comparison current and aspirational Articulate shared vision and identify cross-cutting
Name. Class. Year. trojan sexual health report card edition THE ANNUAL RANKING OF SEXUAL HEALTH RESOURCES AT AMERICAN COLLEGES & UNIVERSITIES
 Name Class Year trojan sexual health report card 2010 edition THE ANNUAL RANKING OF SEXUAL HEALTH RESOURCES AT AMERICAN COLLEGES & UNIVERSITIES important use no.1 condom Trojan Brand condoms trusted for
Gamma Sigma Alpha Regional GPA Awards Honor Roll
 Gamma Sigma Alpha Regional GPA Awards Honor Roll Spring & Fall 2014 Celebrating the Fraternity/Sorority Communities with a GPA above the all- undergraduate GPA Spring 2014 Arizona State University Austin
The American Legion NATIONAL MEMBERSHIP RECORD
 The American Legion NATIONAL MEMBERSHIP RECORD www.legion.org 2016 The American Legion NATIONAL MEMBERSHIP RECORD 1920-1929 Department 1920 1921 1922 1923 1924 1925 1926 1927 1928 1929 Alabama 4,474 3,246
2009 Marketing Academia Labor Market Survey May 20, 2009
 2009 Labor Market Report / 1 2009 Marketing Academia Labor Market Survey May 20, 2009 Chris Janiszewski, Warrington School of Business, University of Florida Geeta Menon, The Wharton School, University
KANG CHIAO INTERNATIONAL SCHOOL - TAIPEI. University Acceptances of Class Class 2017 Graduates: 177 students
 KANG CHIAO INTERNATIONAL SCHOOL - TAIPEI University Acceptances of Class 2017 Class 2017 Graduates: 177 students Applied to USA universities: 139 students Admitted to USA Top 100: 136 students / Acceptance
2 All-Time College football Attendance. All-Time NCAA Attendance. Annual Football Bowl Subdivision (FBS) Attendance
 Attendance") Attendance Records All-Time College Football Attendance... 2 All-Time NCAA Attendance... 2 Annual Conference Attendance Leaders... 3 Largest Regular-Season Crowds... 10 2009 Attendance... 10 Annual Team
Attendance Records All-Time College Football Attendance... 2 All-Time NCAA Attendance... 2 Annual Conference Attendance Leaders... 3 Largest Regular-Season Crowds... 10 2009 Attendance... 10 Annual Team
APPROVED NURSING RESEARCH COURSES FOR APRN PROGRAM
 APPROVED NURSING RESEARCH COURSES FOR APRN PROGRAM Institution Course Andrews University NRSG 445 Arizona State University NUR 315 Augusta University NURS 3807 Azusa Pacific University UNRS 425 or UNRS
Scoring Algorithm by Schiller Industries
 As of June 28, 2017 MEN'S CUP STANDINGS Points WOMEN'S CUP STANDINGS Points 1. Ohio State 111 1. Stanford 175.5 2. Florida 105 2. USC 129 3. North Carolina 100 3. Florida 87 4. Stanford 94.5 4. Oregon
CILogon & InCommon & Federated Identity. Jim Basney
 CILogon & InCommon & Federated Identity Jim Basney Federated Identity Federated Identity for R&E geni.net opensciencedatacloud.org Federated Identity for R&E dmptool.org Federated
Randolph High School Guidance and Counseling Department. Class of 2016 Annual Report
 Randolph High School Guidance and Counseling Department Class of 2016 Annual Report Submitted by: Randolph High School Guidance Department Charles Dimiceli Director July, 2016 Report on the Class of 2016
FDP Expanded Clearinghouse Participants (as of February 8, 2018)
") Arizona State University Augusta University Research Institute, Inc. Ball State University Beckman Research Institute of the City of Hope Boston College Boston University (Charles River Campus) Boston
Arizona State University Augusta University Research Institute, Inc. Ball State University Beckman Research Institute of the City of Hope Boston College Boston University (Charles River Campus) Boston
AMERICAN ASSOCIATION FOR AGRICULTURAL EDUCATION FACULTY SALARIES
 AMERICAN ASSOCIATION FOR AGRICULTURAL EDUCATION 1999-2000 FACULTY SALARIES Contents Page Summary Data for 1999-2000 Faculty FTEs by Region Nine-month appointments (Table 1)...2 Twelve-month appointments
Transfer Student Enrollment
 Peer List Public Appalachian State 16,595 1,596 9.6% 1,296 81.2% 300 18.8% College of Charleston 10,375 756 7.3% 700 92.6% 56 7.4% James Madison of Mary Washington of North Carolina Wilmington 19,548 784
Ethnic Studies Asst 55, ,755-2, ,111 4,111
 A&S Prof 99,202 163 112,307-13,105-11.67 2,136,071 2,210,459 Asso 69,100 115 74,200-5,101-6.87 586,572 648,916 Asst 60,014 78 62,194-2,181-3.51 170,088 256,767 Total 80,892 356 89,017-8,126-9.13 2,892,731
Ethnic Studies Asst 54, ,315-3, ,229 6,229. Gen Honors/UC Asso 64, ,402-4, ,430 24,430
 A&S Prof 99,280 157 110,954-11,674-10.52 1,832,807 2,010,866 Asso 70,144 112 73,921-3,777-5.11 422,998 603,376 Asst 60,165 82 62,465-2,300-3.68 188,570 269,597 Total 80,845 351 87,809-6,964-7.93 2,444,375
2013 Sexual Health. Report Card. The Annual Rankings of Sexual Health Resources at American Colleges and Universities BRAND CONDOMS
 BRAND CONDOMS Report Card The Annual Rankings of Resources at American Colleges and Universities TOP 10 Report Card 1 2 3 4 5 6 7 8 9 10 Princeton University Columbia University University of Arizona University
April 17, 2017 Howard Hughes Medical Institute Page 1 of General Investigator Competition List of Eligible Institutions
 April 17, 2017 Howard Hughes Medical Institute Page 1 of 6 Aaron Diamond AIDS Research Center Albany Medical College Albert Einstein College of Medicine Arizona State University Baylor College of Medicine
Digitization and Aggregation Enabling a Print Network
 HATHITRUST DIGITAL LIBRARY Digitization and Aggregation Enabling a Print Network Mike Furlough Executive Director, HathiTrust 15 August 2016 2016 IFLA World Library and Information Congress Columbus, OH
Organization Adelphi University Albany College of Pharmacy and Health Sciences Albright College Alfred University Allegheny College Alvernia
 Organization Adelphi University Albany College of Pharmacy and Health Sciences Albright College Alfred University Allegheny College Alvernia University American College Dublin American University Antonelli
All-Time College Football. Attendance. All-Time NCAA Attendance. Annual Football Bowl Subdivision (FBS) Attendance. Annual Total NCAA Attendance
 Attendance. Annual Total NCAA Attendance") Attendance Records All-Time College Football Attendance... 2 All-Time NCAA Attendance... 2 Annual Conference Attendance Leaders... 3 Largest Regular-Season Crowds... 10 2012 Attendance... 11 Annual Team
Attendance Records All-Time College Football Attendance... 2 All-Time NCAA Attendance... 2 Annual Conference Attendance Leaders... 3 Largest Regular-Season Crowds... 10 2012 Attendance... 11 Annual Team
Registration Priority for Athletes -- Survey of Universities Updated February 2007 Alice Poehls, UNC Chapel Hill
 Registration Priority for -- Survey of Universities Updated February 2007 Alice Poehls, UNC Chapel Hill Questions were originally asked by Bruce Cunningham, Duke University, to the AAU group in 2000 and
Revenues, Expenses, and Operating Profits of U. S. Lotteries, FY 2002
 Revenues, Expenses, and Operating Profits of U. S. Lotteries, APPENDIX A Table A.1: Lottery Sales Excluding Sales From Video Lottery Terminals, Table A.2: Sales from Video Lottery Terminals Table A.3:
Welcome Parents & Students of the Class of 2022
 s t n e r a P ts e en m 2 d e o 2 u c h t 0 l t S 2 e f W & o of s s a l C #wallin Thank you WHS Navy National Defense Cadet Corps NNDCC Presentation of Colors Pledge of Allegiance Thank You WHS Music
Name: Date: Albany: Jefferson City: Annapolis: Juneau: Atlanta: Lansing: Augusta: Lincoln: Austin: Little Rock: Baton Rouge: Madison: Bismarck:
 Albany: Annapolis: Atlanta: Augusta: Austin: Baton Rouge: Bismarck: Boise: Boston: Carson City: Charleston: Cheyenne: Columbia: Columbus: Concord: Denver: Des Moines: Dover: Frankfort: Harrisburg: Hartford:
Unemployment Rate (%) Rank State. Unemployment
 Rank State. Unemployment") States Ranked by February 2018 Unemployment Rate Seasonally Adjusted Unemployment Unemployment Unemployment 1 Hawaii 2.1 19 Alabama 3.7 33 Ohio 4.5 2 New Hampshire 2.6 19 Missouri 3.7 33 Rhode Island 4.5
States Ranked by February 2018 Unemployment Rate Seasonally Adjusted Unemployment Unemployment Unemployment 1 Hawaii 2.1 19 Alabama 3.7 33 Ohio 4.5 2 New Hampshire 2.6 19 Missouri 3.7 33 Rhode Island 4.5
Unemployment Rate (%) Rank State. Unemployment
 Rank State. Unemployment") States Ranked by November 2015 Unemployment Rate Seasonally Adjusted Unemployment Unemployment Unemployment 1 North Dakota 2.7 19 Indiana 4.4 37 Georgia 5.6 2 Nebraska 2.9 20 Ohio 4.5 37 Tennessee 5.6
States Ranked by November 2015 Unemployment Rate Seasonally Adjusted Unemployment Unemployment Unemployment 1 North Dakota 2.7 19 Indiana 4.4 37 Georgia 5.6 2 Nebraska 2.9 20 Ohio 4.5 37 Tennessee 5.6
Unemployment Rate (%) Rank State. Unemployment
 Rank State. Unemployment") States Ranked by April 2017 Unemployment Rate Seasonally Adjusted Unemployment Unemployment Unemployment 1 Colorado 2.3 17 Virginia 3.8 37 California 4.8 2 Hawaii 2.7 20 Massachusetts 3.9 37 West Virginia
States Ranked by April 2017 Unemployment Rate Seasonally Adjusted Unemployment Unemployment Unemployment 1 Colorado 2.3 17 Virginia 3.8 37 California 4.8 2 Hawaii 2.7 20 Massachusetts 3.9 37 West Virginia
Unemployment Rate (%) Rank State. Unemployment
 Rank State. Unemployment") States Ranked by August 2017 Unemployment Rate Seasonally Adjusted Unemployment Unemployment Unemployment 1 North Dakota 2.3 18 Maryland 3.9 36 New York 4.8 2 Colorado 2.4 18 Michigan 3.9 38 Delaware 4.9
States Ranked by August 2017 Unemployment Rate Seasonally Adjusted Unemployment Unemployment Unemployment 1 North Dakota 2.3 18 Maryland 3.9 36 New York 4.8 2 Colorado 2.4 18 Michigan 3.9 38 Delaware 4.9
Unemployment Rate (%) Rank State. Unemployment
 Rank State. Unemployment") States Ranked by March 2016 Unemployment Rate Seasonally Adjusted Unemployment Unemployment Unemployment 1 South Dakota 2.5 19 Delaware 4.4 37 Georgia 5.5 2 New Hampshire 2.6 19 Massachusetts 4.4 37 North
States Ranked by March 2016 Unemployment Rate Seasonally Adjusted Unemployment Unemployment Unemployment 1 South Dakota 2.5 19 Delaware 4.4 37 Georgia 5.5 2 New Hampshire 2.6 19 Massachusetts 4.4 37 North
Unemployment Rate (%) Rank State. Unemployment
 Rank State. Unemployment") States Ranked by September 2017 Unemployment Rate Seasonally Adjusted Unemployment Unemployment Unemployment 1 North Dakota 2.4 17 Indiana 3.8 36 New Jersey 4.7 2 Colorado 2.5 17 Kansas 3.8 38 Pennsylvania
States Ranked by September 2017 Unemployment Rate Seasonally Adjusted Unemployment Unemployment Unemployment 1 North Dakota 2.4 17 Indiana 3.8 36 New Jersey 4.7 2 Colorado 2.5 17 Kansas 3.8 38 Pennsylvania
Unemployment Rate (%) Rank State. Unemployment
 Rank State. Unemployment") States Ranked by December 2017 Unemployment Rate Seasonally Adjusted Unemployment Unemployment Unemployment 1 Hawaii 2.0 16 South Dakota 3.5 37 Connecticut 4.6 2 New Hampshire 2.6 20 Arkansas 3.7 37 Delaware
States Ranked by December 2017 Unemployment Rate Seasonally Adjusted Unemployment Unemployment Unemployment 1 Hawaii 2.0 16 South Dakota 3.5 37 Connecticut 4.6 2 New Hampshire 2.6 20 Arkansas 3.7 37 Delaware
Unemployment Rate (%) Rank State. Unemployment
 Rank State. Unemployment") States Ranked by September 2015 Unemployment Rate Seasonally Adjusted Unemployment Unemployment Unemployment 1 North Dakota 2.8 17 Oklahoma 4.4 37 South Carolina 5.7 2 Nebraska 2.9 20 Indiana 4.5 37 Tennessee
States Ranked by September 2015 Unemployment Rate Seasonally Adjusted Unemployment Unemployment Unemployment 1 North Dakota 2.8 17 Oklahoma 4.4 37 South Carolina 5.7 2 Nebraska 2.9 20 Indiana 4.5 37 Tennessee
Unemployment Rate (%) Rank State. Unemployment
 Rank State. Unemployment") States Ranked by November 2014 Unemployment Rate Seasonally Adjusted Unemployment Unemployment Unemployment 1 North Dakota 2.7 19 Pennsylvania 5.1 35 New Mexico 6.4 2 Nebraska 3.1 20 Wisconsin 5.2 38 Connecticut
States Ranked by November 2014 Unemployment Rate Seasonally Adjusted Unemployment Unemployment Unemployment 1 North Dakota 2.7 19 Pennsylvania 5.1 35 New Mexico 6.4 2 Nebraska 3.1 20 Wisconsin 5.2 38 Connecticut
Unemployment Rate (%) Rank State. Unemployment
 Rank State. Unemployment") States Ranked by July 2018 Unemployment Rate Seasonally Adjusted Unemployment Unemployment Unemployment 1 Hawaii 2.1 19 Massachusetts 3.6 37 Kentucky 4.3 2 Iowa 2.6 19 South Carolina 3.6 37 Maryland 4.3
States Ranked by July 2018 Unemployment Rate Seasonally Adjusted Unemployment Unemployment Unemployment 1 Hawaii 2.1 19 Massachusetts 3.6 37 Kentucky 4.3 2 Iowa 2.6 19 South Carolina 3.6 37 Maryland 4.3
Randolph High School Guidance and Counseling Department. Class of 2017 Annual Report
 Randolph High School Guidance and Counseling Department Class of 2017 Annual Report Submitted by: Randolph High School Guidance Department Charles Dimiceli Director July, 2017 Report on the Class of 2017
COLLEGE REPORT. Class of Benet Academy
 COLLEGE REPORT Class of 2013 Benet Academy College Report Class of 2013 Table of Contents Attendance Totals to Individual Colleges and Universities... 1 Totals by Types of Colleges and Universities...
Index of religiosity, by state
 Index of religiosity, by state Low Medium High Total United States 19 26 55=100 Alabama 7 16 77 Alaska 28 27 45 Arizona 21 26 53 Arkansas 12 19 70 California 24 27 49 Colorado 24 29 47 Connecticut 25 32
MEMO STEVE BERLIN, EXECUTIVE DIRECTOR, BOARD OF ETHICS, CITY OF CHICAGO
 MEMO TO: STEVE BERLIN, EXECUTIVE DIRECTOR, BOARD OF ETHICS, CITY OF CHICAGO AMER AHMAD, COMPTROLLER, CITY OF CHICAGO FROM: SUBJECT: KATHRYN O CONNELL, ASSISTANT TO THE MAYOR CPS PENNANT PROJECT ETHICS
Organization Albertus Magnus College Albright College Alfred University Allegheny College Alvernia University American College Dublin American
 Organization Albertus Magnus College Albright College Alfred University Allegheny College Alvernia University American College Dublin American University Antonelli Institute Arcadia Univeresity Arizona
Employment Outcomes, New York / Metro NYC Law Schools
 State and % employed Univ of Pennsylvania (PA 18%) Employment Outcomes, New York / Metro NYC Law Schools NYU (NY 68%) Duke (NC 11%) Columbia (NY 61%) Cornell (NY 54%) Univ of Virginia (VA 12%) Harvard
FEDERAL R&D FUNDING BY STATE
 SOCIAL & BEHAVIORAL SCIENCE FEDERAL R&D FUNDING BY STATE 2017 /resources/state-fact-sheets TABLE OF CONTENTS State Total Social Science R&D Page Why Social Science? 3 Alabama $13.5 million 4 Alaska $2.4
41/95/2 Student Affairs ATO Chapters Chapter Composites File,
 41/95/2 Student Affairs ATO Chapters Chapter Composites File, 1867-2015 Note: Due to preservation considerations, pre-1950 and modern composites have been separated. Please be aware that older composites
College Report. Class of Benet Academy
 College Report Class of 2014 Benet Academy College Report Class of 2014 Table of Contents Attendance Totals to Individual Colleges and Universities... 1 Totals by Types of Colleges and Universities...
Percentage of Enrolled Students by Program Type, 2016
 Percentage of Enrolled Students by Program Type, 2016 Doctorate 4% PN/VN 3% MSN 15% ADN 28% BSRN 22% Diploma 2% BSN 26% n = 279,770 Percentage of Graduations by Program Type, 2016 MSN 12% Doctorate 1%
COLLEGE ACCEPTANCES: CLASSES
 COLLEGE ACCEPTANCES: CLASSES 2012 2017 In the past six years, graduates of Boston University Academy have been accepted to the following colleges and universities. The number of BUA students from these
Engineering bachelor s degrees recovered in 2008
 6 5 4 3 2 1 Engineering by the Numbers By Michael T. Gibbons Engineering bachelor s degrees recovered in 28 from a slight dip in 27, reaching 74,17 for a 1.2 percent gain. Excluding computer science, the
Graduate Schools Class of 2015 Air Force Insitute of Technology Arizona State University Arrhythmia Technologies Institute ATI, Greenville, South
 Graduate Schools Class of 2015 Air Force Insitute of Technology Arizona State University Arrhythmia Technologies Institute ATI, Greenville, South Carolina Auburn Ball State Boston University Boston University
Booth Number: Booth Number: Booth Number: Blair School of Music at Vanderbilt University Booth Number:
 2016 PVA Fair - Boston, Start Date: 10/27/2016 End Date: 10/28/2016 Exhibitor Listing Adelphi University http://www.adelphi.edu American Academy of Dramatic Arts http://www.aada.edu Bard College at Simon's
Colgate University. Air Force ROTC at Illinois Institute of Tech. College of DuPage. Albion College. Allegheny College
 Air Force ROTC at Illinois Institute of Tech Albion College Allegheny College Alverno College American Academy of Art Andrews University Aquinas College Arizona State University Auburn University Augustana
Best-Known College Dance Programs
 Best-Known College Dance Programs Some programs do not require auditions; most do. Italics denotes particularly popular dance programs Alabama Birmingham-Southern College University of Alabama Arizona
2010 College Football
 2010 College Football Thursday, September 2, 2010 Southern Miss. v. South Carolina 6:30 PM 9:30 PM ESPN Thursday, September 2, 2010 USC at Hawaii 10:00 PM 1:00 AM ESPN Friday, September 3, 2010 Arizona
5 years to degree 6 years to degree 7 years 8 years 9 years 10 years Began PhD
 2000 01 15 5 0 4 1 2 1 2 0 Concordia Univ. (TT) King's College, London (TT) Southern Virginia U (TT) Hiram College (TT) Witherspoon Institute, Princeton U of South Carolina (TT) to University of Wisconsin,