Road Funding in Indiana
|
|
|
- Clyde Sims
- 6 years ago
- Views:
Transcription


1 On Local Government Road Funding in Indiana Larry DeBoer Purdue University October


2 Funding Sources, Indiana Highway Expenditures, 2013 (thousands of dollars) Local 402,750 16% Federal 970,770 38% State 1,178,620 46% Source: Pew Charitable Trust, Research and Analysis, Funding Challenges in Highway and Transit 2
3 Indiana Motor Fuel Taxes Gasoline Tax 18 cents/gallon Special Fuels Tax (Diesel) 16 cents/gallon Motor Carrier Surcharge Tax 11 cents/gallon Sales Tax 7% of sales price State Gasoline Excise Tax Rates, January 2015 Washington New Hampshire Montana North Dakota Minnesota Vermont Maine Oregon Massachusetts Idaho South Dakota Wisconsin New York Wyoming Michigan Rhode Island California Nevada Utah Colorado Nebraska Kansas Iowa Missouri Illinois Pennsylvania Ohio Indiana West Virginia Virginia Kentucky New Jersey Delaware Connecticut Tennessee North Carolina Maryland Arizona New Mexico Oklahoma Arkansas Mississippi Alabama South Carolina Georgia Cents per Gallon 0 to 20 Alaska Texas Louisiana Florida 20 to to 30 More than 30 Hawaii 3


4 Indiana ranks 11 th highest 54 cents/gallon 18 cents state excise 18 cents 7% sales 18 cents Federal 4
5 5
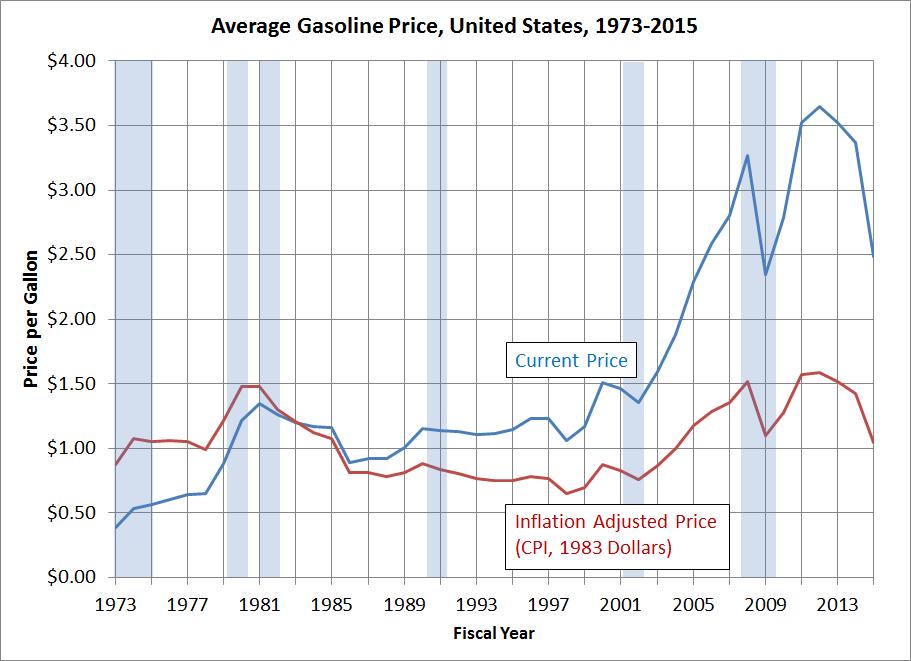
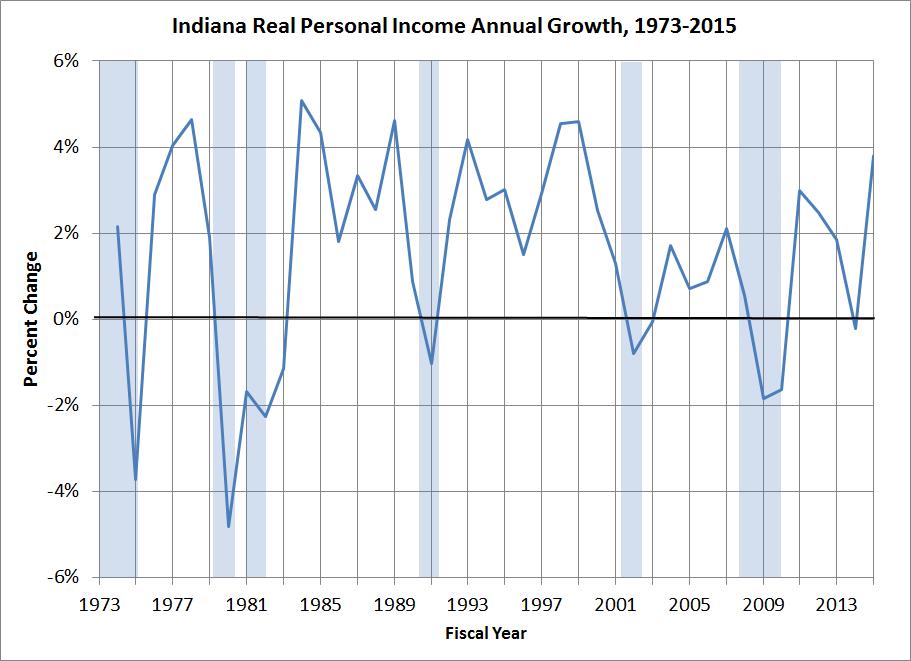
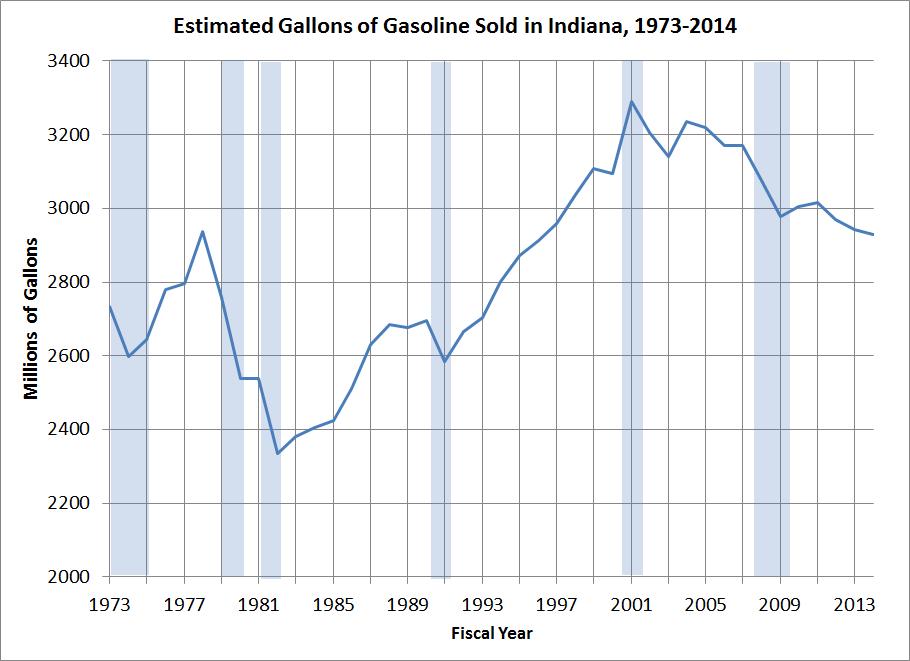
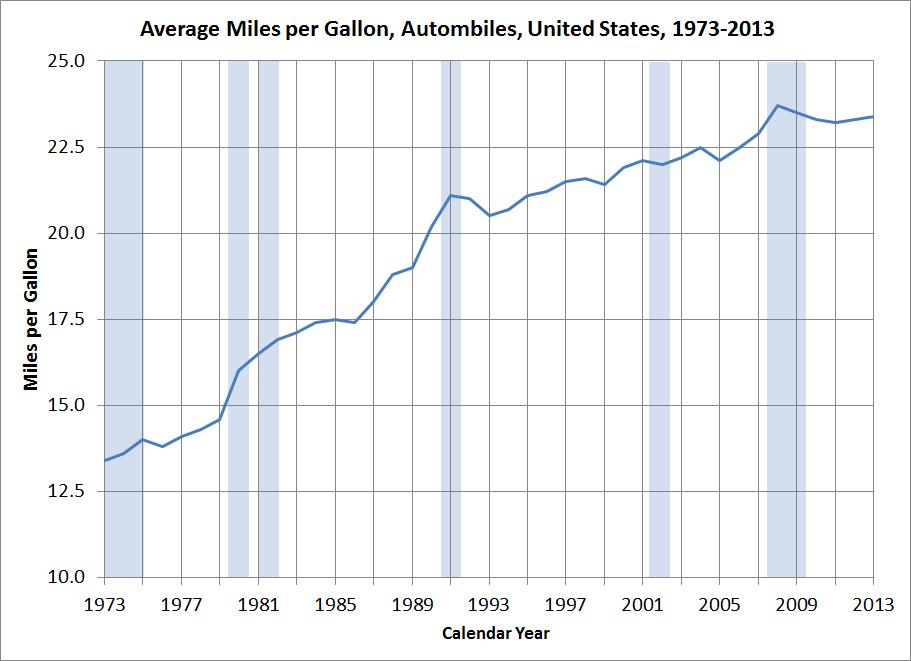
6 6
7 What Determined the Changes in Indiana Gasoline Sales, ? Avg. Change, Avg. Change, Contribution Elasticities to Gallons Real Income % 2.1% 0.5% 0.4% Gas Price % 0.2% 6.4% -0.6% MPG Autos % -0.8% 0.5% -0.3% Predicted (sum of contributions) 1.5% -0.5% Actual 1.8% -0.9% Contribution to Gallons Two Predictions of Changes in Indiana Gasoline Sales, Predicted Change, Predicted Change, Contribution Elasticities to Gallons Real Income % 1.6% 1.0% 0.8% Gas Price % 0.0% 7.0% -0.7% MPG Autos % -0.3% 0.5% -0.3% Predicted (sum of contributions) 1.3% -0.2% Contribution to Gallons 7
8 One Penny on the Gasoline Tax Gasoline Price: $2.50/gallon Added penny increases price to $2.51/gallon Percent increase: 0.4% Gas Price Elasticity: Change in Gasoline gallons sold: -0.04% Reduction from 2,929 million gals: 1.2 million Added revenue from one penny: About $29 million State and Local Highway Expenditures per Person, 2013 Washington New Hampshire Montana North Dakota Minnesota Vermont Maine Oregon Massachusetts Idaho South Dakota Wisconsin New York Wyoming Michigan Rhode Island California Nevada Utah Colorado Nebraska Kansas Iowa Missouri Illinois Pennsylvania Ohio Indiana District of Columbia West Virginia Virginia Kentucky New Jersey Delaware Connecticut Tennessee North Carolina Maryland Alaska Arizona New Mexico Texas Oklahoma Arkansas Louisiana Mississippi Alabama South Carolina Georgia Florida Dollars per Person Less than to to 600 More than 600 Hawaii 8
9 National Highway Construction Cost Index (2003 = 1) $500 Local Road Funding, Actual and Cost-Adjusted (millions of dollars) $400 $300 $200 Actual Cost-Adjusted (HW construction index, 2003 dollars) $100 $

10 Motor Vehicle Highway Fund FY14 Revenues Motor Fuel Tax mil Special Fuel Tax mil Motor Carrier Surtax 46.0 mil License Fees mil Int l Registration Plan Revenue 96.1 mil State Sales Tax 63.8 mil Total (includes minor sources) mil 10
11 Motor Vehicle Highway Fund FY14 Expenses Refunds 50.5 mil State Police 7.9 mil BMV 4.9 mil Other Expenses 1.6 mil Plus adjustments 26.5 mil Net Distribution mil Motor Vehicle Highway Fund FY14 Net Distribution mil State Dept. of Transportation (53%) mil Counties (32%) mil 5% distributed equally to each county 30% based on vehicle registrations share of state total 65% based on road mileage share of state total Cities and Towns (15%) mil 100% based on population share of state total 11
12 Special Distribution Account FY14 Revenues Motor Fuel Taxes 96.4 mil Special Fuel Taxes 51.4 mil License Fees 17.6 mil Total Revenues mil Special Distribution Account FY14 State Share (55%) Highway, Road and Street Fund 90.9 mil Local Share (45%) Local Road and Street Account mil 12
13 Special Distribution Account FY14 Local Road and Street Account mil Distributed to Counties based on Auto Registration shares in state total Counties < 50,000 population to county, cities & towns based on population (20%) and road mileage (80%) Counties > 50,000 population to county, cities & towns based on population (60%) and road mileage (40%) County Road/Bridge Budgets, 2015 Budget Levy MOTOR VEHICLE HIGHWAY 281,644,768 LOCAL ROAD & STREET 40,328,183 CUMULATIVE BRIDGE 66,543,206 54,112,311 COUNTY MAJOR BRIDGE 5,021,142 8,190,395 MAJOR MOVES - TOLLROAD COUNTIES 8,728,199 TOTAL 402,265,498 62,302,706 13
14 City and Town Road and Street Budgets, 2015 Budget Levy MOTOR VEHICLE HIGHWAY 255,453,640 86,108,031 LOCAL ROAD & STREET 40,135,248 THOROUGHFARE 555,000 1,134,607 CUMULATIVE BRIDGE & STREET 150, ,798 MAJOR MOVES - TOLLROAD COUNTIES 3,683,096 THOROUGHFARE BOND 530, ,841 INDIANAPOLIS PUB WKS TRANS 44,563,144 TOTAL 345,070,128 87,967,277 All Local Units Road, Street and Bridge Budgets, 2015 Budget Levy MOTOR VEHICLE HIGHWAY 537,098,408 86,108,031 LOCAL ROAD & STREET 80,463,431 THOROUGHFARE 555,000 1,134,607 CUMULATIVE BRIDGE 66,543,206 54,112,311 COUNTY MAJOR BRIDGE 5,021,142 8,190,395 CUMULATIVE BRIDGE & STREET 150, ,798 MAJOR MOVES - TOLLROAD COUNTIES 12,411,295 THOROUGHFARE BOND 530, ,841 INDIANAPOLIS PUB WKS TRANS 44,563,144 TOTAL 747,335, ,269,983 14
15 Surtax and Wheel Tax Adoptions by Year Lake Porter Jasper Newton La Porte Starke Pulaski Lagrange St Joseph Elkhart Noble Marshall Kosciusko Whitley Fulton Steuben De Kalb Allen White Cass WabashHuntington Miami Wells Adams 7 Adoption Year Rescinded Before to to 2013 Since 2013 No Tax Benton Carroll Grant Howard Blackford Jay Tippecanoe Warren Clinton Tipton Delaware Fountain Madison Randolph Montgomery Boone Hamilton Henry Vermillion Wayne Hancock Parke Hendricks Marion Putnam Fayette Rush Union Morgan Johnson Shelby Vigo Clay Franklin Owen Decatur Brown Monroe Bartholomew Ripley Dearborn Sullivan Greene Jennings Ohio Jackson Lawrence Switzerland Jefferson Daviess Knox Martin Scott Washington Orange Clark Pike Gibson Dubois Floyd Crawford Harrison Posey Vanderburgh Warrick Spencer Perry Total revenues, 2013 Surtax/Wheel Tax Surtax $65.5 million (89%) Wheel Tax $7.9 million (11%) $73.4 million Revenues per Person $17.85 Maximum Tipton $32.43 ($25 surtax; $40 wheel) Minimum Vanderburgh $7.49 (2% surtax; $23 max wheel) At average rates, remaining counties could collect about $40-$45 million 15
16 Sources U.S. Highway Statistics, Federal Highway Administration U.S. State/Local Revenues and Expenditures, U.S. Census Bureau, State and Local Government Finances Indiana Highway Revenues and Distributions, Legislative Services Agency, Handbooks Indiana Surtax/Wheel Tax Rates, Indiana Bureau of Motor Vehicles 16
State of Indiana Floodplain Management Work Plan FFY
 State of Indiana Floodplain Management Work Plan FFY 2005-2009 Prepared by: Gregory Main CFM, NFIP State Coordinator and Debbie Smith, Floodplain Management Supervisor, Indiana Department of Natural Resources,
IHCP bulletin INDIANA HEALTH COVERAGE PROGRAMS BT OCTOBER 13, 2015
 IHCP bulletin INDIANA HEALTH COVERAGE PROGRAMS BT201573 OCTOBER 13, 2015 FSSA announces FFY 2016 hospice rates The Centers for Medi & Medicaid Services (CMS) released new federal hospice rates for federal
IC Chapter 2. Indiana Board of Veterinary Medical Examiners
 IC 25-38.1-2 Chapter 2. Indiana Board of Veterinary Medical Examiners IC 25-38.1-2-1 Board of veterinary medical examiners Sec. 1. (a) The Indiana board of veterinary medical examiners is established.
2016 SNAPSHOT REPORT. July for Indiana Community Foundations
 2016 SNAPSHOT July 2017 REPORT The 2016 GIFT Snapshot Report is a compilation of data from Indiana community foundations entered into the CF Insights database. for Indiana Community Foundations 2016 data
Transportation I H C P A n n u a l. S e m i n a r
 Transportation I H C P 2 0 1 7 A n n u a l S e m i n a r VERMILLION CareSource Transportation Vendors CareSource partners with two vendors for transportation: Ride Right (northern Indiana) LCP (southern
TABLE 3c: Congressional Districts with Number and Percent of Hispanics* Living in Hard-to-Count (HTC) Census Tracts**
 Census Tracts**") living Alaska 00 47,808 21,213 44.4 Alabama 01 20,661 3,288 15.9 Alabama 02 23,949 6,614 27.6 Alabama 03 20,225 3,247 16.1 Alabama 04 41,412 7,933 19.2 Alabama 05 34,388 11,863 34.5 Alabama 06 34,849 4,074
living Alaska 00 47,808 21,213 44.4 Alabama 01 20,661 3,288 15.9 Alabama 02 23,949 6,614 27.6 Alabama 03 20,225 3,247 16.1 Alabama 04 41,412 7,933 19.2 Alabama 05 34,388 11,863 34.5 Alabama 06 34,849 4,074
 3+ 3+ N = 155, 442 3+ R 2 =.32 < < < 3+ N = 149, 685 3+ R 2 =.27 < < < 3+ N = 99, 752 3+ R 2 =.4 < < < 3+ N = 98, 887 3+ R 2 =.6 < < < 3+ N = 52, 624 3+ R 2 =.28 < < < 3+ N = 36, 281 3+ R 2 =.5 < < < 7+
TABLE 3b: Congressional Districts Ranked by Percent of Hispanics* Living in Hard-to- Count (HTC) Census Tracts**
 Census Tracts**") Rank State District Count (HTC) 1 New York 05 150,499 141,567 94.1 2 New York 08 133,453 109,629 82.1 3 Massachusetts 07 158,518 120,827 76.2 4 Michigan 13 47,921 36,145 75.4 5 Illinois 04 508,677 379,527
Rank State District Count (HTC) 1 New York 05 150,499 141,567 94.1 2 New York 08 133,453 109,629 82.1 3 Massachusetts 07 158,518 120,827 76.2 4 Michigan 13 47,921 36,145 75.4 5 Illinois 04 508,677 379,527
The American Legion NATIONAL MEMBERSHIP RECORD
 The American Legion NATIONAL MEMBERSHIP RECORD www.legion.org 2016 The American Legion NATIONAL MEMBERSHIP RECORD 1920-1929 Department 1920 1921 1922 1923 1924 1925 1926 1927 1928 1929 Alabama 4,474 3,246
2015 Statewide Bridge Sufficiency Rating Report - Condensed
 Purdue University Purdue e-pubs Indiana Local Technical Assistance Program (LTAP) Publications Indiana Local Technical Assistance Program (LTAP) 10-2015 2015 Statewide Bridge Sufficiency Rating Report
Data Report 2015 Indiana Nursing Licensure Survey
 Data Report 2015 Indiana Nursing Licensure Survey May 2016 0 010 0 010 0 0110101010 0110 0 010 011010 010 0 010 0 0110110 0110 0110 0 010 010 0 010 0 01101010 0110 0 010 010 0 010 0 0 N U R S E S 0 010
Unemployment Rate (%) Rank State. Unemployment
 Rank State. Unemployment") States Ranked by February 2018 Unemployment Rate Seasonally Adjusted Unemployment Unemployment Unemployment 1 Hawaii 2.1 19 Alabama 3.7 33 Ohio 4.5 2 New Hampshire 2.6 19 Missouri 3.7 33 Rhode Island 4.5
States Ranked by February 2018 Unemployment Rate Seasonally Adjusted Unemployment Unemployment Unemployment 1 Hawaii 2.1 19 Alabama 3.7 33 Ohio 4.5 2 New Hampshire 2.6 19 Missouri 3.7 33 Rhode Island 4.5
Unemployment Rate (%) Rank State. Unemployment
 Rank State. Unemployment") States Ranked by November 2015 Unemployment Rate Seasonally Adjusted Unemployment Unemployment Unemployment 1 North Dakota 2.7 19 Indiana 4.4 37 Georgia 5.6 2 Nebraska 2.9 20 Ohio 4.5 37 Tennessee 5.6
States Ranked by November 2015 Unemployment Rate Seasonally Adjusted Unemployment Unemployment Unemployment 1 North Dakota 2.7 19 Indiana 4.4 37 Georgia 5.6 2 Nebraska 2.9 20 Ohio 4.5 37 Tennessee 5.6
Unemployment Rate (%) Rank State. Unemployment
 Rank State. Unemployment") States Ranked by April 2017 Unemployment Rate Seasonally Adjusted Unemployment Unemployment Unemployment 1 Colorado 2.3 17 Virginia 3.8 37 California 4.8 2 Hawaii 2.7 20 Massachusetts 3.9 37 West Virginia
States Ranked by April 2017 Unemployment Rate Seasonally Adjusted Unemployment Unemployment Unemployment 1 Colorado 2.3 17 Virginia 3.8 37 California 4.8 2 Hawaii 2.7 20 Massachusetts 3.9 37 West Virginia
Unemployment Rate (%) Rank State. Unemployment
 Rank State. Unemployment") States Ranked by August 2017 Unemployment Rate Seasonally Adjusted Unemployment Unemployment Unemployment 1 North Dakota 2.3 18 Maryland 3.9 36 New York 4.8 2 Colorado 2.4 18 Michigan 3.9 38 Delaware 4.9
States Ranked by August 2017 Unemployment Rate Seasonally Adjusted Unemployment Unemployment Unemployment 1 North Dakota 2.3 18 Maryland 3.9 36 New York 4.8 2 Colorado 2.4 18 Michigan 3.9 38 Delaware 4.9
Unemployment Rate (%) Rank State. Unemployment
 Rank State. Unemployment") States Ranked by March 2016 Unemployment Rate Seasonally Adjusted Unemployment Unemployment Unemployment 1 South Dakota 2.5 19 Delaware 4.4 37 Georgia 5.5 2 New Hampshire 2.6 19 Massachusetts 4.4 37 North
States Ranked by March 2016 Unemployment Rate Seasonally Adjusted Unemployment Unemployment Unemployment 1 South Dakota 2.5 19 Delaware 4.4 37 Georgia 5.5 2 New Hampshire 2.6 19 Massachusetts 4.4 37 North
Unemployment Rate (%) Rank State. Unemployment
 Rank State. Unemployment") States Ranked by September 2017 Unemployment Rate Seasonally Adjusted Unemployment Unemployment Unemployment 1 North Dakota 2.4 17 Indiana 3.8 36 New Jersey 4.7 2 Colorado 2.5 17 Kansas 3.8 38 Pennsylvania
States Ranked by September 2017 Unemployment Rate Seasonally Adjusted Unemployment Unemployment Unemployment 1 North Dakota 2.4 17 Indiana 3.8 36 New Jersey 4.7 2 Colorado 2.5 17 Kansas 3.8 38 Pennsylvania
Unemployment Rate (%) Rank State. Unemployment
 Rank State. Unemployment") States Ranked by December 2017 Unemployment Rate Seasonally Adjusted Unemployment Unemployment Unemployment 1 Hawaii 2.0 16 South Dakota 3.5 37 Connecticut 4.6 2 New Hampshire 2.6 20 Arkansas 3.7 37 Delaware
States Ranked by December 2017 Unemployment Rate Seasonally Adjusted Unemployment Unemployment Unemployment 1 Hawaii 2.0 16 South Dakota 3.5 37 Connecticut 4.6 2 New Hampshire 2.6 20 Arkansas 3.7 37 Delaware
Unemployment Rate (%) Rank State. Unemployment
 Rank State. Unemployment") States Ranked by September 2015 Unemployment Rate Seasonally Adjusted Unemployment Unemployment Unemployment 1 North Dakota 2.8 17 Oklahoma 4.4 37 South Carolina 5.7 2 Nebraska 2.9 20 Indiana 4.5 37 Tennessee
States Ranked by September 2015 Unemployment Rate Seasonally Adjusted Unemployment Unemployment Unemployment 1 North Dakota 2.8 17 Oklahoma 4.4 37 South Carolina 5.7 2 Nebraska 2.9 20 Indiana 4.5 37 Tennessee
Unemployment Rate (%) Rank State. Unemployment
 Rank State. Unemployment") States Ranked by November 2014 Unemployment Rate Seasonally Adjusted Unemployment Unemployment Unemployment 1 North Dakota 2.7 19 Pennsylvania 5.1 35 New Mexico 6.4 2 Nebraska 3.1 20 Wisconsin 5.2 38 Connecticut
States Ranked by November 2014 Unemployment Rate Seasonally Adjusted Unemployment Unemployment Unemployment 1 North Dakota 2.7 19 Pennsylvania 5.1 35 New Mexico 6.4 2 Nebraska 3.1 20 Wisconsin 5.2 38 Connecticut
Unemployment Rate (%) Rank State. Unemployment
 Rank State. Unemployment") States Ranked by July 2018 Unemployment Rate Seasonally Adjusted Unemployment Unemployment Unemployment 1 Hawaii 2.1 19 Massachusetts 3.6 37 Kentucky 4.3 2 Iowa 2.6 19 South Carolina 3.6 37 Maryland 4.3
States Ranked by July 2018 Unemployment Rate Seasonally Adjusted Unemployment Unemployment Unemployment 1 Hawaii 2.1 19 Massachusetts 3.6 37 Kentucky 4.3 2 Iowa 2.6 19 South Carolina 3.6 37 Maryland 4.3
Index of religiosity, by state
 Index of religiosity, by state Low Medium High Total United States 19 26 55=100 Alabama 7 16 77 Alaska 28 27 45 Arizona 21 26 53 Arkansas 12 19 70 California 24 27 49 Colorado 24 29 47 Connecticut 25 32
5 x 7 Notecards $1.50 with Envelopes - MOQ - 12
 5 x 7 Notecards $1.50 with Envelopes - MOQ - 12 Magnets 2½ 3½ Magnet $1.75 - MOQ - 5 - Add $0.25 for packaging Die Cut Acrylic Magnet $2.00 - MOQ - 24 - Add $0.25 for packaging 2535-22225 California AM-22225
Rutgers Revenue Sources
 Rutgers Revenue Sources 31.2% Tuition and Fees 27.3% State Appropriations with Fringes 1.0% Endowment and Investments.5% Federal Appropriations 17.8% Federal, State, and Municipal Grants and Contracts
Fiscal Year 1999 Comparisons. State by State Rankings of Revenues and Spending. Includes Fiscal Year 2000 Rankings for State Taxes Only
 Fiscal Year 1999 Comparisons State by State Rankings of Revenues and Spending Includes Fiscal Year 2000 Rankings for State Taxes Only January 2002 1 2 published annually by: The Minnesota Taxpayers Association
PRESS RELEASE Media Contact: Joseph Stefko, Director of Public Finance, ;
 PRESS RELEASE Media Contact: Joseph Stefko, Director of Public Finance, 585.327.7075; jstefko@cgr.org Highest Paid State Workers in New Jersey & New York in 2010; Lowest Paid in Dakotas and West Virginia
2015 State Hospice Report 2013 Medicare Information 1/1/15
 2015 State Hospice Report 2013 Medicare Information 1/1/15 www.hospiceanalytics.com 2 2013 Demographics & Hospice Utilization National Population 316,022,508 Total Deaths 2,529,792 Medicare Beneficiaries
MAP 1: Seriously Delinquent Rate by State for Q3, 2008
 MAP 1: Seriously Delinquent Rate by State for Q3, 2008 Seriously Delinquent Rate Greater than 6.93% 5.18% 6.93% 0 5.17% Source: MBA s National Deliquency Survey MAP 2: Foreclosure Inventory Rate by State
STATE INDUSTRY ASSOCIATIONS $ - LISTED NEXT PAGE. TOTAL $ 88,000 * for each contribution of $500 for Board Meeting sponsorship
 Exhibit D -- TRIP 2017 FUNDING SOURCES -- February 3, 2017 CORPORATE $ 12,000 Construction Companies $ 5,500 Consulting Engineers Equipment Distributors Manufacturer/Supplier/Producer 6,500 Surety Bond
Interstate Pay Differential
 Interstate Pay Differential APPENDIX IV Adjustments for differences in interstate pay in various locations are computed using the state average weekly pay. This appendix provides a table for the second
Estimated Economic Impacts of the Small Business Jobs and Tax Relief Act National Report
 Regional Economic Models, Inc. Estimated Economic Impacts of the Small Business Jobs and Tax Relief Act National Report Prepared by Frederick Treyz, CEO June 2012 The following is a summary of the Estimated
Weekly Market Demand Index (MDI)
") VOL. 8 NO. 28 JULY 13, 2015 LOAD AVAILABILITY Up 7% compared to the Weekly Market Demand Index (MDI) Note: MDI Measures Relative Truck Demand LOAD SEARCHING Up 18.3% compared to the TRUCK AVAILABILITY
VOL. 8 NO. 28 JULY 13, 2015 LOAD AVAILABILITY Up 7% compared to the Weekly Market Demand Index (MDI) Note: MDI Measures Relative Truck Demand LOAD SEARCHING Up 18.3% compared to the TRUCK AVAILABILITY
Current Medicare Advantage Enrollment Penetration: State and County-Level Tabulations
 Current Advantage Enrollment : State and County-Level Tabulations 5 Slide Series, Volume 40 September 2016 Summary of Tabulations and Findings As of September 2016, 17.9 million of the nation s 56.1 million
2016 INCOME EARNED BY STATE INFORMATION
 BY STATE INFORMATION This information is being provided to assist in your 2016 tax preparations. The information is also mailed to applicable Columbia fund non-corporate shareholders with their year-end
Voter Registration and Absentee Ballot Deadlines by State 2018 General Election: Tuesday, November 6. Saturday, Oct 27 (postal ballot)
") Voter Registration and Absentee Ballot Deadlines by State 2018 General Election: All dates in 2018 unless otherwise noted STATE REG DEADLINE ABSENTEE BALLOT REQUEST DEADLINE Alabama November 1 ABSENTEE
Voter Registration and Absentee Ballot Deadlines by State 2018 General Election: All dates in 2018 unless otherwise noted STATE REG DEADLINE ABSENTEE BALLOT REQUEST DEADLINE Alabama November 1 ABSENTEE
State Authority for Hazardous Materials Transportation
 Appendixes Appendix A State Authority for Hazardous Materials Transportation Hazardous Materials Transportation: Regulatory, Enforcement, and Emergency Response* Alabama E Public Service Commission ER
Early Education Matching Grant
 Early Education Matching Grant Request for Funding for Eligible Applicants January 2014 outline 1. Statute 2. Requirements 3. Application Process 4. Grant Participation Guiding principles Access School
Name: Date: Albany: Jefferson City: Annapolis: Juneau: Atlanta: Lansing: Augusta: Lincoln: Austin: Little Rock: Baton Rouge: Madison: Bismarck:
 Albany: Annapolis: Atlanta: Augusta: Austin: Baton Rouge: Bismarck: Boise: Boston: Carson City: Charleston: Cheyenne: Columbia: Columbus: Concord: Denver: Des Moines: Dover: Frankfort: Harrisburg: Hartford:
FY 2014 Per Capita Federal Spending on Major Grant Programs Curtis Smith, Nick Jacobs, and Trinity Tomsic
 Special Analysis 15-03, June 18, 2015 FY 2014 Per Capita Federal Spending on Major Grant Programs Curtis Smith, Nick Jacobs, and Trinity Tomsic 202-624-8577 ttomsic@ffis.org Summary Per capita federal
Larry DeBoer Purdue University September Real GDP Growth. Real Consumption Spending Growth
 Larry DeBoer Purdue University September 2011 Real GDP Growth Real Consumption Spending Growth 1 Index of Consumer Sentiment 57.8 Sept 11 Savings Rate (percent of disposable income) Real Investment Spending
Sentinel Event Data. General Information Copyright, The Joint Commission
 Sentinel Event Data General Information 1995 2015 Data Limitations The reporting of most sentinel events to The Joint Commission is voluntary and represents only a small proportion of actual events. Therefore,
Rankings of the States 2017 and Estimates of School Statistics 2018
 Rankings of the States 2017 and Estimates of School Statistics 2018 NEA RESEARCH April 2018 Reproduction: No part of this report may be reproduced in any form without permission from NEA Research, except
Introduction. Current Law Distribution of Funds. MEMORANDUM May 8, Subject:
 MEMORANDUM May 8, 2018 Subject: TANF Family Assistance Grant Allocations Under the Ways and Means Committee (Majority) Proposal From: Gene Falk, Specialist in Social Policy, gfalk@crs.loc.gov, 7-7344 Jameson
Fiscal Year 2005 Comparisons. Includes Fiscal Year 2006 Rankings for State Taxes Only
 Fiscal Year 2005 Comparisons Includes Fiscal Year 2006 Rankings for State Taxes Only October 2007 Published annually since 1969 (except FY2001 and FY2003) by: The Minnesota Taxpayers Association 85 East
HOME HEALTH AIDE TRAINING REQUIREMENTS, DECEMBER 2016
 BACKGROUND HOME HEALTH AIDE TRAINING REQUIREMENTS, DECEMBER 2016 Federal legislation (42 CFR 484.36) requires that Medicare-certified home health agencies employ home health aides who are trained and evaluated
Child & Adult Care Food Program: Participation Trends 2017
 Child & Adult Care Food Program: Participation Trends 2017 February 2018 About FRAC The Food Research and Action Center (FRAC) is the leading national organization working for more effective public and
Child & Adult Care Food Program: Participation Trends 2016
 Child & Adult Care Food Program: Participation Trends 2016 March 2017 About FRAC The Food Research and Action Center (FRAC) is the leading national organization working for more effective public and private
Sentinel Event Data. General Information Q Copyright, The Joint Commission
 Sentinel Event Data General Information 1995 2Q 2014 Data Limitations The reporting of most sentinel events to The Joint Commission is voluntary and represents only a small proportion of actual events.
Is this consistent with other jurisdictions or do you allow some mechanism to reinstate?
 Topic: Question by: : Forfeiture for failure to appoint a resident agent Kathy M. Sachs Kansas Date: January 8, 2015 Manitoba Corporations Canada Alabama Alaska Arizona Arkansas California Colorado Connecticut
Fiscal Research Center
 January 2016 Georgia s Rankings Among the States: Budget, Taxes and Other Indicators ABOUT THE FISCAL RESEARCH CENTER Established in 1995, the (FRC) provides nonpartisan research, technical assistance
FORTIETH TRIENNIAL ASSEMBLY
 FORTIETH TRIENNIAL ASSEMBLY MOST PUISSANT GENERAL GRAND MASTER GENERAL GRAND COUNCIL OF CRYPTIC MASONS INTERNATIONAL 1996-1999 -
Table 6 Medicaid Eligibility Systems for Children, Pregnant Women, Parents, and Expansion Adults, January Share of Determinations
 Table 6 Medicaid Eligibility Systems for Children, Pregnant Women, Parents, and Expansion Adults, January 2017 Able to Make Share of Determinations System determines eligibility for: 2 State Real-Time
CRMRI White Paper #3 August 2017 State Refugee Services Indicators of Integration: How are the states doing?
 CRMRI White Paper #3 August 7 State Refugee Services Indicators of Integration: How are the states doing? Marci Harris, Julia Greene, Kilee Jorgensen, Caren J. Frost, & Lisa H. Gren State Refugee Services
States Ranked by Annual Nonagricultural Employment Change October 2017, Seasonally Adjusted
 States Ranked by Annual Nonagricultural Employment Change Change (Jobs) Change (Jobs) Change (Jobs) 1 Texas 316,100 19 Nevada 36,600 37 Hawaii 7,100 2 California 256,800 20 Tennessee 34,800 38 Mississippi
Child & Adult Care Food Program: Participation Trends 2014
 Child & Adult Care Food Program: Participation Trends 2014 1200 18th St NW Suite 400 Washington, DC 20036 (202) 986-2200 / www.frac.org February 2016 About FRAC The Food Research and Action Center (FRAC)
Fiscal Research Center
 January 2017 Georgia s Rankings Among the States: Budget, Taxes and Other Indicators ABOUT THE FISCAL RESEARCH CENTER Established in 1995, the (FRC) provides nonpartisan research, technical assistance
Percentage of Enrolled Students by Program Type, 2016
 Percentage of Enrolled Students by Program Type, 2016 Doctorate 4% PN/VN 3% MSN 15% ADN 28% BSRN 22% Diploma 2% BSN 26% n = 279,770 Percentage of Graduations by Program Type, 2016 MSN 12% Doctorate 1%
Weights and Measures Training Registration
 Weights and Measures Training Registration Please fill out the form below to register for Weights and Measures training and testing dates. NIST Handbook 44, Specifications, Tolerances and other Technical
Statutory change to name availability standard. Jurisdiction. Date: April 8, [Statutory change to name availability standard] [April 8, 2015]
![Statutory change to name availability standard. Jurisdiction. Date: April 8, [Statutory change to name availability standard] [April 8, 2015]](/thumbs/83/87461560.jpg "Statutory change to name availability standard. Jurisdiction. Date: April 8, [Statutory change to name availability standard] [April 8, 2015]") Topic: Question by: : Statutory change to name availability standard Michael Powell Texas Date: April 8, 2015 Manitoba Corporations Canada Alabama Alaska Arizona Arkansas California Colorado Connecticut
Topic: Question by: : Statutory change to name availability standard Michael Powell Texas Date: April 8, 2015 Manitoba Corporations Canada Alabama Alaska Arizona Arkansas California Colorado Connecticut
Nicole Galloway, CPA
 Office of State Auditor Nicole Galloway, CPA Statewide Performance Indicators: A National Comparison Report No. 2017-050 June 2017 auditor.mo.gov Statewide Performance Indicators: A National Comparison
ANCHOR INSTITUTION STRATEGIES IN THE SOUTHEAST
 ANCHOR INSTITUTION STRATEGIES IN THE SOUTHEAST Presentation for: Federal Reserve Bank of Cleveland Policy Summit on Housing, Human Capital, and Inequality Sameera Fazili, Senior Visiting CED Advisor, Federal
Senior American Access to Care Grant
 Senior American Access to Care Grant Grant Guidelines SENIOR AMERICAN (age 62 plus) ACCESS TO CARE GRANT GUIDELINES: The (ADAF) is committed to supporting U.S. based organizations exempt from taxation
Colorado River Basin. Source: U.S. Department of the Interior, Bureau of Reclamation
 The Colorado River supports a quarter million jobs and produces $26 billion in economic output from recreational activities alone, drawing revenue from the 5.36 million adults who use the Colorado River
The Regional Economic Outlook
 The Regional Economic Outlook Presented by: Mark McMullen, Director of Government Svcs Prepared for: FTA Revenue Estimating Conference September 15, 2008 Recent Economic Performance 2 1 The Job Market
CONNECTICUT: ECONOMIC FUTURE WITH EDUCATIONAL REFORM
 CONNECTICUT: ECONOMIC FUTURE WITH EDUCATIONAL REFORM This file contains detailed projections and information from the article: Eric A. Hanushek, Jens Ruhose, and Ludger Woessmann, It pays to improve school
HIGH SCHOOL ATHLETICS PARTICIPATION SURVEY
 2011-12 HIGH SCHOOL ATHLETICS PARTICIPATION SURVEY Conducted By THE NATIONAL FEDERATION OF STATE HIGH SCHOOL ASSOCIATIONS Based on Competition at the High School Level in the 2011-12 School Year BOYS GIRLS
*ALWAYS KEEP A COPY OF THE CERTIFICATE OF ATTENDANCE FOR YOUR RECORDS IN CASE OF AUDIT
 State Alabama Alaska Arizona Arkansas California INSTRUCTIONS FOR CLE ATTENDANCE REPORTING AT IADC 2012 TRIAL ACADEMY Attorney Reporting Method After the CLE activity, fill out the Certificate of Attendance
Indiana Solid Waste Management Districts Programmatic Per Capita Spending Data
 Indiana s Programmatic Data - 2014 District State Average = $12.87 Adams Allen Bartholomew Blackford Boone Brown Cass Clark Clay Crawford Daviess Dearborn Adams Allen Bartholomew Blackford Boone Brown
Fiscal Research Center
 January 2018 Georgia s Rankings Among the States: Budget, Taxes and Other Indicators ABOUT THE FISCAL RESEARCH CENTER Established in 1995, the (FRC) provides nonpartisan research, technical assistance
Interstate Turbine Advisory Council (CESA-ITAC)
") Interstate Turbine Advisory Council (CESA-ITAC) Mark Mayhew NYSERDA for Val Stori Clean Energy States Alliance SWAT 4/25/12 Today CESA ITAC, LLC - What, who and why The Unified List - What, why, how and
Interstate Turbine Advisory Council (CESA-ITAC) Mark Mayhew NYSERDA for Val Stori Clean Energy States Alliance SWAT 4/25/12 Today CESA ITAC, LLC - What, who and why The Unified List - What, why, how and
Table 8 Online and Telephone Medicaid Applications for Children, Pregnant Women, Parents, and Expansion Adults, January 2017
 Table 8 Online and Telephone Medicaid Applications for Children, Pregnant Women, Parents, and Expansion Adults, January 2017 State Applications Can be Submitted Online at the State Level 1 < 25% 25% -
Critical Access Hospitals and HCAHPS
 Critical Access Hospitals and HCAHPS Michelle Casey, MS Senior Research Fellow and Deputy Director University of Minnesota Rural Health Research Center June 12, 2012 Overview of Presentation Why is HCAHPS
F O R E S T R I V E R M A R I N E
 F O R E S T R I V E R M A R I N E Regional Sales Manager - Eric Rose Cell: (574) 361-8673 E-mail: erose@forestriverinc.com Sales Coordinator - Neil Massing (574) 825-8168 Cell: (574) 825-6180 E-mail: nmassing@forestriverinc.com
Table of Contents Introduction... 2
 Snapshot Missouri: A National Comparison Report 9-212 Table of Contents Introduction... 2 Economy 3 Median Household Income 21... 4 Unemployment Rate 211... 5 Job Growth Rate 29.. 6 Cigarette Tax per Pack
STATE AGRICULTURAL ORGANIZATIONS SUPPORTING S. 744 AS APPROVED BY THE SENATE AGRICULTURE COMMITTEE
 STATE AGRICULTURAL ORGANIZATIONS SUPPORTING S. 744 AS APPROVED BY THE SENATE AGRICULTURE COMMITTEE ALABAMA ALASKA ARIZONA Alabama Department of Agriculture & Industries* Alabama Poultry & Egg Association
All Approved Insurance Providers All Risk Management Agency Field Offices All Other Interested Parties
 United States Department of Agriculture Farm Production and Conservation Risk Management Agency Beacon Facility Mail Stop 080 P.O. Box 49205 Kansas City, MO 644-6205, 207 INFORMATIONAL MEMORANDUM: PM-7-06
national assembly of state arts agencies
 STATE ARTS AGENCY GRANT MAKING AND FUNDING Each of America's 50 states and six jurisdictions has a government that works to make the cultural, civic, economic and educational benefits of the available
UNCLASSIFIED UNCLASSIFIED
 The National Guard Bureau Critical Infrastructure Program in Conjunction with the Joint Interagency Training and Education Center Brigadier General James A. Hoyer Director Joint Staff West Virginia National
In the District of Columbia we have also adopted the latest Model business Corporation Act.
 Topic: Question by: : Reinstatement after Admin. Dissolution question Dave Nichols West Virginia Date: March 14, 2014 Manitoba Corporations Canada Alabama Alaska Arizona Arkansas California Colorado Connecticut
How North Carolina Compares
 How North Carolina Compares A Compendium of State Statistics March 2017 Prepared by the N.C. General Assembly Program Evaluation Division Preface The Program Evaluation Division of the North Carolina General
HOPE NOW State Loss Mitigation Data December 2016
 HOPE NOW State Loss Mitigation Data December 2016 Table of Contents Page Definitions 2 Data Overview 3 Table 1 - Delinquencies 4 Table 2 - Foreclosure Starts 7 Table 3 - Foreclosure Sales 8 Table 4 - Repayment
HOPE NOW State Loss Mitigation Data September 2014
 HOPE NOW State Loss Mitigation Data September 2014 Table of Contents Page Definitions 2 Data Overview 3 Table 1 - Delinquencies 4 Table 2 - Foreclosure Starts 7 Table 3 - Foreclosure Sales 8 Table 4 -
YOUTH MENTAL HEALTH IS WORSENING AND ACCESS TO CARE IS LIMITED THERE IS A SHORTAGE OF PROVIDERS HEALTHCARE REFORM IS HELPING
 2 3 4 MENTAL HEALTH AND SUBSTANCE USE CONDITIONS ARE COMMON MOST AMERICANS LACK ACCESS TO CARE OF AMERICAN ADULTS WITH A MENTAL ILLNESS DID NOT RECEIVE TREATMENT ONE IN FIVE REPORT AN UNMET NEED NEARLY
AMERICAN ASSOCIATION FOR AGRICULTURAL EDUCATION FACULTY SALARIES
 AMERICAN ASSOCIATION FOR AGRICULTURAL EDUCATION 1999-2000 FACULTY SALARIES Contents Page Summary Data for 1999-2000 Faculty FTEs by Region Nine-month appointments (Table 1)...2 Twelve-month appointments
U.S. Army Civilian Personnel Evaluation Agency
 Army Regulation 10 89 Organizations and Functions U.S. Army Civilian Personnel Evaluation Agency Headquarters Department of the Army Washington, DC 15 December 1989 Unclassified SUMMARY of CHANGE AR 10
National Collegiate Soils Contest Rules
 National Collegiate Soils Contest Rules Students of Agronomy, Soils, and Environmental Sciences (SASES) Revised September 30, 2008 I. NAME The contest shall be known as the National Collegiate Soils Contest
Its Effect on Public Entities. Disaster Aid Resources for Public Entities
 State-by-state listing of Disaster Aid Resources for Public Entities AL Alabama Agency http://ema.alabama.gov/ Alabama Portal http://www.alabamapa.org/ AK AZ AR CA CO CT DE DC FL Alaska Division of Homeland
November 24, First Street NE, Suite 510 Washington, DC 20002
 820 First Street NE, Suite 510 Washington, DC 20002 Tel: 202-408-1080 Fax: 202-408-1056 center@cbpp.org www.cbpp.org November 24, 2008 TANF BENEFITS ARE LOW AND HAVE NOT KEPT PACE WITH INFLATION But Most
Date: 5/25/2012. To: Chuck Wyatt, DCR, Virginia. From: Christos Siderelis
 1 Date: 5/25/2012 To: Chuck Wyatt, DCR, Virginia From: Christos Siderelis Chuck Wyatt with the DCR in Virginia inquired about the classification of state parks having resort type characteristics and, if
Grants 101: An Introduction to Federal Grants for State and Local Governments
 Grants 101: An Introduction to Federal Grants for State and Local Governments Introduction FFIS has been in the federal grant reporting business for a long time about 30 years. The main thing we ve learned
ALABAMA ALUMNI MAGAZINE ADVERTISING GUIDE
 ADVERTISING GUIDE GENERAL POLICY Alabama Alumni Magazine reserves the right to refuse any ad and request any necessary corrections in spelling, grammar, punctuation, sentence structure and writing style;
Percent of Population Under Age 65 Uninsured, 2013, 2014, and 2015
 Exhiit 1 Percent of Population Under Age 65 Uninsured, 13, 14, and 15 13 14 15
Supplemental Nutrition Assistance Program. STATE ACTIVITY REPORT Fiscal Year 2016
 Supplemental Nutrition Assistance Program ACTIVITY REPORT Fiscal Year 2016 Food and Nutrition Service Supplemental Nutrition Assistance Program Program Accountability and Administration Division September
Sharing of Data Between Agencies. Date: August 31, 2011 [ INSERT TOPIC NAME ] [ INSERT YEAR MONTH DD ]
![Sharing of Data Between Agencies. Date: August 31, 2011 [ INSERT TOPIC NAME ] [ INSERT YEAR MONTH DD ]](/thumbs/71/65784909.jpg "Sharing of Data Between Agencies. Date: August 31, 2011 [ INSERT TOPIC NAME ] [ INSERT YEAR MONTH DD ]") Topic: Question by: : Sharing of Data Between Agencies Mandy Harlan Louisiana Date: August 31, 2011 Manitoba Corporations Canada Alabama Alaska Arizona Arkansas California An automated process of exchange
Topic: Question by: : Sharing of Data Between Agencies Mandy Harlan Louisiana Date: August 31, 2011 Manitoba Corporations Canada Alabama Alaska Arizona Arkansas California An automated process of exchange
STATE ARTS AGENCY GRANT MAKING AND FUNDING
 STATE ARTS AGENCY GRANT MAKING AND FUNDING Each of America's 50 states and six jurisdictions has a government that works to make the cultural, civic, economic and educational benefits of the available
Figure 10: Total State Spending Growth, ,
 26 Reason Foundation Part 3 Spending As with state revenue, there are various ways to look at state spending. Total state expenditures, obviously, encompass every dollar spent by state government, irrespective
Pipeline Safety Regulations and the Effects on Operator Qualification Programs. March 28, 2017
 Pipeline Safety Regulations and the Effects on Operator Qualification Programs March 28, 2017 Community Assistance and Technical Services (CATS) Name Change Community Liaison (CL) Effective: January 1,
NAFCC Accreditation Annual Update
 NAFCC Accreditation Annual Update 1st year 2nd year First MI Last Co-provider (if applicable) Address on License, Registration or Certificate Phone Fax Mailing Address Email City State Zip County Country
NMLS Mortgage Industry Report 2016 Q1 Update
 NMLS Mortgage Industry Report 2016 Q1 Update Released June 10, 2016 Conference of State Bank Supervisors 1129 20 th Street, NW, 9 th Floor Washington, D.C. 20036-4307 NMLS Mortgage Industry Report: 2016Q1
EXHIBIT A. List of Public Entities Participating in FEDES Project
 EXHIBIT A List of Public Entities Participating in FEDES Project Alabama Alabama Department of Economic and Community Affairs Alabama Department of Industrial Relations Alaska Department of Labor and Workforce