UBC Budget Hearing: Athletics
|
|
|
- Aileen Anthony
- 6 years ago
- Views:
Transcription

1
2 Introduction Bill Chaves Director of Athletics
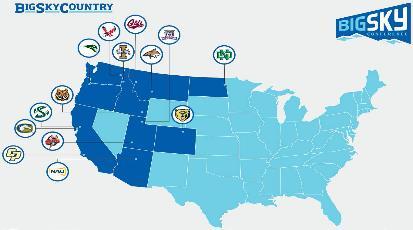
3 DEFINITIONS / ASSUMPTIONS NCAA distinguishes Division I Athletics into 3 divisions: 1. FBS: FB (Football) Bowl Subdivision (85 FB Grant-in-Aids/Wazzu) 2. FCS: FB Championship Subdivision (63 FB Grant-in-Aids/EWU) 3. Non-Football: Does not field a football team (Gonzaga) EWU competes at the FCS level in the Big Sky Conf. For the season FCS had 123 institutions 74 public institutions / 49 private institutions 4 public institutions did not provide financial information Idaho included (FBS / Big Sky) / Sample size of 71
4 DEFINITIONS / ASSUMPTIONS All Division I institutions have the same financial model Derive revenue from three sources: 1. Institutional Support: Funding/Resources allocated to Athletics from the Institution or State 2. Student Fees 3. Generated Revenues: All other revenue (Fundraising, Tickets, etc.) Athletic Departments with generated revenues greater than expenses are considered self-supporting Institutional support and student fees are added together for this calculation of total subsidy/support
5 THE DIVISION I BUSINESS MODEL: FCS Number of schools with a self-supporting budget: 0 1 st : University of Montana % 71 st : Central Connecticut State % Median: Eastern Illinois % Average: 30.43% 27 TH : EASTERN WASHINGTON % Data Source: NCAA Financial Reporting System
6 THE DIVISION I BUSINESS MODEL: FCS INSTITUTIONAL SUPPORT 1 ST : University of Rhode Island - $20,074, st : William & Mary - $507,938 Median: Portland State - $6,439,636 Average: $6,944, st : EASTERN WASHINGTON - $7,106,540 Data Source: NCAA Financial Reporting System
7 THE DIVISION I BUSINESS MODEL: FCS STUDENT FEES 1 ST : James Madison - $35,287, th (Tie): 9 institutions - $0 Median: Prairie View A&M - $2,810,037 Average: $4,328, rd : EASTERN WASHINGTON - $2,256,000 Data Source: NCAA Financial Reporting System
8 THE DIVISION I BUSINESS MODEL: FCS TOTAL SUBSIDY/SUPPORT 1 ST : James Madison - $35,837, st : Mississippi Valley State - $2,290,035 Median: Portland State - $9,877,730 Average: $11,272, th : EASTERN WASHINGTON - $9,362,540 Data Source: NCAA Financial Reporting System
9 THE DIVISION I BUSINESS MODEL: FCS GENERATED REVENUE 1 ST : University of Montana - $14,553, st : Morgan State - $1,629,644 Median: Weber State - $4,010,467 Average: $4,923, th : EASTERN WASHINGTON - $4,127,926 Data Source: NCAA Financial Reporting System
10 THE DIVISION I BUSINESS MODEL: FCS TOTAL REVENUE 1 ST : James Madison - $44,825, st : Mississippi Valley State - $4,032,302 Median: Alabama State - $14,597,561 Average: $16,195, TH : EASTERN WASHINGTON - $13,490,466 Data Source: NCAA Financial Reporting System


11 Big Sky Conference / EWU Athletic Financial Trends
12 SCHOOL REVENUES** EXPENSES** SURP/(GAP)** 1. UC Davis* $33,167,105 $31,870,332 $1,296, Cal Poly SLO* $26,291,182 $24,941,566 $1,349, North Dakota $24,287,775 $24,295,578 ($7803) 4. Sacramento State $22,205,925 $22,217,565 ($11,640) 5. Montana $21,100,118 $23,823,841 ($2,723,723) 6. Idaho $19,950,964 $19,248,132 $702, Montana State $19,317,019 $18,815,514 $501, Northern Arizona $17,936,491 $17,974,818 ($38,327) 9. Northern Colorado $15,765,885 $15,447,073 $318, Eastern Washington $13,490,466 $14,307,543 ($817,077) 11. Portland State $13,117,086 $15,100,335 ($1,983,249) 12. Idaho State $12,329,329 $12,296,515 $32, Weber State $11,930,001 $12,227,409 ($297,408) 14. Southern Utah $11,039,942 $10,562,560 $477,382 *Football Members Only, compete in the Big West Conference in all other Sports. **Data Source: NCAA Financial Reporting System
13 Big Sky Conference / EWU Athletic Financial Trends Seven of 12 full-time conference members reported a loss for FY2015 Three of the top four schools in ticket revenue are from the Big Sky Conference (UM, UND, MSU) Eight of the top 27 schools in fundraising are from the Big Sky Conference Based on Athletics Task Force Report from Spring 2016, fundraising, ticket sales & guarantees are the top recommendations to improve EWU generated revenue
14 SCHOOL TICKETS** FB CAPACITY*** NOTES 1. Montana $5,962,990 25, North Dakota $4,298,043 12,283 $3.64M - Hockey 3. Montana State $2,657,843 17, Eastern Washington $685,709 8, Idaho $632,751 16, Cal Poly SLO* $620,326 11, UC Davis* $613,414 10, Weber State $518,940 17, Northern Arizona $375,299 10, Northern Colorado $308,977 8, Idaho State $287,183 12, Sacramento State $246,033 21, Portland State $224,824 18, Southern Utah $122,669 8,500 *Football Members Only, compete in the Big West Conference in all other Sports. **Data Source: NCAA Financial Reporting System ***Data Source: stats.ncaa.org/rankings/change_sport_year_div
15 SCHOOL FUNDRAISING** FORM 990*** ATHLETICS % 1. Montana $4,875,157 $44,744, % 2. North Dakota $3,696,937 $27,896, % 3. Idaho $3, $20,733, % 4. Montana State $2,903,338 $21,023, % 5. Cal Poly SLO* $1,972,673 $40,033, % 6. Northern Colorado $1,916,973 $12,912, % 7. UC Davis $1,579,794 $47,665, % 8. Eastern Washington $1,109,482 $3,066, % 9. Weber State $942,025 N/A N/A 10. Idaho State $903,790 $7,414, % 11. Sacramento State $849,496 $4,308, % 12. Portland State $546,017 $40,225, % 13. Northern Arizona $372,601 $15,226, % 14. Southern Utah $355,368 N/A N/A *Football Members Only, compete in the Big West Conference in all other Sports. **Data Source: NCAA Financial Reporting System ***Data Source: FY2015 Form 990, includes Lines 8,9 & 11. Includes athletic-only scholarship fundraising (UM, MSU, UI). WSU/SUU not available
16 Final Fiscal Year (FY) 2016 Numbers*: Expenses Revenues $5M Staffing $7.3M Instit. Support $4M Grant-in-Aids $3.8M Generated Rev. $3.6M Operations $2.25M S&A Fees $2.0M Travel $13.35M Total Rev $14.6M Total Exp. Gap of approximately $1.25M Projecting a $850K gap for FY17 *Data Source: NCAA Financial Reporting System
17 EWU Athletic Financial Trends Year Revenue Inst Spprt Stu Fees Gen Rev 2011 $10.20M $5.47M $1.95M $2.78M 2012 $11.13M $6.00M $2.05M $3.08M 2013 $11.47M $6.04M $2.20M $3.23M 2014 $12.86M $6.91M $2.25M $3.70M 2015 $13.49M $7.12M $2.25M $4.12M 2016 *$13.88M $7.33M $2.25M *$4.30M *Reflects total athletic activity in EWU Foundation ($1,165,928; $533,875 less than what is reported in NCAA Financial Reporting System) Increase of $3.68M: 51% IS, 41% GR, 8% SF
18 EWU Athletic Financial Trends Year Expenses Revenue Surp / (Gap) GIA 2011 $9.78M $10.20M $0.42M $2.47M 2012 $10.94M $11.13M $0.19M $2.66M 2013 $11.54M $11.47M ($0.07M) $2.96M 2014 $13.36M $12.86M ($0.43M) $3.44M 2015 $14.30M $13.49M ($0.81M) $3.69M 2016 $14.66M $13.35M ($1.31M) $4.00M Grant-In-Aid costs have increased by $1.53M Generated Revenues have increased by $1.52M
19 GRANTS-IN-AID Total costs in FY16 of $4.0M ($3,995,902) Ledger 3 costs paid by Athletics: $2,074,556 Ledger 1 costs/waivers paid from Institutional Support: $1,921,346 Roughly 52% of Athletics Generated Revenue is used to pay EWU for Grants-In-Aid *Data Source: NCAA Financial Reporting System
20 SUBMISSION TO UBC Athletics is generating revenue above average, and will continue to do so Current biennium budget submission projects a $700K loss each year Athletics is asking for help in order to get back to zero and start paying back UNA New dollars will pay for Grants-in-Aid only, going straight back to the institution No extra expenses
21 REQUEST TO UBC Institution Subsidizes: Staffing Grant-in-Aids/Student-Athletes Athletics and S & A Fees pay for: Operations Travel TOTAL INCREASE: $2.0M - $700K
22 QUESTIONS?

23

24
25
2 All-Time College football Attendance. All-Time NCAA Attendance. Annual Football Bowl Subdivision (FBS) Attendance
 Attendance") Attendance Records All-Time College Football Attendance... 2 All-Time NCAA Attendance... 2 Annual Conference Attendance Leaders... 3 Largest Regular-Season Crowds... 10 2009 Attendance... 10 Annual Team
Attendance Records All-Time College Football Attendance... 2 All-Time NCAA Attendance... 2 Annual Conference Attendance Leaders... 3 Largest Regular-Season Crowds... 10 2009 Attendance... 10 Annual Team
Scoring Algorithm by Schiller Industries
 As of June 28, 2017 MEN'S CUP STANDINGS Points WOMEN'S CUP STANDINGS Points 1. Ohio State 111 1. Stanford 175.5 2. Florida 105 2. USC 129 3. North Carolina 100 3. Florida 87 4. Stanford 94.5 4. Oregon
Campus Forum on Athletics April 3, :30 pm
 Campus Forum on Athletics April 3, 2014 3:30 pm A pessimist sees the difficulty in every opportunity; an optimist sees the opportunity in every difficulty. Outcomes of the Session $66.3 million for Science
Sears Directors' Cup Final Standings
 1 Stanford 662.5 5 59.5 2 63.0 4 61.0 3 61.5 1 64.0 57 0.0 54 0.0 971.5 2 North Carolina 565.0 53.0 17 44.5 19 46.0 8 57.0 41 17.5 16 0.0 7 58.0 9 54.5 789.5 3 UCLA 485.5 118.0 7 58.0 1 64.0 5 58.5 3 61.5
ATHLETICS DEPARTMENT OVERVIEW
 ATHLETICS DEPARTMENT OVERVIEW 1 FY14 REVENUE OVERVIEW Revenues By Category FY14 % of Budget From FY13 % Change Gifts/Donations 29,907,000 32.2% (1,093,000) 3.5% Ticket Sales 25,606,000 27.5% 456,500 1.8%
AMERICAN ASSOCIATION FOR AGRICULTURAL EDUCATION FACULTY SALARIES
 AMERICAN ASSOCIATION FOR AGRICULTURAL EDUCATION 1999-2000 FACULTY SALARIES Contents Page Summary Data for 1999-2000 Faculty FTEs by Region Nine-month appointments (Table 1)...2 Twelve-month appointments
NEW MEXICO STATE AGGIES
 2017-18 Women s Golf Statistics TEAM RESULTS Date Event Location Finish Score Top Individual Sept. 11-12 Hobble Creek Fall Classic Springville, Utah 1st/12 866 Pun Chanachai 1st Sept. 17-19 Col. Wollengerg
All-Time College Football. Attendance. All-Time NCAA Attendance. Annual Football Bowl Subdivision (FBS) Attendance. Annual Total NCAA Attendance
 Attendance. Annual Total NCAA Attendance") Attendance Records All-Time College Football Attendance... 2 All-Time NCAA Attendance... 2 Annual Conference Attendance Leaders... 3 Largest Regular-Season Crowds... 10 2012 Attendance... 11 Annual Team
Attendance Records All-Time College Football Attendance... 2 All-Time NCAA Attendance... 2 Annual Conference Attendance Leaders... 3 Largest Regular-Season Crowds... 10 2012 Attendance... 11 Annual Team
HIGH SCHOOL ATHLETICS PARTICIPATION SURVEY
 2011-12 HIGH SCHOOL ATHLETICS PARTICIPATION SURVEY Conducted By THE NATIONAL FEDERATION OF STATE HIGH SCHOOL ASSOCIATIONS Based on Competition at the High School Level in the 2011-12 School Year BOYS GIRLS
MEN S AND WOMEN'S TENNIS CHAMPIONSHIP
 GENERAL ADMINISTRATION MEN S AND WOMEN'S TENNIS CHAMPIONSHIP The Championship is under the control, direction, and supervision of the host institution subject to requirements, standards, and conditions
Cal Poly Pomona football ( ) Head Coach Bob Ashton
 Head Coach Bob Ashton") Cal Poly Pomona football (1947 1982) 1947 4 4 1 Head Coach Bob Ashton Opponent Score San Bernardino JC 0 39 Chico State 0 19 Fullerton JC 0 33 Citrus JC 33 12 Whittier (Frosh) 19 0 Terminal Island Naval
Cal Poly Pomona football (1947 1982) 1947 4 4 1 Head Coach Bob Ashton Opponent Score San Bernardino JC 0 39 Chico State 0 19 Fullerton JC 0 33 Citrus JC 33 12 Whittier (Frosh) 19 0 Terminal Island Naval
 3+ 3+ N = 155, 442 3+ R 2 =.32 < < < 3+ N = 149, 685 3+ R 2 =.27 < < < 3+ N = 99, 752 3+ R 2 =.4 < < < 3+ N = 98, 887 3+ R 2 =.6 < < < 3+ N = 52, 624 3+ R 2 =.28 < < < 3+ N = 36, 281 3+ R 2 =.5 < < < 7+
Rutgers Revenue Sources
 Rutgers Revenue Sources 31.2% Tuition and Fees 27.3% State Appropriations with Fringes 1.0% Endowment and Investments.5% Federal Appropriations 17.8% Federal, State, and Municipal Grants and Contracts
Fiscal Year 1999 Comparisons. State by State Rankings of Revenues and Spending. Includes Fiscal Year 2000 Rankings for State Taxes Only
 Fiscal Year 1999 Comparisons State by State Rankings of Revenues and Spending Includes Fiscal Year 2000 Rankings for State Taxes Only January 2002 1 2 published annually by: The Minnesota Taxpayers Association
N A S S G A P Academic Year. 43rd Annual Survey Report on State-Sponsored Student Financial Aid
 N A S 43rd Annual Survey Report on State-Sponsored Student Financial Aid 2011-2012 Academic Year National Association of State Student Grant and Aid Programs S G A P About NASSGAP and this Report The National
Unemployment Rate (%) Rank State. Unemployment
 Rank State. Unemployment") States Ranked by February 2018 Unemployment Rate Seasonally Adjusted Unemployment Unemployment Unemployment 1 Hawaii 2.1 19 Alabama 3.7 33 Ohio 4.5 2 New Hampshire 2.6 19 Missouri 3.7 33 Rhode Island 4.5
States Ranked by February 2018 Unemployment Rate Seasonally Adjusted Unemployment Unemployment Unemployment 1 Hawaii 2.1 19 Alabama 3.7 33 Ohio 4.5 2 New Hampshire 2.6 19 Missouri 3.7 33 Rhode Island 4.5
Unemployment Rate (%) Rank State. Unemployment
 Rank State. Unemployment") States Ranked by November 2015 Unemployment Rate Seasonally Adjusted Unemployment Unemployment Unemployment 1 North Dakota 2.7 19 Indiana 4.4 37 Georgia 5.6 2 Nebraska 2.9 20 Ohio 4.5 37 Tennessee 5.6
States Ranked by November 2015 Unemployment Rate Seasonally Adjusted Unemployment Unemployment Unemployment 1 North Dakota 2.7 19 Indiana 4.4 37 Georgia 5.6 2 Nebraska 2.9 20 Ohio 4.5 37 Tennessee 5.6
Unemployment Rate (%) Rank State. Unemployment
 Rank State. Unemployment") States Ranked by April 2017 Unemployment Rate Seasonally Adjusted Unemployment Unemployment Unemployment 1 Colorado 2.3 17 Virginia 3.8 37 California 4.8 2 Hawaii 2.7 20 Massachusetts 3.9 37 West Virginia
States Ranked by April 2017 Unemployment Rate Seasonally Adjusted Unemployment Unemployment Unemployment 1 Colorado 2.3 17 Virginia 3.8 37 California 4.8 2 Hawaii 2.7 20 Massachusetts 3.9 37 West Virginia
Unemployment Rate (%) Rank State. Unemployment
 Rank State. Unemployment") States Ranked by August 2017 Unemployment Rate Seasonally Adjusted Unemployment Unemployment Unemployment 1 North Dakota 2.3 18 Maryland 3.9 36 New York 4.8 2 Colorado 2.4 18 Michigan 3.9 38 Delaware 4.9
States Ranked by August 2017 Unemployment Rate Seasonally Adjusted Unemployment Unemployment Unemployment 1 North Dakota 2.3 18 Maryland 3.9 36 New York 4.8 2 Colorado 2.4 18 Michigan 3.9 38 Delaware 4.9
Unemployment Rate (%) Rank State. Unemployment
 Rank State. Unemployment") States Ranked by March 2016 Unemployment Rate Seasonally Adjusted Unemployment Unemployment Unemployment 1 South Dakota 2.5 19 Delaware 4.4 37 Georgia 5.5 2 New Hampshire 2.6 19 Massachusetts 4.4 37 North
States Ranked by March 2016 Unemployment Rate Seasonally Adjusted Unemployment Unemployment Unemployment 1 South Dakota 2.5 19 Delaware 4.4 37 Georgia 5.5 2 New Hampshire 2.6 19 Massachusetts 4.4 37 North
Unemployment Rate (%) Rank State. Unemployment
 Rank State. Unemployment") States Ranked by September 2017 Unemployment Rate Seasonally Adjusted Unemployment Unemployment Unemployment 1 North Dakota 2.4 17 Indiana 3.8 36 New Jersey 4.7 2 Colorado 2.5 17 Kansas 3.8 38 Pennsylvania
States Ranked by September 2017 Unemployment Rate Seasonally Adjusted Unemployment Unemployment Unemployment 1 North Dakota 2.4 17 Indiana 3.8 36 New Jersey 4.7 2 Colorado 2.5 17 Kansas 3.8 38 Pennsylvania
Unemployment Rate (%) Rank State. Unemployment
 Rank State. Unemployment") States Ranked by December 2017 Unemployment Rate Seasonally Adjusted Unemployment Unemployment Unemployment 1 Hawaii 2.0 16 South Dakota 3.5 37 Connecticut 4.6 2 New Hampshire 2.6 20 Arkansas 3.7 37 Delaware
States Ranked by December 2017 Unemployment Rate Seasonally Adjusted Unemployment Unemployment Unemployment 1 Hawaii 2.0 16 South Dakota 3.5 37 Connecticut 4.6 2 New Hampshire 2.6 20 Arkansas 3.7 37 Delaware
Unemployment Rate (%) Rank State. Unemployment
 Rank State. Unemployment") States Ranked by September 2015 Unemployment Rate Seasonally Adjusted Unemployment Unemployment Unemployment 1 North Dakota 2.8 17 Oklahoma 4.4 37 South Carolina 5.7 2 Nebraska 2.9 20 Indiana 4.5 37 Tennessee
States Ranked by September 2015 Unemployment Rate Seasonally Adjusted Unemployment Unemployment Unemployment 1 North Dakota 2.8 17 Oklahoma 4.4 37 South Carolina 5.7 2 Nebraska 2.9 20 Indiana 4.5 37 Tennessee
Unemployment Rate (%) Rank State. Unemployment
 Rank State. Unemployment") States Ranked by November 2014 Unemployment Rate Seasonally Adjusted Unemployment Unemployment Unemployment 1 North Dakota 2.7 19 Pennsylvania 5.1 35 New Mexico 6.4 2 Nebraska 3.1 20 Wisconsin 5.2 38 Connecticut
States Ranked by November 2014 Unemployment Rate Seasonally Adjusted Unemployment Unemployment Unemployment 1 North Dakota 2.7 19 Pennsylvania 5.1 35 New Mexico 6.4 2 Nebraska 3.1 20 Wisconsin 5.2 38 Connecticut
Unemployment Rate (%) Rank State. Unemployment
 Rank State. Unemployment") States Ranked by July 2018 Unemployment Rate Seasonally Adjusted Unemployment Unemployment Unemployment 1 Hawaii 2.1 19 Massachusetts 3.6 37 Kentucky 4.3 2 Iowa 2.6 19 South Carolina 3.6 37 Maryland 4.3
States Ranked by July 2018 Unemployment Rate Seasonally Adjusted Unemployment Unemployment Unemployment 1 Hawaii 2.1 19 Massachusetts 3.6 37 Kentucky 4.3 2 Iowa 2.6 19 South Carolina 3.6 37 Maryland 4.3
FY 2014 Per Capita Federal Spending on Major Grant Programs Curtis Smith, Nick Jacobs, and Trinity Tomsic
 Special Analysis 15-03, June 18, 2015 FY 2014 Per Capita Federal Spending on Major Grant Programs Curtis Smith, Nick Jacobs, and Trinity Tomsic 202-624-8577 ttomsic@ffis.org Summary Per capita federal
Appalachian State University L500030AppStUBlkVinyl. University of Alabama L500030AlabmaBlkVinyl. Arizona State University L500030ArizStBlkVinyl
 University of Alabama at Birmingham L500030AlaBirBlkVinyl University of Alabama L500030AlabmaBlkVinyl Appalachian State University L500030AppStUBlkVinyl Arizona State University L500030ArizStBlkVinyl University
TABLE 3c: Congressional Districts with Number and Percent of Hispanics* Living in Hard-to-Count (HTC) Census Tracts**
 Census Tracts**") living Alaska 00 47,808 21,213 44.4 Alabama 01 20,661 3,288 15.9 Alabama 02 23,949 6,614 27.6 Alabama 03 20,225 3,247 16.1 Alabama 04 41,412 7,933 19.2 Alabama 05 34,388 11,863 34.5 Alabama 06 34,849 4,074
living Alaska 00 47,808 21,213 44.4 Alabama 01 20,661 3,288 15.9 Alabama 02 23,949 6,614 27.6 Alabama 03 20,225 3,247 16.1 Alabama 04 41,412 7,933 19.2 Alabama 05 34,388 11,863 34.5 Alabama 06 34,849 4,074
TABLE 3b: Congressional Districts Ranked by Percent of Hispanics* Living in Hard-to- Count (HTC) Census Tracts**
 Census Tracts**") Rank State District Count (HTC) 1 New York 05 150,499 141,567 94.1 2 New York 08 133,453 109,629 82.1 3 Massachusetts 07 158,518 120,827 76.2 4 Michigan 13 47,921 36,145 75.4 5 Illinois 04 508,677 379,527
Rank State District Count (HTC) 1 New York 05 150,499 141,567 94.1 2 New York 08 133,453 109,629 82.1 3 Massachusetts 07 158,518 120,827 76.2 4 Michigan 13 47,921 36,145 75.4 5 Illinois 04 508,677 379,527
The American Legion NATIONAL MEMBERSHIP RECORD
 The American Legion NATIONAL MEMBERSHIP RECORD www.legion.org 2016 The American Legion NATIONAL MEMBERSHIP RECORD 1920-1929 Department 1920 1921 1922 1923 1924 1925 1926 1927 1928 1929 Alabama 4,474 3,246
Interstate Pay Differential
 Interstate Pay Differential APPENDIX IV Adjustments for differences in interstate pay in various locations are computed using the state average weekly pay. This appendix provides a table for the second
Unit for Assessment: Men's Tennis, includes equipment center, facilities and weight room
 Report Submission - ID: 17Admin90 Author(s): Jean Gee Unit of Analysis ID Number: 07 Sector: Athletics Division : Men's Tennis Unit for Assessment: Men's Tennis, includes equipment center, facilities and
2016 INCOME EARNED BY STATE INFORMATION
 BY STATE INFORMATION This information is being provided to assist in your 2016 tax preparations. The information is also mailed to applicable Columbia fund non-corporate shareholders with their year-end
UAB Athletics Strategic Planning
 UAB Athletics Strategic Planning PRESENTED TO University of Alabama at Birmingham BY CarrSports Consulting, LLC 3602 NW 46 th Place Gainesville, FL 32605 352-375-7115 bill@carrsportsconsulting.com Table
Adjusted Graduation Gap: NCAA Division-I Men s and Women s Basketball
 Media Contact: Dr. Richard M. Southall, College Sport Research Institute at The University of North Carolina at Chapel Hill southall@email.unc.edu, 901.240-7197 (cell)/919.962-3507 (office) Adjusted Graduation
The number of masters degrees awarded for all program areas at Land-grant institutions rose by 11,318 degrees (18%).
.") In This Edition >>> Graduate degrees awarded within agriculture. Graduate degrees awarded by the largest programs. Graduate degrees awarded by gender. Graduate degrees awarded by ethnicity. Summer 214
In This Edition >>> Graduate degrees awarded within agriculture. Graduate degrees awarded by the largest programs. Graduate degrees awarded by gender. Graduate degrees awarded by ethnicity. Summer 214
2015 State Hospice Report 2013 Medicare Information 1/1/15
 2015 State Hospice Report 2013 Medicare Information 1/1/15 www.hospiceanalytics.com 2 2013 Demographics & Hospice Utilization National Population 316,022,508 Total Deaths 2,529,792 Medicare Beneficiaries
national assembly of state arts agencies
 STATE ARTS AGENCY GRANT MAKING AND FUNDING Each of America's 50 states and six jurisdictions has a government that works to make the cultural, civic, economic and educational benefits of the available
Supplemental Nutrition Assistance Program. STATE ACTIVITY REPORT Fiscal Year 2016
 Supplemental Nutrition Assistance Program ACTIVITY REPORT Fiscal Year 2016 Food and Nutrition Service Supplemental Nutrition Assistance Program Program Accountability and Administration Division September
TENNESSEE TEXAS UTAH VERMONT VIRGINIA WASHINGTON WEST VIRGINIA WISCONSIN WYOMING ALABAMA ALASKA ARIZONA ARKANSAS
 ALABAMA ALASKA ARIZONA ARKANSAS CALIFORNIA COLORADO CONNECTICUT DELAWARE DISTRICT OF COLUMBIA FLORIDA GEORGIA GUAM MISSOURI MONTANA NEBRASKA NEVADA NEW HAMPSHIRE NEW JERSEY NEW MEXICO NEW YORK NORTH CAROLINA
Fiscal Research Center
 January 2018 Georgia s Rankings Among the States: Budget, Taxes and Other Indicators ABOUT THE FISCAL RESEARCH CENTER Established in 1995, the (FRC) provides nonpartisan research, technical assistance
HIGH SCHOOL ATHLETICS PARTICIPATION SURVEY
 2015-16 HIGH SCHOOL ATHLETICS PARTICIPATION SURVEY Conducted By THE NATIONAL FEDERATION OF STATE HIGH SCHOOL ASSOCIATIONS Based on Competition at the High School Level in the 2015-16 School Year BOYS GIRLS
Media Contact: Brett Estrella (508) ,
 ,") Media Contact: Brett Estrella (508)-577-2767, bestrella@knights.ucf.edu Keeping Score When It Counts: Assessing the Academic Records of the 2017-2018 -bound College Football Teams By Richard Lapchick with
Media Contact: Brett Estrella (508)-577-2767, bestrella@knights.ucf.edu Keeping Score When It Counts: Assessing the Academic Records of the 2017-2018 -bound College Football Teams By Richard Lapchick with
PSAC NCAA Playoff History - Football
 PSAC NCAA Playoff History - Football 2017 First Round West Chester 27, Shippensburg 6 Assumption 40, California 31 Second Round IUP 44, West Chester 10 Quarterfinals IUP 27, Assumption 22 Semifinals West
Ethnic Studies Asst 54, ,315-3, ,229 6,229. Gen Honors/UC Asso 64, ,402-4, ,430 24,430
 A&S Prof 99,280 157 110,954-11,674-10.52 1,832,807 2,010,866 Asso 70,144 112 73,921-3,777-5.11 422,998 603,376 Asst 60,165 82 62,465-2,300-3.68 188,570 269,597 Total 80,845 351 87,809-6,964-7.93 2,444,375
MAP 1: Seriously Delinquent Rate by State for Q3, 2008
 MAP 1: Seriously Delinquent Rate by State for Q3, 2008 Seriously Delinquent Rate Greater than 6.93% 5.18% 6.93% 0 5.17% Source: MBA s National Deliquency Survey MAP 2: Foreclosure Inventory Rate by State
Ethnic Studies Asst 55, ,755-2, ,111 4,111
 A&S Prof 99,202 163 112,307-13,105-11.67 2,136,071 2,210,459 Asso 69,100 115 74,200-5,101-6.87 586,572 648,916 Asst 60,014 78 62,194-2,181-3.51 170,088 256,767 Total 80,892 356 89,017-8,126-9.13 2,892,731
CSCAA NCAA Division I Scholar All-America Teams
 College Swimming Coaches Association of America- For Immediate Release March 5, 2014 Contact: Joel Shinofield, Executive Director (540) 460-6563; joel@cscaa.org CSCAA NCAA Division I Scholar All-America
November 24, First Street NE, Suite 510 Washington, DC 20002
 820 First Street NE, Suite 510 Washington, DC 20002 Tel: 202-408-1080 Fax: 202-408-1056 center@cbpp.org www.cbpp.org November 24, 2008 TANF BENEFITS ARE LOW AND HAVE NOT KEPT PACE WITH INFLATION But Most
Approve Intercollegiate Athletics Financial Stability Plan
 STANDING COMMITTEES F3 Finance and Asset Management Committee Approve Intercollegiate Athletics Financial Stability Plan RECOMMENDED ACTIONS It is the recommendation of the administration and the Finance
HIGH SCHOOL ATHLETICS PARTICIPATION SURVEY
 2017-18 HIGH SCHOOL ATHLETICS PARTICIPATION SURVEY Conducted By THE NATIONAL FEDERATION OF STATE HIGH SCHOOL ASSOCIATIONS Based on Competition at the High School Level in the 2017-18 School Year SPORT
STATE ARTS AGENCY GRANT MAKING AND FUNDING
 STATE ARTS AGENCY GRANT MAKING AND FUNDING Each of America's 50 states and six jurisdictions has a government that works to make the cultural, civic, economic and educational benefits of the available
PAC-12 CONFERENCE MEN S BASKETBALL TELEVISION SCHEDULE
 2017-18 PAC-12 CONFERENCE MEN S BASKETBALL TELEVISION SCHEDULE (as of 10/24/17) All times listed are Pacific Time Zone. DATE GAME TIME (PT) NETWORK Tues., Oct. 17 UTAH Night with the Runnin Utes 6 p.m.
FOOD STAMP PROGRAM STATE ACTIVITY REPORT
 FOOD STAMP PROGRAM ACTIVITY REPORT Federal Fiscal Year 2004 Food Stamps Make America Stronger United States Department of Agriculture Food and Nutrition Service Program Accountability Division February
Fiscal Year 2005 Comparisons. Includes Fiscal Year 2006 Rankings for State Taxes Only
 Fiscal Year 2005 Comparisons Includes Fiscal Year 2006 Rankings for State Taxes Only October 2007 Published annually since 1969 (except FY2001 and FY2003) by: The Minnesota Taxpayers Association 85 East
Pipeline Safety Regulations and the Effects on Operator Qualification Programs. March 28, 2017
 Pipeline Safety Regulations and the Effects on Operator Qualification Programs March 28, 2017 Community Assistance and Technical Services (CATS) Name Change Community Liaison (CL) Effective: January 1,
5 x 7 Notecards $1.50 with Envelopes - MOQ - 12
 5 x 7 Notecards $1.50 with Envelopes - MOQ - 12 Magnets 2½ 3½ Magnet $1.75 - MOQ - 5 - Add $0.25 for packaging Die Cut Acrylic Magnet $2.00 - MOQ - 24 - Add $0.25 for packaging 2535-22225 California AM-22225
Illinois Higher Education Executive Compensation Analysis
 Illinois Higher Education Executive Analysis July 2015 Illinois Board of Higher Education Notes on sources and methods: The peer information used in this analysis was obtained from the Chronicle of Higher
Valuing the Invaluable: A New Look at State Estimates of the Economic Value of Family Caregiving (Data Update)
") Valuing the Invaluable: A ew Look at State Estimates of the Economic Value of Family Caregiving (Data Update) This update includes comparisons to FY 2006 Medicaid. At the time of the original release,
Valuing the Invaluable: A ew Look at State Estimates of the Economic Value of Family Caregiving (Data Update) This update includes comparisons to FY 2006 Medicaid. At the time of the original release,
Revenues, Expenses, and Operating Profits of U. S. Lotteries, FY 2002
 Revenues, Expenses, and Operating Profits of U. S. Lotteries, APPENDIX A Table A.1: Lottery Sales Excluding Sales From Video Lottery Terminals, Table A.2: Sales from Video Lottery Terminals Table A.3:
Child & Adult Care Food Program: Participation Trends 2016
 Child & Adult Care Food Program: Participation Trends 2016 March 2017 About FRAC The Food Research and Action Center (FRAC) is the leading national organization working for more effective public and private
Child & Adult Care Food Program: Participation Trends 2017
 Child & Adult Care Food Program: Participation Trends 2017 February 2018 About FRAC The Food Research and Action Center (FRAC) is the leading national organization working for more effective public and
Introduction. Current Law Distribution of Funds. MEMORANDUM May 8, Subject:
 MEMORANDUM May 8, 2018 Subject: TANF Family Assistance Grant Allocations Under the Ways and Means Committee (Majority) Proposal From: Gene Falk, Specialist in Social Policy, gfalk@crs.loc.gov, 7-7344 Jameson
Washburn University. Faculty Salary Analysis
 Washburn University Faculty Salary Analysis 2012-13 Office of Institutional Research Washburn University May 15, 2013 Washburn University Faculty Salary Analysis 2012-13 This report provides an overview
F O R E S T R I V E R M A R I N E
 F O R E S T R I V E R M A R I N E Regional Sales Manager - Eric Rose Cell: (574) 361-8673 E-mail: erose@forestriverinc.com Sales Coordinator - Neil Massing (574) 825-8168 Cell: (574) 825-6180 E-mail: nmassing@forestriverinc.com
Adjusted Graduation Gap: NCAA Division-I Football
 Media Contact: Dr. Richard M. Southall southall@email.unc.edu, 919.962 3507 / 901.240-7197 (cell) Adjusted Graduation Gap: NCAA Division-I Football Study Reveals Large Gaps between Graduation Rates of
Estimated Economic Impacts of the Small Business Jobs and Tax Relief Act National Report
 Regional Economic Models, Inc. Estimated Economic Impacts of the Small Business Jobs and Tax Relief Act National Report Prepared by Frederick Treyz, CEO June 2012 The following is a summary of the Estimated
Child & Adult Care Food Program: Participation Trends 2014
 Child & Adult Care Food Program: Participation Trends 2014 1200 18th St NW Suite 400 Washington, DC 20036 (202) 986-2200 / www.frac.org February 2016 About FRAC The Food Research and Action Center (FRAC)
Arizona State Funding Project: Addressing the Teacher Labor Market Challenge Executive Summary. Research conducted by Education Resource Strategies
 Arizona State Funding Project: Addressing the Teacher Labor Market Challenge Executive Summary Research conducted by Education Resource Strategies Key findings 1. Student outcomes in Arizona lag behind
Rankings of the States 2017 and Estimates of School Statistics 2018
 Rankings of the States 2017 and Estimates of School Statistics 2018 NEA RESEARCH April 2018 Reproduction: No part of this report may be reproduced in any form without permission from NEA Research, except
THE METHODIST CHURCH (U.S.)
") THE METHODIST LIBRARY CONFERENCE JOURNALS COLLECTION PAGE: 1 ALABAMA 1939-58 ALABAMA WEST FLORIDA 1959-1967 ALASKA MISSION 1941, 1949-1967 ATLANTA 1939-1951 BALTIMORE CALIFORNIA ORIENTAL MISSION 1939-1952
THE METHODIST LIBRARY CONFERENCE JOURNALS COLLECTION PAGE: 1 ALABAMA 1939-58 ALABAMA WEST FLORIDA 1959-1967 ALASKA MISSION 1941, 1949-1967 ATLANTA 1939-1951 BALTIMORE CALIFORNIA ORIENTAL MISSION 1939-1952
PRESS RELEASE Media Contact: Joseph Stefko, Director of Public Finance, ;
 PRESS RELEASE Media Contact: Joseph Stefko, Director of Public Finance, 585.327.7075; jstefko@cgr.org Highest Paid State Workers in New Jersey & New York in 2010; Lowest Paid in Dakotas and West Virginia
Index of religiosity, by state
 Index of religiosity, by state Low Medium High Total United States 19 26 55=100 Alabama 7 16 77 Alaska 28 27 45 Arizona 21 26 53 Arkansas 12 19 70 California 24 27 49 Colorado 24 29 47 Connecticut 25 32
BENEFITS OF DIVISION II MEMBERSHIP
 BENEFITS OF DIVISION II MEMBERSHIP TALKING POINTS FOR PRESIDENTS AND CHANCELLORS Division II is a collection of more than 300 NCAA colleges and universities that provide thousands of student-athletes the
Fiscal Research Center
 January 2017 Georgia s Rankings Among the States: Budget, Taxes and Other Indicators ABOUT THE FISCAL RESEARCH CENTER Established in 1995, the (FRC) provides nonpartisan research, technical assistance
Drink Mats Grill Mats
 Alabama A&M Alabama State Alabama-ALogo 14000 12115 15500 Alabama at Birmingham Alabama at Huntsville Alabama-Elephant Logo 9064 Appalachian State Arizona 10328 Arizona State 10329 Arkansas 14015 12116
Federal Funding for Health Insurance Exchanges
 Federal Funding for Health Insurance Exchanges Annie L. Mach Analyst in Health Care Financing C. Stephen Redhead Specialist in Health Policy June 11, 2014 Congressional Research Service 7-5700 www.crs.gov
Media Contact: Destini Orr , Todd Currie ,
 Media Contact: Destini Orr 804-704-0195, DestiniOrr@knights.ucf.edu Todd Currie 561-384-0891, todd.currie@ucf.edu Keeping Score When It Counts: Assessing the Academic Records of the 2016-2017 -bound College
Name: Date: Albany: Jefferson City: Annapolis: Juneau: Atlanta: Lansing: Augusta: Lincoln: Austin: Little Rock: Baton Rouge: Madison: Bismarck:
 Albany: Annapolis: Atlanta: Augusta: Austin: Baton Rouge: Bismarck: Boise: Boston: Carson City: Charleston: Cheyenne: Columbia: Columbus: Concord: Denver: Des Moines: Dover: Frankfort: Harrisburg: Hartford:
Table 6 Medicaid Eligibility Systems for Children, Pregnant Women, Parents, and Expansion Adults, January Share of Determinations
 Table 6 Medicaid Eligibility Systems for Children, Pregnant Women, Parents, and Expansion Adults, January 2017 Able to Make Share of Determinations System determines eligibility for: 2 State Real-Time
Fiscal Research Center
 January 2016 Georgia s Rankings Among the States: Budget, Taxes and Other Indicators ABOUT THE FISCAL RESEARCH CENTER Established in 1995, the (FRC) provides nonpartisan research, technical assistance
ECSCA Field Trial Committee Report. December 31, 2010
 ECSCA Field Trial Committee Report December 31, 2010 Field Trial Committee 2010 Nelson Benson - Chairman and Member at Large Hobson Brown - Eastern Region Representative Tony Roettger - Mid-West Region
HOPE NOW State Loss Mitigation Data December 2016
 HOPE NOW State Loss Mitigation Data December 2016 Table of Contents Page Definitions 2 Data Overview 3 Table 1 - Delinquencies 4 Table 2 - Foreclosure Starts 7 Table 3 - Foreclosure Sales 8 Table 4 - Repayment
2018 NCAA Division I Men's Basketball Championship
 Charlotte Wichita Boise Nashville Nashville Pittsburgh Detroit San Diego Wichita Detroit Dallas Dallas Boise San Diego Charlotte Pittsburgh 2018 NCAA Division I Men's Basketball Championship First Round
STATE INDUSTRY ASSOCIATIONS $ - LISTED NEXT PAGE. TOTAL $ 88,000 * for each contribution of $500 for Board Meeting sponsorship
 Exhibit D -- TRIP 2017 FUNDING SOURCES -- February 3, 2017 CORPORATE $ 12,000 Construction Companies $ 5,500 Consulting Engineers Equipment Distributors Manufacturer/Supplier/Producer 6,500 Surety Bond
HOPE NOW State Loss Mitigation Data September 2014
 HOPE NOW State Loss Mitigation Data September 2014 Table of Contents Page Definitions 2 Data Overview 3 Table 1 - Delinquencies 4 Table 2 - Foreclosure Starts 7 Table 3 - Foreclosure Sales 8 Table 4 -
All Approved Insurance Providers All Risk Management Agency Field Offices All Other Interested Parties
 United States Department of Agriculture Farm Production and Conservation Risk Management Agency Beacon Facility Mail Stop 080 P.O. Box 49205 Kansas City, MO 644-6205, 207 INFORMATIONAL MEMORANDUM: PM-7-06
RECERTIFICATION REQUIREMENTS
 Alabama Yes The Council on Recertification of Nurse Anesthetists. [Alabama Board of Nursing Admin. Code, sec. 610-X-9-.01(1)(d)] Alaska Yes Current national certification. [Professional Regulations, Board
The Regional Economic Outlook
 The Regional Economic Outlook Presented by: Mark McMullen, Director of Government Svcs Prepared for: FTA Revenue Estimating Conference September 15, 2008 Recent Economic Performance 2 1 The Job Market
Weber State. Head Coach. 15th Season. WILDCAT COACHing staff HEAD COACH AL GIVENS. Givens Profile. weberstatesports.com
 HEAD COACH AL GIVENS 15th Season The 2007 season will mark the 15th year for Al Givens as head coach at. It will also be the 31st year of volleyball coaching for Givens, with 30 of those years as a head
Colleges/Universities with Exercise Science/Kinesiology-related Graduate Programs
 Colleges/Universities with Exercise Science/Kinesiology-related Graduate Programs (If you know of a college/university not on this list, please contact the CSCCa National Office to have it added.) ALABAMA
STATE ENTREPRENEURSHIP INDEX
 University of Nebraska - Lincoln DigitalCommons@University of Nebraska - Lincoln Business in Nebraska Bureau of Business Research 12-2013 STATE ENTREPRENEURSHIP INDEX Eric Thompson University of Nebraska-Lincoln,
Weekly Market Demand Index (MDI)
") VOL. 8 NO. 28 JULY 13, 2015 LOAD AVAILABILITY Up 7% compared to the Weekly Market Demand Index (MDI) Note: MDI Measures Relative Truck Demand LOAD SEARCHING Up 18.3% compared to the TRUCK AVAILABILITY
VOL. 8 NO. 28 JULY 13, 2015 LOAD AVAILABILITY Up 7% compared to the Weekly Market Demand Index (MDI) Note: MDI Measures Relative Truck Demand LOAD SEARCHING Up 18.3% compared to the TRUCK AVAILABILITY
Local and Regional Jail Financing
 Local and Regional Jail Financing Presentation ti Outline Funding for Local and Regional Jail Construction Funding for Local and Regional Jail Operations Coordination of Space in Local and Regional Jails
Voter Registration and Absentee Ballot Deadlines by State 2018 General Election: Tuesday, November 6. Saturday, Oct 27 (postal ballot)
") Voter Registration and Absentee Ballot Deadlines by State 2018 General Election: All dates in 2018 unless otherwise noted STATE REG DEADLINE ABSENTEE BALLOT REQUEST DEADLINE Alabama November 1 ABSENTEE
Voter Registration and Absentee Ballot Deadlines by State 2018 General Election: All dates in 2018 unless otherwise noted STATE REG DEADLINE ABSENTEE BALLOT REQUEST DEADLINE Alabama November 1 ABSENTEE
2014 Montana Volleyball. Quick Facts
 Quick Facts University Informa on Name of school: University of Montana Loca on: Missoula, Mont. Founded: February 17, 1893 Enrollment: 15,000 Nickname: Grizzlies Colors: Maroon and silver Facility: West
FORTIETH TRIENNIAL ASSEMBLY
 FORTIETH TRIENNIAL ASSEMBLY MOST PUISSANT GENERAL GRAND MASTER GENERAL GRAND COUNCIL OF CRYPTIC MASONS INTERNATIONAL 1996-1999 -
Table 2 Overall Heterodox-Adjusted Rankings for Ph.D.-Granting Institutions in Economics
 ing Economics Departments in a Contested Discipline 23 Heterodox-Adjusted ings for Ph.D.-Granting Institutions in Economics ) ) Harvard U 43 1 (1) 5.47 1 (1) UC Berkeley 56 2 (2) 4.08 4 (4) Princeton U
Statutory change to name availability standard. Jurisdiction. Date: April 8, [Statutory change to name availability standard] [April 8, 2015]
![Statutory change to name availability standard. Jurisdiction. Date: April 8, [Statutory change to name availability standard] [April 8, 2015]](/thumbs/83/87461560.jpg "Statutory change to name availability standard. Jurisdiction. Date: April 8, [Statutory change to name availability standard] [April 8, 2015]") Topic: Question by: : Statutory change to name availability standard Michael Powell Texas Date: April 8, 2015 Manitoba Corporations Canada Alabama Alaska Arizona Arkansas California Colorado Connecticut
Topic: Question by: : Statutory change to name availability standard Michael Powell Texas Date: April 8, 2015 Manitoba Corporations Canada Alabama Alaska Arizona Arkansas California Colorado Connecticut
MAC ANNOUNCES UPDATED 2016 FOOTBALL SCHEDULE
 MAC ANNOUNCES UPDATED 2016 FOOTBALL SCHEDULE 2016 schedule features 17 November nationally televised games on ESPN2, ESPNU and CBS Sports Network For Immediate Release Thursday, June 9, 2016 Cleveland,