Know Your Neighbor RuffaloCODY Conference July 23-24, 2013
|
|
|
- Peregrine Carson
- 6 years ago
- Views:
Transcription


1 Know Your Neighbor Kate Schwartz Brennan Saint Louis University Clark Gafke RuffaloCODY Know Your Neighbor RuffaloCODY Conference July 23-24, 2013 Kate Schwartz Brennan, Saint Louis University Clark Gafke, RuffaloCODY Know Your Neighbor Agenda I. Sources of Contributions I vs II. Where We Are Giving I vs III. Choices USA 501c3 Community I. By State IV. Donor Differences I. Men vs. Women II. Rich vs. Everyone Else III. Major Donors vs. Donors less than $1,000 IV. Three Quarters of Americans V. Conservatives vs. Liberals VI. How much we give based on where we live V. Supporting Alumni Percentages I. Press Headlines II. Major Gift Announcements VI. $1 Billion Campaigns VII. The Hard Questions 1


2 Know your Neighbor Agenda VIII. Saint Louis University Profile IX. What we know about our prospects and what we do with this information I. Demographics, Interests & Ratings II. Data collection and Tracking III. Personalization IV. Becoming a Priority X. An Annual Giving Campaign: Phase One I. Goals II. Collecting Feedback III. Stewardship Opportunities IV. Integrated Development Marketing Campaign XI. Stewardship I. What Donors Want II. Stewarding the Average Donor XII. An Annual Giving Campaign: Phase Two I. Show impact through storytelling I. Prioritizing Annual Giving Prospects 2012 Giving USA: $ Billion Source: Giving USA 1993 Giving USA: $ Billion Source: Giving USA 2


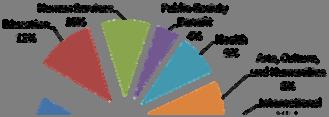

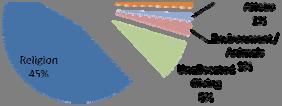

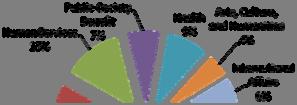
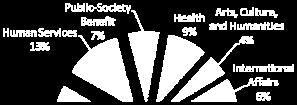
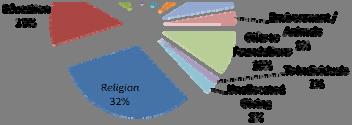

3 Source: Giving USA 1993 Giving USA: $ Billion Source: Giving USA 2012 Giving USA: $ Billion Source: Giving USA 3


4 Source: Giving USA Choices 528, % Source: National Center for Charitable Statistics Choices 1995 to 2010 US Registered 501c3 Public Charities STATE Increase Alaska 2,015 3,672 82% Alabama 6,247 14, % Arkansas 4,374 9, % Arizona 6,955 16, % California 62, ,968 87% Colorado 9,643 20, % Connecticut 7,618 13,076 72% District of Columbia 6,730 9,110 35% Delaware 1,656 3, % Florida 20,243 54, % Georgia 10,164 28, % Hawaii 2,890 5,661 96% Iowa 7,679 13,875 80% Idaho 2,392 5, % Source: National Center for Charitable Statistics 4
5 Choices 1995 to 2010 US Registered 501c3 Public Charities STATE Increase Illinois 21,226 40,574 91% Indiana 11,905 22,873 92% Kansas 6,149 11,419 85% Kentucky 6,751 12,601 87% Louisiana 6,108 12, % Massachusetts 13,999 24,842 77% Maryland 10,797 23, % Maine 3,144 5,969 90% Michigan 16,207 32, % Minnesota 11,448 22,385 95% Missouri 13,231 23,367 76% Mississippi 3,495 9, % Montana 3,187 6, % North Carolina 13,065 29, % Source: National Center for Charitable Statistics Choices 1995 to 2010 US Registered 501c3 Public Charities STATE Increase North Dakota 2,115 3,515 66% Nebraska 4,490 7,558 68% New Hampshire 2,622 5, % New Jersey 13,634 28, % New Mexico 4,034 7,302 81% Nevada 2,153 7, % New York 35,950 67,499 88% Ohio 23,285 41,530 78% Oklahoma 7,479 13,659 83% Oregon 8,214 15,646 90% Pennsylvania 21,375 41,428 94% Rhode Island 2,284 3,775 65% South Carolina 6,013 16, % South Dakota 2,139 4,122 92% Source: National Center for Charitable Statistics Choices 1995 to 2010 US Registered 501c3 Public Charities STATE Increase Tennessee 11,902 22,400 88% Texas 32,193 71, % Utah 2,530 5, % Virginia 12,933 28, % Vermont 2,253 4,124 83% Washington 12,781 24,638 93% Wisconsin 10,981 21,208 93% West Virginia 3,422 6, % Wyoming 1,476 2,813 90% Source: National Center for Charitable Statistics 5


 make 50% of all")
6 Who Gives? Based on Head of Household Source: Center of Philanthropy Average Household Donations Source: Portfolio.com: Alms From the Working Class The Difference in Donors Major Gift Donors Donors less than $1,000 Mission motivating gifts Supportive of the mission Loyal to the organization Unrestricted giving is comfortable Restricted giving is a preference Other giving priorities can influence them Name recognition in important Tax issues are not in play Networked with other donors Enjoy donor recognition Tax issues are in play Support 7 10 NPOs annually Long term cultivation is required Most don t send unsolicited gifts About three quarters of American families donate $1,800 to charity Conservatives give 30% more than liberals despite making less Households exceeding $1 million in annual income (7% of the population) make 50% of all donation dollars The remaining 93% of the population gives almost 30% more of their income to charity Source: ABC 20/20 OnPhilanthropy: ncvaonline.org 6


 Source: Council for Aid to Education: Voluntary")
7 Conservatives vs. Liberals MOST CHARITABLE Utah* Mississippi Alabama Tennessee South Carolina Idaho Arkansas Georgia *Most of all 10.6% 2008 Presidential Election LEAST CHARITABLE Wisconsini Connecticut Rhode Island Massachusetts Vermont Maine New Hampshire* *Least of all 2.5% Source: ABC 20/20 The Chronicle of Philanthropy Alumni Participation Rates 14 /19 biggest gifts announced by individuals in 2010 go to universities (only 5 went to other charities) Source: Council for Aid to Education: Voluntary Support of Education The Chronicle of Philanthropy Alumni Participation Rate by Age Source: Saint Louis University 7

8 2007 Headline Philanthropy hits record as number of $100 million donations increase; The rich share wealth: $50.5 billion in donations of $100 million or more compared with 11 in 2005 Philanthropy of the country s 60 most generous givers hit a record $7 billion in 2006, up from $4.3 billion the year before Stanford University in the midst of a $4 billion campaign, the largest ever for a university Phil Knight recognized for giving $105 million to Stanford s business school Source: USA TODAY University The Top 25 Campaign Goal Stanford University* $4,300,000, Columbia University $4,000,000, Cornell University $4,000,000, University of Pennsylvania $3,500,000, Yale University $3,500,000, City University of New York $3,000,000, State University of New York $3,000,000, University of California at Berkeley $3,000,000, University of Texas at Austin $3,000,000, University of Virginia $3,000,000, University of Illinois System $2,250,000, Pennsylvania State University at Univ. Park $2,000,000, University of Pittsburgh $2,000,000, Princeton University $1,750,000, Source: The Chronicle of Higher Education The Top 25 University Campaign Goal Vanderbilt University $1,750,000, Emory University $1,600,000, Boston College $1,500,000, University of Florida $1,500,000, University of Notre Dame $1,500,000, Brown University $1,400,000, Brandeis University $1,220,000, Tufts University $1,200,000, University of Nebraska $1,200,000, University of Utah $1,200,000, Indiana University at Bloomington $1,100,000, Source: The Chronicle of Higher Education 8
9 Gift Range $1 Billion Dollar Gift Range Chart # of Gifts Required Cumulative Total Cumulative % $100,000, $100,000, % $50,000, $200,000, % $25,000, $325,000, % $10,000, $425,000, % $5,000, $525,000, % $2,500, $625,000, % $1,000, $685,000, % $500, $735,000, % $300, $771,000, % Under $300, ,526 $1,000,000, % Totals 1,884 $1,000,000, Source: blackbaud Gift Range Calculator for Nonprofits It s not how much you give it s that you give. TRUE FALSE I can t give enough to make a difference. TRUE FALSE Saint Louis University Catholic, Jesuit University founded in 1818 Total enrollment: 13,981 8,806 undergraduate 5,175 post baccalaureate 3,003 Faculty Members 100 undergraduate majors and more than 70 graduate programs 116,702 Living Alumni Currently residing in 50 states and 139 countries 97,247 Solicitable Alumni 56,577 Undergraduate Solicitable Alumni 14.8% Overall alumni participation 14.4% Undergraduate participation 9


10 FY13 All Solicitable Alumni by School Public Health, 1,923 Former Colleges, 1,885 Nursing, 8,163 Medicine, 7,134 Arts & Sciences, 26,193 Law, 8,792 Allied Health, 6,114 Engineering & Aviation, 8,554 Education, 5,427 Advanced Dental, 623 Professional Studies, 1,910 Business, 16,998 Social Service, 3,531 Alumni Participation Rate by School 25.0% 20.0% 15.1% 17.5% 22.6% 23.4% 15.0% 10.0% 13.5% 12.6% 11.8% 15.3% 9.8% 11.1% 14.9% 14.2% 5.0% 11.7% 0.0% What do we know about our prospects? Demographics Add & update through phonathon, donor surveys, s, etc. Don t forget about spouse & child information AND employer & job title! Ensure that your database is linking relationship records Interests & Achievements Load student activities, iii event attendance, class notes, awards, etc. to your database Capacity Ratings Belief in the mission of your university 10
11 What can we do with this information? Demographics Personalize the phonathon Creative Segmentation (alumni parents, married alumni, etc.) Interests & Achievements Increase engagement with reunions & special events Create donor centric solicitations Create likelihood scores Capacity Ratings Prioritize our prospects (More on this later stay tuned!) Belief in the mission of your university Tell stories of your mission in action How do we become a priority for our prospects? Why do donors give and what prevents non donors from giving? Speculate vs. going to the source Alumni Survey Focus Groups Integrated development marketing campaign An Annual Giving Campaign: Phase One 11


12 ...every dollar that allows college students to carry less debt is a dollar well spent....both of my boys got a fantastic education at SLU. Their scholarships made SLU affordable so I support the Saint Louis University Scholarship Fund....I'm a graduate. it is the right thing to do since SLU helped me to achieve what I have achieved. SLU gave me a fantastic career in social work as well as many great friends and memories SLU gave me a fantastic career in social work as well as many great friends and memories....saint Louis University gave me an opportunity to have a great life, which I have had as a result of my education....joan Hrubetz made a difference in my nursing career. it is where my husband and I met and started dating 40 years ago....i support the mission of SLU, a Catholic university with Jesuit ideals. the values imparted to me at SLU have helped guide my life. it is an outstanding Jesuit school preparing the whole person to lead a full and rewarding life. SLU taught me to give back!! 12


13 How do donors WANT to be stewarded? Trinkets and Tchotchkes? Invitations to special events? Special recognition in an honor roll? The red carpet treatment at events? Knowledge of how their gift was used? The feeling that they have made a difference? Stewarding the average donor Personalized acknowledgement letter featuring specific points of pride Thank you calls from students Recognition at Homecoming Thank you postcard with car decal for all new and lapsed donors Consecutive giving society (to be kicked off this fiscal year!) Consistently show the impact of their gift. 13
14 Impact of the $100 Gift If all alumni gave $100 we could raise $. A gift of $100 covers the cost of a case of new beakers for the Chemistry lab. Alumni participation ii i it is not the amount you give, but rather the action of giving. Gifts of all sizes matter. Last year, gifts of $100 or less totaled over $650,000. An Annual Giving Campaign: Phase Two Our Mission in Action 14
15 Segmenting Segmenting Using what we know to prioritize Annual Giving prospects Probability of Giving & Value of Gift The Reeher Platform is one way to acquire these scores Determine what scores capture your best Annual Giving Prospects Will be different for everyone; important to look at your baseline and benchmark with similar schools Same concept used by major gift officers, just different values 15
16 SLU s Top AGP Prospects Reeher go live date June 5, 2013 Using Reeher, we identified nearly 6,000 prospects as Top AGP Prospects who had not given as of June 3,893 were alumni Sent a simple mail solicitation (in house), an and added these prospects to a new CampusCALL project SLU s Top AGP Prospects Results Direct Mail: Dropped on June 14 to 3,348 households Used existing letterhead and envelopes only cost this fiscal year was postage! 85 gifts and pledges for $20, % response rate & $0.06 to raise $1 Most successful direct mail in FY13 prior to this was 1.9% and $0.11 Phonathon: 3,602 prospects loaded into CampusCALL Had system hours and hours of talk time 71 pledges (and 25 unspecified pledges) 31.98% participation Compared to our FY13 overall participation rate of 28.39% Average gift of $169 Compared to our FY13 overall average gift of $135 Thank you! For more information contact: Kate Schwartz Brennan schwarkj@slu.edu Clark Gafke clark.gafke@ruffalocody.com Please complete the session evaluation at: 16
 3+ 3+ N = 155, 442 3+ R 2 =.32 < < < 3+ N = 149, 685 3+ R 2 =.27 < < < 3+ N = 99, 752 3+ R 2 =.4 < < < 3+ N = 98, 887 3+ R 2 =.6 < < < 3+ N = 52, 624 3+ R 2 =.28 < < < 3+ N = 36, 281 3+ R 2 =.5 < < < 7+
TABLE 3c: Congressional Districts with Number and Percent of Hispanics* Living in Hard-to-Count (HTC) Census Tracts**
 Census Tracts**") living Alaska 00 47,808 21,213 44.4 Alabama 01 20,661 3,288 15.9 Alabama 02 23,949 6,614 27.6 Alabama 03 20,225 3,247 16.1 Alabama 04 41,412 7,933 19.2 Alabama 05 34,388 11,863 34.5 Alabama 06 34,849 4,074
living Alaska 00 47,808 21,213 44.4 Alabama 01 20,661 3,288 15.9 Alabama 02 23,949 6,614 27.6 Alabama 03 20,225 3,247 16.1 Alabama 04 41,412 7,933 19.2 Alabama 05 34,388 11,863 34.5 Alabama 06 34,849 4,074
TABLE 3b: Congressional Districts Ranked by Percent of Hispanics* Living in Hard-to- Count (HTC) Census Tracts**
 Census Tracts**") Rank State District Count (HTC) 1 New York 05 150,499 141,567 94.1 2 New York 08 133,453 109,629 82.1 3 Massachusetts 07 158,518 120,827 76.2 4 Michigan 13 47,921 36,145 75.4 5 Illinois 04 508,677 379,527
Rank State District Count (HTC) 1 New York 05 150,499 141,567 94.1 2 New York 08 133,453 109,629 82.1 3 Massachusetts 07 158,518 120,827 76.2 4 Michigan 13 47,921 36,145 75.4 5 Illinois 04 508,677 379,527
The American Legion NATIONAL MEMBERSHIP RECORD
 The American Legion NATIONAL MEMBERSHIP RECORD www.legion.org 2016 The American Legion NATIONAL MEMBERSHIP RECORD 1920-1929 Department 1920 1921 1922 1923 1924 1925 1926 1927 1928 1929 Alabama 4,474 3,246
5 x 7 Notecards $1.50 with Envelopes - MOQ - 12
 5 x 7 Notecards $1.50 with Envelopes - MOQ - 12 Magnets 2½ 3½ Magnet $1.75 - MOQ - 5 - Add $0.25 for packaging Die Cut Acrylic Magnet $2.00 - MOQ - 24 - Add $0.25 for packaging 2535-22225 California AM-22225
Unemployment Rate (%) Rank State. Unemployment
 Rank State. Unemployment") States Ranked by February 2018 Unemployment Rate Seasonally Adjusted Unemployment Unemployment Unemployment 1 Hawaii 2.1 19 Alabama 3.7 33 Ohio 4.5 2 New Hampshire 2.6 19 Missouri 3.7 33 Rhode Island 4.5
States Ranked by February 2018 Unemployment Rate Seasonally Adjusted Unemployment Unemployment Unemployment 1 Hawaii 2.1 19 Alabama 3.7 33 Ohio 4.5 2 New Hampshire 2.6 19 Missouri 3.7 33 Rhode Island 4.5
Unemployment Rate (%) Rank State. Unemployment
 Rank State. Unemployment") States Ranked by November 2015 Unemployment Rate Seasonally Adjusted Unemployment Unemployment Unemployment 1 North Dakota 2.7 19 Indiana 4.4 37 Georgia 5.6 2 Nebraska 2.9 20 Ohio 4.5 37 Tennessee 5.6
States Ranked by November 2015 Unemployment Rate Seasonally Adjusted Unemployment Unemployment Unemployment 1 North Dakota 2.7 19 Indiana 4.4 37 Georgia 5.6 2 Nebraska 2.9 20 Ohio 4.5 37 Tennessee 5.6
Unemployment Rate (%) Rank State. Unemployment
 Rank State. Unemployment") States Ranked by April 2017 Unemployment Rate Seasonally Adjusted Unemployment Unemployment Unemployment 1 Colorado 2.3 17 Virginia 3.8 37 California 4.8 2 Hawaii 2.7 20 Massachusetts 3.9 37 West Virginia
States Ranked by April 2017 Unemployment Rate Seasonally Adjusted Unemployment Unemployment Unemployment 1 Colorado 2.3 17 Virginia 3.8 37 California 4.8 2 Hawaii 2.7 20 Massachusetts 3.9 37 West Virginia
Unemployment Rate (%) Rank State. Unemployment
 Rank State. Unemployment") States Ranked by August 2017 Unemployment Rate Seasonally Adjusted Unemployment Unemployment Unemployment 1 North Dakota 2.3 18 Maryland 3.9 36 New York 4.8 2 Colorado 2.4 18 Michigan 3.9 38 Delaware 4.9
States Ranked by August 2017 Unemployment Rate Seasonally Adjusted Unemployment Unemployment Unemployment 1 North Dakota 2.3 18 Maryland 3.9 36 New York 4.8 2 Colorado 2.4 18 Michigan 3.9 38 Delaware 4.9
Unemployment Rate (%) Rank State. Unemployment
 Rank State. Unemployment") States Ranked by March 2016 Unemployment Rate Seasonally Adjusted Unemployment Unemployment Unemployment 1 South Dakota 2.5 19 Delaware 4.4 37 Georgia 5.5 2 New Hampshire 2.6 19 Massachusetts 4.4 37 North
States Ranked by March 2016 Unemployment Rate Seasonally Adjusted Unemployment Unemployment Unemployment 1 South Dakota 2.5 19 Delaware 4.4 37 Georgia 5.5 2 New Hampshire 2.6 19 Massachusetts 4.4 37 North
Unemployment Rate (%) Rank State. Unemployment
 Rank State. Unemployment") States Ranked by September 2017 Unemployment Rate Seasonally Adjusted Unemployment Unemployment Unemployment 1 North Dakota 2.4 17 Indiana 3.8 36 New Jersey 4.7 2 Colorado 2.5 17 Kansas 3.8 38 Pennsylvania
States Ranked by September 2017 Unemployment Rate Seasonally Adjusted Unemployment Unemployment Unemployment 1 North Dakota 2.4 17 Indiana 3.8 36 New Jersey 4.7 2 Colorado 2.5 17 Kansas 3.8 38 Pennsylvania
Unemployment Rate (%) Rank State. Unemployment
 Rank State. Unemployment") States Ranked by December 2017 Unemployment Rate Seasonally Adjusted Unemployment Unemployment Unemployment 1 Hawaii 2.0 16 South Dakota 3.5 37 Connecticut 4.6 2 New Hampshire 2.6 20 Arkansas 3.7 37 Delaware
States Ranked by December 2017 Unemployment Rate Seasonally Adjusted Unemployment Unemployment Unemployment 1 Hawaii 2.0 16 South Dakota 3.5 37 Connecticut 4.6 2 New Hampshire 2.6 20 Arkansas 3.7 37 Delaware
Unemployment Rate (%) Rank State. Unemployment
 Rank State. Unemployment") States Ranked by September 2015 Unemployment Rate Seasonally Adjusted Unemployment Unemployment Unemployment 1 North Dakota 2.8 17 Oklahoma 4.4 37 South Carolina 5.7 2 Nebraska 2.9 20 Indiana 4.5 37 Tennessee
States Ranked by September 2015 Unemployment Rate Seasonally Adjusted Unemployment Unemployment Unemployment 1 North Dakota 2.8 17 Oklahoma 4.4 37 South Carolina 5.7 2 Nebraska 2.9 20 Indiana 4.5 37 Tennessee
Unemployment Rate (%) Rank State. Unemployment
 Rank State. Unemployment") States Ranked by November 2014 Unemployment Rate Seasonally Adjusted Unemployment Unemployment Unemployment 1 North Dakota 2.7 19 Pennsylvania 5.1 35 New Mexico 6.4 2 Nebraska 3.1 20 Wisconsin 5.2 38 Connecticut
States Ranked by November 2014 Unemployment Rate Seasonally Adjusted Unemployment Unemployment Unemployment 1 North Dakota 2.7 19 Pennsylvania 5.1 35 New Mexico 6.4 2 Nebraska 3.1 20 Wisconsin 5.2 38 Connecticut
Unemployment Rate (%) Rank State. Unemployment
 Rank State. Unemployment") States Ranked by July 2018 Unemployment Rate Seasonally Adjusted Unemployment Unemployment Unemployment 1 Hawaii 2.1 19 Massachusetts 3.6 37 Kentucky 4.3 2 Iowa 2.6 19 South Carolina 3.6 37 Maryland 4.3
States Ranked by July 2018 Unemployment Rate Seasonally Adjusted Unemployment Unemployment Unemployment 1 Hawaii 2.1 19 Massachusetts 3.6 37 Kentucky 4.3 2 Iowa 2.6 19 South Carolina 3.6 37 Maryland 4.3
Index of religiosity, by state
 Index of religiosity, by state Low Medium High Total United States 19 26 55=100 Alabama 7 16 77 Alaska 28 27 45 Arizona 21 26 53 Arkansas 12 19 70 California 24 27 49 Colorado 24 29 47 Connecticut 25 32
2015 State Hospice Report 2013 Medicare Information 1/1/15
 2015 State Hospice Report 2013 Medicare Information 1/1/15 www.hospiceanalytics.com 2 2013 Demographics & Hospice Utilization National Population 316,022,508 Total Deaths 2,529,792 Medicare Beneficiaries
MAP 1: Seriously Delinquent Rate by State for Q3, 2008
 MAP 1: Seriously Delinquent Rate by State for Q3, 2008 Seriously Delinquent Rate Greater than 6.93% 5.18% 6.93% 0 5.17% Source: MBA s National Deliquency Survey MAP 2: Foreclosure Inventory Rate by State
Rutgers Revenue Sources
 Rutgers Revenue Sources 31.2% Tuition and Fees 27.3% State Appropriations with Fringes 1.0% Endowment and Investments.5% Federal Appropriations 17.8% Federal, State, and Municipal Grants and Contracts
Child & Adult Care Food Program: Participation Trends 2016
 Child & Adult Care Food Program: Participation Trends 2016 March 2017 About FRAC The Food Research and Action Center (FRAC) is the leading national organization working for more effective public and private
Interstate Pay Differential
 Interstate Pay Differential APPENDIX IV Adjustments for differences in interstate pay in various locations are computed using the state average weekly pay. This appendix provides a table for the second
Child & Adult Care Food Program: Participation Trends 2017
 Child & Adult Care Food Program: Participation Trends 2017 February 2018 About FRAC The Food Research and Action Center (FRAC) is the leading national organization working for more effective public and
2016 INCOME EARNED BY STATE INFORMATION
 BY STATE INFORMATION This information is being provided to assist in your 2016 tax preparations. The information is also mailed to applicable Columbia fund non-corporate shareholders with their year-end
FY 2014 Per Capita Federal Spending on Major Grant Programs Curtis Smith, Nick Jacobs, and Trinity Tomsic
 Special Analysis 15-03, June 18, 2015 FY 2014 Per Capita Federal Spending on Major Grant Programs Curtis Smith, Nick Jacobs, and Trinity Tomsic 202-624-8577 ttomsic@ffis.org Summary Per capita federal
Estimated Economic Impacts of the Small Business Jobs and Tax Relief Act National Report
 Regional Economic Models, Inc. Estimated Economic Impacts of the Small Business Jobs and Tax Relief Act National Report Prepared by Frederick Treyz, CEO June 2012 The following is a summary of the Estimated
Child & Adult Care Food Program: Participation Trends 2014
 Child & Adult Care Food Program: Participation Trends 2014 1200 18th St NW Suite 400 Washington, DC 20036 (202) 986-2200 / www.frac.org February 2016 About FRAC The Food Research and Action Center (FRAC)
HOME HEALTH AIDE TRAINING REQUIREMENTS, DECEMBER 2016
 BACKGROUND HOME HEALTH AIDE TRAINING REQUIREMENTS, DECEMBER 2016 Federal legislation (42 CFR 484.36) requires that Medicare-certified home health agencies employ home health aides who are trained and evaluated
Voter Registration and Absentee Ballot Deadlines by State 2018 General Election: Tuesday, November 6. Saturday, Oct 27 (postal ballot)
") Voter Registration and Absentee Ballot Deadlines by State 2018 General Election: All dates in 2018 unless otherwise noted STATE REG DEADLINE ABSENTEE BALLOT REQUEST DEADLINE Alabama November 1 ABSENTEE
Voter Registration and Absentee Ballot Deadlines by State 2018 General Election: All dates in 2018 unless otherwise noted STATE REG DEADLINE ABSENTEE BALLOT REQUEST DEADLINE Alabama November 1 ABSENTEE
Current Medicare Advantage Enrollment Penetration: State and County-Level Tabulations
 Current Advantage Enrollment : State and County-Level Tabulations 5 Slide Series, Volume 40 September 2016 Summary of Tabulations and Findings As of September 2016, 17.9 million of the nation s 56.1 million
STATE INDUSTRY ASSOCIATIONS $ - LISTED NEXT PAGE. TOTAL $ 88,000 * for each contribution of $500 for Board Meeting sponsorship
 Exhibit D -- TRIP 2017 FUNDING SOURCES -- February 3, 2017 CORPORATE $ 12,000 Construction Companies $ 5,500 Consulting Engineers Equipment Distributors Manufacturer/Supplier/Producer 6,500 Surety Bond
Sentinel Event Data. General Information Copyright, The Joint Commission
 Sentinel Event Data General Information 1995 2015 Data Limitations The reporting of most sentinel events to The Joint Commission is voluntary and represents only a small proportion of actual events. Therefore,
PRESS RELEASE Media Contact: Joseph Stefko, Director of Public Finance, ;
 PRESS RELEASE Media Contact: Joseph Stefko, Director of Public Finance, 585.327.7075; jstefko@cgr.org Highest Paid State Workers in New Jersey & New York in 2010; Lowest Paid in Dakotas and West Virginia
Sentinel Event Data. General Information Q Copyright, The Joint Commission
 Sentinel Event Data General Information 1995 2Q 2014 Data Limitations The reporting of most sentinel events to The Joint Commission is voluntary and represents only a small proportion of actual events.
Table 6 Medicaid Eligibility Systems for Children, Pregnant Women, Parents, and Expansion Adults, January Share of Determinations
 Table 6 Medicaid Eligibility Systems for Children, Pregnant Women, Parents, and Expansion Adults, January 2017 Able to Make Share of Determinations System determines eligibility for: 2 State Real-Time
Is this consistent with other jurisdictions or do you allow some mechanism to reinstate?
 Topic: Question by: : Forfeiture for failure to appoint a resident agent Kathy M. Sachs Kansas Date: January 8, 2015 Manitoba Corporations Canada Alabama Alaska Arizona Arkansas California Colorado Connecticut
Senior American Access to Care Grant
 Senior American Access to Care Grant Grant Guidelines SENIOR AMERICAN (age 62 plus) ACCESS TO CARE GRANT GUIDELINES: The (ADAF) is committed to supporting U.S. based organizations exempt from taxation
DOCTORAL/RESEARCH INSTITUTIONS RECEIVING FULBRIGHT AWARDS FOR
 DOCTORAL/RESEARCH INSTITUTIONS RECEIVING FULBRIGHT AWARDS FOR 2015-2016 Those institutions highlighted in blue are listed in the Chronicle of Higher Education Institution State Grants Applications Harvard
Percentage of Enrolled Students by Program Type, 2016
 Percentage of Enrolled Students by Program Type, 2016 Doctorate 4% PN/VN 3% MSN 15% ADN 28% BSRN 22% Diploma 2% BSN 26% n = 279,770 Percentage of Graduations by Program Type, 2016 MSN 12% Doctorate 1%
Rankings of the States 2017 and Estimates of School Statistics 2018
 Rankings of the States 2017 and Estimates of School Statistics 2018 NEA RESEARCH April 2018 Reproduction: No part of this report may be reproduced in any form without permission from NEA Research, except
Supplemental Nutrition Assistance Program. STATE ACTIVITY REPORT Fiscal Year 2016
 Supplemental Nutrition Assistance Program ACTIVITY REPORT Fiscal Year 2016 Food and Nutrition Service Supplemental Nutrition Assistance Program Program Accountability and Administration Division September
Fiscal Year 1999 Comparisons. State by State Rankings of Revenues and Spending. Includes Fiscal Year 2000 Rankings for State Taxes Only
 Fiscal Year 1999 Comparisons State by State Rankings of Revenues and Spending Includes Fiscal Year 2000 Rankings for State Taxes Only January 2002 1 2 published annually by: The Minnesota Taxpayers Association
FORTIETH TRIENNIAL ASSEMBLY
 FORTIETH TRIENNIAL ASSEMBLY MOST PUISSANT GENERAL GRAND MASTER GENERAL GRAND COUNCIL OF CRYPTIC MASONS INTERNATIONAL 1996-1999 -
Table 8 Online and Telephone Medicaid Applications for Children, Pregnant Women, Parents, and Expansion Adults, January 2017
 Table 8 Online and Telephone Medicaid Applications for Children, Pregnant Women, Parents, and Expansion Adults, January 2017 State Applications Can be Submitted Online at the State Level 1 < 25% 25% -
Statutory change to name availability standard. Jurisdiction. Date: April 8, [Statutory change to name availability standard] [April 8, 2015]
![Statutory change to name availability standard. Jurisdiction. Date: April 8, [Statutory change to name availability standard] [April 8, 2015]](/thumbs/83/87461560.jpg "Statutory change to name availability standard. Jurisdiction. Date: April 8, [Statutory change to name availability standard] [April 8, 2015]") Topic: Question by: : Statutory change to name availability standard Michael Powell Texas Date: April 8, 2015 Manitoba Corporations Canada Alabama Alaska Arizona Arkansas California Colorado Connecticut
Topic: Question by: : Statutory change to name availability standard Michael Powell Texas Date: April 8, 2015 Manitoba Corporations Canada Alabama Alaska Arizona Arkansas California Colorado Connecticut
States Ranked by Annual Nonagricultural Employment Change October 2017, Seasonally Adjusted
 States Ranked by Annual Nonagricultural Employment Change Change (Jobs) Change (Jobs) Change (Jobs) 1 Texas 316,100 19 Nevada 36,600 37 Hawaii 7,100 2 California 256,800 20 Tennessee 34,800 38 Mississippi
Weights and Measures Training Registration
 Weights and Measures Training Registration Please fill out the form below to register for Weights and Measures training and testing dates. NIST Handbook 44, Specifications, Tolerances and other Technical
Critical Access Hospitals and HCAHPS
 Critical Access Hospitals and HCAHPS Michelle Casey, MS Senior Research Fellow and Deputy Director University of Minnesota Rural Health Research Center June 12, 2012 Overview of Presentation Why is HCAHPS
Introduction. Current Law Distribution of Funds. MEMORANDUM May 8, Subject:
 MEMORANDUM May 8, 2018 Subject: TANF Family Assistance Grant Allocations Under the Ways and Means Committee (Majority) Proposal From: Gene Falk, Specialist in Social Policy, gfalk@crs.loc.gov, 7-7344 Jameson
Department of Defense INSTRUCTION
 Department of Defense INSTRUCTION NUMBER 4715.02 August 28, 2009 Incorporating Change 2, August 31, 2018 USD(A&S) SUBJECT: Regional Environmental Coordination References: (a) DoD Instruction 4715.2, DoD
Name: Date: Albany: Jefferson City: Annapolis: Juneau: Atlanta: Lansing: Augusta: Lincoln: Austin: Little Rock: Baton Rouge: Madison: Bismarck:
 Albany: Annapolis: Atlanta: Augusta: Austin: Baton Rouge: Bismarck: Boise: Boston: Carson City: Charleston: Cheyenne: Columbia: Columbus: Concord: Denver: Des Moines: Dover: Frankfort: Harrisburg: Hartford:
HIGH SCHOOL ATHLETICS PARTICIPATION SURVEY
 2011-12 HIGH SCHOOL ATHLETICS PARTICIPATION SURVEY Conducted By THE NATIONAL FEDERATION OF STATE HIGH SCHOOL ASSOCIATIONS Based on Competition at the High School Level in the 2011-12 School Year BOYS GIRLS
CRMRI White Paper #3 August 2017 State Refugee Services Indicators of Integration: How are the states doing?
 CRMRI White Paper #3 August 7 State Refugee Services Indicators of Integration: How are the states doing? Marci Harris, Julia Greene, Kilee Jorgensen, Caren J. Frost, & Lisa H. Gren State Refugee Services
Interstate Turbine Advisory Council (CESA-ITAC)
") Interstate Turbine Advisory Council (CESA-ITAC) Mark Mayhew NYSERDA for Val Stori Clean Energy States Alliance SWAT 4/25/12 Today CESA ITAC, LLC - What, who and why The Unified List - What, why, how and
Interstate Turbine Advisory Council (CESA-ITAC) Mark Mayhew NYSERDA for Val Stori Clean Energy States Alliance SWAT 4/25/12 Today CESA ITAC, LLC - What, who and why The Unified List - What, why, how and
National Collegiate Soils Contest Rules
 National Collegiate Soils Contest Rules Students of Agronomy, Soils, and Environmental Sciences (SASES) Revised September 30, 2008 I. NAME The contest shall be known as the National Collegiate Soils Contest
Table 2 Overall Heterodox-Adjusted Rankings for Ph.D.-Granting Institutions in Economics
 ing Economics Departments in a Contested Discipline 23 Heterodox-Adjusted ings for Ph.D.-Granting Institutions in Economics ) ) Harvard U 43 1 (1) 5.47 1 (1) UC Berkeley 56 2 (2) 4.08 4 (4) Princeton U
Colorado River Basin. Source: U.S. Department of the Interior, Bureau of Reclamation
 The Colorado River supports a quarter million jobs and produces $26 billion in economic output from recreational activities alone, drawing revenue from the 5.36 million adults who use the Colorado River
TENNESSEE TEXAS UTAH VERMONT VIRGINIA WASHINGTON WEST VIRGINIA WISCONSIN WYOMING ALABAMA ALASKA ARIZONA ARKANSAS
 ALABAMA ALASKA ARIZONA ARKANSAS CALIFORNIA COLORADO CONNECTICUT DELAWARE DISTRICT OF COLUMBIA FLORIDA GEORGIA GUAM MISSOURI MONTANA NEBRASKA NEVADA NEW HAMPSHIRE NEW JERSEY NEW MEXICO NEW YORK NORTH CAROLINA
Percent of Population Under Age 65 Uninsured, 2013, 2014, and 2015
 Exhiit 1 Percent of Population Under Age 65 Uninsured, 13, 14, and 15 13 14 15
*ALWAYS KEEP A COPY OF THE CERTIFICATE OF ATTENDANCE FOR YOUR RECORDS IN CASE OF AUDIT
 State Alabama Alaska Arizona Arkansas California INSTRUCTIONS FOR CLE ATTENDANCE REPORTING AT IADC 2012 TRIAL ACADEMY Attorney Reporting Method After the CLE activity, fill out the Certificate of Attendance
Alabama Okay No Any recruiting or advertising without authorization is considered out of compliance. Not authorized
 No recruitment should take place if the state is red in this column. General Guidelines: Representatives of the University of Utah, whether directly engaged as recruiters or not, must follow the regulations
FOOD STAMP PROGRAM STATE ACTIVITY REPORT
 FOOD STAMP PROGRAM ACTIVITY REPORT Federal Fiscal Year 2004 Food Stamps Make America Stronger United States Department of Agriculture Food and Nutrition Service Program Accountability Division February
national assembly of state arts agencies
 STATE ARTS AGENCY GRANT MAKING AND FUNDING Each of America's 50 states and six jurisdictions has a government that works to make the cultural, civic, economic and educational benefits of the available
How North Carolina Compares
 How North Carolina Compares A Compendium of State Statistics March 2017 Prepared by the N.C. General Assembly Program Evaluation Division Preface The Program Evaluation Division of the North Carolina General
November 24, First Street NE, Suite 510 Washington, DC 20002
 820 First Street NE, Suite 510 Washington, DC 20002 Tel: 202-408-1080 Fax: 202-408-1056 center@cbpp.org www.cbpp.org November 24, 2008 TANF BENEFITS ARE LOW AND HAVE NOT KEPT PACE WITH INFLATION But Most
How North Carolina Compares
 How North Carolina Compares A Compendium of State Statistics January 2013 Prepared by the N.C. General Assembly Program Evaluation Division Program Evaluation Division North Carolina General Assembly Legislative
CONNECTICUT: ECONOMIC FUTURE WITH EDUCATIONAL REFORM
 CONNECTICUT: ECONOMIC FUTURE WITH EDUCATIONAL REFORM This file contains detailed projections and information from the article: Eric A. Hanushek, Jens Ruhose, and Ludger Woessmann, It pays to improve school
Weekly Market Demand Index (MDI)
") VOL. 8 NO. 28 JULY 13, 2015 LOAD AVAILABILITY Up 7% compared to the Weekly Market Demand Index (MDI) Note: MDI Measures Relative Truck Demand LOAD SEARCHING Up 18.3% compared to the TRUCK AVAILABILITY
VOL. 8 NO. 28 JULY 13, 2015 LOAD AVAILABILITY Up 7% compared to the Weekly Market Demand Index (MDI) Note: MDI Measures Relative Truck Demand LOAD SEARCHING Up 18.3% compared to the TRUCK AVAILABILITY
Larry DeBoer Purdue University September Real GDP Growth. Real Consumption Spending Growth
 Larry DeBoer Purdue University September 2011 Real GDP Growth Real Consumption Spending Growth 1 Index of Consumer Sentiment 57.8 Sept 11 Savings Rate (percent of disposable income) Real Investment Spending
The Regional Economic Outlook
 The Regional Economic Outlook Presented by: Mark McMullen, Director of Government Svcs Prepared for: FTA Revenue Estimating Conference September 15, 2008 Recent Economic Performance 2 1 The Job Market
2014 ACEP URGENT CARE POLL RESULTS
 2014 ACEP URGENT CARE POLL RESULTS PREPARED FOR: PREPARED BY: 2014 Marketing General Incorporated 625 North Washington Street, Suite 450 Alexandria, VA 22314 800.644.6646 toll free 703.739.1000 telephone
THE METHODIST CHURCH (U.S.)
") THE METHODIST LIBRARY CONFERENCE JOURNALS COLLECTION PAGE: 1 ALABAMA 1939-58 ALABAMA WEST FLORIDA 1959-1967 ALASKA MISSION 1941, 1949-1967 ATLANTA 1939-1951 BALTIMORE CALIFORNIA ORIENTAL MISSION 1939-1952
THE METHODIST LIBRARY CONFERENCE JOURNALS COLLECTION PAGE: 1 ALABAMA 1939-58 ALABAMA WEST FLORIDA 1959-1967 ALASKA MISSION 1941, 1949-1967 ATLANTA 1939-1951 BALTIMORE CALIFORNIA ORIENTAL MISSION 1939-1952
YOUTH MENTAL HEALTH IS WORSENING AND ACCESS TO CARE IS LIMITED THERE IS A SHORTAGE OF PROVIDERS HEALTHCARE REFORM IS HELPING
 2 3 4 MENTAL HEALTH AND SUBSTANCE USE CONDITIONS ARE COMMON MOST AMERICANS LACK ACCESS TO CARE OF AMERICAN ADULTS WITH A MENTAL ILLNESS DID NOT RECEIVE TREATMENT ONE IN FIVE REPORT AN UNMET NEED NEARLY
All Approved Insurance Providers All Risk Management Agency Field Offices All Other Interested Parties
 United States Department of Agriculture Farm Production and Conservation Risk Management Agency Beacon Facility Mail Stop 080 P.O. Box 49205 Kansas City, MO 644-6205, 207 INFORMATIONAL MEMORANDUM: PM-7-06
Table 1 Elementary and Secondary Education. (in millions)
") Revised February 22, 2005 WHERE WOULD THE CUTS BE MADE UNDER THE PRESIDENT S BUDGET? Data Table 1 Elementary and Secondary Education Includes Education for the Disadvantaged, Impact Aid, School Improvement
Revised February 22, 2005 WHERE WOULD THE CUTS BE MADE UNDER THE PRESIDENT S BUDGET? Data Table 1 Elementary and Secondary Education Includes Education for the Disadvantaged, Impact Aid, School Improvement
In the District of Columbia we have also adopted the latest Model business Corporation Act.
 Topic: Question by: : Reinstatement after Admin. Dissolution question Dave Nichols West Virginia Date: March 14, 2014 Manitoba Corporations Canada Alabama Alaska Arizona Arkansas California Colorado Connecticut
STATE ARTS AGENCY GRANT MAKING AND FUNDING
 STATE ARTS AGENCY GRANT MAKING AND FUNDING Each of America's 50 states and six jurisdictions has a government that works to make the cultural, civic, economic and educational benefits of the available
EXHIBIT A. List of Public Entities Participating in FEDES Project
 EXHIBIT A List of Public Entities Participating in FEDES Project Alabama Alabama Department of Economic and Community Affairs Alabama Department of Industrial Relations Alaska Department of Labor and Workforce
NMLS Mortgage Industry Report 2016 Q1 Update
 NMLS Mortgage Industry Report 2016 Q1 Update Released June 10, 2016 Conference of State Bank Supervisors 1129 20 th Street, NW, 9 th Floor Washington, D.C. 20036-4307 NMLS Mortgage Industry Report: 2016Q1
HOPE NOW State Loss Mitigation Data December 2016
 HOPE NOW State Loss Mitigation Data December 2016 Table of Contents Page Definitions 2 Data Overview 3 Table 1 - Delinquencies 4 Table 2 - Foreclosure Starts 7 Table 3 - Foreclosure Sales 8 Table 4 - Repayment
Fiscal Research Center
 January 2016 Georgia s Rankings Among the States: Budget, Taxes and Other Indicators ABOUT THE FISCAL RESEARCH CENTER Established in 1995, the (FRC) provides nonpartisan research, technical assistance
HOPE NOW State Loss Mitigation Data September 2014
 HOPE NOW State Loss Mitigation Data September 2014 Table of Contents Page Definitions 2 Data Overview 3 Table 1 - Delinquencies 4 Table 2 - Foreclosure Starts 7 Table 3 - Foreclosure Sales 8 Table 4 -
F O R E S T R I V E R M A R I N E
 F O R E S T R I V E R M A R I N E Regional Sales Manager - Eric Rose Cell: (574) 361-8673 E-mail: erose@forestriverinc.com Sales Coordinator - Neil Massing (574) 825-8168 Cell: (574) 825-6180 E-mail: nmassing@forestriverinc.com
NMLS Mortgage Industry Report 2017Q2 Update
 NMLS Mortgage Industry Report 2017Q2 Update Released September 18, 2017 Conference of State Bank Supervisors 1129 20 th Street, NW, 9 th Floor Washington, D.C. 20036-4307 NMLS Mortgage Industry Report:
Dashboard. Campaign for Action. Welcome to the Future of Nursing:
 Welcome to the Future of Nursing: Campaign for Action Dashboard About This Dashboard: These graphs and charts show goals by which the Campaign evaluates its efforts to implement recommendations in the
U.S. Army Civilian Personnel Evaluation Agency
 Army Regulation 10 89 Organizations and Functions U.S. Army Civilian Personnel Evaluation Agency Headquarters Department of the Army Washington, DC 15 December 1989 Unclassified SUMMARY of CHANGE AR 10
Fundraising Registration Update 2013
 Fundraising Registration Update 2013 Marc Lee, CFRE, President, Affinity Fundraising Registration February 2013 Handout: www.fundraisingregistration.com/documents/registrationupdate2013.pdf Presenter I
NMLS Mortgage Industry Report 2018Q1 Update
 NMLS Mortgage Industry Report 2018Q1 Update Released July 5, 2018 Conference of State Bank Supervisors 1129 20 th Street, NW, 9 th Floor Washington, D.C. 20036-4307 NMLS Mortgage Industry Report: 2018Q1
NMLS Mortgage Industry Report 2017Q4 Update
 NMLS Mortgage Industry Report 2017Q4 Update Released March 9, 2018 Conference of State Bank Supervisors 1129 20 th Street, NW, 9 th Floor Washington, D.C. 20036-4307 NMLS Mortgage Industry Report: 2017Q4
NURSING HOME STATISTICAL YEARBOOK, 2015
 NURSING HOME STATISTICAL YEARBOOK, 2015 C. MCKEEN COWLES COWLES RESEARCH GROUP Acknowledgments We extend our appreciation to Craig Dickstein of Tamarack Professional Services, LLC for optimizing the SAS
Department of Defense Regional Council for Small Business Education and Advocacy Charter
 Department of Defense Regional Council for Small Business Education and Advocacy Charter Office of Small Business Programs 19 March 2014 1 CHARTER DoD REGIONAL COUNCIL FOR SMALL BUSINESS EDUCATION AND
AMERICAN ASSOCIATION FOR AGRICULTURAL EDUCATION FACULTY SALARIES
 AMERICAN ASSOCIATION FOR AGRICULTURAL EDUCATION 1999-2000 FACULTY SALARIES Contents Page Summary Data for 1999-2000 Faculty FTEs by Region Nine-month appointments (Table 1)...2 Twelve-month appointments
Fiscal Research Center
 January 2017 Georgia s Rankings Among the States: Budget, Taxes and Other Indicators ABOUT THE FISCAL RESEARCH CENTER Established in 1995, the (FRC) provides nonpartisan research, technical assistance
Date: 5/25/2012. To: Chuck Wyatt, DCR, Virginia. From: Christos Siderelis
 1 Date: 5/25/2012 To: Chuck Wyatt, DCR, Virginia From: Christos Siderelis Chuck Wyatt with the DCR in Virginia inquired about the classification of state parks having resort type characteristics and, if
ACEP EMERGENCY DEPARTMENT VIOLENCE POLL RESEARCH RESULTS
 ACEP EMERGENCY DEPARTMENT VIOLENCE POLL RESEARCH RESULTS Prepared For: American College of Emergency Physicians September 2018 2018 Marketing General Incorporated 625 North Washington Street, Suite 450
Pipeline Safety Regulations and the Effects on Operator Qualification Programs. March 28, 2017
 Pipeline Safety Regulations and the Effects on Operator Qualification Programs March 28, 2017 Community Assistance and Technical Services (CATS) Name Change Community Liaison (CL) Effective: January 1,
THE STATE OF GRANTSEEKING FACT SHEET
 1 THE STATE OF GRANTSEEKING FACT SHEET ORG ANIZATIONAL COMPARISO N BY C ENSUS DIV ISION S PRING 2013 The State of Grantseeking Spring 2013 is the sixth semi-annual informal survey of nonprofits conducted
Fiscal Research Center
 January 2018 Georgia s Rankings Among the States: Budget, Taxes and Other Indicators ABOUT THE FISCAL RESEARCH CENTER Established in 1995, the (FRC) provides nonpartisan research, technical assistance
Nielsen ICD-9. Healthcare Data
 Nielsen ICD-9 Healthcare Data Healthcare Utilization Model The Nielsen healthcare utilization model has three primary components: demographic cohort population counts, cohort-specific healthcare utilization
State Authority for Hazardous Materials Transportation
 Appendixes Appendix A State Authority for Hazardous Materials Transportation Hazardous Materials Transportation: Regulatory, Enforcement, and Emergency Response* Alabama E Public Service Commission ER
STATE AGRICULTURAL ORGANIZATIONS SUPPORTING S. 744 AS APPROVED BY THE SENATE AGRICULTURE COMMITTEE
 STATE AGRICULTURAL ORGANIZATIONS SUPPORTING S. 744 AS APPROVED BY THE SENATE AGRICULTURE COMMITTEE ALABAMA ALASKA ARIZONA Alabama Department of Agriculture & Industries* Alabama Poultry & Egg Association