Job Recovery by Pennsylvania County, AESOP Brief. Center for Economic Development. Carnegie Mellon University.
|
|
|
- Jared Underwood
- 5 years ago
- Views:
Transcription
1 Job Recovery by Pennsylvania County, AESOP Brief Center for Economic Development Carnegie Mellon University September 2017 We examine job recovery by county in Pennsylvania since the Great Recession by comparing percent changes in annualized job counts from a baseline of Summary We find by this measure that after a slow start, the economies of the Delaware (Philadelphia) and the Lehigh Valley regions fully recovered the number of jobs they had in 2007, and ended 2016 with the most impressive gains and the most impressive momentum. Also faring well are the counties in and around the Pennsylvania Dutch region, whose economies appeared to lag but follow the Greater Philadelphia region. The smaller economies of the Northern Tier and Southwest Corner (Washington and Greene counties) saw economic booms (largely driven by the Marcellus Shale) that actually substantially exceeded the rates of job growth in the Delaware Valley, but unlike the Philadelphia region, both areas lost momentum by 2016, with the previously gained growth since 2007 largely dissipating. While Allegheny County (Pittsburgh) largely escaped heavy damage from the Great Recession, it struggled to gain traction and grew very slowly, technically exceeding its 2007 benchmark as late as Unlike Philadelphia, its eventual gains were not accompanied by similar growth in neighboring counties, most of which, with the exception of Butler, declined. Because of this, the Pittsburgh region, as we define it here, had yet to recover the number of jobs it had as of 2007 by Out of all the regions we examined, the Pennsylvania Wilds and Allegheny West (Indiana, Cambria, Somerset) appeared to fare the worst, and were a long way from recovery as of Approach This analysis uses data from the Quarterly Census of Employment and Wages, which relies on administrative records from state unemployment insurance programs to count jobs and wages at the state and county level. QCEW is said to cover 97% of jobs in the U.S., but excludes employment in a few industries and types organizations. Importantly, nonemployer jobs (i.e. sole proprietors, independent contractors, and other self-employed persons) are not included in the data, but most full and part-time jobs that involve a paycheck are. Simple job counts are an admittedly crude way to assess the recovery or vitality of a local economy, and not the only way to do so. Other commonly used metrics include the unemployment rate, the labor force participation rate, the rate or number of discouraged workers, job turnover, real wage growth, working age population growth, industrial or occupational mix, hours worked/part-time job rates, and the number and growth in good jobs (variously defined). All of these measures matter. However, it seems hard to argue with the idea that steady losses of jobs, or stagnant job numbers, are a bad thing for a county, while steady job growth is a good sign. Therefore, with this in mind, we were curious to see the extent to which Pennsylvania counties had recovered their annualized job counts since All percent changes here are from that baseline, rather than from year-to-year. Even as late as 2016, at least by this measure, many counties in the Commonwealth had yet to recover the level of jobs they had in 2007 by the end of 2016, although some were on their way. Figure are presented by individual county, and by regions we defined for the analysis. The commentary that follows is based on a series of maps and charts produced using Tableau visualization software. These visualizations, along with the data that was used to produce them, are available here. Selected caveats to the analysis are discussed at the end of the report.

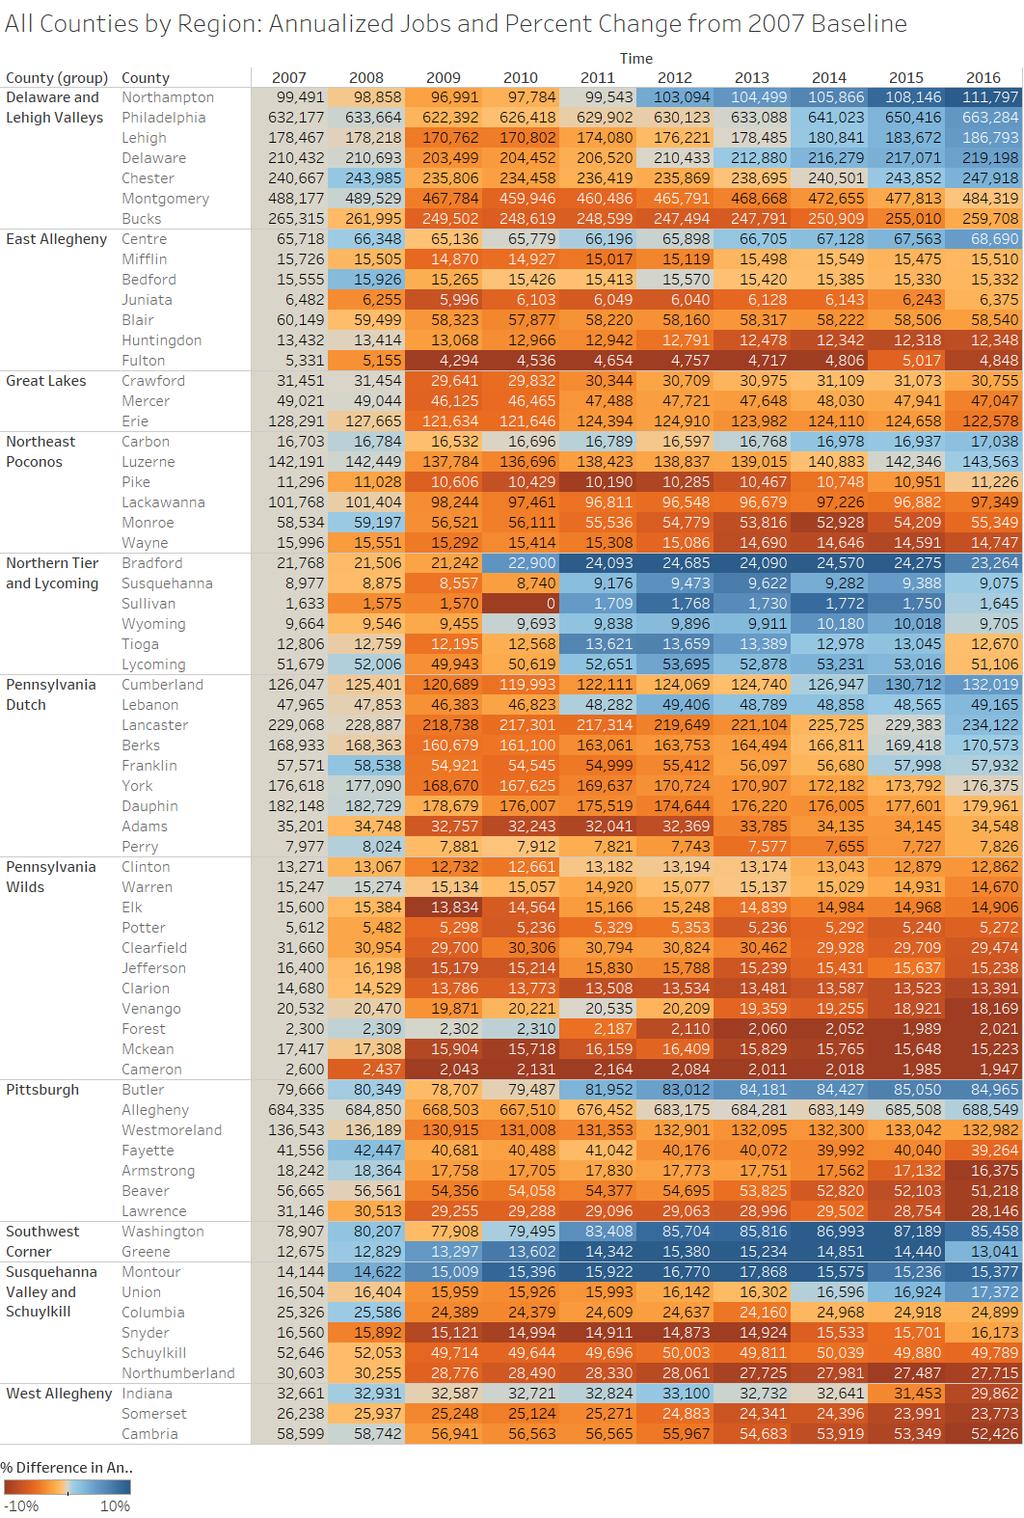
2 Regional Definitions To put trends in geographical context we grouped counties into eleven regions. We borrowed labels from other official and informal regional definitions, but took liberties by adding or subtracting a county here or there. Our reasoning for these tweaks was that, at least for the period examined, certain counties seemed to move or belong together. This process was both an art and a science, and other defensible groupings are possible. While our narrative is organized around these regions, results are still shown at the county level, and the reader can use construct their own definitions if desired. The Delaware Valley represents the five county metropolitan region led by Philadelphia city/county s urban core, and includes Delaware, Chester, Montgomery, and Bucks. Nearby are the Lehigh Valley counties of Lehigh and Northampton, home of Allentown and Bethlehem PA. We included both in a single region for this report. After Philadelphia, the next largest city in Pennsylvania is Pittsburgh, located in Allegheny County. Official definitions of the Pittsburgh metropolitan region commonly include Westmoreland, Washington, Fayette, Beaver, Butler, and Armstrong Counties. More expansive definitions include Indiana, Greene, and Lawrence. For this analysis, we add 2
3 Lawrence (home of New Castle PA) but separate out Washington and Greene into a sub-region we call the Southwest Corner. The latter is anchored by Washington PA. We also assign Indiana, along with Somerset and Cambria (home of Johnstown PA), to a sub-region we call West Allegheny. Next is the Great Lake region, anchored by Erie PA in Erie County, and including Mercer and Crawford counties. The Pennsylvania Wilds comprises the largest region in land area, and the most sparsely populated. In fact most (97%+) of the land in these counties is classified as rural by the Census, and large portions of the population live in very small towns or rural areas as opposed to urbanized areas (towns and small cities over 50K+). The Allegheny National Forest and several state forests are located in this expanse. Our Northern Tier region includes five counties typically included under this label, plus Lycoming County, home of Williamsport PA. The Allegheny East region includes Bedford (Bedford PA), Blair (Altoona PA), and Centre (State College PA, the home of Penn State). Following the mountains leads to the Susquehanna Valley region, to which we add Schuylkill County. Towns of note here include Lewisburg, Bloomsburg, Sunbury, and Pottsville PA. The Northeast Poconos region is anchored by the relatively urbanized counties of Lackawanna and Luzerne. The former is the home of Scranton PA, which is part of a relatively urbanized area that includes Wilkes-Barre in the latter. Next comes Monroe County, home of East Stroudsburg PA, and the relatively rural Wayne and Pike counties on the New York/New Jersey border. Finally, the Pennsylvania Dutch region includes by Dauphin County, home of the state capitol Harrisburg PA. The region also contains the towns and small cities of Gettysburg, York, Chambersburg, Reading, Lebanon, and Lancaster PA. The distribution of Pennsylvania s population is more complex than what James Carville s famous quote implies, but it is true that the Pittsburgh and Philadelphia regions are the main population centers. The map below shows the relative population of each county by the last decennial census. The largest bubble here is Philadelphia, at over 1.5M residents, followed by Pittsburgh s Allegheny County at 1.2M. Together these counties comprised 22% of the Commonwealth s population of 12.7M in The remaining bubbles are proportionately smaller based on population size. Color indicates the percentage of the county population that lives in a Census defined urbanized area (city, town, or congeries of towns) of 50,000 residents or more, with dark blue indicating a 100% urbanized population, and dark green indicating that 100% of the population either live in smaller towns or rural areas. 1 By this government classification, all of the Delaware and Lehigh Valley regions are urbanized, along with large areas of the Pennsylvania Dutch region. Most, but not as many of the residents in the Pittsburgh region live in urbanized areas as well. Erie, Luzerne, and Lackawanna counties are also relatively urbanized. For the rest of the counties, most residents either live rurally or in smaller towns. 1 The official definition of an urbanized area is a settlement or group of closely linked settlements with at least 50,000 people and a population density or 500 persons per square mile. It is a loose fitting, imperfect label, and encompasses territories from urban cores to nearby (but linked) small cities and towns. 3


4 The regions also come in different sizes. The largest region by 2010 population was the Delaware/Lehigh Valley, followed by the Pennsylvania Dutch and Pittsburgh regions. The smallest traditional region is the Pennsylvania Wilds, followed by the three sub-regions of Allegheny West, the Northern Tier, and Southwest Corner. 4
5 Regional Recovery from Recession Based on the regions above, the trends below show the percent difference in job counts from each region s 2007 baseline. All regions fall into the pit of the recession in 2009, but both the Northern Tier and Southwest corner regions quickly recovered and surged thereafter, until faltering in The Delaware and Lehigh Valley region, led by Philadelphia and representing the largest number of jobs out of all regions, recovered slowly at first, but steadily built momentum such that as of 2016, it was still driving in the right direction. The Pennsylvania Dutch region followed a similar but lagged path. While Pittsburgh s Allegheny County did recover, the region around it (as defined here) was not able to regain the number of jobs it hand in 2007 by The Allegheny East region fared worse than the Pittsburgh region, but looked to be on track to recover its baseline by The Northeast Poconos fared worse still, but does appear to be slowly zeroing in on recovery. The same cannot be said for the Great Lakes counties, which faltered in The Susquehanna region trailed the Great Lakes region for much the study period, but at least bumped up in The Pennsylvania Wilds and Allegheny West regions never recovered and were still losing ground as of

6 County Recovery from the Recession The maps below display Pennsylvania by county, and shows the percent change in annualized job counts against a 2007 baseline. This is shown in green for counties that exceeded the baseline for any given year, and red for those that fell below it. Yellow indicates zero or very little change from baseline, or a return to it. The data here is job based, not person based, and locates jobs by workplace, not residence of worker. 2 Few counties saw anything but modest negative declines from 2007 to 2008, and a few even saw modest growth. This includes the Southwest Corner counties and Fayette in the west of the state, and Monroe and Chester in the east. Neither Allegheny or Philadelphia counties saw discernible growth over 2007 and growth in their regions, where present, seemed anemic. Three areas of the state seemed to fare worse: a group five rural counties in the Pennsylvania Wilds, led by Cameron County, six rural counties across the Northern Tier and Northern Poconos regions, and five counties in the Susquehanna and Allegheny East regions, led by Snyder and Juniata. Outside of Fulton, the remaining counties in the Allegheny West, Allegheny East and Pennsylvania Dutch regions seemed to be relatively stable compared to The same can be said for all three counties of the Great Lakes region and for the core three counties of the Northeast Poconos region. Percent Change in Annualized Employment Job losses in a county will impact in-commuters from other counties. We do not attempt to estimate or measure such effects here. 6

7 Percent Change in Annualized Employment The year 2009 saw the pit of the Great Recession, and its end technically, at least according to the National Bureau of Economic Research. 3 Over 2009, almost every county fell or remained below the number of jobs it had in 2007, but certain counties suffered more than others did. The Pennsylvania Wilds lost large numbers of jobs (relatively to its 2007 benchmark) in almost every county but Warren and Forest, the smallest Pennsylvania county by population. McKeon, Elk, and Cameron counties took the worst of it. The next most impacted regions appeared to be the Susquehanna and Great Lakes regions, along with large swathes of the Pennsylvania Dutch region. Across these regions Fulton, Snyder, Adams, Crawford, Mercer, Lawrence, Juniata, Northumberland, and Schuylkill all fell more than 5% under their 2007 benchmarks by 2009, with the small and rural Fulton County falling to 19% under. Allegheny and Philadelphia counties also sank, albeit modestly, and relatively speaking, both the Delaware Valley/Lehigh Valley and Pittsburgh regions fared better than much of the state. For these regions, the counties that did not fare as well included Lawrence and Bucks. Scranton and most of the counties of the Northeast Poconos region also fared reasonably well, although this area did not fare as well as the Pittsburgh or Delaware/Lehigh Valley regions. The Allegheny West region, and much of the Allegheny East region up until Mifflin/Snyder Counties seemed to be in a similar boat, with modest job losses. The Pennsylvania Dutch region was somewhere between, in that five of its counties were 5% below their 2007 baselines. 3 See 7

8 Greene County in the Southwest Corner, and Montour County were the only counties to see growth over 2007 this year. Percent Change in Annualized Employment By 2010, the Great Recession was technically receding, although unemployment remained high for large swathes of the country. By the end of the year Philadelphia County appeared to rebound a bit, and neared it 2007 benchmark, but other counties in the Delaware and Lehigh Valley still seemed to be slowly sinking or stuck, with the exception of Northampton. In the Pittsburgh region, Allegheny, Armstrong, and Westmoreland counties appeared unmoved, while Beaver declined. Butler, on the other hand, nearly recovered. This result was likely driven by the relocation of Westinghouse s headquarters from Monroeville PA (in Allegheny County) to Cranberry PA, an even which will drive growth in Butler for several years. 4 In the Southwest Corner, Washington County also nearly recovered, and Greene County continued to grow. Matters also improved in the Northern Tier, led by Bradford County. Growth in both of these regions is just beginning, and driven the Marcellus Shale gas play. The Pennsylvania Wilds region continued to struggle this year, as did the area from Mifflin to Schuylkill (excepting Montour) in the Susquehanna region. The rest of the Allegheny East seemed to be mixed bag, the Allegheny West seems unchanged, and the Great Lakes region improved slightly. 4 See 8

9 Meanwhile, the Northeast Poconos appeared to be tipping in the wrong direction, including Luzerne and Lackawanna, and the Pennsylvania Dutch region seemed mostly stuck at 5% below benchmark, save for Adams, which sunk a little further. Percent Change in Annualized Employment By 2011, employment began to go in different directions for different parts of the state. The biggest gains in jobs were achieved by the Northern Tier and Southwest Corner regions. Both are mainly shale boom related, although by now a modest uptick in coal employment is in play. 5 Philadelphia actually achieved recovery in 2011, as did Northampton. Delaware, Chester and Lehigh counties all improved, but Montgomery and Bucks are still struggling. The Pittsburgh region mostly drove slowly forward this year. Allegheny inched forward again, and ended the year a percentage point away from recovery. Butler continued to see growth, likely still driven by the Westinghouse relocation. Fayette, Armstrong, and Beaver also notched improvements, but Lawrence ticked down a percentage point. The Great Lakes region was still in the orange but saw gains across the board. The Pennsylvania Wilds counties did a little better as group this year, but most were still under 2007 levels, including Forest and Warren Counties. Clarion in particular slid to a low point this year, and this was likely led by the 2010 closure of a glass container plant, a major private employer for this mostly rural county. 6 5 See for example, Mining and Employment Trends Across Pennsylvania, Chris Briem, Pittsburgh Economic Quarterly, University Center for Social and Urban Research, March Link:

10 In the Allegheny West, Indiana, Cambria, and Somerset were essentially unchanged from In the Pennsylvania Dutch and Allegheny East regions, it was still a mixed bag with both gainers and losers. Adams, Fulton, and Juniata counties were still in unfavorable territory. Job counts in the Northeast Poconos also either stagnated or ticked down for every county save Luzerne and Carbon. The Susquehanna region saw gains in Union, Montour, and Columbia, but Snyder ticked down. Northumberland seemed unchanged, but remained deep red. Indiana, Carbon, Centre, were still stable (yellow) three years since the recession began. While those three never fell, newly yellow counties here that recovered or nearly recovered their 2007 job levels included Venango, Lebanon, and Northampton in the Lehigh Valley. However, Fulton, Adams, Snyder, and Cameron have fallen and appear to be struggling to get back up. The small rural Pike also joined the deep red club in Percent Change in Annualized Employment was a better year for much of the state. The most noticeable change was the continuing burst of job growth in the Northern Tier and Southwest Corner. By now the Pittsburgh region appeared to be on the mend; Allegheny County effectively recovered the ground it lost since 2007, Butler kept growing, and Beaver and Westmoreland saw some modest traction. Fayette and Armstrong declined, however, and Lawrence seemed to be stuck at 7% under its 2007 benchmark. The Delaware/Lehigh Valley region fared better: Philadelphia and Delaware counties recovered, Northampton moved forward, and Chester, Montgomery, and Lehigh all notched gains. Only Bucks moved the wrong way. This year every Pennsylvania Dutch country notched small gains (some undiscernible when rounded to the nearest percent) with the exception of small and rural Perry County. 10
 counties of Cameron and Forest slipped significantly, as did Venango, but the rest either held steady or notched small gains.")
11 The Pennsylvania Wilds region seemed to be a wash. The very small (in population) counties of Cameron and Forest slipped significantly, as did Venango, but the rest either held steady or notched small gains. Clarion did not slip, but nor did it gain traction, and remained 8% below its 2007 benchmark. In the Allegheny West, Indiana grew over its 2007 benchmark, but Cambria and Somerset counties notched losses. The Great Lakes region was largely unchanged: neither in the red nor zeroing in on recovery. The counties of the Allegheny East region either inched forward (Bedford, Fulton, Mifflin) or held steady this year (Blair, Centre, Juniata), with only rural Huntington slipping. In the Susquehanna Valley region, Snyder, Northumberland, and Schuylkill were still in the red, although only Northumberland slipped further. Columbia was unchanged, the small county of Union inched forward, and Montour once again notched a significant gain. Finally, in the Northeast Poconos, Luzerne inched forward, Monroe inched back, and Lackawanna was unchanged. Rural Wayne slipped again, while Pike was still deep red. Percent Change in Annualized Employment This year brought the first signs of trouble to boomtown, as almost every Northern Tier county retreated save for Susquehanna. On the other hand, the gains the Southwest Corner made since the recession seem locked in for another year. In the Pittsburgh region, Allegheny County was still growing, but slowly, and still had about as many jobs as it did in 2007, despite the loss of Westinghouse facility to Butler. Lawrence, Westmoreland and Armstrong were unchanged, but nor did they appear to be on track to recover. Nor did Fayette and Beaver, which slip again. 11
12 In nearby Allegheny West, Indiana s recovery dissipated, and Cambria and Somerset saw significant declines into deep orange territory (-7% below baseline). The Great Lakes, although still without traction, held steady. On the other side of the state, Philadelphia grew only slightly, but the rest of the counties in the Delaware/Lehigh Valley were coming along save Bucks, which seemed stuck at 7% less than 2007 levels. Most of the Commonwealth s job growth now emanated from this region. The Pennsylvania Dutch region was also doing well, with five counties notching 1% gains, and Adams moving from 8 to 4% under its 2007 benchmark. Only Lebanon appeared to slip a point. The Pennsylvania Wilds region slid backwards as a whole. Nine counties here saw declines this year, with most falling by more than three percentage points further away from their 2007 benchmarks. Clarion was still 8% below baseline, and only Warren inched forward. The Allegheny East region is a mixed bag at the county level, but as whole seemed to be in better shape. The lightly populated counties of Huntington and (once again) Fulton slipped, as did Bedford County. Centre, Mifflin, and Juniata, notched significant gains, while Blair held steady. In the Susquehanna region, Schuylkill was unchanged at 5% under benchmark, while Snyder was still 10% under the same. Montour again surged, this time to 26% of its 2007 benchmark, and Union is neared recovery. Only Columbia actually slipped. In the Northeast Poconos, the core counties of Luzerne and Lackawanna both gained some ground, with Luzerne 1% away from its 2007 benchmark. While Pike moved out of the red column, both Monroe and Wayne counties passed into it. 12

13 Percent Change in Annualized Employment In 2014, the Northern Tier no longer grew as one. The largest county here, Lycoming, notched up a point, while Bradford, Wyoming, and Sullivan grew a little faster. Tioga and Susquehanna saw significant declines. In the Southwest Corner, Greene County also ticked down, but the much larger Washington County kept growing. In the Pittsburgh region, Allegheny County remained stuck in neutral, as did Westmoreland, Fayette and Butler. The number of jobs in Beaver and Armstrong counties both ticked down. Only Lawrence actually seemed to gain traction. The counties of the Allegheny West also seemed to be in neutral, except for Cambria, which ticked down again. All three of the Great Lakes counties managed modest gains this year. About half of the Pennsylvania Wild counties notched 1% gains this year, with the rest declining by the same or not moving at all. In 2014, the area was still in unfavorable shape compared to It continued to get sunnier in Philadelphia, and every county in the Delaware Valley/Lehigh Region grew, including Bucks. By 2014, five out of seven of these counties had either equaled or surpassed the number of jobs they started with in In Pennsylvania Dutch country, trends were also positive, even for Adams County, now only three points under its baseline. Only Dauphin inched down a bit. The Allegheny East region did not grow, but held steady, with movement limited to a bump up for Fulton and another slip for Huntington. The Susquehanna region did a little better, with the needle moving in the right direction for Snyder, Union, and Columbia. On the other hand, Montour appeared to fall to earth, while Northumberland and Schuylkill seem unmoved by the growth of their neighbors. 13
14 In the Northeast Poconos Luzerne and Lackawanna continued to close in on recovery. Carbon, having never really fell under its 2007 benchmark by a significant degree, surpassed the number of jobs it had in 2007 for the first time this year. Monroe deteriorated further into the orange zone, however. Percent Change in Annualized Employment One year out from the election, the Northern Tier was on balance, stable. Lycoming held steady while Tioga and Bradford inched forward, but Wyoming, Sullivan, and Susquehanna slipped back. In the Southwest Corner, Washington was fixed, while Greene ticked down again. In the Pittsburgh region, Allegheny, Washington, Westmoreland, and Fayette were still in neutral, while Butler inched up again. However, Lawrence, Beaver and Armstrong deteriorated either significantly or to a significant degree. The news was no better in Allegheny West, where both Cambria and Somerset deteriorated further, now joined by Indiana, falling 4% in one year. The Great Lakes counties, at least, were largely unchanged. Every county in the Pennsylvania Wilds declined again, with the exception of Jefferson and Elk counties. Meanwhile, in and around Philadelphia and the Lehigh Valley, job growth took flight in every county. Philadelphia was now over 2% of its 2007 benchmark (a small percentage, but over a large base) and Northampton, actually comparable to Lackawanna in population, now had 9% more jobs than it started with in Likewise, the Pennsylvania Dutch region grew (more slowly) on every front save Lebanon and Adams counties. In the Allegheny East region, things looked static, with only Centre and Fulton County showing any appreciable growth, and just one noticeable decline (Mifflin). Fulton finally left the red zone (temporarily). In the Susquehanna region, Snyder and Union both made gains, but Montour, Northumberland, and Columbia ticked down, while Schuylkill remained fixed. 14

15 Finally, in the Northeast Poconos, Luzerne, Carbon, and Pike notched significant gains, while Monroe and Wayne fell. Lackawanna, home of Scranton, was still stuck underwater at 5% below its 2007 benchmark. Percent Change in Annualized Employment It is an election year! For many political observers, Donald Trump s victory in Pennsylvania came as a surprise. Take a long look at the map. Had the information been available at the time, would you have been surprised? In 2016 employment in the Northern Tier fell away, such that every county save Bradford (which also fell) was effectively back to square one. In the Southwest Corner, Washington and Greene counties also declined. This is again surely shale related, but employment in the coal-mining sector also dipped at this time. In the Pittsburgh region, Allegheny County finally achieved a 1% increase over its 2007 baseline. The gains did not appear to benefit its neighbors. Butler and Westmoreland held steady, but Lawrence, Beaver, Armstrong, and Fayette all declined significantly. Things got worse in the Allegheny West region, with Cambria, Somerset, and now Indiana all in deep red territory. The Great Lakes region was still orange rather than red, but all three counties ticked down by a percentage point or more. In 2016, seven counties in the Pennsylvania Wilds slipped again, led by significant drops for Venango and McKean. Only Elk, Potter, Forest, and Clinton avoided further losses. The news was not all bad. Crossing over to Philadelphia, the economies of the Delaware and Lehigh Valley were now in full swing, with even Montgomery and Bucks zeroing in on recovery. Here at the end of the study period, not every county in the Pennsylvania Dutch period had actually recovered, but all were moving in the right direction, with Cumberland leading the way. At this point even Adams, once deep red, seemed on the verge of recovery. Moving to the Allegheny East, Bedford and Blair seemed to be immovable objects, and Huntington was also unchanged. Fulton slipped again, but Mifflin, Juniata, and especially Centre county registered growth. 15
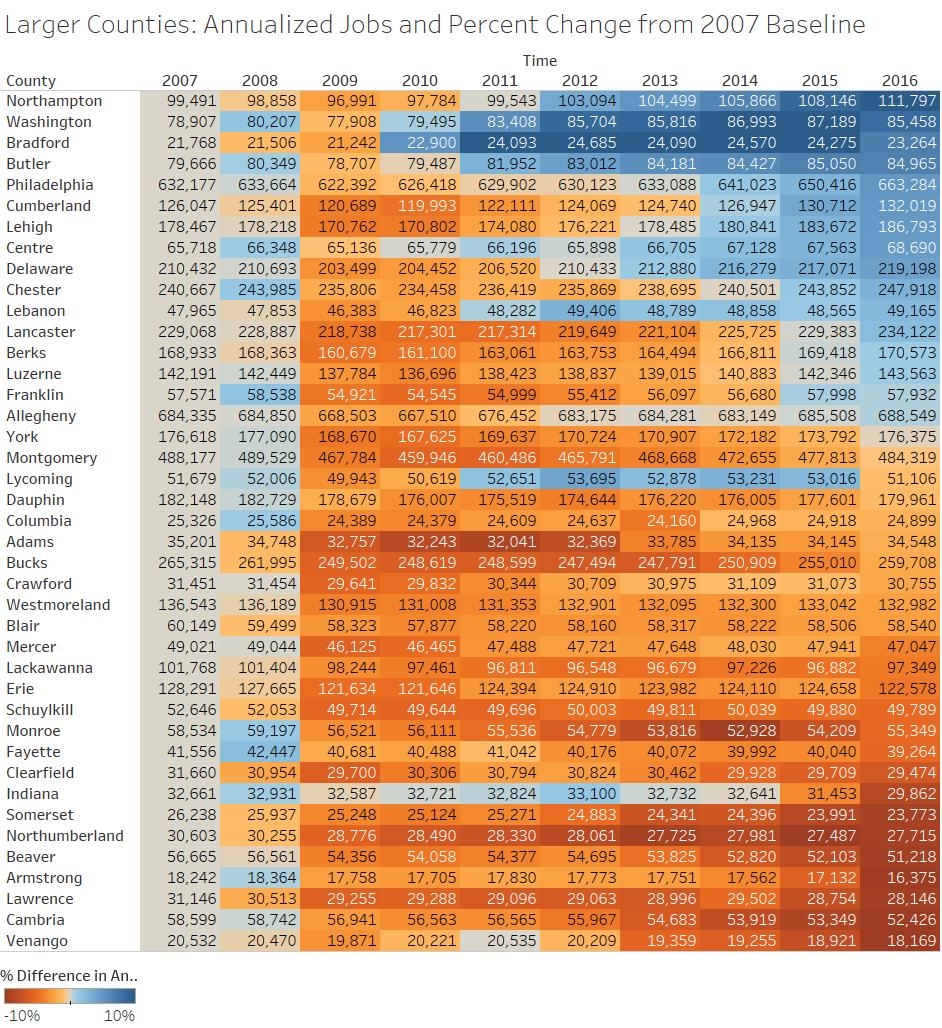
16 In the Susquehanna region, Northumberland and Montour grew a little, while Snyder and Union grew a little more. Columbia and once again Schuylkill were basically unchanged. For what it is worth, in the Northeast Poconos, every county saw a 1 or 2 percentage point gain. Luzerne ended the period in recovery, but Lackawanna was still 4 points under its 2007 benchmark. Paths In or Away from Recovery for Larger Counties Here we group counties according to two factors: whether they appeared to be significantly impacted by the recession, and whether or not they recovered. We define significant impact as a 5% or more decline from baseline jobs for any year from This is an arbitrary threshold but reasonable indicator of economic disruption. Recovery is defined as regaining the number of jobs a county had in We limit our analysis to larger counties that had at least 18,000 jobs in We present the results here without comment. 16
17 17
18 18
19 19
20 Of these counties, York just brushed the recovery line in 2016, while for the same year Lycoming actually fell under its 2007 benchmark. The next two tables show actual job counts, shaded by baseline recovery, for larger and smaller counties. 20
21 21

22 Sullivan County shows a zero for 2010, however, this due to suppression in the QCEW program and can be ignored. 22
23 23
24 Caveats Annualized job counts are compelling in their simplicity as a measure of economic growth or decline, but the measure does have blind spots. QCEW data are quarterly, and by using a yearly average, any seasonality or other quarter to quarter movement is smoothed out. This masks, for example, the fact that some economies may be more or less stable quarter to quarter due to seasonal effects than others, a situation invisible to an annualized job count. Job counts, annualized or quarterly, reflect net job gains or losses from period to period, and do not take into account who gains or loses the job. Technically, if a county begins the year with a 100 jobs, but ten workers lose their job and ten people who were previously unemployed gain a job (whether the positions the other ten workers lost, or ten entirely new positions) in the same period, the county will still end the year with 100 jobs. The extent of job turnover or churn is not discernable from the measure. Related to the above, the extent to which good paying jobs with benefits are replaced by minimum wage jobs, or vice versa, is not assessed here. While that distinction is very important and deserves attention, we feel job counts are still useful as a first look barometer of economic recovery. Simple job counts do not indicate the extent to which all persons actively looking for work can find it. This is measured by the unemployment rate. Two counties with the same number of jobs may still have different unemployment rates, or labor participation rates and again, that distinction is important and worth examining. The Local Area Unemployment Statistics program is probably the best means to assess unemployment rates at the county level. The LAUS has something of an advantage over the QCEW in assessing county economic health, in that it measures the employment of county residents, rather than jobs located in the county. However, the program relies on sampling, and estimates for small counties are often unreliable or unavailable. Because of the design of the program, which uses estimates of commuter patterns to estimate live-work patterns, LAUS estimates are subject to multiple sources of error, along with methodological breaks in the data that make it less useful for comparing estimates over longer spans of time. 7 This analysis completely ignores the composition of each county s industrial base and how they changed in the aftermath of the recession. While this is traditionally included in any look at a regional economy, we opted to ignore it for simplicity s sake. We assume that any reduction in base industries will naturally be shortly accompanied by a reduction in non-base industries, and any growth in the base will likewise spur growth in the local supply chain along with businesses that serve the households of workers in those industries. However that may be, the bottom line is that if a county loses 10% of its jobs, that s certainly bad, and if it gains 10% back, that s probably better, if not necessarily equivalent, depending on the compensation and attractiveness of those jobs. Finally, the QCEW dataset does not account for the self-employed. Self-employment surged across the country as laid off and young workers tried to make ends meet in lieu of full-time jobs. As noted by the CED in a recent report, no sector of self-employment grew faster in PA in recent years than driving for a ridesharing service such as Uber or Lyft. 8 However, self-employment remains a small fraction of total employment in the Commonwealth, and so we did not attempt to account for here, despite the fact that such work is likely more important for some Pennsylvania counties than others. 7 See 8 See 24
25 Acknowledgements This report was made possible in part by the hard work of CED Research Assistant Felix Tettey, MSPPM-DC 18. About the Center for Economic Development The Center for Economic Development is affiliated with the Heinz College of Information Systems and Public Policy at Carnegie Mellon University. Established in 1968 and renamed in 1992 in honor of the late U.S. Senator from Pennsylvania, Heinz College improves the ability of the public, private and nonprofit sectors to address important problems and issues facing society. The College is home to two internationally recognized graduate-level institutions at Carnegie Mellon University: the School of Information Systems and Management and the School of Public Policy and Management. This unique colocation combined with its expertise in analytics set Heinz College apart in the areas of cybersecurity, health care, the future of work, smart cities, and arts & entertainment. About AESOP The Annual Economic and Social Observatory of Pennsylvania was conceived in recognition of the fact that the CED s research could and should extend beyond the Allegheny County line. AESOP explores the local economic experience of the Commonwealth systematically by producing analysis and visualizations of economic and social indicators, patterns, and trends on a county basis for all of Pennsylvania, including how county economies grew or grew apart. It is our hope that AESOP will shed more and more even light on local economic outcomes; and increase our understanding of the relationship between those outcomes and recent political winds. Finally, we hope AESOP will also provide a natural platform for assessing how the Commonwealth s counties fare moving forward. To find out more about AESOP contact Greg Lagana at glagana@andrew.cmu.edu. 25
Table A-4 Population by County: Pennsylvania, 1990 and 1999
 Table A-4 Population by County: Pennsylvania, 1990 and 1999 1999 1990 Percent 1999 1990 Percent Estimated Enumerated Change Estimated Enumerated Change County Population Population 1990-1999 County Population
INTRODUCTION nonprofit organizations are also a major force in the state s economy
 INTRODUCTION Nonprofit organizations contribute to the quality of life for all Pennsylvania citizens through the health care, education, job training, youth development, nursing home care, arts, culture,
Pennsylvania Department of Health - Health Status Indicators - Page 18
 Summary of Percent of Children by Age Below Poverty Level, 1997 Related Children All Children
Qualified Provider Assurances: How Pennsylvania Reports on the Quality of Home and Community Based Service Providers to CMS
 Qualified Provider Assurances: How Pennsylvania Reports on the Quality of Home and Community Based Service Providers to CMS Session Objectives Review the Qualified Provider Assurance, Sub-Assurances, and
Standard Penn State Poll Demographic Questions/Recodes Included in the Per Question Cost
 Before we begin, I need to make sure that you live in Pennsylvania. What county do you live in? Adams... 1 Allegheny... 2 Armstrong... 3 Beaver... 4 Bedford... 5 Berks... 6 Blair... 7 Bradford... 8 Bucks...
Domestic Violence Services Subcontractors
 Domestic Violence Services Subcontractors Adams County Survivors, Inc. Shelter; counseling/advocacy; P.O. Box 3572 Gettysburg, Pennsylvania 17325 717-334-0589 (Office) services; transitional housing 800-787-8106
CCIS of Erie County 155 West 8 th Street, Suite 316 Erie, Pennsylvania Crawford Mercer. Beaver Washington
 Service Area Grantee Counties in Service Area Name and Main Office Address of CCIS Main Office Phone Number 1 Erie County Department of Human Services Erie CCIS of Erie County 155 West 8 th Street, Suite
Emergency Medical Services System
 Emergency Medical Services System MISSION STATEMENT To coordinate, develop, improve and maintain a comprehensive and dynamic emergency medical services system to prevent and reduce premature death and
38 Unique Healthcare Organizations. Tioga. Crawford Wayne. Lycoming. Clinton. Union. Snyder. Juniata Perry. Huntingdon. Franklin.
 About KeyHIE 38 Unique Healthcare Organizations Erie Warren McKean Potter Tioga Bradford Susquehanna Crawford Wayne Mercer Venango Clarion Forest Jefferson Elk Cameron Clinton Lycoming Sullivan Columbia
Dual Diagnosis Treatment Team (DDTT)
") Dual Diagnosis Treatment Team (DDTT) One Individual at a Time The Dual Diagnosis Treatment Team Overcoming Barriers through Partnerships: Individual Case Studies Objectives Recognize system barriers which
Dual Diagnosis Treatment Team (DDTT) One Individual at a Time The Dual Diagnosis Treatment Team Overcoming Barriers through Partnerships: Individual Case Studies Objectives Recognize system barriers which
Community Based Organizations- Pennsylvania
 Community Based Organizations- Pennsylvania CHILDREN AND FAMILY Department of Public Welfare, Office of Child Development and Early Learning P: 717-346-9320 Harrisburg, PA Website: www.dpw.state.pa.us/servicesprogr
Alternative payment model to meet the needs of stakeholders in a community & school-based behavioral health service
 Alternative payment model to meet the needs of stakeholders in a community & school-based behavioral health service September 30, 2016 1:55-2:55 PM Learning Objectives Differentiate among payment models
Central Pennsylvania Workforce Development Area Commuting Patterns
 Central Pennsylvania Workforce Development Area Commuting Patterns 2013-2015 Centre, Clinton, Columbia, Lycoming, Mifflin, Montour, Northumberland, Snyder, and Union Counties Introduction The Commuting
The PAMAP Program Ortho and LiDAR GIS-T 2008 Houston, TX Special thanks for to Helen Delano & Chris Markel, BAE Systems
 The PAMAP Program Ortho and LiDAR GIS-T 2008 Houston, TX Special thanks for to Helen Delano & Chris Markel, BAE Systems 0 Agenda PA Map Program Ortho-photography LiDAR (Light Detection and Ranging) Cool
Construction Update Pennsylvania Rapid Bridge Replacement Project Issue 3: Spring 2016
 Construction Update Pennsylvania Rapid Bridge Replacement Project Issue 3: Spring 2016 BEFORE JV 556 SR2013, Slate Creek, Westmoreland Co. AFTER DURING CONSTRUCTION Over 200 Bridges to be Replaced Across
Benefits and Services for Veterans and Their Beneficiaries in Pennsylvania
 OFFICE OF THE DEPUTY ADJUTANT GENERAL FOR VETERANS AFFAIRS Main Office Department of Military and Veterans Affairs Building S-O-47, Fort Indiantown Gap Annville, PA 17003-5002 Phone: (717) 861-8910 Fax:
SEDA Council of Governments. Harrisburg
 NORTH CENTRAL PENNSYLVANIA RURAL PLANNING ORGANIZATION Amy Kessler Community Development/Regional Planning Director A brief overview of rural transportation planning in Pennsylvania Albany, NY June 4,
RAPID BRIDGE REPLACEMENT PROJECT CONSTRUCTION UPDATE: SPRING 2018
 RAPID BRIDGE REPLACEMENT PROJECT CONSTRUCTION UPDATE: SPRING 2018 SPRING 2018 CONSTRUCTION UPDATE The 2017 construction season has concluded another successful year of the Pennsylvania Department of Transportation
Lehigh/Capital Children NCSO Children NCCO. Follow-up after non-hospital D&A Rehab
 Pennsylvania HealthChoices Behavioral Health Quarterly Monitoring Report: Third Quarter 2009 INTRODUCTION The Pennsylvania HealthChoices Behavioral Health Quarterly Monitoring Report: Third Quarter 2009
Board of Commissioners, Pennsylvania Game Commission
 Board of Commissioners, Pennsylvania Game Commission Ronald Weaner President Phone: (717) 357-7874 E-Mail pgc6@superpa.net Dist. 6: Adams, Cumberland, Dauphin, Franklin, Juniata, Lancaster, Lebanon, Mifflin,
Connected Care Connected Car Program Connected Care
 Connected Care Program Connected Care Initiative to improve the connection and coordination of care for those with Serious Mental Illness among health plans, PCPs, and behavioral health providers in outpatient,
Pennsylvania s EPIC B.E.S.T. Initiative
 Pennsylvania s EPIC B.E.S.T. Initiative Educating Physicians In their Community Breastfeeding Education Support & Training 1 Pennsylvania Initiation by County Mercer 59.8 Lawrence 54.2 Beaver 56.3 Erie
Pennsylvania. Department of Environmental Protection. Program Guidelines & Application for Assistance
 Pennsylvania Department of Environmental Protection Program Guidelines & Application for Assistance Commonwealth of Pennsylvania Edward G. Rendell, Governor Department of Environmental Protection Kathleen
HMO EPO Network my Direct Blue EPO: Beaver, Butler counties ACA Select
 Posted on NaviNet Plan Central page 3-3-08 MY DIRECT BLUE: HIGHMARK'S ACA PLAN FOR 08 In an increasingly challenging ACA market, Highmark continues to pursue options for keeping health insurance affordable
Background/Strategic Planning
 Pennsylvania Specialty Pharmacy Drug Program Eastern Medicaid Pharmacy Administrators Association Conference November 11, 2008 Terri Cathers, Pharm.D Director of Pharmacy c-tcathers@state.pa.us Suzanne
OFFICE OF DEVELOPMENTAL PROGRAMS BUREAU OF AUTISM SERVICES. Adult Autism Waiver. Supports & Services Directory. September 2017
 OFFICE OF DEVELOPMENTAL PROGRAMS BUREAU OF AUTISM SERVICES Adult Autism Waiver Supports & Services Directory September 2017 This directory provides users with listings of services by region. Contact information
Durable Medical Equipment (DME) Providers
 Providers") Durable Medical Equipment (DME) Providers DME 1st Choice Medical 1-570-271-2525 Columbia, Montour, Northumberland, post-op shoes ABC Home Medical Supply 1-866-897-8588 Urology, ostomy, wound care, incontinence,
Durable Medical Equipment (DME) Providers DME 1st Choice Medical 1-570-271-2525 Columbia, Montour, Northumberland, post-op shoes ABC Home Medical Supply 1-866-897-8588 Urology, ostomy, wound care, incontinence,
Persian Gulf Conflict Veterans Benefit Program Fiscal Year Report PENNSYLVANIA DEPARTMENT OF MILITARY AND VETERANS AFFAIRS
 PENNSYLVANIA DEPARTMENT OF MILITARY AND VETERANS AFFAIRS Major General Wesley E. Craig, The Adjutant General Persian Gulf Conflict Veterans Benefit Program 2012-2013 Fiscal Year Report D E P A R T M E
Utilizing the Public Workforce System to Increase Your Employee Recruitment Pool and Retention. Jesse McCree CEO, SCPa Works September 26, 2017
 Utilizing the Public Workforce System to Increase Your Employee Recruitment Pool and Retention Jesse McCree CEO, SCPa Works September 26, 2017 the context.a crisis is looming for companies in Lancaster
Early Education in Pennsylvania: Community Engagement Groups
 Early Education in Pennsylvania: Community Engagement Groups Pennsylvania s Early Childhood Community Engagement Groups (CEG) build support networks in every county for organizations and individuals interested
COUNTY PROBATION AND PAROLE OFFICERS FIREARM EDUCATION AND TRAINING COMMISSION
 COUNTY PROBATION AND PAROLE OFFICERS FIREARM EDUCATION AND TRAINING COMMISSION ANNUAL REPORT FISCAL YEAR 2012-2013 (July 1, 2012 June 30, 2013) September 19, 2013 Section 5 (6) of the County Probation
Local Lead Agencies 1(800) (610)
 (610)") Local Lead Agencies County Contact Person/Agency Phone/Email Address Adams Amy Hampson Adams/York Housing Specialist (717) 771-9900 aehampson@yorkcountypa.gov Allegheny Chuck Keenan Allegheny County Department
Local Lead Agencies County Contact Person/Agency Phone/Email Address Adams Amy Hampson Adams/York Housing Specialist (717) 771-9900 aehampson@yorkcountypa.gov Allegheny Chuck Keenan Allegheny County Department
Carbis Walker LLP CPAs & Consultants
 November 17, 2010 presented by: Jennifer E. Cidila, CPA, Partner Health Care Services Dionna M. Slagle, CPA, Senior Manager Health Care Services Kelly A. Nord, CPA, Senior Manager Health Care Services
PA Health & Wellness Participant Handbook
 PA Health & Wellness Participant Handbook 1-844-626-6813 TDD/TTY (Hearing Impaired): 1-844-349-8916 PAHealthWellness.com Table of Contents Topic Page Section 1 - Welcome 3 Participant Services 7 Participant
Innovation and Expansion Projects ITQ Contract #
 Innovation and Expansion Projects ITQ Contract #4400013615 Request for Quote (RFQ) 6100035700 Statement of Work Category 10 Project Name: Department: Date: September 2015 Innovation and Expansion Project
Adult Protective Services. 28 th Annual Convention Innovate, Integrate, Motivate
 Adult Protective Services 28 th Annual Convention Innovate, Integrate, Motivate Adult Protective Services The Adult Protective Services (APS) Law (Act 70 of 2010) was enacted to provide protective services
NC MEDICAID PROVIDER ACCESS
 medicaid NC MEDICAID PROVIDER ACCESS Craigan Gray, MD, MBA, JD November 8, 2011 DMA DMA medicaid DISCUSSION TODAY Current North Carolina Provider Infrastructure Impact in 2014 Challenges DMA medicaid NC
HOW THE PROGRAM WORKS Job training that allows Pennsylvania companies and their workers to perform and compete at a higher level
 MILLION MILESTONE In 1999, the WEDnetPA job training program was created and made available to Pennsylvania businesses and employees as a means to keep Pennsylvania companies and in turn, the Commonwealth
CURRENT UNIT MOBILIZATIONS & TOTAL DEPLOYMENTS
 CURRENT UNIT MOBILIZATIONS & TOTAL DEPLOYMENTS PAARNG MDATE MSAD UNIT OPN PAX MISSION Projected Return Date 16JUN12 16JUN12 NATO HQ Team / Sarajevo KFOR 5 NATO HQ Team 16JUN13 02JUL12 05JUL12 PRT9 w/ Lithuania
Active Safety Schools By County for the Web
 County School School Name ADAMS Safety GETTYSBURG/ADAMS COUNTY TECH ALLEGHENY A.W. BEATTIE CAREER ALLEGHENY FORBES ROAD CAREER AND TECHNOLOGY ALLEGHENY ROSEDALE TECHNICAL COLLEGE 1130 OLD HARRISBURG ROAD
Phase II Grower/Processor Applicants
 REGION 1 SOUTHEAST GP18-1001 PHL CanGrow LLC Philadelphia Philadelphia GP18-1002 DocHouse LLC Schuylkill Pottsville GP18-1003 Matrix-PA LLC Chester Avondale GP18-1004 M3C AGRICULTURE, LLC Lancaster Leola
MEET US ON THE ROAD!
 MEET US ON THE ROAD! Interested in learning more about Mansfield University but can t make it to campus right now? Our Admissions Counselors are out on the road at various events throughout the year, and
CHAIRS AND EXECUTIVE DIRECTORS FOR THE LOCAL WORKFORCE INVESTMENT BOARDS
 CHAIRS AND EXECUTIVE DIRECTORS FOR THE LOCAL WORKFORCE INVESTMENT BOARDS LOCAL WORKFORCE INVESTMENT BOARDS BERKS Albert H. Kramer General Manager - Southern PA Frontier Communications 37 Diller Avenue
State Coordinators. Regional and District Coordinators / YLD Zone Chairs REGION 1 - ALLEGHENY (YLD ZONE 12)
") 12-21-01 2002 Mock Trial Coordinators and YLD Zone Chairs: State Coordinators State Co-Chair Jane E. Meyer Dauphin County Courthouse Front & Market Streets Harrisburg, Pa. 17101 717.780.6657 717.780.6451
12-21-01 2002 Mock Trial Coordinators and YLD Zone Chairs: State Coordinators State Co-Chair Jane E. Meyer Dauphin County Courthouse Front & Market Streets Harrisburg, Pa. 17101 717.780.6657 717.780.6451
Active Emission Schools By County for the Web
 County School School Name ALLEGHENY Emissions PETROLEUM RETAILERS & AUTO REPAIR ASSOCIATION ALLEGHENY A.W. BEATTIE CAREER ALLEGHENY COMMUNITY COLLEGE OF ALLEGHENY COUNTY ALLEGHENY FORBES ROAD CAREER AND
2015 Cumberland County Benchmarking Report PER CAPITA ANALYSIS (Based on the 2015 Counties Comprehensive Annual Financial Report
 2015 Cumberland Benchmarking Report PER CAPITA ANALYSIS (Based on the 2015 Counties Comprehensive Annual Financial Report Last Updated November, 2016 Next Update November, 2017 Cumberland & 3rd Counties
Opportunity & Perspective
 Connecting Local Businesses to the Shale Gas Supply Chain, Penn State Marcellus Center (MCOR) & Shale Training and Education Center (ShaleTEC) Photo Courtesy Penn State Marcellus Center Opportunity & Perspective
Pennsylvania Infrastructure Bank
 Pennsylvania Infrastructure Bank 2004 Annual Report Edward G. Rendell, Governor Allen D. Biehler, P.E. Secretary of Transportation 2004 Annual Report December 2004 Dear Pennsylvanian: It is with pleasure
RAPIDBRIDGEREPLACEMENTPROJECT
 RAPIDBRIDGEREPLACEMENTPROJECT CONSTRUCTIONUPDATE: SPRING2017 An Equal Opport unit y Em ployer, Disabilit y/ Vet eran SPRING2017 CONSTRUCTION UPDATE The 2017 construction season is well underway with 70
Adult Protective Services
 Adult Protective Services Adult Protective Services The Adult Protective Services (APS) Law (Act 70 of 2010) was enacted to provide protective services to adults between 18 and 59 years of age who have
PPL FOUNDATION GRANT INFORMATION
 PPL FOUNDATION GRANT INFORMATION Empowering Communities Table of Contents About Us... 1 Focus Areas... 2 Who Can Apply for a Grant... 2 Grant Descriptions... 3 Annual Timeline... 4 Pennsylvania Counties
Pennsylvania Partners in the Arts (PPA) Project Stream APPLICANT ELIGIBILITY FUNDING PROCESS
 Project Stream APPLICANT ELIGIBILITY FUNDING PROCESS") 2017-2018 GUIDELINES Pennsylvania Partners in the Arts (PPA) Project Stream Jeffrey A. Parks, Chair, Bethlehem Jeffrey W. Gabel, Vice Chair, Gettysburg E. Jeanne Gleason, Johnstown Susan H. Goldberg, Philadelphia
2017-2018 GUIDELINES Pennsylvania Partners in the Arts (PPA) Project Stream Jeffrey A. Parks, Chair, Bethlehem Jeffrey W. Gabel, Vice Chair, Gettysburg E. Jeanne Gleason, Johnstown Susan H. Goldberg, Philadelphia
PENNSYLVANIA AMBULATORY SURGERY DATA:
 PENNSYLVANIA AMBULATORY SURGERY DATA: Data Notes 2013 1st Quarter Pennsylvania Health Care Cost Containment Council September 2013 ay Status Report for Pennsylvania Health Care Cost Containment Council
PENNSYLVANIA AMBULATORY SURGERY DATA:
 PENNSYLVANIA AMBULATORY SURGERY DATA: Data Notes 2013 2nd Quarter Pennsylvania Health Care Cost Containment Council January 2014 ay Status Report for Pennsylvania Health Care Cost Containment Council Special
PENNSYLVANIA EMSC VOLUNTARY RECOGNITION PROGRAM A Partnership between The PA Department of Health Bureau of EMS and PEHSC Wednesday, July 19, 2017
 PENNSYLVANIA EMSC VOLUNTARY RECOGNITION PROGRAM A Partnership between The PA Department of Health Bureau of EMS and PEHSC Wednesday, July 19, 2017 EMS Agency Level County Region Adams Regional EMS Expert
Pathways to Employment Preparing for the World of Work after a Spinal Cord Injury
 Pathways to Employment Preparing for the World of Work after a Spinal Cord Injury A resource to help you make a successful transition to work living with a spinal cord injury Pennsylvania Resources This
News for Immediate Release. Feb. 18, 2014
 News for Immediate Release Feb. 18, 2014 Department of Health Leaders Visit Hope Within Ministries Community Health Center, Unveil Grant Recipients of 2013-14 Community-Based Health Care Subsidy Program
FOR IMMEDIATE RELEASE
 Tassy Gilbert, PPA Program Coordinator Pocono Arts Council 18 North Seventh Street Stroudsburg PA 18360 570-476-4460 tassy@poconoarts.org www.poconoarts.org www.esa.dced.state.pa.us FOR IMMEDIATE RELEASE
Persian Gulf Conflict Veterans Benefit Program Fiscal Year Report PENNSYLVANIA DEPARTMENT OF MILITARY AND VETERANS AFFAIRS
 PENNSYLVANIA DEPARTMENT OF MILITARY AND VETERANS AFFAIRS Major General Jessica L. Wright, The Adjutant General Persian Gulf Conflict Veterans Benefit Program 2008-2009 Fiscal Year Report DEPARTMENT OF
Persian Gulf Conflict Veterans Benefit Program Fiscal Year Report PENNSYLVANIA DEPARTMENT OF MILITARY AND VETERANS AFFAIRS
 PENNSYLVANIA DEPARTMENT OF MILITARY AND VETERANS AFFAIRS Major General Wesley E. Craig, The Adjutant General Persian Gulf Conflict Veterans Benefit Program 2010-2011 Fiscal Year Report DEPARTMENT OF MILITARY
PENNSYLVANIA AMBULATORY SURGERY DATA:
 PENNSYLVANIA AMBULATORY SURGERY DATA: Data Notes 2016 2nd Quarter Pennsylvania Health Care Cost Containment Council December 2016 ay Status Report for Pennsylvania Health Care Cost Containment Council
STATE ENTREPRENEURSHIP INDEX
 University of Nebraska - Lincoln DigitalCommons@University of Nebraska - Lincoln Business in Nebraska Bureau of Business Research 12-2013 STATE ENTREPRENEURSHIP INDEX Eric Thompson University of Nebraska-Lincoln,
BE READY FOR ANYTHING
 BE READY FOR ANYTHING Learn What You Need to Know About Your 2018 Highmark Blue Shield Coverage Options Benefit Period: January 1 to December 31, 2018 2018 HEALTH INSURANCE CONNECTING CARE AND COVERAGE
Summary of Benefits PFFS. FreedomBlue SM. Pennsylvania January 1, 2010 through December 31, 2010
 2010 FreedomBlue SM PFFS Summary of Benefits Pennsylvania January 1, 2010 through December 31, 2010 A detailed side-by-side comparison of FreedomBlue PFFS plans and Original Medicare. H9793_09_0350 CMS
Statewide Contacts. Pennsylvania Department of Agriculture 2301 N Cameron Street Harrisburg PA Phone:
 Statewide Contacts State Conservation Commission Roy Richardson Dirt, Gravel, Low Volume Roads Program Coordinator 2301 N Cameron Street Room 311 Phone: 717.787.2103 e-mail: rricharso@pa.gov PSU Center
Introduction to Summary of Benefits
 2011 Summary of Benefits H8468 Reserve SB 2011 10256_1 CMS Approved 9/15/10 RESERVE (MSA) Thank you for your interest in Geisinger Gold Reserve (MSA). Our plan is offered by GEISINGER INDEMNITY INSURANCE
DEP Permit. Public Water Systems
 DEP Permit Public Water Systems COMMONWEALTH OF PENNSYLVANIA Department of Environmental Protection For more information, visit DEP s website at www.dep.state.pa.us, Keyword: DEP Drinking Water. DEPARTMENT
Small Business Development Center Use in Pennsylvania
 Small Business Development Center Use in Pennsylvania By: Simon Condliffe, Ph.D. West Chester University of Pennsylvania September 2011 Executive Summary This research was conducted to profile clients
6/9/2016. Pennsylvania s Approach to HC Coalitions. Pennsylvania Regional Task Force MAP
 SE PA Healthcare Planning and Response World Meeting of Families / Papal Visit September 2015 2016 Healthcare Coalition Emergency Management Workshop June 10, 2016 6/9/2016 Pennsylvania s Approach to HC
BE READY FOR ANYTHING
 BE READY FOR ANYTHING Learn What You Need to Know About Your 2018 Highmark Coverage Options Benefit Period: January 1 to December 31, 2018 2018 HEALTH INSURANCE CONNECTING CARE AND COVERAGE * You want
LETTERS TO THE EDITOR
 ATLANTIC SUNRISE EXPANSION A QUICK GUIDE TO WRITING GUIDE CONTENTS 1HOW TO WRITE A LETTER Quick Tips on keeping on message and how to be clear in your position. 2SAMPLE LETTER An example of a letter to
Ch. 912 DATA REPORTING REQUIREMENTS CHAPTER 912. DATA REPORTING REQUIREMENTS
 Ch. 912 DATA REPORTING REQUIREMENTS 28 912.1 CHAPTER 912. DATA REPORTING REQUIREMENTS Subchap. Sec. A. GENERAL PROVISIONS... 912.1 B. PENNSYLVANIA UNIFORM CLAIMS AND BILLING FORM SUBMISSION SCHEDULES...
December 12, 1787 Pennsylvania Becomes a State
 December 12, 1787 Pennsylvania Becomes a State The area that is now the state of Pennsylvania was one of the thirteen original colonies. Pennsylvania has had a long history. It began as a colony, grew
Paul K. Fox Hastings Mill Road, Pittsburgh, PA (412) or (412)
 or (412)") Send corrections/additions to (, PMEA State Retired Member Coordinator) May 12, 2017 Page 1 of 10 SORTED BY CHOIR NAME (for choirs by location, scroll down) Name of Choir/Chorus City in PA County Website
Send corrections/additions to (, PMEA State Retired Member Coordinator) May 12, 2017 Page 1 of 10 SORTED BY CHOIR NAME (for choirs by location, scroll down) Name of Choir/Chorus City in PA County Website
Healthy happens. Aetna Better Health of Pennsylvania Aetna Better Health Kids Provider Manual. aetnabetterhealth.com/pa
 Healthy happens Aetna Better Health of Pennsylvania Aetna Better Health Kids Provider Manual aetnabetterhealth.com/pa Table of Contents Chapter 1 Introduction...3 Chapter 2 Contact information...7 Chapter
Municipal Load Projections for the Chesapeake Bay Strategy
 Municipal Projections for the Chesapeake Bay Strategy PA0024147 CUMBERLAND TWP MUN AUTH Adams 0.4 9,741 1,218 PA0021563 GETTYSBURG MUN AUTH Adams 1.88 45,783 5,723 PA0021229 LITTLESTOWN BORO AUTH Adams
Choose the right Medicare plan Compare the features of PPO and Part D plans Save money Make sure you have prescription drug coverage
 Get Medicare Answers in Person. Join me for a FREE Medicare Solutions Seminar! Get together with your friends and neighbors and have your questions answered by a Medicare specialist who lives and works
PENNSYLVANIA ACT 13 CONSERVATION AND RECREATION FUNDING
 LOCAL FUNDING GUIDE :: NOVEMBER 2012 (UPDATED FEBRUARY 2013) PENNSYLVANIA ACT 13 CONSERVATION AND RECREATION FUNDING The for The Trust for Public Land (TPL) is a national nonprofit land conservation organization
)HGHUDO+LJKZD\$GPLQLVWUDWLRQ± 6HSWHPEHU 3HQQV\OYDQLD&RUULGRU3HUVSHFWLYH
HGHUDO+LJKZD\$GPLQLVWUDWLRQ± 6HSWHPEHU 3HQQV\OYDQLD&RUULGRU3HUVSHFWLYH") )HGHUDO+LJKZD\$GPLQLVWUDWLRQ± 6HSWHPEHU,&RUULGRULQ3HQQV\OYDQLD 3UHVHQWHGDWWKH,&RUULGRU0XOWL6WDWH0HHWLQJ 5RDQRNH9LUJLQLD 6HSWHPEHU :DOW3DQNR3HQQ'27 4 99 WAYNE WYOMING LUZERNE SCHUYLKILL CARBON COLUMBIA
)HGHUDO+LJKZD\$GPLQLVWUDWLRQ± 6HSWHPEHU,&RUULGRULQ3HQQV\OYDQLD 3UHVHQWHGDWWKH,&RUULGRU0XOWL6WDWH0HHWLQJ 5RDQRNH9LUJLQLD 6HSWHPEHU :DOW3DQNR3HQQ'27 4 99 WAYNE WYOMING LUZERNE SCHUYLKILL CARBON COLUMBIA
Higher Education Employment Report
 Higher Education Employment Report Second Quarter 2017 / Published December 2017 Executive Summary The number of jobs in higher education increased 0.8 percent, or 29,900 jobs, during the second quarter
For full details of services and costs for each plan, please consult the Evidence of Coverage at GeisingerGold.com or call us for more information.
 This Summary of Benefits contains 2018 plan information for: Geisinger Gold Secure Rx (HMO SNP) For full details of services and costs for each plan, please consult the Evidence of Coverage at GeisingerGold.com
INSTALLATION NAME SITE ID MUNICIPALITY COUNTY DOD
 CP SHARPE - POW CAMP C03PA0433 GETTYSBURG ADAMS FUDS FORT RITCHIE C03PA0447 RAVENROCK ADAMS FUDS GETTYSBURG NATL MIL PK C03PA1070 GETTYSBURG ADAMS FUDS USARC GETTYSBURG SITE 01 GETTYSBURG ADAMS ARMY USARC
Annual Job Growth Projected to Approach 60,000 by 2017
 For Immediate Release May 1, 2015 Annual Job Growth Projected to Approach 60,000 by 2017 Carson City, NV Nevada s employment outlook continues to show positive signs for the state s mending economy, according
LOCATION QUOTIENTS. Berks, Chester, Lebanon, Lancaster, Lehigh, Montgomery, Schuylkill counties
 LOCATION QUOTIENTS Berks, Chester, Lebanon, Lancaster, Lehigh, Montgomery, Schuylkill counties 2001-2013 What is a location quotient? Metric for gauging the relative concentration or specialization of
Comprehensive Economic Development Strategy Annual Performance Report for Northeastern Pennsylvania
 2011-2012 Comprehensive Economic Development Strategy Annual Performance Report for Northeastern Pennsylvania Submitted to the: U.S. Department of Commerce Economic Development Administration June 2012
Welcome to the start of our 22nd season!
 2013 Hunting Season Welcome to the start of our 22nd season! Whether you are a veteran HSH deer processor who has served the program for years, or one who is looking to join this worthwhile cause, you
VOLUME 35 ISSUE 6 MARCH 2017
 VOLUME 35 ISSUE 6 MARCH 2017 IN THIS ISSUE Index of State Economic Momentum The Index of State Economic Momentum, developed by Reports founding editor Hal Hovey, ranks states based on their most recent
INSTITUTION INFORMATION
 Albright College Private College and University Reading Allegheny College Private College and University Meadville Alvernia University Private College and University Reading American College Private College
Metropolitan and Regional Planning Organization Executive Directors
 OS-600 (11-08) www.dot.state.pa.us MEMO DATE: January 24, 2011 SUBJECT: TO: Applications for JARC and New Freedom Programs Metropolitan and Regional Planning Organization s FROM: Eileen Ogan, Chief Specialized
Vital Signs. Health Care Employment Gains Across New York State
 Vital Signs Health Care Employment Gains Across New York State October 2018 Message from the Comptroller October 2018 Job markets go through cycles of ups and downs. Further, within New York State, employment
Higher Education Employment Report
 Higher Education Employment Report First Quarter 2017 / Published September 2017 Executive Summary The number of jobs in higher education increased 0.6 percent, or 22,100 jobs, during the first quarter
May 2013 Instant Game Winners of $1,000 or More
 May 2013 Instant Game Winners of $1,000 or More DANIEL T COLUMBIA PA HOT MILLION $1,000,000.00 CHARLES M CUMBERLAND PA HOT MILLION $1,000,000.00 TONY R OUT OF STATE NJ KINGS OF CASH $1,000,000.00 JOSEPH
Provider Education Packet
 Provider Education Packet Spring 2015 Dear Provider; AmeriHealth Caritas Pennsylvania and AmeriHealth Northeast are proud to present our spring 2015 Provider Education Packet. This booklet contains a compilation
Higher Education Employment Report
 Higher Education Employment Report Second Quarter 2015 / Published August 2015 Executive Summary For the second year in a row, the number of jobs in higher education declined during the second quarter,
2018 Summary of Benefits. HMO Plan REHP H3907
 2018 Summary of Benefits HMO Plan REHP H3907 UPMC for Life HMO Plan (HMO) REHP SUMMARY OF BENEFITS January 1, 2018 December 31, 2018 This Summary of Benefits booklet gives you a summary of what UPMC for
2015/16 Basic Education Funding & Ready to Learn Block Grant
 2015/16 Basic Education Funding & Information from the PA Department of Education s website: Upon enactment of House Bill 1460 as accepted by the Governor, we began the fair restoration of the most essential
THE HEALTHCARE CLUSTER
 Prepared by: Iryna Lendel The Center for Economic Development Maxine Goodman Levin College of Urban Affairs as part of: The CSU Presidential Initiative for Economic Development THE HEALTHCARE CLUSTER IN
Mental Health and Substance Abuse Bulletin COMMONWEALTH OF PENNSYLVANIA * DEPARTMENT OF PUBLIC WELFARE
 Mental Health Substance Abuse Bulletin COMMONWEALTH OF PENNSYLVANIA * DEPARTMENT OF PUBLIC WELFARE NUMBER: OMHSAS 01-01 ISSUE DATE: 2-01-01 EFFECTIVE DATE: Immediately SUBJECT BY Nursing Home Reform Implementation
Phone: Fax: Phone:
 PENNSYLVANIA MEDICAID MANAGED CARE ORGANIZATION (MCO) DIRECTORY OCTOBER 2017 Healthchoices Physical Health Name of Contractor Contact Information Service Area CVS/Caremark Dental Benefit Mgr: DentaQuest
Sun W. Vega, MBA, Senior Associate, OPEN MINDS The 2014 OPEN MINDS Planning & Innovation Institute June 4, :15pm 5:30pm
 Sun W. Vega, MBA, Senior Associate, OPEN MINDS The 2014 OPEN MINDS Planning & Innovation Institute June 4, 2014 4:15pm 5:30pm I. The Evolution of Managed Care & Implications For Provider Organizations