ECONOMIC IMPACT OF DEVENS, MA
|
|
|
- Coral Terry
- 5 years ago
- Views:
Transcription


1 ECONOMIC IMPACT OF DEVENS, MA A study prepared by the Montachusett Regional Planning Commission (MRPC) with assistance from Mullin Associates, Inc. Funded by the Commonwealth of Massachusetts Executive Office of Housing and Economic Development, Office of Performance Management and Oversight JUNE
2 Table of Contents Section 1: PROJECT OVERVIEW... 4 Section 2: OUTREACH AND PUBLIC INVOLVEMENT... 6 Section 3: HOUSING... 8 Introduction... 8 Population... 9 Concentration of Population in Population Age Housing Occupancy Age and Condition of Housing Stock Foreclosures Median Sale Price Affordable Housing Section 4: TRANSPORTATION / CIRCULATION Introduction Roadway System Traffic Volume and Congestion Pavement Other Transportation Systems Highway Projects and Estimated Project Cost Future Needs Section 5: ECONOMIC DEVELOPMENT Introduction Assessment of the Study Area s Current Economic Base Profile of Employment and Employers Real Estate Conditions: 1994 to
3 Tax Incentives and Marketing MassDevelopment Investment and State Aid in the Montachusett Region Section 6: SERVICES AND FACILITIES Introduction Overview of Services and Facilities Devens Regulation and Financing Section 7: LAND USE, OPEN SPACE AND RECREATION Introduction Current Development & Attributes of the Study Area Water and Sewer Resources Trails Open Space and Recreation Build-out Analysis and Development Potential Section 8: NEXT STEPS APPENDICES A, B AND C
4 Section 1: PROJECT OVERVIEW The Montachusett Regional Planning Commission (MRPC) received a grant on behalf of the region facilitated by the City of Leominster and funded through the Massachusetts Executive Office of Housing and Economic Development (EOHED) and its Office of Performance Management and Oversight (OPMP) to analyze and report on information related to the Economic Impact of Devens on the Montachusett Region. The Montachusett Region is about 675 square miles located in north central Massachusetts, due west of Boston. Twenty-two communities and Devens participated in the development of the Devens Impact Plan. Those communities are: Ashby, Ashburnham, Athol, Ayer, Clinton, Fitchburg, Gardner, Groton, Harvard, Hubbardston, Lancaster, Leominster, Lunenburg, Petersham, Phillipston, Royalston, Shirley, Sterling, Templeton, Townsend, Westminster and Winchendon. The Region is bordered by New Hampshire to the north, metropolitan Worcester to the south, Franklin County to the west and metro Boston to the east. Section 2 of this report consists of an overview of outreach and public involvement which was a critical element of this study. The stakeholders of this project were provided opportunities to meet with the MRPC and its consulting team (Mullin Associates, Inc.) and participate in an interactive dialogue on three separate occasions. The first meeting was held at Great Wolf Lodge, Fitchburg on May 19, 2016 with 37 attendees where background information and the project scope were presented and breakout groups discussed and presented thoughts and ideas on the study. The second meeting was held at Red Apple Farm, Phillipston on June 8, 2016 with 32 attendees to update stakeholders on what had been learned to date - additional input sought from stakeholders was obtained and utilized in this report by MRPC. The third meeting was held at Ayer Town Hall on June 23, 2016 with 37 attendees where highlights of this report and draft Next Steps were discussed. Materials for stakeholder meetings can be found in the appendix. Section 3 is an analysis of the region s housing. The analysis considered three important aspects: the housing structures, the population inhabiting the housing and the environment in which the housing is located. This includes factors such as population trends, housing unit growth, age of the housing stock, and housing affordability. Section 4 of the report consists of transportation/ circulation data as it relates to Devens and the region. It examines the region s existing roadway system network, pavement conditions, and other transportation systems including rail. Traffic volumes were also documented in this section that showed that traffic volumes at all Devens Gates have increased since 2010 and that the change in traffic volume between 1996 and 2015 was substantial. Section 5 details economic development throughout the region and Devens. Included is an assessment of the study area s current economic base, a profile of employment and employers and businesses in Devens, and an outline of Devens Enterprise Commission s permitting process. It also includes a listing of establishments that relocated from or expanded operations in Devens, workplace location, real estate conditions from 1996 to 2016, along with tax incentives and marketing, and MassDevelopment Investment and state aid in the Montachusett Region. Moreover, Mullin Associates Inc. utilized ESRI Business Analyst Online to formulate a Report on the Retail Trade Assessment/Analysis of the Montachusett Region. The report, in its entirety, can be found in the appendix. 4
5 Section 6 presents a general overview of Devens facilities and services. Information was collected regarding organizational structure, budget, staffing, equipment, facilities, responsibilities, and various programs. Many issues are discussed including but not limited to utilities, public education, taxes and identification of services. Section 7 consists of existing land use, current development and attributes, Devens zoning and land use development methods, and water and sewer resources. Open space and recreation resources are reviewed followed by a build-out and development potential analysis and summary. Section 8 concludes with a listing of Next Steps that can be taken to enhance the region and Devens in regards to all of the above related sections. The Montachusett Regional Planning Commission would like to thank the following contributors that made this study/report possible: Communities within the Montachusett Region. Participants who attended and contributed by providing valuable input and open dialogue at the three stakeholder meetings. Moreover, events such as these need to be held in suitable locations. The support received from Great Wolf Lodge, Red Apple Farm, and the Town of Ayer was considerable. Devens Enterprise Commission (DEC) and MassDevelopment, the state's finance and development authority (see MassDevelopment.com), for contributing towards all aspects of the study. 5

6 Section 2: OUTREACH AND PUBLIC INVOLVEMENT Section 1: Outreach and Public Involvement Outreach and public involvement was a critical element of this study. From the beginning of the project MRPC realized that, to be successful, the project must involve a large constituency. Broad-based stakeholder support would result in a plan that meets the needs and desires of the region and provide the groundwork for implementing recommendations. The stakeholders of this project were provided opportunities to meet with the MRPC and its consulting team (Mullin Associates, Inc.) and participate in an interactive dialogue on three separate occasions. These events were well attended, and provided significant stakeholder input enhancing the project significantly. Meeting notices, agendas, sign in sheets, and hand out materials can be found in the Appendix. The first meeting was held at Great Wolf Lodge, Fitchburg on May 19, 2016 with 37 attendees where background information and the project scope were first presented. MRPC Executive Director, Glenn Eaton moderated the meeting and instructed breakout tables to discuss a variety of study related issues and then have a member of the breakout table present findings which were recorded and can be found in the appendix. Upon conclusion of the reports from each table the moderator asked every member of the audience to contribute one item of interest from each person s perspective the results of this can also be found documented in the appendix of this report. 6

 moderated a listening session with stakeholders communicating with both MRPC and Mullin Associates, Inc.")

7 The second meeting was held at Red Apple Farm in Phillipston on June 8, 2016 with 32 attendees. Stakeholders were updated on what had been learned thus far during the course of the study and Glenn Eaton presented a summary of comments and questions from the first meeting followed by MRPC responses to these questions. MRPC consultant, John Mullin (Mullin Associates, Inc.) moderated a listening session with stakeholders communicating with both MRPC and Mullin Associates, Inc. This input can be viewed in the appendix of this report and is labeled Notes taken at 2 nd Stakeholder Meeting. The third meeting was held at Ayer Town Hall on June 23, 2016 with 37 persons attending. Robert Pontbriand, Ayer Town Manager welcomed attendees to Ayer Town Hall and John Hume, MRPC Planning and Development Director presented trends and highlights of work accomplished. Glenn Eaton summarized a listing of recommendations from MRPC and was followed by John Mullin who discussed a list of Thoughts and Ideas on Devens and the Montachusett Region and then opened the meeting up for public input and dialogue. 7
8 Section 3: HOUSING Introduction The geographic area of the Devens Impact Report Housing Element is the Montachusett Region. Montachusett is a Region of 675 square miles located in north central Massachusetts, due west of Boston. Twenty-two communities and Devens participated in the development of the Devens Impact Plan as it relates to housing. Those communities are: Ashburnham, Ashby, Athol, Ayer, Clinton, Fitchburg, Gardner, Groton, Harvard, Hubbardston, Lancaster, Leominster, Lunenburg, Petersham, Phillipston, Royalston, Shirley, Sterling, Templeton, Townsend, Westminster and Winchendon - See Map (MRPC Communities) on the following page. The Region is bordered by New Hampshire to the north, metropolitan Worcester to the south, Franklin County to the west and metro Boston to the east. Housing has evolved into a major issue in Massachusetts from about the mid-1990s with housing demand and high prices driven by low mortgage rates and low availability to the present with the national, state and regional housing crisis including; dramatic drops in home values, increased taxes and utility costs and evaporated bank lending, not to mention, record unemployment levels, bankruptcies and the rise in home foreclosures. Only recently has the housing crisis shown signs of recovery. An analysis of the housing stock should consider three important aspects: the housing structures, the population inhabiting the housing and the environment in which the housing is located. The following examines the Montachusett Region s housing stock including any available information on Devens in terms of age, condition, cost, and the demographic trends as well as the specific needs of different population groups. This section also discusses housing affordability. The data and analysis in this Chapter are based on information obtained from the Montachusett Regional Planning Commission, the state, Devens Enterprise Commission, and the U.S. Census Bureau. It should be noted that any Census Data that pertains to households accurately reflects the intent of the Devens Impact Study. However, Census data pertaining to individuals also includes the prison population and was not included in this report. 8
9 Population The 2010 Census recorded 236,475 residents in the Montachusett Region, a 3.7% increase in its population from the year The Table below shows that the Region has been growing since Most communities have seen population increases in recent years. In fact, just three communities in the Region experienced a decrease in population between the years 2000 and 2010: Gardner, Townsend and Leominster. Communities that experienced the largest percentage increase in population since 1990 were Hubbardston (56.67%), Groton (41.74%), Templeton (24.46%), Lancaster (20.93%), and Shirley (17.87%). Smaller communities generally seem to have had a higher percentage rate of population growth than the more urbanized areas, mostly because these less populated towns were smaller to begin with, plus the availability of large tracts of vacant developable land. Prior to the Devens Restructure in the 1990 s, Devens military population was divided among the communities of Ayer, Harvard and Shirley. Devens is no longer an active military installation with any significant military population. According to the 2010 Census, the Devens population is 1,795 including the prison population. Also according to the 2010 Census, there were 112 households in Devens that excludes the prison population, with 301 persons living within these households. 9
10 Table H-1: Population in the Montachusett Region from Community '90-00 % Change 00-10% Change 90-10% Change Ashburnham 5,433 5,546 6, % 9.6% 11.93% Ashby 2,717 2,845 3, % 8.0% 13.14% Athol 11,451 11,299 11, % 2.5% 1.16% Ayer 6,871 7, % 1.9% 8.09% Devens % 44.0% Ayer 6,251 7,021 7, % 0.3% Clinton 13,222 13,435 13, % 1.3% 2.90% Fitchburg 41,194 39,102 40, % 3.1% -2.13% Gardner 20,125 20,770 20, % -2.6% 0.51% Groton 7,511 9,547 10, % 11.5% 41.74% Harvard 12,329 5,981 6, % 9.0% % Devens 7, , % 94.0% Harvard 4,662 5,230 5, % -3.2% 8.60% Hubbardston 2,797 3,909 4, % 12.1% 56.67% Lancaster 6,661 7,380 8, % 9.1% 20.93% Leominster 38,145 41,303 40, % -1.3% 6.85% Lunenburg 9,117 9,401 10, % 7.3% 10.63% Petersham 1,131 1,180 1, % 4.6% 9.11% Phillipston 1,485 1,621 1, % 3.8% 13.27% Royalston 1,147 1,254 1, % 0.3% 9.68% Shirley 6,118 6,373 7, % 13.1% 17.87% Devens % No % Change Shirley 5,432 6,373 7, % 13.1% 14.34% Sterling 6,481 7,257 7, % 7.6% 20.48% Templeton 6,438 6,799 8, % 17.9% 24.46% Townsend 8,496 9,198 8, % -3.0% 5.06% Westminster 6,191 6,907 7, % 5.4% 17.54% Winchendon 8,805 9,611 10, % 7.2% 16.98% TOTAL 223,865228,005236, % 3.7% 5.63% Source: U.S. Census Bureau & Massachusetts 2010 Population and Housing Unit Counts, US Department of Commerce, Economics and Statistics Administration According to MRPC s Regional Transportation plan, over the next 25-years the population is expected to grow at a slightly slower pace from 236,475 to 255,000 persons. There will be a net increase of approximately 18,525 persons which is an increase of 7.8% over the 2010 population for an average annual growth rate (AAGR) of 0.302%. In terms of population increases within Devens, according to the 2010 Census the average household size in Devens is 2.69 persons and, given the fact that the Housing Cap under Devens By-Laws is 282 units, it could be estimated that the Devens population living in households could eventually increase from 301 persons in 2010 to about 758 over time. It 10


11 should also be noted that there are 124 approved new housing units in Devens (Emerson Green, none having been completed yet, but build-out of this project will approach the 282 housing limit. Also, in 2015, Harvard, Ayer and Shirley approved a re-zoning in Shirley s portion of Devens to allow a 120-unit Senior Residential Development which is outside of the 282 unit cap. However, the housing cap could conceivably be revisited at some time in the future. Concentration of Population in 2010 Utilizing the most recent regional land use information available, data indicates that about 11% of the Montachusett Region is developed, primarily for residential purposes (9%) followed much further behind by Commercial/Industrial development (1%) and the transportation network (1%). Forested land makes up about 67% of the Region s land use and 4% of the land is used for agricultural purposes. Wetlands and water bodies occupy about 13% of the Region. Some of the densest areas of development are often situated along rivers where moving water was once used to power paper and textile mills and other factories. The chart below displays the land use in the Montachusett Region by percent. While the average regional residential land use is about 9%, Devens is around 3.28%. Transportation Wetlands & Water 1% 13% Agriculture 4% Commercial/ Industrial 1% Residential 9% Other 5% Regional Land Use Forest 67% Forest Residential Commercial/Industrial Agriculture Wetlands & Water Transportation Age Distribution Population within the Montachusett Region remains concentrated within the three urban cities of Fitchburg, Leominster and Gardner. However, growth is occurring fastest along the rural communities that are situated in close proximity to a major highway, i.e. Route 2 for Templeton, Shirley, and Hubbardston and Route 119 for Groton. These are a few of the major commuting roads for the region. Issues such as congestion, safety and infrastructure along these roads are of concern. Improving commuting options would also impact the commuting patterns on the network. In addition, growth is occurring on the periphery of the three major cities where more services such as commercial, entertainment and medical are available. Thus housing and connections to these cities are an important issue. Population Age In terms of regional age distribution and trends, the population is aging, consistent with the state and nation. In 1990 the average age of residents in the Montachusett Region was lower than 11
12 the state average but equal to the national average. This is no longer the case. As indicated in Table H-2, in 2000 and 2010, the average age of residents in the Montachusett Region surpassed the state and national average age. By 2010, this difference was 2.3 years greater than the state average and 4.2 years more than the national average. The average age within the region has increased by almost 4 years each decade from 1990 (8.5 years to be exact from 1990 to 2010) while statewide this increase in the median age was only 5.6 years over the same 20 year span. Percentage wise, the Region far outpaced the state and nation with a 10.7% increase from 2000, almost 3.5% higher than Massachusetts (7.12%) and twice as great as the United States (5.38%). The communities with the highest median age were Petersham at 48.0 years, Royalston at 45.6 years, and Sterling at 44.0 years. In total, 16 (or 73%) of the 22 Montachusett communities had a median age of 40.0 years or greater. In most cases, these 16 communities are smaller and more rural in nature and are home to 46% of the region s total population. Of the six communities with average ages below 40.0 years, the city of Fitchburg s median age of 34.7 years is nearly 4 years lower than the next lowest community, Ayer (38.2 years) and some 13.3 years less than the highest, Petersham. This average for Fitchburg is also 6.7 years lower than the Montachusett average (34.7 to 41.4, respectively), 4.4 years lower than the Massachusetts average (34.7 to 39.1) and 2.5 years less than the national average (34.7 to 37.2) Census Data for age distribution in Devens includes the prison population and doesn t provide an accurate reflection of the community in this regard. However, Devens likely has a lower average age of residents than the region, state, and nation. The 2010 Census shows that within Devens, just 17.9% of households had individual(s) 65 years old and over which is lower than the Montachusett Region (23.2%), the Commonwealth of Massachusetts (25.6%), and the Nation (24.9%), and; Devens has a higher percentage of households with individuals under 18 (43.8%) than the Montachusett Region (34%), Massachusetts (30.8%), and the Nation (33.4%). Moreover, page 46 of the Harvard Master Plan includes a breakdown of age cohorts in the former Harvard portion of Devens, which includes 103 units of existing housing in Devens that indicates that Devens residents in the Harvard portion of Devens tend to be younger. 12
13 Table H-2: Montachusett Median Age by Community: Community Median Age Median Age Median Age Ashburnham Ashby Athol Ayer Clinton Fitchburg Gardner Groton Harvard Hubbardston Lancaster Leominster Lunenburg Petersham Phillipston Royalston Shirley Sterling Templeton Townsend Westminster Winchendon Region Avg Mass. Avg National Avg Source: U.S. Department of Commerce, Bureau of the Census 1980, 1990, 2000, 2010 In terms of age groups, the Devens 2010 Census Data includes the prison population and doesn t provide an accurate reflection of age distribution in that community. However, information is available which can be useful in terms of determining housing needs for various ages throughout the region. According to the 2010 U.S. Census, the largest age group in the Montachusett Region is 45 to 49 (21,024), followed by 50 to 54 (19,971). Beginning at the 45 to 49 age group, there is a steady decline occurring in older age groups until age 85 and over. It can also be noted that there is a surge in ages 15 to 19 (17,511), followed by a decline until the 30 to 34 age group, where it begins to rise again. The 45 to 59 age group can be linked to the tail end of the baby boomer generation and along with the 60 to 64 age group show an increase in size across the region of almost 67% from 2000 to This is a continuation of a trend where according to the 2000 Census the largest age group increase was experienced by the 45 to 59 bracket (32.57%). Decreases of 12.66% and 26.82% were also seen in the Under 5 and 35 to 44 age groups, respectively between 2000 and Within the individual communities of the region, the overall percentage of population identified as elderly, i.e. those individuals 65 and older, increased in 16 of the 22 from approximately 0.5% (Leominster) to 4.49% (Sterling) from the year 2000 to
14 The remaining six municipalities saw decreases ranging from 0.44% (Petersham) to 2.24% (Clinton). Overall the region experienced a 0.09% increase in its elderly population from the 2000 Census. Elderly individuals therefore maintained a relatively constant percentage block of the overall region s total population of 12.58% perhaps indicating a need for additional elderly housing moving into the future. It should be noted that from 2000 to 2010, the working `age population for the Montachusett Region grew astoundingly by 25.59%, a major change from the region s 2.5% increase from 1990 to 2000 (See Table Below). There are nearly forty thousand more people in the Montachusett Region that are of working age than there were in 2000, with the working age population now making up eighty percent of the region s overall population. Table H-3: Working Age Population by Community 1990, 2000, and Census Working Age Population Census Working Age Population Census Working Age Population 2010 % of Total Population Community Ashburnham 5,433 3,619 5,546 4,192 6,081 4, Ashby 2,717 1,770 2,845 1,926 3,074 2, Athol 11,451 6,034 11,299 7,022 11,584 9, Ayer 6,871 4,738 7,287 4,985 7,427 5, Clinton 13,222 8,703 13,435 8,798 13,606 11, Fitchburg 41,194 26,304 39,102 24,897 40,318 32, Gardner 20,125 12,813 20,770 13,288 20,228 16, Groton 7,511 5,204 9,547 6,179 10,646 8, Harvard 12,329 8,952 5,981 4,188 6,520 5, Hubbardston 2,797 1,868 3,909 2,600 4,382 3, Lancaster 6,661 4,711 7,380 5,307 8,055 6, Leominster 38,145 25,603 41,303 26,730 40,759 32, Lunenburg 9,117 6,123 9,401 6,275 10,086 8, Petersham 1, , ,234 1, Phillipston 1,485 1,001 1,621 1,108 1,682 1, Royalston 1, , ,258 1, Shirley 6,118 4,324 6,373 4,601 7,211 6, Sterling 6,481 4,412 7,257 5,262 7,808 6, Templeton 6,438 4,181 6,799 4,442 8,013 6, Townsend 8,496 5,552 9,198 6,298 8,926 7, Westminster 6,191 4,150 6,907 4,639 7,277 5, Winchendon 8,805 5,457 9,611 6,208 10,300 8, Totals 223, , , , , ,205 % working age 65.6% 66.1% 80.0% Source: Census 2010, 2000,
15 Housing Occupancy Region-wide, a significant number of new dwelling units were created between 1980 and 1990 as the percentage of new units realized was 15.9% (11,946 units). The 1991 recession slowed the development of new units. However, the Montachusett Region has been experiencing continued new housing construction since As indicated in the table below, between 1990 and 2000 new dwelling units increased by another 3.9% (3,367 units). From 2000 to 2010, new dwelling units increased by 9.0%, a much higher rate than what occurred between 1990 and Communities like Winchendon (25.4%), Hubbardston (22.2%), and Lancaster (22.1%) rebounded very well from the slow development of housing units in the 1990s by posting the highest rates of increased dwelling units in the Montachusett Region by Moreover, the regions housing stock outpaced population growth between 1990 and 2000 by 0.2% and much more significantly (3.37%) between 2000 and Most growth probably took place from the years 2000 up until 2007 when the national recession began. The 2010 Census states that there were 112 households in Devens and more recent information from Devens Enterprise Commission indicates that existing single and multi-family housing has increased to 140 units as of June Additionally, there are 124 approved new housing units in Devens (Emerson Green), none having been completed yet and an approved re-zoning in Shirley s portion of Devens to allow a 120-unit Senior Residential Development which is outside of the 282 unit cap. Table H-4: Number of Dwelling Units: 1990 through 2010 Community Number of Dwelling Units % Change % Change '90-' Ashburnham 2,279 2,204 2, % 17.9% Ashby 959 1,011 1, % 17.8% Athol 4,840 4,824 5, % 8.4% Ayer 2,891 3,154 3, % 9.8% Clinton 5,635 5,844 6, % 9.5% Fitchburg 16,665 16,002 17, % 7.0% Gardner 8,654 8,838 9, % 3.3% Groton 2,774 3,393 3, % 17.6% Harvard 3,141 2,225 2, % -8.0% Hubbardston 1,025 1,360 1, % 22.2% Lancaster 2,095 2,141 2, % 22.1% Leominster 15,533 16,976 17, % 5.3% Lunenburg 3,486 3,668 4, % 12.7% Petersham % 15.2% Phillipston % 8.5% Royalston % 9.1% Shirley 2,183 2,156 2, % 12.6% Sterling 2,308 2,637 2, % 12.4% Templeton 2,276 2,597 3, % 20.9% Townsend 2,894 3,184 3, % 6.3% Westminster 2,405 2,694 2, % 9.9% Winchendon 3,349 3,660 4, % 25.4% Total 86,940 90,307 98, % 9.0% Source: U.S. Department of Commerce, Bureau of the Census 1980, 1990, 2000 &
 had the highest percentage of owner-occupied dwelling units (See Table Below) and, the more urbanized communities of Fitchburg (54%), Gardner (54.9%), Clinton (56.5%), and Leominster (58.")
16 In terms of owner/renter occupancy, the 2010 Census shows us that Phillipston (91.9%), Ashby (91.8%), and Harvard (91.4%) had the highest percentage of owner-occupied dwelling units (See Table Below) and, the more urbanized communities of Fitchburg (54%), Gardner (54.9%), Clinton (56.5%), and Leominster (58.6% had the lowest percentage of owner-occupied dwelling units. Since 1990, each community experienced an increase in owner occupied housing. The Montachusett Region, in its entirety, was made up of 62.3% owner occupied units and 37.7% rental units. In 2010, owner occupied housing units increased to 68.3% while rental units decreased to 31.7%. According to the 2010 Census, Devens had 93 owner occupied units (83%) and 19 renter-occupied units (17%). Table H-5: Owner/Renter Occupied Units: 1990 to 2010 As can be seen in the Table on the following page, communities with the highest percentages of family households in 2010 include Harvard (80.45%), Hubbardston (78.48%), and Ashby (78.01%). In Devens, about 70.5% of households were family households. The Montachusett Region had a lower percentage of family households (66.88%) as did Massachusetts (63%) and the Nation (66.4%). About 29.5% of households in Devens were defined as non-family households - the Montachusett Region has a higher percentage of non-family households (33.12%) as does Massachusetts (37%) and the Nation (33.6%). Montachusett communities with the highest percentages of nonfamily households include Clinton (41.44%), Ayer (41.28%), and Gardner (39.07%). Overall, the table below indicates that every community except Petersham had a decrease in the percentage of family-oriented households since 1990, aligning with the national trend that has seen a steady drop in the number of family-oriented households since the 1960s. 16
17 Table H-6: Household Types in the Montachusett Region Total Households Family Households Nonfamily Households Community % % % % % % Ashburnham 1,834 1,929 2,148 1, % 1, % 1, % % % % Ashby , % % % % % % Athol 4,379 4,487 4,656 3, % 2, % 2, % 1, % 1, % 1, % Ayer 2,681 2,982 3,118 1, % 1, % 1, % % 1, % 1, % Clinton 5,320 5,597 5,831 3, % 3, % 3, % 1, % 2, % 2, % Fitchburg 15,363 14,943 15,165 10, % 9, % 9, % 5, % 5, % 5, % Gardner 7,979 8,282 8,224 5, % 5, % 5, % 2, % 3, % 3, % Groton 2,577 3,268 3,753 2, % 2, % 2, % % % % Harvard 2,977 1,809 1,893 2, % 1, % 1, % % % % Hubbardston 954 1,308 1, % 1, % 1, % % % % Lancaster 1,910 2,049 2,409 1, % 1, % 1, % % % % Leominster 14,834 16,491 16,767 10, % 10, % 10, % 4, % 5, % 6, % Lunenburg 3,252 3,535 3,835 2, % 2, % 2, % % % 1, % Petersham % % % % % % Phillipston % % % % % % Royalston % % % % % % Shirley 2,089 2,067 2,264 1, % 1, % 1, % % % % Sterling 2,198 2,573 2,810 1, % 2, % 2, % % % % Templeton 2,195 2,411 2,882 1, % 1, % 2, % % % % Townsend 2,761 3,110 3,240 2, % 2, % 2, % % % % Westminster 2,175 2,529 2,716 1, % 1, % 2, % % % % Winchendon 3,052 3,447 3,810 2, % 2, % 2, % % % 1, % Source 1990, 2000, 2010 U.S. Census In terms of household/family size, according to the 2010 Census the average household size in Devens is 2.69 persons and the average family size household is The average household size in the region was about the same for all communities, ranging anywhere from 2.3 to 2.8 people. The average family size was also about the same for all communities, ranging anywhere from 2.9 to 3.2 people. 17
18 Age and Condition of Housing Stock The table below (Age of Housing Stock) illustrates that 34.3% of the housing stock in the Commonwealth of Massachusetts was built prior to World War II. Seven (7) communities within the Montachusett Region have a higher percentage than the Commonwealth; Devens (62.5%), Athol (50.1%), Fitchburg (46.6%), Clinton (43.3%), Royalston (42.6%), Petersham (42.1%), and Gardner (41.4%). Even though some communities have a lower percentage of pre-1940 units than the state, many of those residential dwellings probably would not meet the State s current building code or pass muster with the local Building Inspector. Regardless, there are about 32,679 housing units within the Montachusett Region that were built prior to A newer housing stock is much more likely to be in better structural condition. Furthermore, lead paint was prohibited in 1978 and many homes constructed prior to 1978 contain lead - a majority of the regions housing stock was built prior to In terms of Age of Housing Stock in Devens, the following supplemental information (by street name, year built, and type of housing) was provided by Devens Enterprise Commission: Auman Street Constructed (single family bungalows) Bates Street Constructed 1940 (5-unit multifamily housing) Elm and Walnut Constructed (single family 2-story Officers Housing) Elm and Walnut Constructed 1940 (5-unit multi-family housing) Walnut Constructed (single family ranches) Adams, Cavite and Bates Constructed Net-Zero Energy housing (single family and 3-unit multi-family) 18
19 Table H-7: Age of Housing Stock Community Number of Units 1939 or Older Percent 1939 and Older Ashburnham % Ashby % Athol 2, % Ayer 1, % Clinton 2, % Devens % Fitchburg 8, % Gardner 3, % Groton % Harvard % Hubbardston % Lancaster % Leominster 5, % Lunenburg % Petersham % Phillipston % Royalston % Shirley % Sterling % Templeton % Townsend % Westminster % Winchendon 1, % Massachusetts 965, % Source: 2014 American Community Survey (ACS) Foreclosures The housing downturn significantly impeded the housing market nationally starting in 2005 and led to a dramatic increase in foreclosures and vacancy rates across the Country, the Commonwealth of Massachusetts, and the Montachusett Region. However, the region has been recovering albeit slowly. According to a 2007 report titled Foreclosures Bankruptcies Subprime Lending by MRPC and Rich Campden, there were 585 Petitions to close throughout the Montachusett Region in the year The highest Petitions to Close were in the communities of Fitchburg (101), Gardner (44), Leominster (44) and Athol (30). Now, according to the Warren Group, over the last year (June 2015 to June 2016) within the Montachusett Region, there were 169 Petitions to Close with the most located in Fitchburg (36), Leominster (33), Gardner (16), and Athol (14). There have been no known Petitions to Close in Devens over the last year. 19
20 While the region is beginning to recover, it still faces a high number of foreclosed properties and the challenges of the impacts of foreclosures on neighborhoods and communities in terms of declining property values and physical deterioration; crime and social disorder; and local government financial stress and the decline of services. Foreclosures affect the vacancy rate throughout the region dramatically. The 2010 Census homeowner vacancy rate for Devens was about 1.1% and the rental vacancy rate was about 5% which is lower than most Montachusett Communities. Median Sale Price As reported by the Warren Group (See Table Below), the median selling price for a single family home in Massachusetts in 2015 was $340,000. This represented a % increase from the 1995 average of $145,000. Within the Montachusett region, the median sales price increased from 1995 to 2015 by 91.39% (less than the state as a whole but still a positive change). The period from 2005 to 2010 saw the region suffer a decrease in median sales prices of 23.74%, almost 7% greater decline than the Commonwealth. Comparing homes sales prices from 2010 to 2015, a turnaround was seen for 19 of the 23 communities of the Montachusett Region. These municipalities, including Devens, had experienced a negative change, i.e. decline in median sales prices, from 2005 to 2010 but experienced a modest to large increase from 2010 to Three communities, Ayer, Petersham, and Templeton continued to see a decline in sales prices with Ayer being the only community that had seen an increase from 2005 to 2010 that now experienced a decline. Harvard and Groton continue to lead the region in average sales price surpassing $400,000. Devens has the third highest median sales price in the region at $310,380. One new community (Shirley) surpassed the $300,000 level in 2015, while Athol remains the lowest median price in 2015 but did see their average surpass the $100,000 level going from $99,450 in 2010 to $122,000, a 22.67% increase. In general, Montachusett communities situated in the east are more likely to have a higher median sales price than those situated in the west. 20
21 Table H-8 Median Sales Price by Calendar Year in the Montachusett Region Community % Change Ashburnham $105,000 $135,000 $258,000 $196,000 $196, % Ashby $99,000 $153,500 $275,000 $186,000 $196, % Athol $67,250 $82,300 $179,900 $99,450 $122, % Ayer $139,450 $189,950 $335,000 $343,940 $315, % Clinton $150,000 $150,000 $272,500 $190,000 $211, % Fitchburg $85,000 $119,000 $213,950 $141,000 $165, % Gardner $85,500 $124,000 $219,000 $149,950 $165, % Groton $240,000 $360,000 $472,000 $404,000 $431, % Harvard $285,000 $447,500 $620,000 $507,000 $537, % Hubbardston $112,500 $173,700 $256,250 $201,250 $253, % Lancaster $142,250 $210,000 $337,456 $269,950 $288, % Leominster $112,000 $150,000 $264,000 $207,000 $219, % Lunenburg $124,500 $195,000 $302,000 $224,500 $249, % Petersham $156,000 $175,000 $264,000 $240,000 $232, % Phillipston $91,200 $114,500 $252,500 $125,100 $176, % Royalston $78,900 $110,000 $182,950 $134,750 $168, % Shirley $129,500 $193,900 $340,000 $247,000 $310, % Sterling $174,005 $240,000 $329,900 $272,800 $274, % Templeton $92,900 $130,000 $241,025 $173,000 $167, % Townsend $125,000 $179,950 $288,950 $224,900 $252, % Westminster $112,500 $159,950 $298,000 $210,000 $245, % Winchendon $87,250 $115,000 $214,000 $145,800 $173, % Region $127,032 $177,648 $291,654 $222,427 $243, % Massachusetts $145,000 $215,000 $355,000 $295,000 $340, % Devens Not Not Available Available $390,375 $260,000 $310,380 N/A Source: The Warren Group Affordable Housing In 1969, the Legislature enacted M.G.L. Chapter 40B with the goal of increasing the amount of affordable housing in communities throughout the Commonwealth. It contains two major components that are meant to assist developers who wish to build housing that meets the affordable housing criteria as outlined within the law. The first component is the Comprehensive Permit process, where several local permits are consolidated into a single application to the Zoning Board of Appeals (ZBA). The ZBA is authorized to grant waivers from zoning and other local regulations to make a project economically viable. The second component gives developers the right to appeal ZBA decisions to the Massachusetts Housing Appeals Committee (HAC) in communities where the percentage of subsidized housing units falls below 10% of the community s year-round housing units. 21
22 A project must contain at least 25% affordable housing to be eligible for a Comprehensive Permit. Comprehensive permits have caused great concern in many Massachusetts communities because they strip cities and towns of their local land use control and sometimes result in developments that are poorly sited in remote or environmentally sensitive areas. On the other hand, they have also resulted in the creation of thousands of units of much-needed affordable housing statewide. In general, housing with a government subsidy contributes to the inventory. At the present time, there are concentrations of subsidized housing (Fitchburg, Clinton, and Gardner), but only the City of Gardner exceeds the 10% threshold while Ashby and Petersham have none (See Table Below). While the average home sale price and average contract rent in the majority of the Montachusett Region does provide opportunities for some affordable housing when numbers are compared statewide, there is a need for more. There are concentrations of affordable housing within the Montachusett Region that can be found in Clinton, Fitchburg, Gardner and Leominster. No affordable housing units can be found in Ashby or Petersham. In Devens, about 18.57% of the housing stock is subsidized (there are 140 existing single and multi-family housing units with a total of 26 low-income Local Initiative Program (LIP) units). Thirteen affordable housing units at Devens are located within Harvard s borders which contribute to the Town of Harvard s percentage of subsidized housing units in the table below. There are also 124 units of approved new housing in Devens, none of which has been completed yet. In 2015, Emerson Green was approved. This is a 124-unit development of single family homes and duplexes for sale and multifamily homes for rent, configured in a traditional neighborhood design (compact lots, sidewalks, shared public space, and rear entry driveways). Twenty-eight of the new units (or about 22.58%) will be affordable. Therefore, once this new housing is completed, Devens will have a total of 264 units of housing, with 54 low and moderate income restricted units comprising about 21% of the housing stock. Homelessness in the urbanized areas of the Montachusett Region is a serious issue. In terms of the special needs populations served in Devens, there are 14 units of veterans housing (included in the 282 units housing cap under Devens by-laws) and 13 units for homeless women s shelter which is not included in the housing cap. Factoring in the special needs housing; Devens has about 26% affordable housing (for the purposes of meeting the Reuse Plan Goal of 25%). Devens is also home to the Federal Shriver Job Corps training facility (housing up to 170 males and 102 females) and the Federal Bureau of Prisons Federal Medical Center Devens. 22
23 Table H-9: Subsidized Housing Units as of December 5, 2014 Total Total Subsidized Year Round Development Housing Units Units 2010 Units (SHI) Percentage of Subsidized Housing Units Community Ashburnham % Ashby % Athol % Ayer % Clinton % Fitchburg % Gardner % Groton % Harvard % Hubbardston % Lancaster % Leominster % Lunenburg % Petersham % Phillipston % Royalston % Shirley % Sterling % Templeton % Townsend % Westminster % Winchendon % Source: Department of Housing and Community Development Chapter 40B Subsidized Housing Inventory (SHI) 23
24 Section 4: TRANSPORTATION / CIRCULATION Introduction This section examines the roadway and rail systems that service Devens and the Region. Each system is described and key findings concerning traffic volume, congestion, pavement condition are provided. Future potential improvement projects and project cost are also provided. Roadway System 1) Existing Network The Montachusett Region (Region) is served by several state numbered routes that provide accessible links to all of the Region's communities and Devens. Of greatest importance to the area is Route 2, running east-west throughout the entire Region. This limited access roadway provides the area with a direct link to Boston to the east and to the western half of the state and New York to the west. Consequently, this highway is a major thoroughfare for the state as well as for the Region. The Region's major urban communities, Fitchburg, Leominster and Gardner border Route 2. The section of Route 2 from Phillipston to Athol in the MRPC Region has, in the last decade, undergone improvements. Significant improvements to date include construction of climbing lane, intersection improvements, a truck weigh station in Athol and installation of an innovative centerline treatment called "Qwick Kurb" along 13 miles of highway in Phillipston and Athol. Throughout the Region traffic on Route 2 has fluctuated in the last 15 years. High volumes in the mid-2000 s have since declined but have rebounded in recent years. The completion of I-190 in the early 1980's added a second major limited access highway to the Region. This roadway provides direct access to Worcester, I-290 and the Massachusetts Turnpike South of the Region. Since its opening, traffic on I- 190 has increased steadily throughout the Region. This highway has helped to reduce through traffic volumes on Route 12 by providing easier access to the Worcester area. 2) Functional Classification The process by which highways and roads are grouped into classes or systems is known as functional classification. Roads are grouped according to the type of service they are intended to provide. Most travel involves movement through a network of roads; functional classification helps to define the part a roadway plays in serving the flow of trips. Classification is divided into principal arterials, minor arterials, major collector roads, minor collector roads, local roads and streets. The three general categories of functional classification are: Arterials: Arterials provide the highest level of mobility at the greatest vehicular speed for the longest uninterrupted distances and are not intended to provide access to specific locations. Arterials are further subdivided into Principal Arterials and Minor Arterials. Collectors: Collectors provide some level of both mobility and access. They collect traffic from local roads and funnel it to arterials. In rural areas, collectors are further subdivided into Major Collectors and Minor Collectors. 24

25 Local roads: Local roads provide access to abutting land with little or no emphasis on mobility. The term local road should not be confused with local jurisdiction. Most, though not all, functionally classified local roads are under city or town jurisdiction. Economic Impact of Devens (EID) MassDOT Urban Boundaries & Roadway Functional Classification This classification is further divided into urban and rural areas. In the past, the urban areas were defined as having a population of 1,000 persons per square mile within a given census block. After the 2010 Census the Urban Boundaries in the Region have expanded, and additional areas have been classified as Urban by MassDOT and MRPC depending on the nature of the roadway, increasing the total number of roadways classified as urban since Within the Region, fully urban areas include Fitchburg, Leominster, Gardner, Ayer, Winchendon and Clinton as well as portions of Ashburnham, Ashby, Athol, Templeton, Westminster, Sterling, Lancaster, Lunenburg, Townsend, Shirley, Groton and Harvard. The remaining areas of the Region are designated Rural (see the MRPC Urban Areas and Road Functional Classification map above). The following table is derived from the latest MassDOT Road Inventory File (2014) and indicates approximate roadway miles for each Functional Class including Rural and Urban Classifications in the Region. Devens roads are not included in the inventory for the region. 25

26 ROAD MILES CENTERLINE MILES URBAN RURAL Total Interstate Arterial Collector Local Total Interstate Arterial Collector Local Total Interstate Arterial Collector Local Total Ashburnham Ashby Athol Ayer Clinton Fitchburg Gardner Groton Harvard Hubbardston Lancaster Leominster Lunenburg Petersham Phillipston Royalston Shirley Sterling Templeton Townsend Westminster Winchendon TOTAL , , , Economic Impact of Devens (EID) Federal Aid Eligible Roads 26
27 There are approximately 666 miles of federal aid eligible roads in the Region (see Federal Aid Eligible Roads map above), of which 159 miles are National Highway System (NHS) roads, and 507 miles are Surface Transportation Program (STP) roads. NHS roadways represent all Interstate roadways such as I-190, and I-495 along with a systematic network of principal arterials such as Route 2 and parts of Routes 12, 140 and 2A. STP roadways include all other numbered routes as well as all urban arterials, urban collectors and rural arterials. The following table is a breakdown of federal aid eligible miles in each community. Federal CENTERLINE Aid Eligible Roads Centerline MILES Miles NHS STP TOTAL FED-AID Local Total Ashburnham Ashby Athol Ayer Clinton Fitchburg Gardner Groton Harvard Hubbardston Lancaster Leominster Lunenburg Petersham Phillipston Royalston Shirley Sterling Templeton Townsend Westminster Winchendon TOTAL , ,
28 There are 91 miles of paved roads in Devens but none of the roads are eligible for Federal Aid. These roads provide access to neighboring communities and to Route 2 through the Jackson Road interchange. Traffic Volume and Congestion Congestion occurs at intersections and along road segments throughout the Region which adversely impact commuter travel, the efficient movement of goods and air quality. The following areas of congestion were identified through local knowledge, public input from surveys, MRPC studies, identified bottlenecks and various technical data sources. Traffic volume for Devens is reported through the Devens Traffic Monitoring Program (see Pages 31-33). 1) Findings of Traffic Studies Congestion in the following corridors/locations tends to create the greatest impacts to traffic flow in the Region. Inadequate geometrics, right-of-way issues and improper signal timings and/or phases result in poor vehicle flows and in many cases unsafe conditions. Concerns will range from local intersections and corridors to congestion on regionally important highways such as Route 2. There are no existing congestion issues on Devens roads or at the Jackson Road interchange. Devens Reuse Plan Although no real congestion issues exist at Devens, this plan recommends several roadway improvements. Major roadway improvements have been completed to the Jackson Road interchange on Route 2. Some of the interchange improvements included reconstruction of the existing Jackson Rd to Route 2 westbound onramp, minor widening and median reconstruction on Route 2, removal of the existing Jackson Road to Route 2 eastbound off-ramps and the existing Route 2 eastbound on-ramp from the South Post, and reconstruction of the South Post Access Road. Jackson Road within Devens has been widened for improved access to Route 2. Route 2, Harvard to Gardner Connections to nearly all major routes in the Region exists on Route 2. Improvements and maintenance are vital along the entire stretch of Route 2 to maintain its usefulness and move commuters. There is still a need for an increased investment to maintain Route 2. The possibility of the section of Route 2 between I-495 and I-190 being incorporated into the interstate system due to its natural connection between these two major routes has been discussed. Route 2A, Ayer (from Park St (Routes 2A/111) to the Littleton town line) - Peak hour traffic suffers from slow travel speeds along the Main Street segment through the downtown area due to side street traffic, on-street parking, an MBTA Commuter Rail stop downtown and narrow lanes. A notable intersection in this corridor is Park Street (Routes 2A/111) and Main Street. Park Street traffic looking to continue onto Route 2A east/111 south must stop and wait for a gap in traffic on East Main Street/Main Street which results in long peak hour delays from this approach. 2) Key Findings from Continuous Count Stations in Region The following tables list average daily traffic volumes from MassDOT continuous count stations on major routes (Route 2 and I-190) in the Region going back to From these tables the following patterns can be seen. After peaking in the mid-2000 s, traffic on Route 2 west of I-190 (i.e. Route 2 Westminster East of Route 140 and Route 2 Athol East of Orange TL)has since decreased and now steadied at the pre-recession levels of 15 years ago. 28
29 Route 2 on the eastern edge of the Region has seen traffic decrease since highs of over 50,000 vehicles daily 15 years ago and has fluctuated slightly over the last 10 years. However, traffic at the Jackson Road gate have increased from 3,578 in 1996 to 13,340 in 2015 vehicles daily since Devens has opened for a 240% increase. Steady increases are seen in volumes throughout I-190 in the Region and in the immediate vicinity of I-190 on Route 2 in the Leominster/Lancaster area. Route 2 Littleton East of Harvard Town Line MassDOT Continuous Count Stations Route 2 Lancaster West of Route 70 Route 2 Westminster East of Route 140 Route 2 Athol East of Orange TL Year Volume Annual Growth Year Volume Annual Growth Year Volume Annual Growth Year Volume Annual Growth ,642 2% ,847 1% ,614 2% ,615-2% ,692 0% ,113 1% ,880-5% ,826-5% ,569-3% ,476-3% ,088-2% ,385 1% ,100-3% ,104 1% ,000 1% ,274-23% ,540-1% ,435 5% ,770-1% ,711 37% ,803 0% ,806 1% ,999 3% ,740-2% ,800 8% ,186-1% ,887-1% ,003-2% ,112-2% ,800 6% ,172-2% ,202 0% ,229-1% ,104-3% ,991-1% ,180 0% ,900-6% ,433 2% ,257 3% ,127 1% ,022-1% ,454 0% ,168-1% ,967 2% ,603 1% ,457 1% ,663 4% ,800 4% ,000 5% Total Growth: 11.9% ,923 4% ,415 2% Total Growth: -6.7% Total Growth: -0.8% Total Growth: 1.9% I-190 Leominster North of Route 117 I-190 Sterling North of Route 12 I-190 Sterling North of Route 140 I-190 Sterling South of Route 140 Year Volume Annual Growth Year Volume Annual Growth Year Volume Annual Growth Year Volume Annual Growth ,399 0% ,322-1% ,586-1% ,625-1% ,239 1% ,819 9% ,764 0% ,058 1% ,774-1% ,080 3% ,802 3% ,629-1% ,293 1% ,131-10% ,003-3% ,026 2% ,792 4% ,735 8% ,050-13% ,483 3% ,272 8% ,180-1% ,782 21% ,398-1% ,149-6% ,612-2% ,524 0% ,653 6% ,503 1% ,168 2% ,537 1% ,722 6% LANCASTER- BRIDGE REPLACEMENT, L , JACKSON ROAD OVER ROUTE 2 This functionally obsolete bridge has an AASHTO rating = The vertical clearance over route 2 is insufficient at 14'-3" and has resulted in repeated collision damage. Replacement of the superstructure is proposed ,154 0% ,646-9% ,290 0% ,919-19% ,168 4% ,700 27% ,300 4% ,300 0% ,579 0% ,000 0% ,078 4% ,200 12% ,700 9% ,000 12% ,965 1% ,600 30% ,548-3% ,100-1% ,800 4% ,500-8% Total Growth: 21.5% Total Growth: 36.7% Total Growth: 14.1% Total Growth: 38.8% 29

30 3) Devens Traffic Monitoring Program: Year Traffic Report Summary As part of the 1995 Devens Final Environmental Impact Report (FEIR), issued by the United States Department of the Army, MassDevelopment committed to a traffic monitoring square feet, and a daily vehicle trip program at select locations to identify trends in traffic patterns and traffic volumes in the adjacent communities. The Devens Base Reuse Plan limited development to 8.5 million threshold of 59,265 trips was calculated based on projected development levels in the EIR. The 2015 study is the fourth 5 year Traffic Monitoring Report (Report). Data Collection The study area for the Report includes Devens which is of parts of Ayer, Shirley, Harvard, and Lancaster (see map below) and the surrounding towns of Boxborough, Groton, Littleton, and Lunenburg are included in the study area as potential impact communities. Devens Monitoring Program Study Area 30

31 Key Findings Traffic data were collected in the study area in order to develop an understanding of traffic operations at critical roadways and intersections within the study area. To evaluate the 2015 conditions, the traffic volume data and the results of the capacity analyses were compared to those from previous Reports. The findings are summarized below: Collectively, the traffic volumes on roadways external to Devens have experienced a decrease of 9% in traffic volumes when compared to the 2010 volumes. Additionally, the 7 day traffic volume trends show that the traffic volumes along Route 2 in the vicinity of Devens appear to have peaked in 2004 and have been steadily declining since. This indicates that while Devens continues to generate more traffic each year, roadways external to Devens are experiencing a decrease in traffic volumes. Weekday traffic volumes at all Devens Gates have increased by 11% since 2010 (see figure below). Grant Road Gate has seen the largest increase of 39% (+587 vehicles per day). Prior to 2010, traffic growth had been stabilizing. On a daily basis, the distribution of traffic throughout the gates (which are used to access Devens) has remained constant, with Jackson at 47%, Barnum at 20%, Verbeck at 19%, Grant at 8%, and Shirley at 6%. Overall, average weekday daily truck traffic has increased by 55% (+1,149) per day since % of truck traffic passes through Jackson Gate (55%) and Barnum Gate (30%). Truck traffic in Devens has increased at all gates with the exception of Verbeck Gate, which experienced a 51% decrease in truck volume. Grant and Jackson Gates experienced the most significant increases in truck traffic, having seen increases of 123% and 121% respectively. 31
32 Occupied development in Devens has increased 1.05 million square feet from 3,662,758 square feet in 2010 to 4,708,099 square feet in Estimates say that existing Devens developments should generate 37,207 vehicle trips on weekdays. The actual traffic counts at the gates indicate an average weekday daily traffic volume of 18,718 vehicle trips in This means that Devens is currently generating traffic at a rate of 50% of what was estimated for projects a comparable development would generate. In 2010, results indicated that Devens was generating traffic at a rate of 53% of what a comparable development would generate. For future growth at Devens the Report utilized a yearly build out projection of 225,000 square feet per year. Using that rate, measured traffic volume data, and current development, it is estimated that 59,625 vehicle trips would be reached by However, that threshold is not expected to be reached until 2042 due to the implementation of Traffic Demand Management Strategies (TDMS) during that time period. The goal of the TDMS is to reduce overall traffic volumes by 7.5%. The assumed occupied development would be 10,109,900 square feet. Based on the review of the past 20 years of data, traffic in the regional roadway network has remained steady or in some instances decreased. Trips associated with the development of Devens have increased less than anticipated, resulting in minimal impacts on surrounding roadways and intersections. Pavement The Pavement Management Program (PMP) at the MRPC consists of surveying all federal aid eligible roadways in the Region for the purpose of collecting, maintaining and evaluating pavement condition data for use in transportation planning and project decision making. NHS roads are regularly surveyed by MassDOT. STP roadways, which include all other numbered routes as well as all urban arterials, urban collectors and rural arterials, are surveyed mostly by the MRPC, MassDOT also regularly collects data on all numbered routes. 1) Pavement Management at MRPC The principal intention of having a PMP at MRPC is for the purpose of including the data in our Transportation Evaluation Criteria (TEC). TEC uses criteria such as pavement condition and safety to rank eligible highway projects. Every eligible project receives a TEC score and the whole universe of eligible projects is then ranked from the highest to the lowest score. TEC is a data driven process that is used when putting together documents such as the Transportation Improvement Program (TIP), an annual prioritized listing of transportation and transit projects proposed for implementation during future federal fiscal years for the Region. In the Region the pavement management program will help, along with other programs and data, to develop a more accurate prioritization of transportation needs, and to balance those needs with available funding. Pavement Management Systems (PMS) can be viewed at both network and project levels. In a network level PMS an entire network is analyzed to determine which maintenance tasks should be funded. In a project level PMS, individual projects are studied to determine to what extent the roadway needs attention. The MRPC s approach reflects some aspects of each of these levels. Pavement data from the entire federal aid network in the Region is maintained; this data is gathered along with other evaluation criteria and considered when looking at project level programs such as the TIP. Although both levels will be involved and the same data will be collected and analyzed, the MRPC s use of a 32
33 PMS may differ from a typical municipality s because it will take more of a project level approach as opposed to a municipality s network level approach. While a city or town Department of Public Works plays the role of a road manager, the MRPCs desire is to better understand the transportation system of the Region and its needs. 2) The Roadway System Of the approximately 2,091 miles of roads in the Region, approximately 507 miles are STP eligible roadways and 159 miles are NHS eligible roadways. This represents 31% of the Regions road miles. The remaining 1,425 miles (69%) are state and local aid eligible roads. Devens roads are not STP eligible. They are defined as follows: NHS all interstate roadways and a systematic network of principal arterials spanning the state. In addition, roads connecting the NHS roadways to military bases (known as the Strategic Highway Network) are also considered part of the NHS network. NHS passenger and freight terminals are connected by roadways called NHS connectors. STP comprised of any functionally classified roadway not part of the NHS network. STP funded roadways include all urban arterials, urban collectors and rural arterials. According to previous funding legislation, rural collectors are STP eligible, but have a limitation on the STP funding amount. State and Local Aid includes Chapter 90 and other non-federal Aid categories. Roadways that fall under this category are comprised of roads functionally classified as local roads. As stated above, rural collectors are STP eligible but have a funding limitation. The Section 1 Federal Aid Eligible Roads Centerline Miles table provides a breakdown of roads by community by their aid eligibility, NHS, STP or State Aid/Local. The State Aid/Local figures include those rural collector miles that may also be STP eligible. 3) Regional Pavement Conditions The structural conditions of the majority of the Federal Aid eligible roads are determined by MassDOT and MRPC pavement surveys. The condition is expressed by assigning either a Pavement Serviceability Index (PSI) number from 0 to 5 or a Pavement Condition Index number from 0 100(PCI) to segments along the roadway. PSI (MassDOT method) and PCI (MRPC method) is an overall rating of the pavements condition. Conditions are rated as Excellent, Good, Fair and Poor. The following table shows a general correlation between PSI and PCI, condition, repair strategies and associated cost. This average cost has been determined from consultation with MassDOT and other Regional Planning Agencies throughout the State. Pavement Condition Cost Breakdown PSI PCI Condition Associated Repair Repair Cost Per. Sq. Yard Poor Reconstruction $ Fair Rehabilitation (Mill/Overlay) $ Good Preventative Maintenance $ Excellent Routine Maintenance $
34 Regionwide Utilizing this information a general condition of the Region s Federal Aid eligible roadway network can be developed. The following table provides the pavement condition on federal aid eligible roads in the Region. These federal aid miles are further broken down by Local and State Jurisdiction. Please note that due to the time frame between data collection and report preparation, conditions of the roadways may change. Additionally, mileage listed in the following chart may not reflect mileage listed on the Total Fed-Aid Miles column of the Centerline Miles table above as a small percentage of roads not eligible for federal aid are included. Therefore, this information should be viewed in general terms regarding needs and condition. Pavement conditions within Devens have not been determined since there are no Federal Aid Eligible roads within Devens. Pavement Condition Federal Aid Eligible Roads State Juristiction Local Jurisdiction Combined Miles Square Yards Cost Miles Square Yards Cost Repair Category Miles Square Yards Total Excellent $1,177, $659,694 Routine Maintenance $1,837,329 Good $4,254, $21,906,079 Preventative Maintenance $26,171,077 Fair $15,682, $24,201,538 Rehabilitation $40,317,617 Poor $17,346, $79,823,904 Reconstruction $97,170,129 Total $38,460, $126,591,214 Total $165,496,152 Contact the MRPC for the most recent pavement related TIP projects. developed for Devens. No projects have been 4) Funding Other Pavement Projects Region Wide The difference in condition between Local and State Jurisdiction federal aid roads may mainly be a combination of two factors, the first being that federal aid roads that are State Jurisdiction are a higher Functional Classification than those that are Local Jurisdiction, giving them higher importance when prioritizing projects for funding and the second being the funding available to Municipalities for roadway maintenance (Chapter 90) lagging behind the rising price of such maintenance. Below is a table showing the Chapter 90 allocations each community in the Region received in FY 2015 along with the roadway mileage that that money must maintain. Devens does not receive Chapter 90 funds. Pavements are often the single largest expense in any municipal road maintenance budget. Chapter 90 allocations often do not provide sufficient funding to maintain local roads at the current condition let alone make major improvements. Due to inadequate funding it is recommended that communities routinely target funding for federal aid eligible local roadways through the Transportation Improvement Program (TIP). It is also encouraged that a Pavement Management Plan be implemented by communities to keep on track of maintenance needs and schedules to contribute to a cost effective approach to maintaining roadways. 34
35 Municipality Local Jurisdiction Miles (Fed Aid and Non-Fed Aid eligible) Other Jurisdiction Miles FY 2014 Ch. 90 Apportionment FY 2015 Ch. 90 Apportionment % Change ASHBURNHAM $347,094 $346, % ASHBY $229,864 $230, % ATHOL $501,524 $500, % AYER $273,808 $244, % CLINTON $331,865 $329, % FITCHBURG $1,132,263 $1,129, % GARDNER $601,894 $603, % GROTON $504,768 $506, % HARVARD $309,298 $340, % HUBBARDSTON $363,965 $362, % LANCASTER $313,136 $312, % LEOMINSTER $1,088,720 $1,081, % LUNENBURG $422,130 $420, % PETERSHAM $256,680 $256, % PHILLIPSTON $190,959 $189, % ROYALSTON $285,922 $285, % SHIRLEY $252,643 $252, % STERLING $418,357 $418, % TEMPLETON $342,945 $339, % TOWNSEND $426,174 $425, % WESTMINSTER $413,641 $419, % WINCHENDON $448,188 $447, % REGIONWIDE 1, $9,455,838 $9,443, % Other Transportation Systems 1) Rail Infrastructure The rail system in Massachusetts consists of 1,153 miles of tracks that carry both freight and passenger services. There are thirteen freight railroads that operate in Massachusetts. The four largest railroads are 1) CSX Transportation, 2) Pan Am Southern (PAS) Railways, 3) Providence & Worcester (P&W) Railroad, and 4) New England Central Railroad. The first three operate in the Region and the rail lines that they utilize are shown on the map that follows. 35
36 Economic Impact of Devens (EID) Active Rail Lines & Freight Yards Rail Freight Miles in the Region The following table summarizes the approximate miles of track owned by each rail operator in the Region. See the Active Rail map above for the freight rail carriers. PAS service Devens. CSX also services Devens through an operating agreement with PAS. Operator Rail Line Mileage CSX 20.7 PAS P&W 25.2 Total Freight Yards The existing freight yards that service the Region and beyond are shown on the map above. The Intermodal Yard (Yard) services Devens and is located at 133 Barnum Road in Ayer. The Yard handles mostly containers and trailers and is owned by Norfolk Southern, Norfolk, Virginia. 36
37 Highway Projects and Estimated Project Cost 1) Estimating the Cost In order to establish the potential project cost, MassDOT cost estimates for various improvement strategies are utilized. The table below lists the MassDOT cost estimates for improvement projects: Improvement Unit Cost New Signalized Intersection with minor curb work and paving (no geometrics) $200, ,000 / intersection Geometric Improvements - Urban $750,000-1,000,000 / intersection - Rural $500, ,000 / intersection New Highway (w/o ROW costs, bridges or interchanges) $2,000,000-4,000,000 / lane / mile Add a lane to existing highway (w/o ROW costs, bridges or interchanges) $4,000,000-5,000,000 / lane / mile Add an HOV lane (concurrent flow, no bridges) $1,500,000-2,000,000 / lane / mile Highway resurfacing - Interstate $250,000 / lane / mile - Non-interstate $150,000 / lane / mile (including average associated drainage work, striping improvements, etc.) New Bridge - < 2,000 sq. ft. $350-1,200 / sq. ft. - 2,000-5,000 sq. ft. $300-1,100 / sq. ft. - 5,000-10,000 sq. ft. $ / sq. ft. - > 10,000 sq. ft. $230-1,000 / sq. ft. - Highway approach work Calculate total, then add 10% - Contingencies Add 35% to running total Bridge Restructuring/Rehabilitation 60% of final cost calculation for new bridge New Bike Path (w/o ROW costs, lighting or crossings) $600,000 - $1,500,000 / mile Pavement Repair Strategies - Routine Maintenance $0.75 / sq. yard - Preventative Maintenance $8.50 / sq. yard - Rehabilitation $18 / sq. yard - Reconstruction $45 / sq. yard 2) Future and Under Construction Infrastructure Projects There are two MassDOT infrastructure projects in the Region that will directly impact Devens. Bridge Replacement Jackson Road over the Nashua River: This bridge is at the southerly gateway to the Devens just north of Route 2. The bridge over the Nashua River has only one lane in each direction and will be widened. Estimated Project Cost: $4,620,000. Project Status: preliminary design Bridge Replacement - Jackson Road over Route 2: This bridge is under construction and is expected to be completed by the spring of The vertical clearance over route 2 is insufficient and has resulted in repeated collision 37
38 damage. The bridge is being widened to accommodate three lanes. Estimated Project Cost: $4,895,000 3) Nearby Communities Infrastructure Projects There are three MassDOT infrastructure projects in the Region that will benefit Devens. Harvard & Lancaster Reconstruction and Widening of Ramps at Exits 36 & 38 The proposed project consists of widening Route 2 at exits 36 and 38 in Lancaster and Harvard in order to lengthen the acceleration and deceleration lanes of the ramps. Estimated Project Cost: $2,060,000. Project Status: preliminary design Ayer Resurfacing & Related Work on Route 2A (Fitchburg Rd & Park St) The project extends from the Shirley Town line to Brook Street, a distance of 1.5 miles. The proposed improvements include resurfacing with minor widening, minor geometric improvements signal improvements at the intersection of Route 2A and Groton School Road, reconstruction of existing sidewalk and construction of new sidewalks, and improvements to drainage system to improve stormwater quality. Estimated Project Cost: $2,200,000. Project Status: preliminary design Littleton, Harvard & Lancaster Resurfacing & Related Work on Route 2 The proposed project consists of resurfacing Route 2. Estimated Project Cost: $16,390,000. Project Status: preliminary design Future Needs After reviewing various sources that would provide information about future roadway projects within Devens, it has been determined that no roadway projects are needed or under development at this time. However, as reuse of Devens increases, existing roadways will need to be examined for capacity and safety. Existing roads where development takes place may need, or will be, improved to accommodate new commercial or residential developments. 38
39 Section 5: ECONOMIC DEVELOPMENT Introduction The Montachusett Region, settled as early as the 17 th Century, began as small settlements through an era of agrarianism into the age of industrialization and now into the era of information and communications. The physical landscape can be described as typical New England. Our landscape differs from several urban centers with a strong presence of mixeduses (commercial, housing and in some cases industry) with well-established neighborhoods to small, sparsely populated rural communities containing town commons. The population and workforce have weathered changes and have adjusted their work skills to conform to the needs of the business community that drives our regional economy. From 2000 to 2010 the population of the Montachusett Region increased from 228,005 to 236,475 persons (approximately a 3.7% increase). Over the next 25-years the population is expected to grow from 236,475 to 255,000 persons somewhat slower than the past forty years. Residents in the Montachusett region are concentrated in Athol, Winchendon, Gardner, Fitchburg, Leominster, Townsend, Lunenburg, Groton and Clinton. Devens is a planned business community created and funded by the Commonwealth of Massachusetts to be a flagship location for many large companies. Devens has amenities that probably no other municipality in the state has including, but not limited to: Very high MA DEP permitted limits for water and wastewater treatment which makes Devens very attractive to users of significant amounts of water in manufacturing. The second lowest electricity rate in Massachusetts (the lowest can be found in Littleton). Excellent interstate highway access. A campus setting, approximately 65% of its property owners that are commercial and industrial which is the opposite of probably every other city and town in our state. However, the entity runs a deficit each fiscal year and not all firms that approach Devens automatically land within its boundaries. MRPC recommends that stakeholders increase identification of the amenities, assets and positive traits of their respective communities and promote those types of businesses that are more likely to grow in their respective communities. The data and analysis in this Chapter are based on information obtained from the Montachusett Regional Planning Commission, MassDevelopment, Devens Enterprise Commission, Massachusetts Department of Labor and Workforce Development, Massachusetts Division of Unemployment Assistance, the Foster Report, the University of Massachusetts Donahue Institute Report and the U.S. Census Bureau. Census data pertaining to individuals that includes the prison population was not included in this report. 39
40 Assessment of the Study Area s Current Economic Base 1) Education As shown in Table E-1 below, residents with a high school diploma, but no higher education, represent the largest segment of the regional population in terms of educational attainment (30.6%) which is higher than the state. The second largest group (19.5%) has a bachelor s degree, followed by residents with some college but no degree (19.1%). As shown in Table E-2 below, the state percentages reveal how the population in the region compares to the overall state population in terms of educational attainment. As in the region, the largest segment contains those with a high school diploma, but no higher education (25.6%). However, the second largest group is those with a bachelor s degree (22.6%) followed by those with a graduate degree (17.4%). The state data contains higher numbers in the groups at both the upper and lower echelon of the educational attainment spectrum than the regional data since more than 10.5% of the state s population is reported to have less than a high school education more than the rate of the region (9.7%). This could be due in part that more regional residents might be attending a high school level trade school (Montachusett Technical Vocational High School is located in Fitchburg). This makes sense since (according to the American Community Survey Estimates), there are more people working in the construction trades (6.2%) when compared to the rest of the Commonwealth (5.4%). It is a well-known fact that there has been a disproportionate share of job losses in construction during the recession. This impacts the region more than the rest of the Commonwealth and is in part responsible for higher unemployment statistics. There are numerous public school districts within the region educating young persons from prekindergarten through high school and private schools educating residents at approximately the same age levels. The area also has new charter schools. As previously indicated, Montachusett Technical Vocational High School is located in Fitchburg offering trade school curriculum at the high school level. Located in Gardner, Mount Wachusett Community College (MWCC) offers two-year programs while Fitchburg State University offers four-year programs. In addition, there are many private sector educational operators offering training courses. The North Central Massachusetts Workforce Investment Board, Inc. promotes the economic and social welfare of the region through education, employment and training programs that increase employability of young people and adults. The new Job Corps at Devens also increases the chances of young adults to obtain work in the region. 40
41 Table E-1: Educational Attainment by Community: Population 25 years and Over No High School Diploma High School Graduate Some College, No Degree Associate's Degree Bachelor's Degree Graduate or Professional Degree Ashburnham 4.4% 29.7% 18.0% 11.9% 24.1% 11.9% Ashby 6.8% 36.0% 17.7% 14.1% 15.5% 10.0% Athol 15.3% 39.3% 20.0% 10.4% 10.8% 4.2% Ayer 6.3% 29.6% 20.9% 7.0% 23.8% 12.3% Clinton 9.6% 28.5% 18.3% 9.5% 22.6% 11.6% Fitchburg 17.3% 32.7% 19.7% 9.7% 13.9% 6.7% Gardner 15.9% 35.4% 21.4% 9.9% 11.0% 6.4% Groton 2.3% 14.1% 10.9% 6.0% 35.4% 31.3% Harvard 3.6% 16.5% 14.3% 3.2% 28.4% 34.1% Hubbardston 5.8% 34.2% 22.4% 10.9% 15.5% 11.2% Lancaster 10.0% 25.9% 19.3% 10.8% 21.9% 12.1% Leominster 13.2% 31.8% 19.7% 8.9% 18.9% 7.4% Lunenburg 6.9% 27.9% 17.8% 11.8% 25.2% 10.3% Petersham 2.9% 28.8% 19.1% 8.3% 19.0% 21.8% Phillipston 6.1% 39.1% 21.5% 12.9% 13.0% 7.4% Royalston 12.7% 39.9% 20.7% 8.8% 10.5% 7.4% Shirley 16.1% 33.9% 20.4% 5.6% 17.3% 6.8% Sterling 5.4% 22.3% 16.5% 7.2% 28.2% 20.4% Templeton 8.8% 39.6% 22.1% 12.4% 10.7% 6.3% Townsend 4.5% 32.5% 18.9% 9.5% 22.9% 11.7% Westminster 5.5% 22.6% 19.0% 12.0% 26.9% 14.0% Winchendon 13.0% 33.7% 21.4% 12.0% 13.3% 6.7% Massachusetts 10.5% 25.6% 16.3% 7.7% 22.6% 17.4% Source: American Community Survey 5-Year Estimates 41
42 Table E-2: Educational Attainment Montachusett Region, Massachusetts, and United States: Population 25 years and Over No High School Diploma High School Graduate Some College, No Degree Associate's Degree Bachelor's Degree Graduate or Professional Degree Montachusett Region 9.7% 30.6% 19.1% 9.7% 19.5% 12.4% Average Massachusetts 10.5% 25.6% 16.3% 7.7% 22.6% 17.4% United States 13.6% 28.0% 21.2% 7.9% 18.3% 11.0% Source: American Community Survey 5-Year Estimates 2) Median Household Income and Household Poverty Measures of Wealth There are measures of wealth that describe the incomes of local residents and also reflect the health of the local economy: per capita, median household and median family incomes, as well as the percent of people for whom poverty status was determined. Per capita income is equal to the total incomes generated by a population divided by the number of persons in that area. Communities with higher number of persons per household or smaller household incomes would likely have smaller per capita income figures. As shown in Table E-4 below, according to American Community Survey Year Estimate, the per capita income for the State of Massachusetts was $36,441, while that of the region was $32,854, below the State average by $3,587. Per capita income for Devens was not included in this study as it includes the prison population. Another measure of wealth in a community is its median income, which is based on the type of household. In Tables E-3 and E-4, family incomes are differentiated from other household incomes. For example, a single student living alone is considered a household but not a family. From a positive perspective, according to the American Community Survey Year Estimate, region s median household income ($74,797) is more than the state rate ($67,846) but much lower than Devens ($97,222). Region s median family income ($89,006) is also above the state rate of $86,132 but lower than Devens ($98,355). There is also less poverty in the region (9.8%) when compared to the State as a whole (11.6%). Poverty percentage for Devens was not included in this study as it includes the prison population. 42
43 Table E-3: Measures of Wealth by Community Community Median Household Income Median Family Income Per Capita Income Below Poverty Ashburnham $85,662 $102,667 $36, % Ashby $83,917 $89,107 $30, % Athol $47,122 $61,682 $23, % Ayer $67,110 $83,882 $36, % Clinton $64,867 $77,241 $31, % Devens (zip code 01434) $97,222 $98,355 Not available Not available Fitchburg $46,628 $55,363 $22, % Gardner $46,589 $59,137 $23, % Groton $116,686 $133,421 $49, % Harvard $131,563 $150,859 $50, % Hubbardston $83,438 $95,000 $32, % Lancaster $81,833 $98,813 $31, % Leominster $59,263 $78,273 $30, % Lunenburg $71,055 $81,294 $36, % Petersham $65,625 $90,446 $32, % Phillipston $78,490 $81,685 $30, % Royalston $60,568 $67,875 $27, % Shirley $66,453 $78,398 $25, % Sterling $90,455 $117,517 $41, % Templeton $68,929 $84,537 $28, % Townsend $82,674 $95,991 $36, % Westminster $87,273 $96,961 $36, % Winchendon $59,332 $77,990 $27, % Massachusetts $67,846 $86,132 $36, % Source: American Community Survey 5-Year Estimates Any effort to increase economic activity in the region should focus on increasing wages and creating new jobs for the region s labor force. There are some ways in which economic development efforts can support these goals. They include attracting and retaining businesses with good-paying jobs; stabilizing residential property tax rates; encouraging local entrepreneurship, and providing social services, such as subsidized daycare and pre-schools to support single-parent families and households with two working parents. 43
44 Community Table E-4: Measures of Wealth: Montachusett Region, Massachusetts, and United States Median Household Income Median Family Income Per Capita Income Below Poverty Montachusett Region $74,797 $89,006 $32, % Average Massachusetts $67,846 $86,132 $36, % United States $53,842 $65,443 $28, % Source: American Community Survey 5-Year Estimates Consumer Price Index In United States, the cost of living (also known as the Consumer Price Index) increased % from 1995 to (Source: U.S. Bureau of labor Statistics CPI Inflation Calculator). Profile of Employment and Employers While the region may enjoy the highest concentration of manufacturing jobs in the Commonwealth, this sector has been experiencing decline for decades consistent with state and national trends. Regional cooperation and independent economic planning and implementation initiatives have led to the growth of the regional tourism industry (agriculturaltourism, eco-tourism and historic tourism). The Montachusett Region is within commuting distance for many people working in the metropolitan Boston, Metropolitan Worcester, Metropolitan Greenfield and Southern New Hampshire Region. The growth in regional population is clearly linked to the stabilization and growth of jobs in the home construction trade. While an increasing population has raised the levels of income, education and skills of the regional workforce, continued housing construction has strained many services offered by municipalities such as schools and public safety. 1) Employment and Unemployment As shown in Table E-6 below, the unemployment rate of the Montachusett region was higher than the national rate in 1995, 2002 through 2009 and 2013 through The unemployment rate of the Montachusett region was higher than the state rate from 1995 through The unemployment rate for the Montachusett Region peaked in 2010 at 9.6%, and has slowly declined since, with unemployment at 6.5% as of However, this is still higher than the state and national averages suggesting that Montachusett residents have been more prone to layoffs when the state and national economy declines. Unemployment rate for Devens was not included in this study as it includes the prison population. 44
45 Table E-5: 2015 Community Labor Force Labor Force, Employment Numbers and Unemployment Rate by Community Community Labor Force Employed Unemployed Unemployment Rate Ashburnham 3,538 3, % Ashby 1,842 1, % Athol 5,672 5, % Ayer 4,055 3, % Clinton 8,095 7, % Fitchburg 19,264 17,933 1, % Gardner 9,535 8, % Groton 5,871 5, % Harvard 2,645 2, % Hubbardston 2,470 2, % Lancaster 3,902 3, % Leominster 21,737 20,451 1, % Lunenburg 6,197 5, % Petersham % Phillipston % Royalston % Shirley 2,811 2, % Sterling 4,236 4, % Templeton 4,284 4, % Townsend 5,311 5, % Westminster 4,325 4, % Winchendon 5,477 5, % Massachusetts 3,570,000 3,392, , % Source: MA Department of Labor and Workforce Development Labor Force and Unemployment Data, Calendar Year 2015 (Not Seasonally Adjusted) Region s unemployment rate is closely tied to that of the state and the nation as a whole, both of which saw similar increases in unemployment. However, it should be noted that while region s unemployment rate seems to be more comparable to Worcester County, it has been consistently higher than that of the state, suggesting that region s residents have been more prone to layoffs than the state as a whole. 45
46 Table E-6: Unemployment Rate: US, Massachusetts, Worcester County, Middlesex County and the Montachusett Region Annualized Labor Force and Unemployment Rates Montachusett Region Worcester County Middlesex County % 5.2% 4.3% 5.3% 5.6% % 4.4% 3.3% 4.4% 5.4% % 3.9% 2.9% 3.9% 4.9% % 3.4% 2.4% 3.3% 4.5% % 3.4% 2.5% 3.2% 4.2% % 2.7% 2.2% 2.7% 4.0% % 3.9% 3.3% 3.7% 4.7% % 5.6% 5.0% 5.3% 5.8% % 6.1% 5.2% 5.7% 6.0% % 5.5% 4.4% 5.1% 5.5% % 5.2% 4.1% 4.8% 5.1% % 5.3% 4.1% 4.9% 4.6% % 5.1% 3.8% 4.6% 4.6% % 6.0% 4.5% 5.5% 5.8% % 8.9% 6.9% 8.1% 9.3% % 8.9% 6.9% 8.3% 9.6% % 7.8% 5.9% 7.3% 8.9% % 7.2% 5.4% 6.7% 8.1% % 7.2% 5.5% 6.7% 7.4% % 6.1% 4.7% 5.7% 6.2% % 5.3% 4.0% 5.0% Not available 2) Employment and Jobs The Number and Types of Jobs in the Region MA Source: MA Department of Labor and Workforce Development Labor Force and Unemployment Data, Calendar Year (Not Seasonally Adjusted) The Massachusetts Division of Unemployment Assistance (DUA) is the State entity in charge of tracking the changes taking place in the various sectors of the State s economy at both the state and local levels. Table E-7 below presents the changes that took place in the region s local economy from 2001 to The number of establishments increased during this fourteen year period by 809 establishments (15.1%) but average monthly employment decreased slightly by 19 workers (1%) in the region. Total wages increased by $900 million (33.9%) and the average weekly wage also increased by $205 (34%) during the period despite the loss of total employment in the region (this data US 46
47 excludes Devens numbers). The Consumer Price Index for the nation increased by about 33.67% during the period , indicating that increase in wages was close to inflation in the region. From 1990 to 2000: At least 2,015 new jobs were created in the Montachusett Region. (However, new job growth of 1.9% did not keep pace with population growth in the region at 6.1 %.) Significant job gains occurred in the Services and Public Administration sector. This sector increased by 12,844 new jobs 35.5%. The construction trade gained 574 new jobs increasing 9.9% over the 1990 level. Less people were employed in the Wholesale and Retail Trade sector in 2000 than in This sector decreased by 5,186 jobs (24.3%). From 2000 to 2010: Manufacturing jobs in the region decreased by 7,777 (-29.7%). However, it should be noted that the percentage of jobs in the region in manufacturing remains higher (16.1%) than both the Commonwealth of Massachusetts (9.7%) and the Nation (10.8%). According to the US Census and the American Community Survey, the number of workers increased from 2000 to Notable losses occurred in: 1. Manufacturing; 2. Wholesale; and 3. Retail. All other job sectors experienced minor growth since
48 Table E-7: Employment and Wages by Community Establishments Total Wages Average Monthly Employment Average Weekly Wage % % % Change % Change Change Change Ashburnham % $34,610,406 $43,320, % 1,064 1,044-2% $626 $798 27% Ashby % $6,728,816 $13,459, % % $544 $690 27% Athol % $102,953,479 $129,752, % 3,628 3,445-5% $546 $724 33% Ayer % $252,488,491 $232,705, % 6,314 4,512-29% $769 $992 29% Clinton % $189,444,590 $223,571, % 4,865 4,545-7% $749 $946 26% Devens Not Not Not 91 - Not available $300,125,644-4,030 - available available available $1,432 - Fitchburg % $455,722,580 $535,413, % 14,416 12,703-12% $608 $811 33% Gardner % $261,384,725 $361,026, % 8,463 8,683 3% $594 $800 35% Groton % $115,244,013 $165,427, % 2,958 3,447 17% $749 $923 23% Harvard % $37,814,304 $288,966, % 963 4, % $755 $1,378 83% Hubbardston % $18,497,583 $13,351, % % $563 $677 20% Lancaster % $72,513,155 $82,617, % 2,395 2,012-16% $582 $790 36% Leominster % $512,230,730 $736,209, % 17,230 18,241 6% $572 $776 36% Lunenburg % $83,340,269 $88,043, % 2,464 2,139-13% $650 $792 22% Petersham % $2,251,727 $3,380, % % $309 $496 61% Phillipston % $2,264,687 $4,205, % % $244 $353 45% Royalston % $2,533,989 $2,927, % % $320 $507 58% Shirley % $92,685,629 $169,049, % 2,171 2,789 28% $821 $1,166 42% Sterling % $74,773,853 $111,920, % 2,163 2,566 19% $665 $839 26% Templeton % $55,759,529 $70,345, % 1,667 1,508-10% $643 $897 40% Townsend % $72,124,379 $80,795, % 2,229 1,905-15% $622 $816 31% Westminster % $158,406,240 $134,916, % 3,266 2,511-23% $933 $1,033 11% Winchendon % $48,517,453 $60,888, % 1,840 1,726-6% $507 $678 34% Regional Total* 5,360 6, % $2,652,290,627 $3,552,295, % $13,371 $17,882 - Regional Average* % $608 $813 34% Massachusetts 193, , % $147,345,755,224 $215,550,547, % 3,276,103 3,363,035 $0 $865 $1,233 43% Source: Massachusetts Division of Unemployment Assistance Source: Devens U Mass Donahue Institute Profile and Economic Contributions Report July 2014 * Regional Total and Regional Average does not include Devens 48
49 Table E-8: Employment by Sector by Community Community AGR/ FOR/ FIS/ MIN CONS MFG WS RT TRN/ WAR/ UTL INFO FIN/ INS/ RE PRO, SCI, MGN/ WMS EDU/ HLTH/ SS ART/ ENT/ REC/ FDS OTHR PA Total by Community Ashburnham ,379 Ashby ,749 Athol , , ,979 Ayer ,022 Clinton ,076 1, ,672 Devens ,030 Fitchburg , , ,482 4,334 2, ,199 Gardner , , ,755 Groton ,264 1, ,591 Harvard ,686 Hubbardston ,242 Lancaster ,665 Leominster 65 1,059 3, , ,043 1,892 4,734 1,808 1, ,788 Lunenburg , ,693 AGR ART Agriculture Arts FIS Fishing MIN Mining SCI Scientific FOR Forestry OTHR Other SS Social Services CONS Construction HLTH Healthcare PA EDU ENT Education Entertainment Public Administration TRN Transportation INFO Information PRO Professional UTL Utilities INS Insurance RE Real Estate WAR Warehouse FDS Food Service MFG Manufacturing REC Recreation WMS FIN Finance Waste Management MGN Management RT Retail WS Wholesale Petersham Phillipston Royalston Shirley ,746 Sterling ,044 Templeton , ,062 Townsend , ,064 Westminster , ,205 Winchendon , , ,100 Total 853 7,517 19,909 2,849 14,107 4,563 2,507 6,092 12,759 28,937 9,158 5,247 6, ,758 Region Avg , ,250 Percentage Employed by Sector 0.7% 6.2% 16.5% 2.4% 11.7% 3.8% 2.1% 5.0% 10.6% 24.0% 7.6% 4.3% 5.2% Source: American Community Survey Year Estimates Source: Devens U Mass Donahue Institute Profile and Economic Contributions Report July
50 3) Businesses in Devens Local Company Inquiries and Joint Marketing Efforts Policy The three step process in the Local Company Inquiries and Joint Marketing Efforts Policy includes a three step process that details how MassDevelopment/Devens works with inquiring firms, municipalities and chambers of commerce in an attempt to maintain firms in their present cities or towns and encourage them to relocate (when necessary) to another Montachusett Region community, only if the host community cannot accommodate the firm, prior to expanding in or relocating to Devens. 1. Step 1 involves communication with the host community. 2. However, Step 2 directs MassDevelopment/Devens and the company in question to seek other real estate opportunities through the four chambers of commerce and not any of the local officials in the 22 communities in the Montachusett region. (The language in Step 2 should include communicating with local officials in addition to the chambers of commerce). 3. Step 3 authorizes MassDevelopment/Devens to work with the firm only upon being satisfied that Steps 1 and 2 have been completed. Devens Enterprise Commission (DEC) Permitting Process According to the Devens Enterprise Commission website, DEC follows the following procedure for permitting process 1 : Role of the Devens Enterprise Commission (DEC): The DEC acts as the regulatory and permitting authority for the Devens Regional Enterprise Zone. It functions as a board of health, conservation commission, zoning board of adjustment, and planning board. It carries out these duties in the context of a unique and innovative one-stop, or unified permitting system, which greatly streamlines the local regulatory process. Section 9 of Chapter 498 lists the complete roles and responsibilities of the Commission There are twelve DEC Commissioners. Six commissioners are nominated by Ayer, Harvard, and Shirley. Six additional regional Commissioners are appointed by the Governor. The Governor appoints the Chairperson. Meeting Schedule and Application Timelines: The DEC holds regular monthly meetings on the first Thursday after the first Tuesday of each month. Public hearings are generally held on the last Tuesday of each month. Most development permit applications are acted on within 75 days. No other permitting process can match the project flexibility and approval speed that Devens has to offer. Application Review Process: The Devens By-laws and DEC s Development Rules and Regulations provide for Level One and Level Two permit application review processes. Level One actions allow rapid
51 approval at the Administrative level (generally within 14 days) for relatively minor adjustments to site plans, lot lines, and architectural modifications in historic areas, as well as wetland certificates of compliance. Level Two actions require a full public hearing, and generally involve larger scale undertakings such as most new construction, adaptive reuse of existing buildings and any major private and/or public infrastructure improvements. Anything not specifically identified as a Level One action requires Level Two review. The application review process for Level Two permits typically consists of the following: 1. Scoping Session: A preliminary meeting between the Applicant and the Director to determine the components of the Permit, the timing of the Submission and permitting process, and general scope of the project submittal items. 2. Determination of Zoning Compliance: An Applicant may seek Determination from the DEC that the proposed uses and activities are permitted within the zoning district in which the development site is located and the proposed uses comply with the development goals of that zoning district. Such determination is made by the Commission at a public meeting. The Applicant must submit a statement indicating how the proposed use and development comply with the applicable zoning district (as per the By-Laws and Reuse Plan). 3. Pre-Permitting and Final Conferences: Pre-Permitting Conferences with the Director are required to review which development issues are critical, Submission and Plan Form and Contents requirements, Waivers of Design Standards and preliminary time schedules. 4. Determination of Completeness (DOC): Upon completion of the Final Pre- Permitting Conference, the Director shall render a written DOC within 14 calendar days. "Complete" means that a Submission complies with the Plan Form and Contents and Submission requirements of all applicable DEC Rules and Regulations (see 974 CMR 3.02 for requirements). Submissions can be determined conditionally complete, however a schedule for the submission of deficient or additional items shall be attached to the DOC. 5. Town Comment Period: The DEC provides surrounding towns (Ayer, Harvard and Shirley) 30 days to render comments to the DEC on the Submission. The public hearing shall not be closed until the thirty-day town comment period is concluded. 6. Public Hearing Requirement and Abutter Notices: The DEC provides notice of public hearings to the general public and to abutting property owners. 7. Public Hearing Continuances: The DEC may, with the consent of the Applicant, agree to one or more continuances of public hearings of up to 30 days each. 8. The Voting Process: All DEC votes are by a majority of a quorum (seven DEC members). Seven votes are required for a Variance and Reconsideration. Eight votes are required to adopt or amend Regulations. 9. Record of Decision (ROD). The ROD is issued within 10 days from the date of the DEC's vote. The Applicant shall record the ROD with the Registry of Deeds for both Worcester and Middlesex Counties and provide proof thereof to the DEC prior to the issuance of a building permit. 51
52 10. Endorsement. After the appeal period has expired (30-days), the Applicant submits plans for endorsement by the DEC. Plans are recorded with the Registry of Deeds for both Worcester and Middlesex Counties and proof of recordation submitted to the DEC prior to the issuance of a building permit. 11. Permit Duration. Site Plan approvals are valid for 2 years. Work must commence within 6 months of approval or the approval expires. Extension of these timeframes is possible. Establishments that relocated from or expanded their operations in Devens It is presumed that a company s relocation will have an adverse effect upon certain service businesses frequented by employees as their commuting patterns will have shifted due to the new location of the new plant. Only 11 (12.1%) of the 91 establishments in Devens today relocated from or expanded their operations in Devens (Dragonfly Wellness Center and Xinetics, below, started at Devens). Not all of the 11 companies moved their facilities from other Massachusetts communities; some expanded their operations and maintained a presence in the original Massachusetts community: Ryerson built its manufacturing facility at 45 Saratoga Blvd. in 1999 and relocated 100 jobs to Devens from a closed Wallingford, Connecticut plant. According to the most recent Donahue study, Ryerson currently employs 32. Parker Hannifin employed 133 when the company relocated to Devens from Waltham in Parker Hannifin added 2 jobs after the move. According to the most recent Donahue study, Parker Hannifin currently employs 123. American Superconductor (AMSC) employed 250 when the company developed a 355,000 SF manufacturing facility in In addition to retaining the 250 Westborough jobs, AMSC expected to add 225 jobs at Devens, 150 within the first year. According to the most recent Donahue study, AMSC currently employs 269. Eglomise Design employed 25 when the company moved to Devens from Shirley in The company added 5 new jobs within the first year of the move. According to the most recent Donahue study, Eglomise Design currently employs 20. Waiteco Machine employed 33 when it moved into its 22,500 SF Devens facility from Acton in Xinetics was started at Devens. In 2002, when Xinetics moved into its new building at 115 Jackson Road, the company employed 45 with expectations to add 51 jobs over the next three years. Xinetics was sold to Northrop Grumman in 2007 and, according to the most recent Donahue study, currently employs 51. NB Kenney employed 117 when the company moved from 10,000 SF in Boxborough, MA to 25,000 SF in Devens in Employment was expected to grow to 222 within 3 years of the move. According to the most recent Donahue study, NB Kenney currently employs 150. Laddawn relocated approximately 35 administrative and sales employees from its Sterling, MA facility to the newly repurposed former US Army Davis Library (10,000 SF) in Laddawn expected to add 15 new employees in According to the most recent Donahue study, Laddawn will employ 100 at Devens when the library expansion (20,000 SF) is completed later this year. 52
53 Nypro Healthcare leased 200,000 sq. ft. at 112 Barnum Road in After fit up, Nypro expected to create 165 new jobs at Devens. According to the most recent Donahue study, Nypro currently employs 165. Pizza Bella relocated to Devens from Harvard and currently employs 4. The Natural Café employed 5 when located in Ayer and currently employs 6 in Devens. Dragonfly Wellness Center is a startup that had no employees before its 2015 Devens opening. The Center currently has 6 wellness practitioner tenants and supports an additional 10 wellness class instructors. SMC Ltd. employed 312 as it coordinates its move out of three buildings in Leominster (one site) and Sterling (two sites) totaling 140,000 SF and into 200,000 SF in 18 Independence Drive. SMC expects to add 100 new jobs when it opens its Devens facility later in MRPC requested data from the Assessors of 11 communities; three responded. An examination of the three firms Netstal from Fitchburg, Jabil/Nypro from Clinton and Waiteco from Acton that relocated plants to Devens revealed that the loss of property taxes in the communities experiencing the plant closures were very low; a few hundreds of dollars were lost in each of these situations: To the Fitchburg Assessor MRPC posed the question of how much tax revenue was lost when Netstal relocated out of Fitchburg in the late 1990s to Devens. It appears that the net tax loss was very low (a little more than $900) and that the dip in local tax revenue generated from this property may have had to do more with factors unrelated to the firm s relocation. The value change from 1995 ($1,121,800) to ($1,492,700) could have been a data or market correction followed by the 1998 value of ($1,345,600) or about 10% which would have been a combination of market conditions (they were trending down from ) and the large increase in the vacancy rate. The net loss in taxes between 1997 and 1998 was only about $933! Fitchburg Assessor Concerning Jabil/Nypro of Clinton there was no loss of property tax revenue as the firm expanded a new line of manufacturing in Devens in addition to the lines that it maintains in Clinton. According to the Assessor the property located at 2 High Street (formerly occupied by Waiteco Machine [WM] through FY 2001) generated: $ (2.53%) less in tax revenue one year after (in FY 2002) WM relocated to Devens; $ (5.39%) less from FY 2002 through FY 2003; An increase of $ (12.85%) over the property tax revenue generated over the FY 2003 level of $8,141,38; and, An increase of $ (4.1%) in property taxes when comparing the FY 2001 and FY 2004 numbers. The Assessor in Acton indicated that the decrease in the reduction in property tax revenue could have been attributed to the fact that both 2001 and 2004 were recertification years, but he was unsure. Note: It is important to maintain a watchful eye on the property tax revenues that may decline from companies that have announced plans to relocate to or expand within any other zip code, not just Devens. This impact can be quantified, as shown in the above three examples. Trends in the decline of property tax revenue should be addressed by local officials. Benefits for a business to move into Devens Generally, for manufacturers and distribution facilities, it is accepted that many of the following factors are used when deciding in which geographic area a firm will make capital investments in 53
54 land, building construction, expansion or renovation and in capital equipment in order to be able to produce or deliver its manufactured widgets to its customers. According to Area Development, those are (in no certain order): Labor costs - a major operational cost component - were ranked as the most important site selection factor by corporate executives in a prior survey. Having a pool of highly skilled workers can tip the balance in a location s favor. Skilled labor availability remains a top location criterion for plant siting decisions. It goes without saying that available labor, especially skilled labor, is considered to be a key driver in site selection decisions. Workers are often the lifeblood for a company s operations. Highway accessibility topped the list of individual site selection factors, with 93.8 percent of those surveyed ranking this factor as very important or important. Highway accessibility and the need for speed are critical. Many companies don't need to look further than the gas pump or congested roadways to determine their top site selection criteria. Easy access to key infrastructure can be vital when it comes to executing business strategies, saving time and money, and creating an attractive environment for both employees and customers. A well-connected location is essential for accessing suppliers and customers, as well as connecting to intermodal hubs leading to the global marketplace. Locations offering a robust telecom infrastructure with adequate speed, choices, and bandwidth are becoming hotbeds for technology development and entrepreneurship. Costs of new versus existing facilities are weighed by companies. It may be less or more expensive to rehabilitate an existing facility than go with a build-to-suit structure and site. However, the latter will give a company a custom fit that meets the demands of modern industrial buildings such as those with high ceiling heights and no support column intrusions. While some operations are more energy-intensive than others reducing energy costs is always an important consideration in the location decision. The locations energy costs are important to the firm s decision to relocate or expand in another jurisdiction. While nearly every business sector has an eye on energy availability it is not always the top consideration for some location choices. Keeping the government s hand out of the companies coffers is an important factor. Although corporate tax rates figure more prominently into some location decisions than others there s generally an overall tax bite including property and sales taxes that needs to be looked at carefully. Existing facilities can satisfy demand for a quick project turn-around. The economic downturn left a lot of available buildings in the marketplace although not all have the infrastructure needed by specialized firms. Providing tax bill exemptions can make a dent in the company s operating costs. Although there are variations in which taxes are exempt in different jurisdictions, they not only offer an upfront break when a facility is being deployed, but also can result in ongoing tax savings. Union activities can be a deal breaker. In order to be able to keep wages in check and maintain a flexible operating environment many companies put low union profile high on their list of site selection priorities. Right-to-work and low-union-profile states contribute to a firm s decision whether they will make or break the deal. Low-union and right-to-work (RTW) status may not rank at the top of the list when it comes to site selection criteria, but those factors certainly carry 54
55 considerable weight in the overall decision-making process for many manufacturers. Choosing a state with a low-union profile or locating in a RTW sometimes ranked in the top ten (at ten) or in the top 20 (at 12) in past surveys among a list of 26 different site selection factors. The area s quality of life still matters. Quality-of-life factors are ranked separately from the other site selection factors and are generally rated lower in importance than the top site selection factors - except for "low crime rate." The availability of buildings and shovel-ready sites is another factor. Companies want to be in a position to pounce on opportunities before they disappear. Inbound/outbound shipping costs remain high among the site selection factors in past Area Development Corporate Surveys. Factors such as rising fuel costs and distances from vendors, suppliers and markets served are all playing a greater role in shippingcost decision-making. Occupancy and construction costs are important site selection factors; past Corporate Survey respondents stated that occupancy and construction costs were considered very important or important. Top Site Selection Factors: Tax Rates, Exemptions, and Incentives - Keeping an Eye on the Competition Developing a new facility is an expensive endeavor. Depending upon the size and scope of a business, start-up costs can make a difference between getting a project off the ground and seeing it fall flat. After opening, the costs continue to accumulate. Low tax rates, tax exemptions, and tax incentives can lift a big burden off of all phases of a company's budget. A past Corporate Survey ranked these three factors among their topsix site selection criteria. Local cost factors are important to a firm s bottom line. Many of the cost items important to companies are, but are not limited to: wages, raw materials, transportation, land development, prices of utilities (natural gas per therm and electricity per kilowatt hour [KWM]), real estate taxes and others. 4) Workplace Location Where Region s Residents Work At one time, the US Census Bureau compiled workplace origin/destination statistics for every community as part of once-a-decade national census effort. This information was not collected for the 2010 US Census, the 2000 Census data was not collected for Devens. Within the Montachusett Region are located a local, state and interstate road network, a commuter rail line from Fitchburg to Boston operated by the Massachusetts Bay Transit Authority (MBTA) and two active municipal airports in Fitchburg and Gardner. There are no rivers used for the navigation of goods. Rivers and streams are, however, used by canoeists, kayakers and anglers for outdoor activities. As can be seen in table E-9, the average commuting time (one way) for a resident of the Montachusett Region (31.4 minutes) was higher than both the State (28.3 minutes) and National (25.7 minutes) averages. Mean travel time to work for Devens residents was 21.1 minutes suggesting that they work in Devens. 55
56 Where Devens Employees Live MRPC s Executive Director has been in contact with representatives from the Division of Labor and Workforce Development, Mount Wachusett Community College and several firms in the region. A common theme has emerged is that as the unemployment rates in the Nation and Commonwealth have declined from the Great Recession many firms have been struggling to find a sufficient number of workers to fill a variety of positions available at locations from north of the Quabbin to the interchange of Route 2 and I-495. It is not uncommon to find firms in the north central Massachusetts region tap into labor markets in Lowell and beyond. Employers in Devens are not immune to the plight of finding an adequate supply of labor. Some companies in Devens, on their own, are addressing this issue by working with temporary personnel service providers and private sector transportation firms to tap into labor supplies within reasonable driving times in all directions; north, south, east and west. 56
57 Table E-9: Mean Travel Time to Work: Community 2000 (minutes) (minutes) Ashburnham Ashby Athol Ayer Clinton Devens (01434 zip code) Not available 21.1 Fitchburg Gardner Groton Harvard Hubbardston Lancaster Leominster Lunenburg Petersham Phillipston Royalston Shirley Sterling Templeton Townsend Westminster Winchendon Montachusett Region Middlesex County Worcester County Massachusetts U.S Source: U.S. Census 2000 and American Community Survey 5-Year Estimates Traffic Monitoring Report Summary MRPC posed the following question to Mr. Thatcher Kezer, Senior Vice President, Devens, MassDevelopment Is MassDevelopment drawing people from East or this region. According to Mr. Thatcher Kezer, MassDevelopment did attempt to survey the businesses in Devens for this information. Some businesses responded; data related to 589 (15% +/-) of the 4,000+/ employees was captured. The Devens Enterprise Commission (DEC) provided a copy of the 2,000+ page survey report to the MRPC. MRPC learned: 57
58 Transportation surveys prepared by MassDevelopment were distributed to residents and employees of businesses in Devens. The purpose of the surveys was to collect information about commutes to and from Devens. The results of the survey, which were received from 670 people (81 residents and 589 employees) are summarized below: 86 percent drive, 12 percent carpool, 1 percent walk, 1 percent drive to transit, and none travel by bicycle; Jackson Gate continues to be the most utilized gate, used by 54% of those surveyed. This percentage excludes surveys taken by employees of Quiet Logistics (427 of 589 total business surveys), where 98% indicated that they use Barnum Gate to commute to work. Since the gates no longer physically exist, employees may have confused Barnum Gate with Barnum Road. It is suggested that in the future, the transportation surveys clarify gate locations. Due to this discrepancy, figures for results both including and excluding Quiet Logistics employees have been included. Mullin Associates, Inc. has produced a report collecting and analyzing demographic, spending and other data within certain travel times from the center of the Devens. Please see the accompanying Mullin Associates Report in the Appendix. Real Estate Conditions: 1994 to ) Region s Economic Development MRPC presumes that a community with redevelopment authorities, economic development and industrial corporations (EDICs) and/or industrial or economic development commissions is an indicator of a municipality s desire for business development. An Internet search of the words economic development coupled with each community s name in the Montachusett Region revealed that: Two cities and one town have redevelopment authorities (Fitchburg, Gardner and Winchendon) One town has an economic development and industrial corporation (EDIC) (Athol) Seven other towns have established economic development committees (Groton, Harvard, Shirley, Sterling, Templeton, Westminster and Winchendon) 2) Real Estate Market Industrial Vacancy Rate for Fitchburg and Leominster The availability of industrial space in Fitchburg and Leominster is an asset as expanding businesses need places to grow their enterprises locally retaining the existing workforce and creating new job opportunities for those born and raised in the Montachusett Region. However, many of the industrial buildings in the region s inventory have multiple stories. These buildings with low ceilings are not as useful to manufacturers as are single story buildings. Several buildings in the Fitchburg-Leominster area have been converted to other uses (ex. housing). This occurred in the 1980s, prior to the creation of the Montachusett Region Comprehensive Economic Development Strategy. In Gardner the former Heywood-Wakefield 58
59 furniture-manufacturing site was converted to housing and commercial-office uses while Whitney Carriage in Leominster was also converted to housing. The current residential market downturn has put mill conversions on hold. But, when the residential market turns around, conversions will most likely continue. As of January, 2016, the vacancy rate for modern industrial space in the Fitchburg-Leominster area is 4.2 percent, a decrease from the previous year when it was 9.4 percent. Typical modern industrial space is defined as single-story masonry/steel buildings. They include open warehouse and manufacturing facilities which generally include 5-10 percent office space with ceiling heights of at least fourteen feet. Newer buildings typically have higher clearance, closer to twenty feet, a greater proportion of office space, and also may have climate controlled manufacturing areas. As shown below in Table E-10, Leominster has a total supply of almost 6.2 million square feet of modern industrial space, representing approximately 70 percent of the Fitchburg-Leominster market. Leominster s vacancy rate is 3.9 percent. Fitchburg s total supply of approximately 2.63 million square feet represents about 30 percent of the market and had a vacancy rate of 4.9 percent as of January No new industrial buildings were constructed in 2015 or are proposed for 2016, as of January, According to the Foster Report, the Leominster Fitchburg modern industrial market has experienced continued tightening with the lowest vacancy rates in the survey s history over the last 26 years. The balance of space that was absorbed in 2015 occurred across a wide range of buildings in the market. Table E-10: Modern Industrial Space in Fitchburg and Leominster: January 2016 City Gross Building Area Percent of Building Area SF Available/Vacant Percent Vacant Leominster 6,185, % 239, % Fitchburg 2,630, % 130, % Combined Total 8,816, % 369, % Source: The Foster Report Fitchburg/Leominster Massachusetts, January 2016 As shown in Table E-10 above, over 80 percent of the area s mill space is located in Fitchburg. Mill type space is older, and was generally constructed around the turn of the nineteenth century. They were originally built for single occupant businesses such as textile and paper. Many of these mills in the Fitchburg-Leominster area were later used for plastics manufacturing. They are primarily brick multi-story buildings, generally in fair to poor condition. There is a large inventory of mill space in the Fitchburg-Leominster area. The vacancy rate for mill space as of January 2016 was 18.4 percent, an increase from January 2015 when it was 15.3 percent. Available lease space can often be obtained for low rent and often can be used to meet short term needs or by start-up users requiring lower cost space. However, with the availability of modern space at low pricing, utilization of mill space may no longer be cost effective. There are also environmental issues with mill space such as chemical saturation in the floors and older inground oil or chemical tanks. While remediation is possible, it can be expensive and can also 59
60 result in reluctance from lenders to finance mill property acquisition. Some of these properties are classified as brownfield sites as discussed below. Leominster s base of existing mill space is declining as properties are being converted to residential or commercial use or are demolished or abandoned as they are no longer considered economically feasible to restore. Vacancy in Leominster mill space has increased in the past year as manufacturing operations have relocated to modern space for improved efficiency. Some mill space in Fitchburg is also being converted to residential housing. In Fitchburg, the greatest absorption of mill space has been converted to residential use. However, there is still a substantial supply of mill space for start-up businesses and seasonal storage. Assuming continued improvement in economic conditions, as the supply of modern properties is absorbed, there may be increased demand for mill space at least on a short-term basis. Table E-11: Mill Space in Fitchburg and Leominster: January 2016 City Gross Building Area Percent of Building Area SF Available/Vacant Percent Vacant Leominster 864, % 108, % Fitchburg 3,669, % 723, % Combined Total 4,533, % 832, % Source: The Foster Report Fitchburg/Leominster Massachusetts, January ) Brownfields The Montachusett Region has a rich history of manufacturing since the 19 th Century. Unfortunately, many of these once bustling manufacturing sites are now brownfields. The Federal Environmental Protection Agency (EPA) has indicated that, Brownfields are real property, the expansion, redevelopment, or reuse of which may be complicated by the presence or potential presence of a hazardous substance, pollutant, or contaminant. Cleaning up and reinvesting in these properties takes development pressures off of undeveloped, open land and both improves and protects the environment. Sixteen Montachusett Region towns and three cities have 21E or brownfield sites within their communities according to the Mass DEP. The majority of these sites are residences and small businesses with minor cleanup requirements. Others, however, are faced with significant cleanup issues prior to redevelopment. MRPC s database inventory of potential Brownfields sites in the Region, originated from the 1,676 release of contamination sites listed by the MA Department of Environmental Protection (MassDEP). Of these listed sites, 1,265 are minor in nature (e.g. car accidents where fluids were released and immediately cleaned up). This leaves about 566 sites in the Region which are listed by MassDEP and meet EPA s definition of a Brownfield (impacted by either hazardous materials and/or petroleum). Serious contamination, or the possibility of serious contamination, often prevents underutilized or abandoned industrial and commercial properties from being returned to active use. Therefore, they continue to sit idle, contribute little to the tax base, threaten the health, safety and welfare of the community, and visually degrade the surrounding community. 60
61 EPA's Brownfields Program empowers states, communities, and other stakeholders to work together to prevent, assess, safely clean up, and sustainably reuse brownfields. Some communities including Gardner and Fitchburg have successfully utilized EPA funds to bring brownfields back into productive use. Last year, EPA awarded the Montachusett Regional Planning Commission (MRPC) a $400,000 Community-wide Brownfields Assessment grant for hazardous substances and petroleum contaminated sites. Community-wide hazardous substances grant funds are being used to inventory and prioritize sites and to conduct Phase I and Phase II environmental site assessments. Community-wide petroleum grant funds are being used to conduct the same tasks at sites with potential petroleum contamination. MassDevelopment also administers a Brownfields Redevelopment Fund to transform vacant, abandoned, or underutilized industrial or commercial properties. MRPC and MassDevelopment have and continue to work together to leverage the funds to enhance brownfields reuse efforts. Because there are differences between the two assessment programs, the combined ability to get site assessments funded simply provides more than otherwise would have ever been possible. Significant accomplishments have been made throughout the Region on numerous properties through EPA resources. Much has been done at Devens in terms of remediation. Remediation efforts continue for the former Moore Army Airfield where concentrations of tetrachloroethylene in groundwater are decreasing overall and getting closer to the site goal. The contaminants came from two World War II fueling systems, a former drywell associated with the parachute shakeout tower and a tetrachloroethylene drum storage area. Tax Incentives and Marketing 1) Tax Incentives According to the Massachusetts Executive Office of Housing and Economic Development (EOHED), the Economic Development Incentive Program (EDIP) is a tax incentive program designed to foster job creation and stimulate business growth throughout the Commonwealth. Participating companies may receive state and local tax incentives in exchange for job creation, manufacturing job retention and private investment commitments. The governing statute is MGL Chapter 23A, sections 3A-3F. Ayer and Devens received statutory authority to provide local and state tax incentives to expanding businesses (source: All other communities in the Commonwealth also have had the option to provide the same tax increment financing (TIF), district improvement financing (DIF) and special assessments (SA) to companies creating jobs since the adoption of chapter nineteen of the acts of nineteen hundred and ninety-three. Sixteen (73%) of the 22 cities and towns in the Montachusett Region have adopted the state s tax incentives statute. The Montachusett communities and their respective Economic Target Area (ETA) designations follow in Table E-12, below. 61
62 In 2015, Devens improved one tax incentives deal; Gardner approved three, Leominster one and Winchendon one. Table E-12: Montachusett communities and their respective Economic Target Area (ETA) designations Community Ashburnham Athol Ayer Clinton Fitchburg Gardner Groton Hubbardston Lancaster Leominster Lunenburg Phillipston Shirley Templeton Westminster Winchendon Economic Target Area Northern Worcester County Greater Franklin County Fort Devens, Ayer & Groton Northern Worcester County Northern Worcester County Northern Worcester County Fort Devens, Ayer & Groton Northern Worcester County Northern Worcester County Northern Worcester County Northern Worcester County Greater Franklin County Shirley Northern Worcester County Northern Worcester County Northern Worcester County 2) Marketing Typically, municipalities do not fund or implement marketing programs for their respective communities or commercial and industrial sites. Generally, marketing tasks are the domain of property owners. There are some exceptions to this general rule. Organizations such as industrial development commissions and economic development committees may receive local funding to market a community s assets to grow enterprises within a city or town s boundaries. Also, city and town redevelopment authorities and economic and industrial development corporations will provide marketing literature that may be related to one or more commercial or industrial development sites. All municipal marketing efforts (through committees and development organizations) are based upon the funding available to implement marketing activities. Municipal economic development websites for communities in the Montachusett Region can be found, below. Athol Economic Development Industrial Corporation (EDIC): Ayer: Clinton: 62
63 City of Fitchburg: Fitchburg Redevelopment Authority: City of Gardner: Gardner Redevelopment Authority: Redevelopment-Authority City of Leominster: Economic Development Committees exist in Groton, Harvard, Shirley, Sterling, Templeton, Westminster and Winchendon. Contact information for each can be found on municipal websites. Incidentally, Leominster and Winchendon s economic development website also provides a list of commercial and industrial properties available in the community. Some non-municipal marketing efforts are managed by chambers of commerce and regional visitor centers such as: Greater Gardner Chamber of Commerce Johnny Appleseed Trail Association and Visitors Bureau Nashoba Valley Chamber of Commerce North Central Massachusetts Chamber of Commerce North Quabbin Chamber of Commerce and Visitors Bureau MassDevelopment s website can be found here at Marketing information explains the quasi-state agency s lending and development programs. MassDevelopment Investment and State Aid in the Montachusett Region 1) Legal Structure of Devens In accordance with Chapter 498, Section 23 (the enabling statute for the Devens planned business community), Permanent Government Structure. On or before July first, two thousand and thirty, the commission, the boards of selectmen of the towns with the advice of the planning boards, and the bank shall initiate a study, hereinafter called the study, concerning permanent government structure for the ongoing operation and administration of Devens. The study shall evaluate alternative structures for government, ownership and operation of open space, recreation, and other lands and facilities, infrastructure, easements, equipment and records, with such alternative structures, including by not limited to, town government and joint entities or combinations thereof, or the bank and joint entities or combinations thereof, or the bank and the commission, and shall identify transition costs and further investments needed. During the preparation of the study, public participation shall be encouraged and public hearings held. On or before July 1, 2033, the commission, the boards of selectmen of the Towns, and the Bank shall submit the study and a joint report to the Governor, the Secretary and to the Clerk of the House and the Clerk of the Senate recommending a permanent government structure for the ongoing operation and administration of Devens. Such report shall also identify any surplus funds that have been generated during the development of Devens, after 63
64 considering the costs of funding appropriate reserve accounts, costs of retiring all bonds, notes and other debt instruments issued to maintain and develop Devens, and all the Commission's and Bank's unreimbursed costs related in any way to the redevelopment of Fort Devens, including, without limitation, all costs incurred in the operation, maintenance and development of Devens, and recommend how any such surplus funds and any future surplus funds shall be distributed, which recommendation shall include distributing all or a portion of such surplus to the Towns. 2) State s $200 Million Bond Authorization for Devens According to Mr. Thatcher Kezer, Senior Vice President, Devens, MassDevelopment, Devens received a one-time $200 million bond authorization 20 years ago. MassDevelopment has used it primarily for the environmental cleanup but also for infrastructure replacement and a portion to subsidize the operations until the tax revenues rise sufficiently to match the annual expenditures. Table E-13 shows the total MassDevelopment investment for the Montachusett region communities. These numbers consist of direct loans, tax exempt bonds, brownfield cleanup grants, and such that represent MassDevelopment s investment in the region. These tools have been used for real estate technical assistance for town owned properties, placemaking grants, brownfield site assessment and remediation (in many cases non recoverable to towns). As can be seen in Table E-13, MassDevelopment has invested (or facilitated in the case of bonds) over $628 million to the Montachusett communities over the past 20 years that Devens has been in existence. It should be noted here that Towns of Ashby, Hubbardston, Phillipston and Townsend have not received any MassDevelopment financing or grants. 64
65 Table E-13: Mass Development Projects in Montachusett Region Communities City Project Amount Total Ashburnham $27,310,699 Total Ashby None Total Athol $1,901,163 Total Ayer $23,752,692 Total Clinton $1,305,615 Total Fitchburg $164,347,348 Total Gardner $51,371,821 Total Groton $170,794,000 Total Harvard $16,192,500 Total Hubbardston None Total Lancaster $30,827,450 Total Leominster $94,476,105 Total Lunenburg $10,000,000 Total Petersham $25,000 Total Phillipston None Total Royalston $7,000 Total Shirley $5,440,750 Total Sterling $8,203,500 Total Templeton $291,378 Total Townsend None Total Westminster $6,262,500 Total Winchendon $16,000,000 Grand Total $628,509,521 Source: MassDevelopment Date Range: 1/1/1996-6/20/2016 3) Property Taxes in Devens According to Mr. Thatcher Kezer, Senior Vice President, Devens, MassDevelopment, outside of the $200 million bond authorization, Devens does not receive significant subsidization from MassDevelopment nor does it receive state local aid or Chapter 90 funds for roads as do the 351 communities in Massachusetts. With the passing of Chapter 498, the Acts of 1995, Devens was provided many of the powers of a municipality without being incorporated as a city or town in order to provide basic municipal services such as police, fire, DPW and public education (Devens pays the Town of Harvard $15,523 per student plus special education and bus costs). It also has a financial agreement with the Massachusetts Department of Revenue that allows Devens to use the same structure as the other Massachusetts cities and towns for the collection of taxes, limitations under Proposition 2-1/2 and setting of tax rates under 65
66 Massachusetts Laws. However, other than a $300,000 in education aid annually, Devens does not receive any unrestricted general local aid or Chapter 90 funds as do other municipalities. Property taxes raised from residential, commercial and industrial property owners fund operations within the planned business community and Devens such as education of children living in Devens, all public safety services, all DPW-type services (water, wastewater, road maintenance, plowing, etc.) and municipal governance (i.e. town hall ) services. Devens residential tax rate is $16.69 and $22.64 for commercial and industrial properties. MassDevelopment/Devens operates with an annual deficit. A Permanent Governance group has been tasked by Chapter 498 to address this matter. 4) State Aid for Communities in the Region As seen in Table E-14 below, according to the Department of Revenue, for FY 2016, some of the communities in the region have received over $170 million in state aid (this information is not available for Ashburnham, Athol, Hubbardston, Petersham, Phillipston, Royalston, Templeton, Westminster, and Winchendon). Devens only receives a fixed amount of around $300,000 for school aid each year. Devens does not receive unrestricted local aid or Chapter 90 funds that the other communities receive to support its municipal services. Table E-14: FY 2016 Revenues by Source DOR Code Municipality State Aid State Aid % of Budget 12 Ashby 550, Ayer 872, Clinton 16,080, Fitchburg 58,613, Gardner 25,381, Groton 856, Harvard 3,621, Lancaster 1,090, Leominster 51,122, Lunenburg 8,052, Shirley 1,393, Sterling 1,758, Townsend 1,490, Total 170,885,530 Source: MassDevelopment 66
67 5) Devens Grants: Devens has received the following Federal and State grants from 2006 to 2016: i. FEDERAL 1. DHS (Fire Act) $200,134 personal protective equipment 2. EDA a. $3M infrastructure Jackson Rd and utilities b. $1,858,909 infrastructure Jackson Rd Phase IV ii. STATE 3. PWED $568,500 infrastructure Jackson and Barnum Roads 4. CDAG $1M water sewer infrastructure Barnum and Patton Roads 5. MORE $13M infrastructure Barnum and Patton Roads 6. EOPSS- ~12K each year on formula grants to fire department 7. DEP $100K household hazardous waste center 8. DEP $5K electric vehicle purchase 9. DEP $3,590 charging station 10. State E911 a $500K regional dispatch b $890,805 regional dispatch c $1,991,509 regional dispatch d $401,165 regional dispatch It should be noted here that Nashoba Valley Regional Dispatch Center is an independent organization hosted on Devens. Though Devens and surrounding communities are members, they are an independent entity from the municipalities. 67
68 Section 6: SERVICES AND FACILITIES Introduction This chapter presents a general overview of Devens facilities and services. Information was collected regarding organizational structure, budget, staffing, equipment, facilities, responsibilities, and programs. Many issues are discussed in this element include but are not limited to utilities, public education, taxes and identification of services. Utilities are provided completely independent from other communities, taking advantage of past infrastructure built for the military base. Devens Utilities supplies natural gas, electric, water, and sewer services to residents, institutions, and businesses in the Devens Regional Enterprise Zone. As the population ages a general nation-wide trend, more investment may be required to deal with the health, housing, social, and transportation needs of seniors. In terms of Health care services, Devens residents are redirected to Medical Centers from the surrounding region. Public education is provided by the town of Harvard. Since Devens is a non-operating school district it contracts with the Town of Harvard School District for grades pre-kindergarten through grade 12. All education and education-related services are provided through this contract. Taxes in Devens have a split rate system, so that residential buildings are taxed at a different rate than commercial/industrial buildings. The split rate system results in the residential rates being below average when compared to neighboring cities and towns, whereas the commercial/industrial rates are set above average. Much unlike other communities throughout the region, Devens tax base mostly relies on its commercial/industrial base for tax revenue; and is the only area where there are no taxes on personal property. Overview of Services and Facilities This section presents an overview of the various services and facilities in and around Devens that are accessible to Devens residents. 1) Schools The Devens School District was established in Presently, Devens is a non-operating school district and contracts with the Town of Harvard School District for grades prekindergarten through grade 12. All education and education-related services are provided under this contract. Students in kindergarten through fifth grade attend the Hildreth Elementary School. Students in grades 6-12 attend the Bromfield School. All Devens students have access to all School Choice and Charter School options available within the Commonwealth, as well as Vocational Technical schools. 68
69 Devens current educational services contract with the Harvard School District runs through June of The contract self-renews annually and requires a two year cancellation notice. If the contract is terminated, enrolled Devens students are entitled to continue to be educated by the Harvard School District through high school graduation. Assisting MassDevelopment is the Devens Educational Advisory Committee (DEAC). The DEAC is comprised of four elected Devens residents (two of whom must have school-aged children), and one member from each of the school committees of Ayer Shirley, and Harvard. This committee acts in an advisory capacity to MassDevelopment on all educational matters, including review of all contracts for educational services. The DEAC is represented on the Harvard School Committee as a non-voting member and Devens parents have the opportunity to participate on the Hildreth Elementary School Council and the Bromfield School Council. In addition to contracting for services, the Devens District could seek to regionalize with other districts, or become an operating system with its own schools. Under Chapter 498, any school district in Massachusetts may seek to educate the Devens children. If no satisfactory contract is obtained or other options exercised, the children will then attend schools in the town that historically held jurisdiction over the land where the residence is located. 69
70 2) Community Centers and Services Similarly to what occurs with the school system, the population of Devens must rely on Community Centers and Services from neighboring communities. Below is a list of worship places that serve as options for residents of Devens. Harvard Ayer Shirley Congregational Church Evangelical UCC 5 Still River Road Harvard, MA St. Benedict's Abbey Chapel 252 Still River Road, Box 67 Still River, MA St. Theresa's Roman Catholic Church 15 Still River Road Harvard, MA Unitarian Church Harvard Common Harvard, MA Church of God 41 Littleton Road Ayer, MA Emmanuel Missionary Baptist Church 139 Littleton Road Ayer, MA Apple Valley Baptist Church 12 Columbia Street Ayer, MA Christian Science Church & Reading Room 30 Main Street Ayer, MA Federated Church 21 Washington Street Ayer, MA Hope New Baptist Church Ayer 139 Sandy Pond Road Ayer, MA Saint Andrew's Episcopal Church 7 Faulkner Street Ayer, MA Saint Mary's Catholic Church 31 Shirley Street Ayer, MA Seeds of Faith 17 West Main Street Ayer, MA Holy Ghost Revival Outreach 37 Front Street Shirley, MA Saint Anthony's Religious Center 14 Phoenix Street Shirley, MA Trinity Chapel 188 Center Road Shirley, MA United Church of Shirley 4 Lancaster Road Shirley, MA
71 3) Medical Facilities In terms of health services for the population, facilities in surrounding areas play a key role for the residents of Devens. Below is a list of health centers in the vicinity. Nashoba Valley Medical Center 200 Groton Road Ayer, MA NVMC - Occupational Health Department 200 Groton Road Ayer, MA Clinton Hospital 201 Highland Street Clinton, MA Emerson Hospital Health Center - Groton 100 Boston Road Groton, MA HealthAlliance Hospital - Fitchburg/Leominster Burbank Campus 275 Nichols Road Fitchburg, MA Leominster Campus 60 Hospital Road Leominster, MA Acton Medical Associates 231 Ayer Road Harvard, MA
72 4) Devens Enterprise Commission and Mass Development The Devens Enterprise Commission (DEC) acts as the regulatory and permitting authority for the Devens Regional Enterprise Zone (DREZ). Its role is to administer and enforce the Devens reuse plan, bylaws, regulations and sustainability vision within the Devens Regional Enterprise Zone. It functions as a board of health, conservation omission, zoning board of appeals, historic district commission and planning board. MassDevelopment, the economic development entity, under Massachusetts law leads the redevelopment process and governs the DREZ. MassDevelopment will run Devens at least until 2033, at which time the agency and other entities will make a recommendation to the Commonwealth about a permanent government structure for Devens. Below is a list of offices and departments from Devens administration, followed by MassDevelopment Offices in Boston. Devens Enterprise Commission 33 Andrews Parkway, Devens, MA (978) ext fax: (978) Land Use Administrator/ Director Peter C. Lowitt, FAICP peterlowitt@devensec.com Environmental Planner Neil Angus, AICP, CEP,LEED AP BD&C & ND neilangus@devensec.com MassDevelopment Devens Office Devens Operations Thatcher Kezer 33 Andrews Community Relations Kathy O'Connor Parkway Devens, MA Community Development Department of Public Works David Blazon, Manager Melissa Ouellette, Administrative Assistant 99 Buena Vista Street Devens, MA
73 Fire Department - Non- Emergency Chief Joe LeBlanc 182 Jackson Road Devens, MA State Police Devens - Non- Emergency Diane Joy 59 Buena Vista Street Devens, MA Utilities Department (Electric, Gas, Water, Wastewater) Jim Moore, Devens Utilities Manager 33 Andrews Parkway Devens, MA Recreation Department Kimberly Walsh, Recreation Program Manager 100 Sherman Avenue, Suite 1 Devens, MA Municipal Service Fees & Real Estate Tax Payments Municipal Service Fee Questions MassDevelopment MassDevelopment Accounts Receivable P.O. Box Boston, MA Tax & Property Information Assessor's Office For customer inquiries, contact: Kathy O'Connor 33 Andrews Parkway Devens, MA MassDevelopment Boston Office MassDevelopment Marty Jones, President and CEO 99 High Street Boston, MA ) Emergency Services Police / Fire / Dispatch State Police Devens 59 Buena Vista Street Devens, MA
74 MassDevelopment contracts with the Massachusetts State Police for Devens. The department includes one lieutenant, one sergeant, and 8 troopers. Customary policing includes detecting, deterring, reporting, and investigation of trespassing, theft, vandalism, and other criminal activities. The State Police also provides traffic enforcement, investigation of motor vehicle crashes, and responses to emergency 911 calls. Like other communities, Devens seeks to defuse potentially dangerous situations by reaching out and establishing rapport with the community, at-risk individuals, and associated organizations. Devens Fire Department 182 Jackson Road Devens, MA The Devens Fire Department protects the community with a team of 23 firefighters, two engines, one ladder truck, one rescue vehicle, and two forestry units. The department is trained in the latest techniques of fire-fighting including emergency medical services, rescue, fire prevention, and inspection. Nashoba Valley Regional Emergency Communication Center (NVRECC) 270 Barnum Road Devens, MA The NVRECC handles the emergency communications and dispatching for the Police, Fire, and EMS for the towns of Devens, Harvard, Lancaster and Lunenburg. The center has a Facebook and Twitter page to keep the people in the Devens community abreast of information. 6) Utilities The Utilities Division provides electricity, natural gas, water, and sewer services to Devens. The Division also provides pole and conduit access for telecommunications and cable television, and antennae siting for wireless communications. The Utilities Division continues to pursue programs aimed at increasing energy supply, reliability, and efficiency while limiting costs. Natural Gas The Devens natural gas distribution system is connected to the KeySpan system. Devens purchases its gas on a wholesale basis through competitive bidding. KeySpan provides transportation services by allowing Devens gas to be transported through their lines to Devens, and operations and maintenance services under contract with MassDevelopment. Electricity The Devens electrical distribution system is connected to regional transmission lines at its West Main substation. All of the electricity used each day enters our system at this point. There is no power plant at Devens; Devens purchases all of its power through a competitive bid contract 74
75 with New England Power served by Dominion Energy Marketing, Inc. Power generators are connected to the network of high-voltage transmission lines or the grid. The grid is operated by the New England Power Pool (NEPOOL). Power producers are run by NEPOOL on an economic basis. The least expensive generators generally run twenty-four hours per day. As needed, more units are turned on to cover the loads throughout the day, beginning with the least expensive. Thus, the last unit on is the most expensive to operate and is on for the shortest period, to cover the peak. Water Devens drinking water comes from shallow sand and gravel deposits located within the watersheds. Four groundwater production wells are capable of withdrawing over 5 million gallons per day of drinking water. The sand and gravel act as a huge underground reservoir which is continually replenished by rainfall and snowmelt. Once the water is pumped from the ground, it enters the distribution system, composed of approximately 50 miles of water main. The Devens storage tank and standpipe have a 2 million gallon capacity. This storage capacity helps maintain system-wide water pressure while at the same time providing sufficient amounts of water during periods of high water demand (i.e. fire flow protection). Sewer Wastewater is collected through a series of about 50 miles of pipes that make up the Devens wastewater collection system. Sewage lift pumps boost the wastewater to the wastewater treatment plant located in the northern part of the Devens Regional Enterprise Zone. The Devens wastewater treatment facility is a state of the art sequencing batch reactor (SBR) system that also treats wastewater from the towns of Shirley and Ayer and the MCI-Shirley prison. Cable Cable Service is provided by Comcast. 7) Parks and Recreational Facilities Devens Recreation works year-round to provide residents and visitors with activities and gatherings that take full advantage of the community s acres of open space and fields. The Recreation department organizes the annual Devens Fishing Derby at Mirror Lake, bird walks, game nights, activity sessions, and more, while also hosting various sports tournaments, adventure races, and fundraisers. Fields & Facilities Devens Recreation manages and schedules all recreation fields and facilities. Fields and facilities must be reserved through the Recreation Department and Licenses issued prior to use. 75
76 Devens Disc Golf offers residents and visitors a chance to enjoy the outdoors while participating in a fun Frisbee-based sport. The Hill and The General, the community s two distinguished courses, wind through the woods of Devens and mix the tranquility of hiking with the excitement of competition. Devens Disc Golf offers frequent tournaments, summer-long competitive league play, and weeklong beginner courses for ages The Bob Eisengrein Community Center, (formerly known as the Devens Community Center) is located on historic Rogers Field. Tenants of the Community Center include the Nashoba Valley Chamber of Commerce. Rogers Field, also known as Parade Field, is located in the heart of Devens. This 44-acre site is an excellent location for sporting events and camp programs. Special events are typically held on weekends and are supported by Devens Recreation, State Police and emergency service personnel. Event parking is directed to Vicksburg Square located on Buena Vista Street. Event hours can vary but typically occur between 8am and 6pm. Willard Park is located on Sherman Avenue near the Verbeck Gate. The park contains one multi-use field and three softball fields. Open Space One of the objectives of the redevelopment of Devens is the protection of environmentally sensitive areas including wetlands and floodplains, and forming an interconnected network of natural areas. Open Space accounts for approximately 1,700 acres at Devens and is part of a larger regional matrix of protected land extending along the Nashua River Valley. This area supports wildlife habitat as well as numerous rare plant species. Most notably and frequently observed is the Blanding's Turtle. The Nashua River Valley is also designated under the North American Waterfowl Management Plan as a significant habitat for migratory birds. Mirror Lake is an example of a kettle hole, a deep pond that formed when the last glacier to cover New England slowly melted away. Visitors are welcome to swim, picnic, boat, canoe or fish during regular season. A boat ramp is located at the end of Mirror Lake Road and electric trolling engines are allowed. Parking is available in designated areas. Little Mirror Lake is located to the east of Mirror Lake and is also protected by preservation restrictions. Active and interesting wildlife exists throughout the area. Black Spruce Bog is an ecological formation composed of a vegetated floating mat surrounded by a moat. This environmental feature is very uncommon and can be found to the southeast of Mirror Lake. The Eskers are steeply sloped land formations created as stream beds which ran within ancient glaciers. This long, narrow ridge densely vegetated with trees and smaller vegetation helps to prevent erosion. Robbins Pond is a shallow pond known more for its plant life. The area includes a walking trail and provides a great spot for picnics. 76
77 Red Tail Golf Club Unique to Devens, Red Tail is a challenge to both beginners and seasoned golfers and is recognized by many as one of the best public golf courses you can play. This award-winning 18- hole championship golf course offers scenic views of the New England landscape and has been designated as the first Audubon International Signature Sanctuary golf course in the region. Devens Regulation and Financing The Devens Enterprise Commission budget for Fiscal Year 2016, including staff, operating expenses and special projects is $684,313. This represents a decrease of $191,922 from the 2015 budget. The decrease relates to the reduction in funding to Eco Star in fiscal year 2016 (source: Devens Enterprise Commission Financial Statements from June 30, 2015.) The budget is funded by permits and other fees, taxes (starting in FY 2005, the Commission began receiving 2% of all Devens related tax revenue received by MassDevelopment), intergovernmental, and earnings on investments. As Table SF-1 shows below, Devens has a split taxation system, meaning that there is a rate differentiation for residential and industrial/commercial buildings. The tax rate for Fiscal Year 2016 is in the lower end of the spectrum for the residential population when compared to its neighbors (being higher than only Ayer and Shirley).On the other hand, a comparison between commercial/industrial rates puts Devens in the higher end of the spectrum (being lower than only Ayer and Fitchburg). From the communities below, only Ayer and Fitchburg also have split taxes for residential and commercial/industrial users. Such a measure allows a community to capitalize on its businesses for tax collection lessening the burdening on its population. Table SF-1: FY 16 Local Tax Rates Change Rate from Community FY2016 Tax Rate previous year Devens $16.69 / $ % / 0.17% Ayer $14.53 / $ % / 3.17% Fitchburg $21.23 / $ % / 0.34% Gardner $ % Harvard $ % Lancaster $ % Leominster $ % Shirley $ % Sterling $ % Source: Massachusetts Department of Revenue and Devens 2016 average assessed valuation per household ($292,871) is similar to Ayer, Lancaster, Shirley and Sterling but much higher than Fitchburg and Gardner - see Table SF-2 below. Interestingly, around 25% of the housing stock from Devens is made of affordable units, a much higher rate than other communities in the area. Having split taxation along with significant amount of industrial land use also assists Devens to have a high percentage of affordable units with a lower than average rate for residential tax. 77
78 Table SF-2: Year 2016 Average Assessed Valuation per Household Community FY2016 Assessed Valuation per Change Rate from previous year Household Devens 292, % Ayer 281, % Fitchburg 158, % Gardner 164, % Harvard 531, % Lancaster 296, % Leominster 224, % Shirley 274, % Sterling 287, % Massachusetts 383, % Source: Massachusetts Department of Revenue. Devens 2016 average single-family home tax bill ($4,878) is slightly above the median of the comparison area ($4,391) but still below the average at $4,995 the state average in 2016 was of 5,419). See Table SF-3 below.. Table SF-3: Year 2016 Average Single Family Home Tax Bill Community Average Single Family FY2016 Tax Bill Change Rate from previous year Devens $4, % Ayer $4, % Fitchburg $3, % Gardner $3, % Harvard $9, % Lancaster $5, % Leominster $4, % Shirley $4, % Sterling $4, % Massachusetts $5, % Source: Massachusetts Department of Revenue. The table below indicates that residential property taxes account for only 12.2% of the Devens tax base which is the absolute lowest among all communities selected for comparison. The business friendly policies that Devens has been implementing since its inception allow for such favorable proportion of tax levies coming from Commercial and Industrial uses. It also allows for Devens to charge a lower than average rate of residential tax rate without this resulting in insufficient levying, as evidenced by the fact that Devens is the only community in the area that does not tax personal property. On a side note, from the communities below, Leominster is the only place that collects taxes on Open Space areas (not depicted in the table). 78
79 Table SF-4: Year 2016 Local Tax Levies Res. as CIP as a Personal Total Tax Community Residential Commercial Industrial % of % of Property Levy Total Total Devens 527, ,893 2,833, ,320, % 87.79% Ayer 9,810,403 3,283,305 4,483,660 3,702,286 21,279, % 53.90% Fitchburg 34,912,844 6,147,649 3,044,688 3,499,827 47,605, % 26.66% Gardner 18,515,893 2,390,198 1,198,836 1,210,835 23,315, % 20.59% Harvard 18,550, ,096 45, ,446 19,519, % 4.96% Lancaster 14,017,648 1,250, , ,758 16,446, % 85.23% Leominster 49,135,548 7,628,560 3,498,511 2,573,419 62,842, % 21.80% Shirley 8,974, , , ,643 10,000, % 10.26% Sterling 14,966, , , ,941 17,508, % 14.52% Source: Department of Revenue The table below indicates that Devens is the only community in the area of comparison that does not receive state aid in the form of General Government distributions and reimbursements. However, such differences are probably due to Devens particular governing structure being directly linked to MassDevelopment as opposed to traditional forms of relation between municipal governments and the Commonwealth of Massachusetts. Community Table SF-5: Year 2016 Gov t Distributions and Reimbursements Educational Distributions General Government Distributions and Reimbursements and Reimbursements Non-Ed. per capita Aid Devens 346, Ayer 0 872,970 $44.96 Fitchburg 47,298 9,246,868 $ Gardner 19,902 4,671,548 $ Harvard 2,228 1,393,209 $ Lancaster 7,443 1,082,626 $ Leominster 45,075 6,046,897 $ Shirley 0 1,393,118 $ Sterling 0 724,492 $92.06 Source: Massachusetts Department of Revenue. Per capita figures DO NOT include State education aid. Land Use Permitting and Development Regulations The Devens Enterprise Commission (DEC) acts as the regulatory and permitting authority for the Devens Regional Enterprise Zone. Its role is to administer and enforce the reuse plan, bylaws, regulations and sustainability vision within the Devens Regional Enterprise Zone. It functions as a board of health, conservation commission, zoning board of appeals, historic district commission and planning board. 79
80 Permitting Expedited Local Permitting Devens projects benefit from an expedited, 75-day permitting process administered by the Devens Enterprise Commission (DEC), the independent regulatory and permitting authority for the Devens Regional Enterprise Zone. Wearing multiple hats as the board of health, conservation commission, zoning board of adjustment, and planning board the DEC performs its multiple duties in the context of a unique and innovative one-stop unified permitting system, which greatly streamlines the local regulatory process. As a result, most development permit applications are acted on within 75 days. A recent example is Bristol-Myers Squibb s $750 million Large Scale Cell Culture facility, which was approved by the DEC in just 49 days. No other Massachusetts permitting process can match the project flexibility and approval speed that Devens has to offer. Key Aspects of the Process An effective streamlined permitting process requires open lines of communication between applicant and regulator, a complete and comprehensive application, and clearly-defined provision for public comment. The DEC s process incorporates all three of these elements. Open Lines of Communication The most successful applicants meet early and often with the DEC. An initial scoping session is a critical element as an opportunity for the applicant to get initial feedback from DEC staff on the proposed project as well as a chance to pose any procedural questions. Additional prepermitting conferences may be required to review critical development issues, application contents, waiver requests, design guidelines, and scheduling issues. With full time staff and an open door policy, the DEC is ready and able to assist. Complete and Comprehensive Application The DEC application requires more information than is normally required in some municipalities. The goal is to provide the DEC commissioners, staff, and their peer review consultants proactively with all of the information they will need to make their decision within 75 days, thereby minimizing the potential for schedule-busting last minute requests for additional studies or reports. Provisions for Public Comment While the DEC process is built for efficiency, public input is an integral component of the review process. The DEC process provides the surrounding towns (Ayer, Harvard, and Shirley) 30 days to render comments to the DEC on an application. Additionally, members of the general public are welcome to comment on applications either in writing or in person at the public hearing that is held for every major project. Hearings may be continued to the next month with the agreement of the applicants. The DEC provides notice of public hearings to the general public and to abutting property owners. 80
81 Advantages and Disadvantages Devens streamline permitting process is an advantage as well as a key aspect of Devens business friendly policies. In terms of business attractiveness it is clear that Devens is on the right track. On the other hand, many basic services that the population normally need such as education and healthcare are not being provided by Devens, in a way that its population depends on such services being provided in and by neighboring towns. However, it remains unclear to what extent these towns get rewarded somehow for the services being offered to Devens residents. In the case of the school district, state legislation is behind this form of jurisdiction including budgetary issues. As for the community centers, worship places and medical facilities, it might be fair to further investigate how these providers are rewarded for the inclusion of Devens residents in their scope of users. 81
82 Section 7: LAND USE, OPEN SPACE AND RECREATION Introduction 1) The Montachusett Region s Background and Overview Montachusett Region is comprised of three cities, 19 towns, and the unincorporated village of Devens. Montachusett is a Region of 675 square miles located in north central Massachusetts with a population of 236,475 (2010 U.S. Census). The cities and towns that comprise the Region lie in North Central Massachusetts due west of Boston. While the Region is mostly rural, well-defined industrial centers are present in the cities of Fitchburg, Leominster and Gardner and in the towns of Clinton, Ayer and Athol. Fitchburg and Leominster are the Region s most populous communities, and also make the largest contribution to the Regional economy. Historically, the Region s earliest settlements were founded as trading outposts for the Massachusetts Bay Colony. Lancaster and Groton were settled in the mid-1600's to ensure the flow of animal pelts from the interior to Boston. By the second half of the eighteenth century, most communities in the region were settled. Originally, local economies focused on agriculture but, since farming provided a poor return, manufacturing quickly became the dominant economic force in the region. Montachusett communities harnessed swift-flowing streams and rivers for water-powered manufacturing. The first mills were allied with agricultural production, but the nineteenth century saw the establishment of other industries, including paper, textile and woodworking industries. By the mid-nineteenth century, the production of lumber and wood products became the region s largest industry, and the City of Gardner was known internationally as a major center of chair manufacturing. The growth of the region was accelerated by railroad connections enabling the easy transport of raw materials, finished goods and people. Communities with an industrial base prospered and expanded with the influx of foreign-born and US-born migrants. Smaller towns, such as Ashby and Hubbardston, did not see widespread growth. However, their industrialized neighbors enjoyed their heyday during the late Victorian era. The region s topography is dotted by high peaks such as Mount Wachusett and Mount Watatic and other rolling hills typical of the New England landscape. Three watersheds named the Chicopee River, Millers River and Nashua River, other streams, mountain paths, rail-trails, urbanized downtowns and neighborhoods, historic village centers and new housing subdivisions are connected by a local, state and interstate road system and a commuter and freight rail system linking Boston to Albany. This is the environment within which residents and visitors live, work and play. Within this physical environment private and public sector entities grapple with the issues surrounding growth and how to improve upon the economic condition of the business community and families born within and relocating to the Montachusett Region. Multiple land uses exists within the Montachusett Region including residential, mixed use (i.e. downtowns, central business districts and village centers), commercial, residential, and protected open space. Municipalities are making concerted efforts to preserve natural resources and open spaces while still fostering residential, commercial and industrial developments. 82
83 2) Devens Background Devens is located in north central Massachusetts, approximately thirty-five miles northwest of Boston and twenty miles northeast of Worcester. An active military base until 1996, the former Fort s Main and North Posts occupy 4,400 acres in the towns of Ayer, Harvard and Shirley. Fort Devens was founded in 1917, when the United States Army purchased land from local property owners and established Camp Devens to train troops for World War I. It became a permanent Army post in 1931 and Fort Devens grew rapidly until the end of World War II. The base went on to train and deploy troops to fight in the Korean War, the Vietnam War and Operation Desert Shield/Desert Storm. In 1991 the Base Realignment and Closure Committee (BRAC) decided to decommission the Main and North Posts of Fort Devens in the towns of Ayer, Harvard and Shirley. To mitigate the impact of the base s transition to civilian status, the Massachusetts General Court passed Chapter 498, which established the legal parameters for the redevelopment of the 4,400 acre Main and North Posts over the next forty years. The Commonwealth designated the Massachusetts Government Land Bank (now MassDevelopment) as the public agency responsible for the acquisition, control, maintenance and redevelopment of Devens. And in response to the Fort s impending closure, the Massachusetts Government Land Bank and the Joint Boards of Selectmen in the Towns of Shirley, Ayer, Harvard and Lancaster developed a Reuse Plan for the site in 1994 and with a second update in Because of Devens unique situation, Devens land use formation is quite unlike the rest of the region. Devens certainly incorporates sustainable and innovative land use methods as many of the communities with the region do, but Devens is able to do so with much less regulation and bylaws. Implementation of land use development therefore is done by a case by case basis per project, and each project is analyzed to see if it meets the criteria set forth in the Devens Reuse Plan. More information on Devens land use process and development is located in the next section entitled Devens Zoning and Land Use Development Methods found below within this element. 3) Quantitative Assessment of Regional Land Use Utilizing the most recent regional land use information available, data indicates that about 11% of the Montachusett Region is developed, primarily for residential purposes (9%) followed much further behind by Commercial/Industrial development (1%) and the transportation network (1%). Forested land makes up about 66% of the Region s land use and 4% of the land is used for agricultural purposes. Wetlands and water bodies occupy about 13% of the Region. Some of the densest areas of development are often situated along rivers where moving water was once used to power paper and textile mills and other factories. The chart below displays the land use in the Montachusett Region by percent and Table LU-1 depicts land use by each individual community. 83

84 84
85 Table LU-1 Regional Land Use COMMUNITY AGRICULTURE COMMERCIAL FOREST INDUSTRIAL RESIDENTIAL TRANSPORTATION WETLAND/WATER OTHER TOTAL ACRES % ACRES % ACRES % ACRES % ACRES % ACRES % ACRES % ACRES % ACRES ASHBURNHAM % % 19, % % 1, % % 3, % % 26, ASHBY % % 12, % % 1, % % % % 15, ATHOL % % 16, % % 1, % % 1, % % 21, AYER % % 2, % % % % % % 5, CLINTON % % 1, % % 1, % % 1, % % 4, DEVENS % % 1, % % % % % 1, % 4, FITCHBURG % % 10, % % 3, % % % 1, % 17, GARDNER % % 8, % % 2, % % 2, % % 14, GROTON 1, % % 12, % % 2, % % 3, % % 21, HARVARD 2 1, % % 8, % % 1, % % 2, % % 14, HUBBARDSTON % % 20, % % 1, % % 3, % % 26, LANCASTER 2 1, % % 9, % % 1, % % 2, % 2, % 17, LEOMINSTER % % 9, % % 4, % % 1, % 1, % 18, LUNENBURG 1, % % 9, % % 2, % % 2, % 1, % 17, PETERSHAM 1, % % 29, % % % % 11, % % 43, PHILLIPSTON % % 12, % % % % 2, % % 15, ROYALSTON % % 22, % % % % 3, % % 27, SHIRLEY % % 6, % % 1, % % % % 9, STERLING 2, % % 11, % % 2, % % 2, % 1, % 20, TEMPLETON % % 13, % % 1, % % 2, % 1, % 20, TOWNSEND % % 15, % % 2, % % 1, % % 21, WESTMINSTER % % 16, % % 1, % % 3, % 1, % 23, WINCHENDON % % 20, % % 2, % % 3, % 1, % 28, MRPC REGION 18, % 2, % 291, % 2, % 40, % 2, % 57, % 21, % 437, MassDevelopment Area Only 2 Town Area Minus MassDevelopment Area Source: MassGIS Land Use (2005)

86
87 Current Development & Attributes of the Study Area 1) Residential and Commercial/Industrial Land Use Trends Residential Trends The foreclosure backlash is still reverberating throughout some of the communities within the Region. Although the economy is slowly recovering, new residential development may resume although probably not at pre-recession rates. Low cost housing compared to the Boston Metro area will continue to be a draw for people to relocate to the Montachusett Regional. Pressure for residential development will likely occur along main arterial highways within the region such as Route 2 and Route 190, with the exception of the communities already built up for residential development such as Gardner, Fitchburg, Leominster and Clinton. According to the 2010 Census, the communities that increased the most percentage of housing units during the timeframe of 2000 to 2010 were Winchendon, Hubbardston, Lancaster, Templeton and Ashburnham. (Please see the Housing Element for more information on this trend.) The communities with the most residential development by acre within the region are Clinton (26.36%), Leominster (22.84%), Fitchburg (19.33%), Ayer (16.27%) and Lunenburg (15.73%). (Refer to above Table LU-1 Regional Land Use). Industrial/Commercial Land Use Trends The Montachusett Region s economy is both related to and in many cases separated from the former Worcester County, Commonwealth of Massachusetts and the Nation s economies with particular regard to types of businesses and jobs in the region and certain advantages and disadvantages. While the region many enjoy the highest concentration of manufacturing jobs in the Commonwealth, this sector has been experiencing decline for decades consistent with state and national trends. Because of this trend, many communities are grappling with brownfields that are costly to redevelop, and make redevelopment efforts challenging at best. Pressure for Industrial development may remain lukewarm given the current trends, although if communities continue to be proactive and reassess zoning and regulatory process and provide for pad ready sites industry, could attract to those communities. Commercial Development has increased by 1,259 jobs at a 9% increase according to American Community Survey 5 year estimates of and Considering the population growth within the region, the demand for such development may steadily increase especially along the main arterial highways of Route 2 and Route 190. Recent commercial development as an example includes the Super Walmart and other commercial business located in Lancaster, Great Wolf Lodge located in Fitchburg, Orchard Hill located in Leominster and Market Basket Plaza located in Athol. 2) Zoning Local laws vary from community to community. However, consistent among virtually all of the cities and towns in the Montachusett Region are local zoning bylaws (in the nineteen towns) and ordinances (in the three cities). Zoning laws identify the areas in which commercial and industrial enterprises may locate and expand (use zoning). Use zoning can be interpreted as the municipally-adopted statement of where it wishes to allow and encourage local business growth. Zoning dimension requirements are also included within zoning bylaws and ordinances. (See Regional Zoning Map that follows.) An exception within the region to the usual methods of zoning and permitting is the community of Devens. The following zoning section was taken from the Montachusett Regional Planning Commission s 2011 Montachusett Regional Strategic
88 Framework Plan and has been updated to the most current data available. Information on Devens land use process and development is located in the section entitled Devens Zoning and Land Use Development Methods. 3) Adopted Local Innovative Planning and Zoning Tools Not only was an inventory completed of local plans for the Montachusett Region, an inventory of local innovative planning and zoning tools were taken as well. Communities use these techniques to regulate for smart growth and to protect environmental assets and the aesthetics of community. The following is the list of planning and zoning tools inventoried: lot size analysis, rate of development, cluster development, wind energy, green community designation, low impact development, accessory apartments, scenic roads, earth removal, signs, community preservation act, transfer of development rights, form-based code, 43D, water supply, wetland protection, site plan review, agricultural protection, village or downtown areas and mixed-use zoning. 88

89
90 Lot Sizes In order to paint a relative picture of lot size requirements in the Montachusett Region under existing zoning, minimum lot size requirements for the development of a hypothetical single family house in each community were compared. To capture the intra-local variation (i.e., the variation among different zoning districts within a municipality), figures for both the most and least dense residential zoning districts were taken. Overall, these figures ranged from a high of five acres (to develop a single family house in the least dense district in Templeton) to a low of 5,000 sq.ft. (to develop a single family house in most dense district in Fitchburg). The following table provides a matrix of these lot sizes in the region s 22 communities. Table LU-2 Lot Sizes Smallest Lot Size Allowed in Acres Community Least Dense Most Dense Ashburnham Ashby Athol Ayer Clinton Devens Fitchburg Gardner Groton Harvard Hubbardston Lancaster Leominster Lunenburg Petersham Phillipston Royalston Shirley Sterling Templeton Townsend Westminster Winchendon Table LU-2 shows that in some communities (Harvard, Lancaster, Lunenburg, Petersham and Phillipston) there is no difference between the least dense and the densest areas for zones that allow for residential single-family dwellings. Communities that do not have a difference in density have no area for compact development and growth, which could let to sprawl in these municipalities.
91 Community Rate of Development Cluster/OSRD/Flexible Development Wind Energy Green Communities Designation* LID (Low Impact Development)** Accessory Apartments Scenic Roads Bylaws Earth Removal Signs (CPA) Community Preservation Committee TDR (Transfer of Development Rights) Form Based Codes 43D Water Supply/ Wetland Protection Site Plan Review for Large Projects Agricultural Protection Zoning Village/ Downtown Area Mixed-Use By Right Mixed-Use by Special Permit Only Large Solar Installations Bylaw Table LU-3 Zoning by Community Ashburnham yes yes yes yes yes yes yes yes yes no no no no yes yes no yes yes - yes Ashby yes yes yes yes no yes yes yes no no no no no no yes no yes yes - no Athol no yes yes yes no yes no yes yes no no no yes yes yes no yes yes - yes Ayer yes yes no yes no no no yes yes yes no no yes yes yes no yes yes - no Clinton no yes yes no no yes no yes yes no no no yes no yes no yes - yes no Devens See information on Devens below Fitchburg no yes yes no no yes no no yes no no no yes yes yes no yes - yes no Gardner yes yes yes yes no yes no yes yes no no no yes yes yes no yes yes - yes Groton yes yes yes no yes yes yes yes yes yes no no yes yes yes no yes yes - yes Harvard no yes no yes no yes yes yes yes yes no no no yes yes no yes yes - yes Hubbardston yes yes no no no yes no yes yes yes no no no yes yes no yes yes - yes Lancaster no yes no yes yes yes yes yes yes no yes no yes yes yes no yes yes - no Leominster yes yes yes yes no yes no no yes no no no yes yes yes no yes yes - no Lunenburg yes yes yes yes no yes no yes yes no no no yes yes yes no yes - yes yes Petersham yes no no yes no no no yes yes no no no no no yes no no - yes yes Phillipston no no no no no no no yes yes yes no no no no yes yes yes yes - no Royalston no yes yes no yes yes no yes yes yes no no no yes yes no no no yes yes Shirley yes yes no yes yes yes no yes yes no no no no yes yes no yes yes - no Sterling yes yes yes no no yes yes yes yes no no no no yes yes no yes yes - no Templeton yes yes yes no no yes no yes no yes no no no yes yes no yes yes - yes Townsend yes yes yes yes no yes yes yes yes no yes no no yes yes no yes yes - yes Westminster yes yes yes yes yes yes no yes yes no no no yes yes yes no yes yes - no Winchendon yes yes yes no yes yes no yes yes no no no no yes yes no yes yes - yes 91
92 Rate of Development Rate of development bylaws/ordinances intend to limit the rate at which new development may occur, in order to limit or cushion impacts on infrastructure demands and municipal services. Most provisions are not triggered until some threshold limit has been surpassed. Importantly, provisions of this sort do not in themselves reduce the total number of new homes or the eventual impacts of development at build-out. These bylaws/ordinances vary in their application and effects: some limit the total number of building permits that may be issued community-wide, some simply require phasing of any project over a certain size (so that the entire development may take five to eight years to complete) and some combine aspects of both approaches. Rate of development bylaws/ordinances vary in regards to thresholds and the specific rates of new development that are allowed. Table LU-3 shows only seven of the 22 Montachusett communities do not have a rate of development bylaw/ordinance (Athol, Clinton, Fitchburg, Harvard, Clinton, Lancaster, MA Phillipston and Royalston). The communities that do have rate of development bylaws/ordinances should review the court case of Zukerman v Town of Hadley, summary and Attorney General s caution provided in the appendix. There have been some issues about the legality of rate of development bylaws/ordinances in Massachusetts. In 2010 in both Westminster and Hopkinton, MA, the Attorney General's Office approved rate of development bylaws with time limits. Cluster Development All but two communities in the Montachusett Region have a provision for cluster development (alternatively called open space residential development or flexible development ) in their zoning bylaws/ordinances (See Table LU-3). Typically, these developments require a large area of open space to be set aside, permanently protected, and used for recreation, habitat/natural resources protection, or occasionally continued agricultural uses. Although the actual house lots are smaller than otherwise dictated by minimum lot size requirements the total number of units usually does not exceed the number that would be allowed under the conventional subdivision regulations. Some cluster bylaws/ordinances provide a small density bonus to encourage the clustering of residential development. Cluster provisions may vary significantly in the specifics: minimum land area required, maximum number of units, open space set aside required, zoning districts in which clusters are allowed, design guidelines and dimensional requirements, potential for townhouse development, multifamily housing, or mixed uses, and level of review and approval required. Wind Energy Bylaws/Ordinance Wind Energy Bylaws/Ordinances vary from community to community. Some of these provisions differentiate between large and/or small energy systems; some allow them by right or by special permit and others only allow wind energy systems in certain parts of the community and others allow them community-wide. Without these wind energy system bylaws/ ordinances, developers of these systems would probably need a zoning variance which cost additional time and money. Having these bylaws/ordinances provides wind energy systems developers with requirements and location for these systems upfront which makes it easier to plan for installation. Fifteen out of 22 communities in the Montachusett Region have some sort of windenergy bylaw or ordinance. (Refer to Table LU-3.) 92
93 Green Communities Designation Massachusetts Department of Energy Resources (DOER) has a Green Communities Grant Program that provides funding to help municipalities pursue energy efficiency measures, large renewable energy projects, and innovative methods that use less fossil fuel. To be eligible for this grant program, communities needs to be designated as a green community. Qualification for designation requires that the community fit five criteria: 1) provide as-of-right siting in designated locations for renewable/alternative energy generation, research & development, or manufacturing facilities; 2) adopt an expedited application and permit process for as-of-right energy facilities; 3) establish benchmark for energy use and developed a plan to reduce baseline by 20 percent within 5 years; 4) purchase only fuel-efficient vehicles; and 5) set requirements to minimize life-cycle energy costs for new construction; one way to meet these requirements is to adopt the new Board of Building Regulations and Standards (BBRS) Stretch Code. Thirteen of the Montachusett communities are designated as green communities: Ashburnham, Ashby, Athol, Ayer, Gardner, Harvard, Lancaster, Leominster, Lunenburg, Fitchburg, MA Petersham, Shirley, Townsend and Westminster. Fitchburg is working towards Green Community Designation. Low Impact Development (LID) Low Impact Development (LID) is a group of land use development techniques that capture water and rainfall on site, filter it through vegetation and let it soak into the ground before entering the water table. Some of the benefits of LID are that it improves water quality and reduces flooding. Additionally, some LID techniques can lower construction costs. Only seven of the Montachusett communities have a LID Bylaw (Ashburnham, Groton, Lancaster, Royalston, Shirley, Westminster and Winchendon) (Refer to table LU-3). These LID bylaws relate to the distribution of certain amount of land for new development or redevelopment. They require that the quality and quantity of stormwater runoff be equal to or better and in a less amount than pre-development conditions using LID techniques with certain exemptions. Accessory Apartments Accessory apartments are also known as accessory units, in-law, guest, or family apartments, secondary units or granny flats. They provide supplemental housing that can be integrated into existing single family homes. They are typically small in size and more affordable than full-size rental units. They provide a lower price housing alternative with little or no negative impacts to the character of a neighborhood. Accessory apartments can be located as an interior part of the dwelling, as a modification to the outside of a principal dwelling or as a detached structure, such as, a unit over a garage if the garage is detached. There are many benefits of accessory apartments. They can help to increase a communities' supply of affordable housing. They expand housing opportunities by providing a supply of rental housing for a wider range of physical abilities, stages in life and income levels with little or no negative impact on the physical character of the neighborhood. They can improve the 93

 Scenic Roads Bylaws/Ordinances Scenic roadway bylaws/ordinances (authorized by MGL c.")
94 affordability of housing for both homeowners and renters. Accessory apartments also help to maximize use of infrastructure and services, compacting development and reducing pressure on open space and farmlands from sprawling development. Nineteen of the region s communities allow a form of accessory apartments in their municipality. (See table LU-3 for list of communities.) Scenic Roads Bylaws/Ordinances Scenic roadway bylaws/ordinances (authorized by MGL c.40 Section 15C) can help to preserve the rural landscape by incorporating preservation of important features including stone walls, fences and significant trees along roadsides designated by the municipality as scenic roadways. Such regulation allows Planning Boards to review proposals for the cutting or removal of trees or the alternation of stone walls. However, scenic roadway provisions only apply to work relating to the road or within the limits of the road right-of-way. Therefore they do not directly apply to frontage development outside the roadway limit. Seven of the Montachusett communities have Scenic Road Bylaws: Ashby, Ashburnham, Groton, Harvard, Lancaster, Sterling and Townsend. Earth Removal Earth removal bylaws/ordinances (authorized by MGL c. 40 Section 21 (17)) regulate the removal of topsoil, loam, sand, gravel or minerals from a property. This can include removal for construction activities or to make material available for off-site sale. Earth removal activities may alter surface water quality by increasing the amount of sediment discharge into the receiving body of water. Good earth removal bylaws/ordinances should regulate the amount, timing and manner in which the material is removed. Standards can be established as to how much land is excavated the need for some degree of sedimentation control and restoration of the site. Many of the region s communities (20 of 22) have earth removal bylaws or ordinances (See table LU-3 for full list of communities). Signs Signs can be regulated through zoning or as a general bylaw or ordinance. Typically, the type, size and location of a sign is regulated, although some municipalities also specify sign material, color, design, size of letters and numbers and whether electric signs are allowed. In village centers, sign size and type is critical to maintaining the character of the village. Since village centers are designed to be pedestrian oriented, the signs tend to be smaller and limited as to type. For example, freestanding, wall or projecting signs may be more appropriate than large illuminated signs high atop a pole. Natural materials such as wood or metal should be encouraged in a village setting. Groton, MA Gardner, MA 94
 The Community Preservation Act (CPA) is statewide enabling legislation to allow municipalities to raise money through a surcharge of up to 3% on all property tax")
95 Finally, the number of signs per establishment also can be limited. Twenty of the region s communities have sign bylaws or ordinances (see table LU-3 for full list of communities). Community Preservation Act (CPA) The Community Preservation Act (CPA) is statewide enabling legislation to allow municipalities to raise money through a surcharge of up to 3% on all property tax bills. The CPA funds that the community collects can only be used for open space, historic preservation, affordable housing and outdoor recreation. A minimum of 10 % of the funds needs to be used on each of the three core community concerns: open space, historic preservation and affordable housing. Five percent can be used for administrative expenses. The rest can be used for outdoor recreation. The community must vote to adopt the CPA. If the community adopts the CPA, they will receive matching funds from the State. Seven of the Montachusett communities have adopted the CPA: Ayer, Groton, Harvard, Hubbardston, Phillipston, Royalston and Templeton. Transfer of Development Rights (TDR) Transfer of Development Rights (TDR) is an innovative policy that promotes multiple objectives, including protection of open space, enhancement of residential and commercial districts and reduction of the communities burden of providing municipal services. TDR is predicated on the legal fact that landowners possess a bundle of property rights, including a title to the land itself plus the right to develop or use that land in certain ways, subject to zoning laws. Under TDR, these rights (i.e. the land itself and the development rights) may be bought and sold separately. TDR zoning ordinances usually establish two districts. The sending district is an area designated for open space protection where development is to be discouraged or limited, while the receiving district is an area that can support somewhat higher levels of development. Under TDR, owners of land in the sending district may sell their development rights to owners of land in the receiving district to allow them to carry out their development plans. This type of transfer is particularly useful when one portion a community has valuable resources that need protection, such as open space or historic buildings, while other parts of the community are suitable for new development at densities greater than those currently allowed under zoning. The only two communities in the Montachusett Region that utilize the transfer of development rights are Townsend and Lancaster. Form-Based Code Form-based code is a zoning code that regulates building facades, form and mass of buildings in relation to one another and the scale and types of street and blocks. The code regulations are usually presented in graphics and words and designate appropriate form and scale rather than only landuse types. This is in contrast to conventional zoning that usually regulates land-use types, uses and development density. In general, one benefit of form-based code is that future development and redevelopment can achieve more predictable physical results which can lead to a high quality built Harvard, MA 95

96 environment. None of the Montachusett Region s communities have form-based codes. 43D On August 2, 2006, Massachusetts General Law Chapter 43D was signed into law. This program offers communities a tool for targeted economic development by providing a transparent and efficient process for municipal permitting; guaranteeing local permitting decisions on priority development sites within 180 days, and; increasing visibility of the community that adopts Chapter 43d and target development site(s). To participate in Chapter 43D, a community must vote (Town Meeting/City Council) that the community accept provisions of Chapter 43D of the MA General Laws as amended pursuant to Section 11 of Chapter 205 of the acts of 2006, and to approve the filing of a formal proposal with the state s Interagency Permitting Board for the designation as an overlay for land (Priority Development Sites). A Community must identify a qualifying parcel as a priority development site, and obtain permission of its owner (if private) for participation in the program. According to state regulations, a Priority Development Site (PDS) must be: Commercially or industrially zoned (including mixed use); Eligible for construction of a structure of 50,000 sq. ft. or more; Designated by the state of Massachusetts Interagency Permitting Board; and Wherever possible, priority development sites should be located adjacent to areas of existing development or in underutilized buildings or facilities, or close to appropriate transit services. The Expedited Permitting Program gives a community the ability to promote commercial development on pre-approved parcels by offering expedited local permitting on those parcels. Such development must be primarily commercial however mixed-use properties also qualify for priority designation so long as they conform to the statutory requirements for a priority development site. Other advantages of designating priority development sites in a community include eligibility for and priority consideration for PWED and CDAG funding, priority consideration for other quasi-public financing, brownfields remediation assistance, enhanced online marketing and technical assistance from MassDevelopment and/or the Montachusett Regional Planning Commission. Projects located on Priority Development Sites continue to have flexibility; the applicant Hubbardston, may still apply for permits and approvals under Chapter 40B to the same extent as if the property was not designated as a Priority Development Site. However the provisions of Chapter 43D relating to permit processing and appeals shall not apply to projects seeking permits and approvals under Chapter 40B. 96
97 Many communities within the Montachusett Region seeking to foster high quality development to create jobs, broaden the tax base and enhance the community as a viable place to live and work have adopted Chapter 43D. Montachusett Region Chapter 43D communities include Athol, Ayer, Clinton, Fitchburg, Gardner, Groton, Lancaster, Leominster, Lunenburg, and Westminster. More information on Chapter 43D can be found on Water Supply/ Wetland Protection Many zoning codes protect drinking water supplies and other water resources form the impacts of new development through water resource protection overlay zoning districts. This tool involves the delineation on a map of the recharge area for public and private drinking water supplies. Within the overlay district, the underlying zoning will still apply, but certain activities will be prohibited or subject to restriction through performance standards such as landfill, dumping and storage of salt. Provisions for water resources protection districts may vary in terms of the areas included in the overlay, the procedures for delineating this district, the activities allowed and restrictions placed on them, their applicability to existing uses and the expansion thereof, and the procedure for reviewing developments within these overlay districts. Standards for this type of zoning have been developed by the Department of Environmental Protection (DEP) in its regulations (310 CMR (2)) regarding the establishment of new water supplies. Three problems that have been noted concerning zoning-based water resources protection overlay zoning are: 1) often the recharge area for an aquifer will cross town boundaries; 2) the science for delineating such districts may be very complicated; and 3) an outright ban on activity within the district may seem unreasonable and performance standards or review processes may become burdensome to enforce. Many (18) of the municipalities in the Montachusett Region have water supply or wetland protection bylaws or ordinances. See table LU-3 for complete listing of communities. Site Plan Review Site plan review (or approval) provisions require certain developments usually those over a certain size, of a certain type or located within a certain sensitive area to undergo an additional level of review, in which the community (typically through the Planning Board, but including input from numerous boards and officials) can review the proposed site plan for the project for compliance with established goals and standards, and request modifications where desired. Often the site plan review process works in tandem with a special permit requirement. Bylaws and ordinances may differ in the level of analysis required under site plan review and the need to explicitly consider various alternative site plan configurations, as well as the mechanisms for ensuring review by all relevant boards, commissions, and officials and the thresholds that trigger site plan review. All the Montachusett communities have some form of site plan review. Agricultural Protection Zoning Lancaster, MA Since prime farmland is also ideal for development, a number of municipalities have turned to agricultural preservation zoning to protect remaining farmland from conversion to residential subdivisions or commercial and industrial land. In addition to a desire to maintain some of the 97

98 agricultural way of life, this type of overlay zoning can help protect historic and cultural resources, open space and scenic vistas. Several different approaches can be used in creating a bylaw or ordinance to preserve agricultural land. Some communities require that all residential units be clustered on soils that are least suitable for agriculture or along existing public ways. Another approach is to restrict activities on farmland to agricultural activities and supporting uses, which may include limited residential development. As is the case with open space residential zoning, the provision should specify a mechanism by which the protected farmland will be protected in perpetuity. If agricultural activities are to remain in the undeveloped portion of the parcel, a buffer may be necessary to segregate the uses. Communities should also realize that if new development is allowed to proceed in agricultural areas, especially under a conventional development scenario, infrastructure improvements may be required to accommodate the needs of the new land uses. The expansion of infrastructure into rural areas creates a risk of increasing sprawl conditions since additional development may take advantage of the infrastructure previously unavailable. None of the communities in the Montachusett Region have this type of agricultural protection zoning. Yet, many communities in the region have written Right to Farm general bylaws that encourage and promote agriculture based economic opportunities, and protect farmlands. These Right to Farm bylaws are usually to restate and emphasize the right to farm accorded to all citizens of the Commonwealth. Since this is the law for all Massachusetts citizens, it was not inventoried as an innovative planning tool. Village or Downtown Area Cataloging the presence of zoning-based provisions for downtown/village center development in the communities bylaw/ordinance required a more subjective determination than for some of the other provisions. In general, the study looked to the following factors as evidence of such zoning-based incentives: a distinct downtown or village center zoning district, and/or provisions for mixed commercial and residential uses in this district. As can be expected, provisions for village center zoning vary widely in relation to all of these factors. All but two communities in the Montachusett region have a zoned Village or Downtown Area. They are Petersham and Royalston. Mixed-Use Mixed-Use zoning allows both residential and commercial uses within the same zoning district. This type of zoning leads to more compact development. Residents within this area can walk to retail services available nearby. Reliance on automobiles is diminished. Some communities allow mixed-uses by right and some by special permit only. All the municipalities in the region allow mixed-use in some form. Most of the communities allow mixed-use by right; four communities allow mixed-use with special permit only. (See table LU-3 for complete list of communities.) 98
99 Large Solar Installations Large Solar Installations (often pertaining to ground mounted installations) Bylaw/Ordinances vary from community to community. Some of these provisions differentiate between large and/or small energy systems; some allow them by right or by special permit and others only allow large solar energy systems in certain parts of the community and others allow them community-wide. Without these large solar energy system bylaws/ ordinances, developers of these systems would probably need a zoning variance which cost additional time and money. Having these bylaws/ordinances provides wind energy systems developers with requirements and location for these systems upfront which makes it easier to plan for installation. An exception through the Massachusetts General Law 40A Section 3 prohibits communities from prohibiting and or unduly restricting these installations. Twelve out of 22 communities in the Montachusett Region have some sort of solar-energy bylaw or ordinance. (See table LU-3.) Devens Zoning and Land Use Development Methods In comparison with municipalities within Massachusetts and the Region, the Devens land-use development method has eliminated many obstacles to facilitate development. First, land-use boards have been combined to eliminate multiple permits and meeting requirements. Next, all uses are allowed by right which eliminates special permit and public hearing requirements. Another key difference is that Devens has included within the Reuse Plan the type of innovative land use development methods (ex. Green Building and Renewable Energy), instead of adopting a bylaw as above examples, thus eliminating another level of regulatory obstacle. Below is a more detailed description to the land-use methods used in Devens from an article entitled Unified Permitting System for the Redevelopment of Fort Devens by Neil Angus and Peter Lowitt. The legislation that became Chapter 498 established the Devens Enterprise Commission (DEC) the regulatory and permit granting authority for the redevelopment of Devens. The DEC is empowered to act as a local planning board, conservation commission, board of health, zoning board of appeals, historic district commission and, in certain instances, as a board of selectmen. The DEC is comprised of 15 members, two from each of the three surrounding communities of Ayer, Harvard, and Shirley (plus one alternate from each of them) and six regional representatives. It is fortunate to have a highly competent and talented chairman, William P. Marshall, and a membership that understands the importance of its role in the development process. The composition reflects a balance of regional and local interests and has resulted in a consistent application of its regulatory powers over time. Essentially, the DEC acts as a small regional planning agency, but with all the powers and authority of an individual town. This regional governance provides for a more comprehensive approach to planning and development, and reduces the competing interests of individual towns that adversely affect many of today s development patterns. Instead, growth is directed to areas where existing infrastructure can support it. Those areas that cannot or should not support growth are identified and classified as part of the green infrastructure of the community and region rather than as no-build zones. The DEC carries out these duties in the context of an innovative one-stop Unified Development Permitting system that greatly streamlines the local regulatory process. 99
100 Under this system, all development is permitted as-of-right and complete permit reviews for projects are undertaken within 75 days. It is this unified develop permitting system, combined with a comprehensive plan (the Devens Reuse Plan), and the consolidation of local permitting boards that has made the permitting system shorter, less complicated, and more transparent. The Devens by-laws also provide opportunities for streamlining the permit review process by facilitating certain approvals administratively, without public hearing or formal commission meetings. These types of projects (referred to as Level One Permits ) typically involve relatively minor modifications to site plans, lot lines, and architectural modifications in historic areas, as well as wetland certificates of compliance. The Unified Permit Review process is guided by the redevelopment plan and its principles of sustainable development, which include economic, ecological, and social considerations. Applications that are consistent with the redevelopment plan and these principles move through the entire process in less than 75 days. Pre-application meetings with potential applicants filter out those projects that are not consistent with the Reuse Plan. Where feasible, the staff provides guidance on how to tailor the project to conform more fully to the Reuse Plan. None of this was imposed from above by the Commonwealth or the Department of Defense. The towns within the boundary of the former military base Ayer, Harvard, and Shirley participated fully in the process. Moreover, the process was and is open-ended: these regulations have been amended numerous times since 1994 to incorporate innovations in land-use planning, ecologically sound industrial development, and smart growth practices. If communities could start to emulate the Devens land use development methods and unified permitting program such efforts could be the catalyst for development to occur. Business can be discouraged by the current practices for land use development. It can only be good housekeeping if a community re-evaluates it zoning and ordinances and the permitting process that goes with them to facilitate development. Water and Sewer Resources 1) Water Both municipally-owned and controlled water collection, storage and distribution systems and private wells can be found in the majority of cities and towns in the Montachusett Region. Municipally-owned systems are more prevalent in the more densely populated communities, such as Athol, Ayer, Clinton, Devens, Fitchburg, Gardner, Leominster and Winchendon. Other communities also have municipal water collection, storage and distribution systems. 2) Sewer Both municipally-owned and controlled wastewater treatment facilities and private septic systems can be found in the majority of cities and towns in the Montachusett Region. Municipally-owned wastewater treatment plants are more prevalent in the more densely populated communities, such as Athol, Ayer, Clinton, Devens, Fitchburg, Gardner, Leominster and Winchendon. Other communities also have municipal wastewater treatment systems. 100
101 Trails 1) Bicycle and Pedestrian Increasing concern for air quality, energy conservation, rising fuel costs, and the health benefits of getting outdoors is leading to renewed interest in multi-modal transportation in the Montachusett Region and throughout the state. The MRPC has been working toward a more sustainable transportation system by educating and promoting transportation mode choice throughout the region. This section will review existing and proposed Bicycle and Pedestrian transportation alternatives while focusing on the importance of mode shift. Right Now Bikeways Bikeways are special routes and/or facilities established to facilitate the movement of bicycles as an energy efficient transportation and/or recreational mode of travel. The Montachusett Region has a limited number of bicycle facilities due to a lack of funding for such projects. Devens has incorporated dedicated bike lanes along Jackson Road from Patton Road to West Main Street in Ayer. The Montachusett region has many roadways that would benefit as a bike route. Major routes such as Route 2A, 12, 140, 101, & 119 would be ideal transportation routes for on-road bicycling. Unfortunately, most of these roadways consist of high traffic, speeding and narrow road widths which would pose a safety concern. In 2008 Massachusetts developed a Massachusetts Bicycle Transportation Plan. This plan, which is currently being updated, consists of existing and proposed bikeways and recommendations regarding bicycling in Massachusetts. There are many reasons for improving bicycle transportation safety, health, environment, mobility, congestion and demographics, to name a few. The Massachusetts Department of Transportation endorses the five E s for successful bicycle planning; Engineering Bicycle programs should follow good planning and design practices Education educate bicyclists and motorists Encouragement encourage people to ride bicycles safely Enforcement enforce the rules of the road Evaluation- evaluate programs and projects Existing Bikeways include Mass Central Rail Trail (Clinton/Sterling) This trail has been extended to Sterling Center along the Fitchburg & Worcester RR right-of-way, which ran from Sterling Junction through Sterling Center to Pratt's Junction. An estimated 21 miles of this trail are already open. The Sterling section is complete from Gates Road (where there is parking) north across the Quag bridge to the Sterling Cider Mill (where there is parking) at Waushacum Avenue/Newell Hill Road. It is hoped that the Sterling rai trail can be extended through Sterling Center north to the Police Station. The Mass Central Rail Trail is planned to extend from Northampton to Boston, and has been completed locally 101

 This trail is a former railroad right of way that travels 11 miles through the towns of Ayer, Groton, Pepperell and")
 This recreational trail connects the communities of Gardner and Winchendon.")
 Phase 2 Using existing roads from MWCC, Kelton &")
102 from Rutland to West Boylston (with some gaps). Part of the Sterling trail may likely serve to connect the Mass Central Rail Trail from West Boylston around to the north of the Wachusett Reservoir to Clinton, Berlin, Hudson, etc. and to Boston. Nashua River Rail Trail (Ayer/Groton) This trail is a former railroad right of way that travels 11 miles through the towns of Ayer, Groton, Pepperell and Dunstable. Managed by the Department of Conservation and Recreation, the trail was officially opened to the public on October 25, North Central Pathway (Gardner/Winchendon) This recreational trail connects the communities of Gardner and Winchendon. The trail was broken down into phases to ease the development process. Phase 1 Dedicated paved trail from Park Street past Crystal Lake to Mount Wachusett Community College (MWCC) Phase 2 Using existing roads from MWCC, Kelton & Stone Streets to Route 140 Dunn Park Spur Existing roads from MWCC to Dunn Park with dedicated connector at the Middle School Phase miles paved from Route 140 to Old Gardner Road in Winchendon Phase 4 Downtown Winchendon to Glenn Allen Street Phase 5 $1.7 Million dollar project that is currently underway and consists of 2.1 miles starting at North Ashburnham Road to Glennallen Street (Rt. 202). 102


103 Phase 6 Proposed connector between Stone Street & Rail bed. Currently listed on the Draft TIP for Phase 7 Proposed along Park Street to old rail bed, ending where Phase 3 begins. When completed, this trail will provide the region with a link to many other recreational sites and activities including Dunn Pond, Gardner High School Athletic Facilities, Mount Wachusett Community College, Gardner Municipal Golf Course, the Gardner Veterans Rink, and many more. Pedestrians The majority of the communities in the Montachusett Region are rural in nature with small downtown areas. The areas typically contain sidewalks within the major activity centers. The urban communities have a more extensive infrastructure within the central business districts that facilitates pedestrian circulation. Efforts have been made to improve pedestrian access by means of sidewalk improvements, crosswalk delineation, and construction of handicapped ramps, improved lighting, and connections to municipal parking lots. Designated fixed route bus stops are also common along the sidewalks providing a connection between different modes of travel. Like the bikeways/routes, pedestrian facilities in the Montachusett Region are also limited due to a lack of funding. During these tough economic times, communities tend to focus their monies elsewhere. Local communities have expressed interest and support of improved pedestrian ways, often in connection with potential bikeways, but they lack adequate funding for the design and construction of these facilities. With the help of WalkBoston, Devens was able to create and map a walking trail that circles the parade grounds and Rogers Field in the center of the community. There are also additional walking segments that lead to other significant areas of interest. ( Programs such as Safe Routes to School and Complete Streets may be useful for communities interested in expanding the walkability for their residents. In the spring 2014, Governor Patrick signed the Transportation Bond Bill into law, which authorizes $50 million in complete streets funding for cities and towns. 103
104 The Massachusetts Safe Routes to School Program is managed by the Massachusetts Department of Transportation (MassDOT). This program helps to educate students and parents on the value of walking and bicycling for travel to and from school. The program collaborates with schools, superintendents, public officials, principals, teachers, parent-teacher organizations, and neighbors to encourage safe, healthy trip options. Complete Streets policies require all road construction and improvement projects to begin with evaluating how the street serves all who use it pedestrians, cyclists, public transportation vehicles and passengers, trucks and automobiles. An effective complete streets policy should prompt transportation agencies to: Restructure procedures to accommodate all users on every project Re-write design manuals to include the safety of all users Provide training for planners and engineers in balancing the needs of diverse users Establish performance measures to gauge how well the streets are serving all users. ( Even though Devens currently has their own regulations that incorporate Complete Streets concepts, they are presently working towards approving their own Complete Streets Policy through MassDOT. Trails Using Unified Planning Work Program (UPWP) funds, the MRPC was able to conduct a region wide trail inventory. Through public outreach, local meetings and data collection, the MRPC was able to gather trail data for each of their 22 communities plus Devens. This data was broken down into three categories: Existing Formal Trails that are open to the public. Existing Informal Trails that exist but are not open to the public. These trails are likely on private or environmentally sensitive land. Potential These are trails that are not currently in existence but that have potential for development in the future. At the time of this document, the MRPC currently has over 700 miles of existing formal trails throughout the region, 14 miles of which are located in Devens (see Devens Formal Trail map at the end of this section). In 2014, the MRPC, with the help of the Montachusett Regional Trails Coalition (MRTC), published a Montachusett Regional Trail Guide. This guide includes all of the Existing Formal Trails along with local cultural and historical points of interest. The MRTC also partnered with Freedom s Way National Heritage Area and formed the monthly Connecting Communities trail events. These events support the MRTC s goals of promoting local, and often underutilized, trails throughout the region. 104
105 Looking Back Within the Montachusett Region, several communities have worked to develop trails and bicycle paths and/or ways. A few are currently in operation with several more planned for expansion or construction. Transportation enhancement funds have been utilized as a mechanism to implement several of these bicycle and/or pedestrian ways. Enhancement projects have been submitted to the MRPC through an established project selection procedure. These projects have been allocated funds through the Transportation Improvement Program (TIP) process. The MRPC has continued its Trail Inventory Project through the Unified Planning Work Program (UPWP) funded by federal and state monies. The MRPC started this project in the spring of 2005 in an effort to better identify existing and proposed trails in the region. These reports list mostly hiking trails but also include bikeways and rail trails. Once we successfully inventoried all of our communities, a regional trail guide was developed as a resource for residents and visitors. The Montachusett Regional Trail Coalition (MRTC) was also established in April 2012 at the completion of the Trail Inventory project. This group meets monthly and is focused on connecting people with the outdoors through local and regional trails. In June 2014, with the help of Freedom s Way National Heritage Area, the MRTC began a series of monthly trail events named Connecting Communities. These events have been very successful at getting people aware of and out on the regions existing trails and learning some interesting facts about the area s history and culture. 105

106 106
107 Open Space and Recreation Thorough Open Space planning is crucial when it comes to protecting critical landscapes in our communities such as plant and animal habitats, neighborhood parks and recreational facilities. With rising populations and developments throughout the Montachusett Region, communities need to plan for their future and protect the important resources that they currently have and strategize for future expansion. As it states in the Massachusetts Open Space and Recreation Planners Workbook Open Space and Recreation Plans allow a municipality to maintain and enhance all the benefits of open space that together make up much of the character of the community and protect the green infrastructure of the community. Planning this green infrastructure of water supply, land, working farms and forests, viable wildlife habitats, parks, recreation areas, trails and greenways is as important as the economic future of a community as planning for schools, roads, water and wastewater infrastructure. Once completed, an Open Space and Recreation Plan is a powerful instrument to effect community goals. It establishes the community s aspirations and recommends patterns of development that will support them. Having this document available can help you advocate for the open space and recreation needs of your community. Finally, a Massachusetts community with an approved Open Space and Recreation Plan becomes eligible to apply for Self-Help, Urban Self-Help, Land and Water Conservation Funds, and other grant programs administered by the Executive Office of Energy and Environmental Affairs, Division of Conservation Services, Open Space and Recreation Plans also help to coordinate with ongoing acquisition efforts of state environmental agencies and local and regional land trusts. Not all of the 22 communities that make up the Montachusett Region have active Open Space Plans. As of June 1, 2016, there are 15 communities with active plans, and 7 that have expired plans. There has also never been a regional open space plan developed. This is something that should be considered while moving forward. Devens is currently working on an update to their Open Space and Recreation Plan ( ). While the current plan focuses on land acquisition and preserving open space parcels, the update will focus on active management for these newly acquired properties. 107
108 COMMUNITY ASHBURNHAM ASHBY ATHOL AYER 2 DEVENS CLINTON FITCHBURG GARDNER GROTON HARVARD HUBBARDSTON LANCASTER LEOMINSTER LUNENBURG PETERSHAM PHILLIPSTON ROYALSTON SHIRLEY STERLING TEMPLETON TOWNSEND WESTMINSTER WINCHENDON TABLE LU-4: Status of Open Space Plans Open Space Plan Status As of 6/1/16 Nov-21 Dec-17 Expired Plan Expired Plan Expired Plan Expired Plan Jun-21 Mar-22 Jul-19 Expired Plan Mar-21 May-17 Apr-21 Expired Plan Oct-18 Apr-21 Oct-16 Dec-19 Nov-16 Expired Plan Jan-20 Apr-21 Expired Plan Source: Massachusetts Energy and Environmental Affairs Office 108
109 COMMUNITY Table LU-5: Protected and Limited Protected Open Space PERMANENTLY PROTECTED OPEN SPACE (Acres) LIMITED PROTECTION OPEN SPACE (Acres) ASHBURNHAM 7, ASHBY 3, ATHOL 5, AYER CLINTON DEVENS FITCHBURG 2, GARDNER 3, GROTON 7, HARVARD 2 3, , HUBBARDSTON 10, , LANCASTER 2 1, , LEOMINSTER 6, , LUNENBURG 3, PETERSHAM 21, PHILLIPSTON 5, ROYALSTON 11, SHIRLEY 2 2, STERLING 7, , TEMPLETON 4, , TOWNSEND 7, WESTMINSTER 6, , WINCHENDON 7, REGION 133, , MassDevelopment Area Only 2 Town Area Minus MassDevelopment Area Source: MassGIS Protected and Recreational OpenSpace, updated with community data where available 109

110 110
111 Build-out Analysis and Development Potential A buildout analysis can better help communities plan for future development. The following analysis can assist Montachusett communities of in terms of what lands remain developable per zoning district. Zoning districts have been classified in this analysis for clarity purposes as Residential, Commercial, Industrial, Mixed Use, and Other. No Overlay Districts where included in the classification. This analysis includes methodology, environmental and development characteristics for each zoning district Results of the analysis can be found in the table and narrative that follows. 1) Development Analysis Methodology The development analysis is used to determine developable land area for zoning districts within the region. The best data available was compiled for each of the communities and classified appropriately. These classifications are Residential, Commercial, Industrial, Mixed Use and Other (where the zoning does not fit one of the previously mentioned classifications). It is important to note that some small areas of overlap may have occurred from community to community at their boundaries. Additionally small sliver areas may have been missing from a communities zoning data. These sliver areas were coded as Other. The first step in the analysis was to determine existing developed land. This data was developed from aggregated land use categories in the Land Use (2005) layer provided by MassGIS. The developed land categories are: Participation, spectator, and water-based recreation Commercial Industrial Transportation Waste Disposal Water Powerline/Utility Urban Public/Institutional Cemetery All residential categories. By removing the developed land from the region, the remaining land can be considered undeveloped. The next step was to determine absolute development constraints. This data was developed by combining the following data layers (and sources): Slopes >25% (derived from MassGIS Digital Elevation Model (1:5,000)) FEMA 100 Year Flood Zones (FEMA - MassGIS) DEP Zone A (DEP) DEP Zone I (DEP) Permanently Protected Open Space (MassGIS Protected and Recreational OpenSpace and MRPC member communities) Conservation Restrictions (MRPC member communities) Agricultural Preservation Restrictions (MRPC member communities) 111
112 Rivers Protection Act 100 Foot Buffer (derived from MassGIS - MassDEP Hydrography (1:25,000)) Watershed Protection Act 200 Foot Buffer (derived from MassGIS - MassDEP Hydrography (1:25,000)) Wetlands Protection Act 50 Foot Buffer (derived from MassGIS - MassDEP Wetlands (1:12,000)) By removing the absolute development constraints from the undeveloped land, the remaining land can be considered developable. The next step was to determine partial development constraints. This data was developed by combining the following data layers: Slopes 16% - 25% (derived from MassGIS Digital Elevation Model (1:5,000)) FEMA 500 Year Flood Zones (FEMA - MassGIS) DEP Zone IWPA (DEP) DEP Zone II (DEP) DEP Zone A (DEP) DEP Zone B (DEP) Limited Protection Open Space (MassGIS Protected and Recreational OpenSpace and MRPC member communities) Rivers Protection Act 200 Foot Buffer (derived from MassGIS - MassDEP Hydrography (1:25,000)) Watershed Protection Act 400 Foot Buffer (derived from MassGIS - MassDEP Wetlands (1:12,000)) By removing the partial development constraints from the developable land we are able to determine both the developable land with partial development constraints and the developable land with no constraints. Each of these areas- developed and undeveloped land, absolute and partial development constraints and developable lands was then broken down by community and zoning classification for analysis purposes. 112
113 Results of Build-out Analysis and Development Potential ABSOLUTE CONSTRAINTS REMAINING DEVELOPABLE LAND DEVELOPABLE LAND TOTAL DEVELOPED LAND UNDEVELOPED LAND W/IN UNDEVELOPED LAND DEVELOPABLE LAND W PARTIAL CONSTRAINTS W NO CONSTRAINTS COMMUNITY ZONING ACRES ACRES % ACRES % ACRES % ACRES % ACRES % ACRES % ASHBURNHAM COMMERCIAL 1, % 1, % % % % % INDUSTRIAL 1, % 1, % % % % % MIXED USE % % % % % % OTHER 3, , % 2, % 1, % % % % RESIDENTIAL 19, , % 17, % 6, % 10, % 1, % 9, % ASHBY COMMERCIAL % % % % % % INDUSTRIAL % % % % % % OTHER % % % % % % RESIDENTIAL 15, , % 13, % 5, % 8, % 1, % 7, % ATHOL COMMERCIAL 1, % % % % % % OTHER % % % % % % RESIDENTIAL 20, , % 17, % 6, % 11, % 1, % 10, % AYER 2 COMMERCIAL % % % % % % INDUSTRIAL 1, % % % % % % OTHER % % % % % % RESIDENTIAL 3, , % 2, % % 1, % % 1, % CLINTON COMMERCIAL % % % % % % INDUSTRIAL % % % % % % OTHER % % % % % % RESIDENTIAL 3, , % 1, % % % % % DEVENS 1 COMMERCIAL 1, % % % % % % INDUSTRIAL % % % % % % MIXED USE % % % % % % OTHER 1, % 1, % % % % % RESIDENTIAL % % % % % % FITCHBURG COMMERCIAL % % % % % % INDUSTRIAL 1, , % % % % % % OTHER % % % % % % RESIDENTIAL 15, , % 11, % 3, % 7, % 1, % 6, % GARDNER COMMERCIAL % % % % % % INDUSTRIAL % % % % % % OTHER % % % % % % RESIDENTIAL 12, , % 9, % 5, % 4, % 1, % 3, % GROTON COMMERCIAL % % % % % % INDUSTRIAL % % % % % % OTHER 2, % 2, % 2, % % % % RESIDENTIAL 18, , % 14, % 7, % 7, % 1, % 5, % HARVARD 2 COMMERCIAL % % % % % % INDUSTRIAL % % % % % % OTHER 2, % 2, % 2, % % % % RESIDENTIAL 11, , % 9, % 2, % 6, % 2, % 4, % HUBBARDSTON COMMERCIAL % % % % % % MIXED USE % % % % % % 113
114 OTHER % % % % % % RESIDENTIAL 26, , % 24, % 13, % 10, % 9, % 1, % LANCASTER 2 COMMERCIAL % % % % % % INDUSTRIAL % % % % % % MIXED USE % % % % % % OTHER % % % % % % RESIDENTIAL 15, , % 12, % 4, % 7, % 2, % 5, % LEOMINSTER COMMERCIAL % % % % % % INDUSTRIAL 1, % 1, % % % % % MIXED USE % % % % % % OTHER % % % % % % RESIDENTIAL 16, , % 10, % 6, % 4, % 1, % 2, % LUNENBURG COMMERCIAL % % % % % % INDUSTRIAL % % % % % % MIXED USE % % % % % % OTHER % % % % % % RESIDENTIAL 16, , % 12, % 4, % 7, % 1, % 6, % PETERSHAM INDUSTRIAL % % % % % % OTHER % % % % % % RESIDENTIAL 43, , % 33, % 23, % 10, % 8, % 1, % PHILLIPSTON INDUSTRIAL 2, % 2, % % 1, % % 1, % OTHER 2, % 2, % 2, % % % % RESIDENTIAL 10, % 9, % 4, % 5, % 2, % 2, % ROYALSTON OTHER % % % % % % RESIDENTIAL 27, , % 25, % 13, % 12, % 1, % 11, % SHIRLEY 2 COMMERCIAL % % % % % % INDUSTRIAL % % % % % % MIXED USE % % % % % % OTHER % % % % % % RESIDENTIAL 8, , % 7, % 3, % 4, % % 3, % STERLING COMMERCIAL % % % % % % INDUSTRIAL 1, % % % % % % MIXED USE % % % % % % OTHER % % % % % % RESIDENTIAL 18, , % 15, % 8, % 7, % 3, % 4, % TEMPLETON COMMERCIAL 1, % 1, % % % % % MIXED USE % % % % % % OTHER 1, % % % % % % RESIDENTIAL 17, , % 15, % 6, % 9, % 6, % 2, % TOWNSEND COMMERCIAL % % % % % % INDUSTRIAL % % % % % % OTHER % % % % % % RESIDENTIAL 20, , % 18, % 9, % 8, % 1, % 7, % WESTMINSTER COMMERCIAL % % % % % % INDUSTRIAL 1, % % % % % % OTHER % % % % % % RESIDENTIAL 22, , % 18, % 8, % 10, % 3, % 7, % 114
115 WINCHENDON COMMERCIAL 1, % 1, % % % % % INDUSTRIAL 1, % 1, % % % % % MIXED USE % % % % % % OTHER % % % % % % RESIDENTIAL 24, , % 22, % 9, % 12, % 1, % 10, % MRPC REGION COMMERCIAL 12, , % 8, % 2, % 5, % 1, % 4, % INDUSTRIAL 16, , % 12, % 6, % 13, % 3, % 10, % MIXED USE 2, % 1, % 9, % 20, % 4, % 15, % OTHER 16, , % 12, % 7, % 2, % 1, % 1, % RESIDENTIAL 388, , % 323, % 133, % 140, % 51, % 88, % 1 MassDevelopment Area Only 2 Town Area Minus MassDevelopment Area Developed Land Data Source: MassGIS (Land Use (2005)) Zoning Data Source: MRPC and member communities Absolute Constraints Data Source: MassGIS, MRPC and member communities Partial Constraints Data Source: MassGIS and MRPC 115
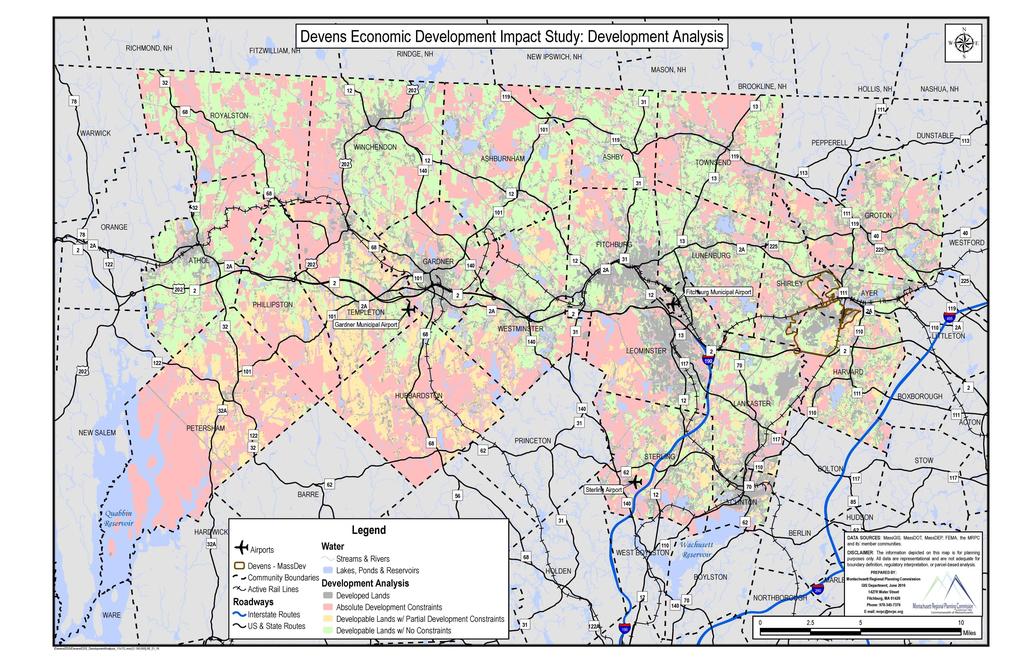
116 116
A Primer on the Basic Allowance for Housing (BAH)
") DEFENSE TRAVEL MANAGEMENT OFFICE A Primer on the Basic Allowance for Housing (BAH) For the Uniformed Services The purpose of this Basic Allowance for Housing (BAH) primer is to explain to members how their
DEFENSE TRAVEL MANAGEMENT OFFICE A Primer on the Basic Allowance for Housing (BAH) For the Uniformed Services The purpose of this Basic Allowance for Housing (BAH) primer is to explain to members how their
Comprehensive Planning Grant. Comprehensive Plan Checklist
 Comprehensive Planning Grant Comprehensive Plan Checklist This form was updated April 2010 Comprehensive Planning Grant Program Department of Administration Division of Intergovernmental Relations 101
Economic Development Strategic Plan Executive Summary Delta County, CO. Prepared By:
 Economic Development Strategic Plan Executive Summary Delta County, CO Prepared By: 1 Introduction In 2015, Region 10, a 501(c)(3) Economic Development District that services six counties in western Colorado,
Ashby Sustainable Economic Development Plan
 Ashby Sustainable Economic Development Plan Prepared by: Montachusett Regional Planning Commission (MRPC) In collaboration with the Town of Ashby Economic Development Committee and Christopher J. Ryan,
CONSOLIDATED PLAN 2017 Annual Action Plan
 2015-2020 CONSOLIDATED PLAN 2017 Annual Action Plan MORGAN COUNTY TOOELE COUNTY WEBER COUNTY Prepared by the Wasatch Front Regional Council for the Utah Small Cities Community Development Block Grant (CDBG)
Industry Market Research release date: November 2016 ALL US [238220] Plumbing, Heating, and Air-Conditioning Contractors Sector: Construction
![Industry Market Research release date: November 2016 ALL US [238220] Plumbing, Heating, and Air-Conditioning Contractors Sector: Construction](/thumbs/80/81994465.jpg "Industry Market Research release date: November 2016 ALL US [238220] Plumbing, Heating, and Air-Conditioning Contractors Sector: Construction") Industry Market Research release date: November 2016 ALL US [238220] Plumbing, Heating, and Air-Conditioning Contractors Sector: Construction Contents P1: Industry Population, Time Series P2: Cessation
Industry Market Research release date: November 2016 ALL US [238220] Plumbing, Heating, and Air-Conditioning Contractors Sector: Construction Contents P1: Industry Population, Time Series P2: Cessation
REQUEST FOR PROPOSALS
 REQUEST FOR PROPOSALS Town of Hope Mills Multi-Modal Congestion Management Plan September 19, 2016 Fayetteville Area Metropolitan Planning Organization Proposal Due Date: 3:00 PM Eastern Time, 28 th October,
Proposals. For funding to create new affordable housing units in Westport, MA SEED HOUSING PROGRAM. 3/28/2018 Request for
 3/28/2018 Request for Proposals For funding to create new affordable housing units in Westport, MA SEED HOUSING PROGRAM TOWN OF WESTPORT SEED HOUSING PROGRAM WESTPORT, MA TABLE OF CONTENTS 1 General Information
COMMUNITY DEVELOPMENT BLOCK GRANT (CDBG) (Technical Assistance Program)
 (Technical Assistance Program)") COMMUNITY DEVELOPMENT BLOCK GRANT (CDBG) (Technical Assistance Program) Objective: Provides technical assistance to recipients of CDBG program funds. Administering Agency:, and Development NYS Object Code:
COMMUNITY DEVELOPMENT BLOCK GRANT (CDBG) (Technical Assistance Program) Objective: Provides technical assistance to recipients of CDBG program funds. Administering Agency:, and Development NYS Object Code:
Engineering Vacancies Report. September 2017 Update
 Engineering Vacancies Report September 2017 Update 8 November 2017 Author: Mark Stewart Engineers Australia 11 National Circuit, Barton ACT 2600 Tel: 02 6270 6555 Email: publicaffairs@engineersaustralia.org.au
ANNE ARUNDEL COUNTY. ACTIVITY RECOMMENDATION FORM for CAPITAL PROJECTS LOCAL FISCAL YEAR 2017
 ARUNDEL COMMUNITY DEVELOPMENT SERVICES, INC. ANNE ARUNDEL COUNTY ACTIVITY RECOMMENDATION FORM for CAPITAL PROJECTS LOCAL FISCAL YEAR 2017 Community Development Block Grant (CDBG) Program Home Investment
Counting for Dollars: Fresno County, California
 Counting for Dollars: Fresno County, California Federal Assistance Programs that Distributed Funds in Fresno County, California on the Basis of Census-Related Statistics, Fiscal Year 2008 This table lists
Counting for Dollars: Polk County, Florida
 Counting for Dollars: Polk County, Florida Federal Assistance Programs that Distributed Funds in Polk County, Florida on the Basis of Census-Related Statistics, Fiscal Year 2008 This table lists federal
Request for Proposals. Housing Study Consulting Services. Proposals DUE: January 6, City of Grandview. Economic Development Department
 Request for Proposals Housing Study Consulting Services Proposals DUE: January 6, 2017 City of Grandview Economic Development Department Leonard Jones, Mayor Cory Smith, City Administrator REQUEST FOR
NORTH CAROLINA HOUSING FINANCE AGENCY. A. Robert Kucab Executive Director
 A. Robert Kucab Executive Director LEGISLATIVE OVERVIEW for JOINT APPROPRIATIONS SUBCOMMITTEE ON GENERAL GOVERNMENT LEGISLATIVE OVERVIEW Table of Contents (Page Numbers) North Carolina Housing Finance
Request for Applications to Host a Citizens Institute on Rural Design Workshop in 2018
 Request for Applications to Host a Citizens Institute on Rural Design Workshop in 2018 INTRODUCTION The Citizens' Institute on Rural Design (CIRD) connects communities to the design resources they need
Results of the Clatsop County Economic Development Survey
 Results of the Clatsop County Economic Development Survey Final Report for: Prepared for: Clatsop County Prepared by: Community Planning Workshop Community Service Center 1209 University of Oregon Eugene,
APPENDIX METROFUTURE OVERVIEW OVERVIEW
 APPENDIX B METROFUTURE OVERVIEW OVERVIEW Land use decisions and many economic development decisions in Massachusetts are controlled directly by local municipalities through zoning. This planning is guided
Managing CDBG. A Guidebook for Grantees on Subrecipient Oversight. U.S. Department of Housing and Urban Development
 U.S. Department of Housing and Urban Development Office of Community Planning and Development Community Development Block Grant Program Managing CDBG A Guidebook for Grantees on Subrecipient Oversight
Counting for Dollars: Syracuse, NY
 Counting for Dollars: Syracuse, NY Federal Assistance Programs that Distributed Funds in the Syracuse, NY Metropolitan Area on the Basis of Census-Related Statistics, Fiscal Year 2008 This table lists
July 1, 2015 thru September 30, 2015 Performance Report
 Grantee: Grant:, OH B-11-UN-39-0002 July 1, 2015 thru September 30, 2015 Performance Report 1 Grant Number: B-11-UN-39-0002 Grantee Name:, OH Grant Award Amount: $2,551,533.00 LOCCS Authorized Amount:
FUNDING SOURCES. Appendix I. Funding Sources
 Appendix I. Funding Sources FUNDING SOURCES planning and related efforts can be funded through a variety of local, state, and federal sources. However, these revenues have many guidelines in terms of how
Counting for Dollars: Broward County, Florida
 Counting for Dollars: Broward County, Florida Federal Assistance Programs that Distributed Funds in Broward County, Florida on the Basis of Census-Related Statistics, Fiscal Year 2008 This table lists
Questions and Answers Florida Department of Economic Opportunity Employment and Unemployment Data Release July 2018 (Released August 17, 2018)
") Questions and Answers Florida Department of Economic Opportunity Employment and Unemployment Data Release July 2018 (Released August 17, 2018) 1. What are the current Florida labor statistics and what
Questions and Answers Florida Department of Economic Opportunity Employment and Unemployment Data Release July 2018 (Released August 17, 2018) 1. What are the current Florida labor statistics and what
SUMMARY OF ELIGIBLE AND INELIGIBLE COMMUNITY DEVELOPMENT BLOCK GRANT PROGRAM ACTIVITIES
 ATTACHMENT D-1 SUMMARY OF ELIGIBLE AND INELIGIBLE COMMUNITY DEVELOPMENT BLOCK GRANT PROGRAM ACTIVITIES This is a summary of the activities that are eligible and ineligible for assistance under the Community
The Loop Media Hub. Gigabit Economic Development Impact Statement. Prepared for: The Loop Media Hub Feasability Study. June 27, 2012.
 Sandel & Associates The Loop Media Hub Gigabit Economic Development Impact Statement Prepared for: The Loop Media Hub Feasability Study June 27, 2012 Prepared by: Special Advisor Pat McKeehan 6900 Delmar
CITY OF LA CENTER PUBLIC WORKS
 CITY OF LA CENTER PUBLIC WORKS TRAFFIC CALMING PROGRAM APPROVED PER RESOLUTION 08-304 ON DECEMBER 10, 2008 TABLE OF CONTENTS PAGE Summary... 1 Procedures... 2 Project Eligibility... 2 Project Funding &
City of Joplin Capital Plan Presentation
 Working Draft City of Joplin Capital Plan Presentation June 11, 2015 Working Draft Agenda Overview of HUD CDBG-DR program and key parameters Capital Planning Process Project Overview Outputs from the Capital
Counting for Dollars: Jefferson County, Alabama
 Counting for Dollars: Jefferson County, Alabama Federal Assistance Programs that Distributed Funds in Jefferson County, Alabama on the Basis of Census-Related Statistics, Fiscal Year 2008 This table lists
Litchfield Hillsborough County, New Hampshire
 Litchfield Hillsborough County, New Hampshire Transportation Access/Directions: The town of Litchfield is located 11 miles south of Manchester and 50 miles north of Boston. Litchfield is accessible by
Counting for Dollars: Tulare County, California
 Counting for Dollars: Tulare County, California Federal Assistance Programs that Distributed Funds in Tulare County, California on the Basis of Census-Related Statistics, Fiscal Year 2008 This table lists
Department of Housing and Community Development Notice of Funding Availability Spring 2014 Affordable Housing Competition for Rental Projects
 Department of Housing and Community Development Notice of Funding Availability Spring 2014 Affordable Housing Competition for Rental Projects The Department of Housing and Community Development (DHCD)
State of West Virginia Consolidated Annual Action Plan
 State of West Virginia Consolidated West Virginia Development Office West Virginia Housing Development Fund Fiscal Year Draft Date: March 23, 1 Executive Summary AP-05 Executive Summary - 24 CFR 91.200(c),
NC General Statutes - Chapter 136 Article 19 1
 Article 19. Congestion Relief and Intermodal 21 st Century Transportation Fund. 136-250. Congestion Relief and Intermodal Transportation 21 st Century Fund. There is established in the State treasury the
Economic Development Element
 CHAPTER 6 66.1001(2)(f) Wis. Stat.: Economic Development Element Economic development element: A compilation of objectives, policies, goals, maps and programs to promote the stabilization, retention or
Coolidge - Florence Regional Transportation Plan
 Coolidge - Florence Regional Transportation Plan A Partnership Among the City of Coolidge, Town of Florence, and ADOT FINAL REPORT Kimley-Horn Kimley Kimley-Horn and and Associates, Associates, Inc. Inc.
Counting for Dollars: Tulsa County, Oklahoma
 Counting for Dollars: Tulsa County, Oklahoma Federal Assistance Programs that Distributed Funds in Tulsa County, Oklahoma on the Basis of Census-Related Statistics, Fiscal Year 2008 This table lists federal
STATE AND REGIONAL DEVELOPMENT STRATEGY East Central Region BACKGROUND THE REGION
 BACKGROUND STATE AND REGIONAL DEVELOPMENT STRATEGY East Central Region Since 1999, the Illinois Department of Commerce and Economic Opportunity (formerly The Illinois Department of Commerce and Community
Counting for Dollars: Sedgwick County, Kansas
 Counting for Dollars: Sedgwick County, Kansas Federal Assistance Programs that Distributed Funds in Sedgwick County, Kansas on the Basis of Census-Related Statistics, Fiscal Year 2008 This table lists
Engineering Vacancies Report
 Engineering Vacancies Report April 2017 Author: Mark Stewart Engineers Australia 11 National Circuit, Barton ACT 2600 Tel: 02 6270 6555 Email: publicaffairs@engineersaustralia.org.au www.engineersaustralia.org.au
OFFICE OF THE CITY ADMINISTRATIVE OFFICER
 REPORT FROM OFFICE OF THE CITY ADMINISTRATIVE OFFICER Date: February 25, 201 1 GAO File No. 0220-00540-0930 Council File No. 11-0223 Council District: 6, 7,8,9, 15 To: From: Reference: Subject: The Mayor
Licensed Nurses in Florida: Trends and Longitudinal Analysis
 Licensed Nurses in Florida: 2007-2009 Trends and Longitudinal Analysis March 2009 Addressing Nurse Workforce Issues for the Health of Florida www.flcenterfornursing.org March 2009 2007-2009 Licensure Trends
Highway Safety Improvement Program Procedures Manual
 Highway Safety Improvement Program Procedures Manual February 2017 Division of Planning Office of Systems Planning and Program Management Contents Section Page Preface... iii HSIP Program Procedure...
Engineering Vacancies Report
 Engineering Vacancies Report 2017 Update February 2018 Author: Mark Stewart Engineers Australia 11 National Circuit, Barton ACT 2600 Tel: 02 6270 6555 Email: publicaffairs@engineersaustralia.org.au www.engineersaustralia.org.au
Counting for Dollars: Pinal County, Arizona
 Counting for Dollars: Pinal County, Arizona Federal Assistance Programs that Distributed Funds in Pinal County, Arizona on the Basis of Census-Related Statistics, Fiscal Year 2008 This table lists federal
Telecommuting Patterns and Trends in the Pioneer Valley
 Telecommuting Patterns and Trends in the Pioneer Valley August 2011 Prepared under the direction of the Pioneer Valley Metropolitan Planning Organization Prepared by: Pioneer Valley Planning Commission
Counting for Dollars: The Role of the Decennial Census in the Geographic Distribution of Federal Funds
 Counting for Dollars: The Role of the Decennial Census in the Geographic Distribution of Federal Funds Reference Document: Overview of Census-Guided Federal Domestic Assistance Programs March 2010 1 Counting
11 MASSDOT COMMUNITY TRANSIT GRANT PROGRAM
 11 MASSDOT COMMUNITY TRANSIT GRANT PROGRAM INTRODUCTION The Federal Transit Administration (FTA) provides financial assistance to states through a number of programs to develop new transit systems and
South Portland Economic Development Plan: Positioning South Portland for Balanced and Healthy Growth
 South Portland Economic Development Plan: Positioning South Portland for Balanced and Healthy Growth December 2015 KARL F. SEIDMAN CONSULTING SERVICES With Karp Strategies South Portland Economic Development
Health Care Employment, Structure and Trends in Massachusetts
 Health Care Employment, Structure and Trends in Massachusetts Chapter 224 Workforce Impact Study Prepared by: Commonwealth Corporation and Center for Labor Markets and Policy, Drexel University Prepared
ALLEGHENY COUNTY RESIDENTIAL FINANCE AUTHORITY REQUEST FOR PROPOSALS. Analysis of Housing Markets in Allegheny County
 ALLEGHENY COUNTY RESIDENTIAL FINANCE AUTHORITY 1. SECTION ONE. GENERAL INFORMATION 1.1. Purpose of the Request for Proposals. The purpose of this Request for Proposals ( RFP ) is to engage a Proposer to
Counting for Dollars: Boise City, ID
 Counting for Dollars: Boise City, ID Federal Assistance Programs that Distributed Funds in the Boise City-Nampa, ID Metropolitan Area on the Basis of Census-Related Statistics, Fiscal Year 2008 This table
Counting for Dollars: Atlanta, GA
 Counting for Dollars: Atlanta, GA Federal Assistance Programs that Distributed Funds in the Atlanta-Sandy Springs- Marietta, GA Metropolitan Area on the Basis of Census-Related Statistics, Fiscal Year
NORTH CENTRAL TEXAS COUNCIL OF GOVERNMENTS METROPOLITAN PLANNING ORGANIZATION REQUEST FOR PROPOSALS
 NORTH CENTRAL TEXAS COUNCIL OF GOVERNMENTS METROPOLITAN PLANNING ORGANIZATION REQUEST FOR PROPOSALS CITY OF CEDAR HILL CITY CENTER TRANSIT-ORIENTED DEVELOPMENT PLAN August 19, 2011 REQUEST FOR PROPOSALS
Chapter 9: Economic Development
 Chapter 9: Economic Development 9.0 Accomplishments Since 2007 As the economic driver for the State, New Castle County continues to review development regulations and offer additional incentives and enhancements
STATE ENTREPRENEURSHIP INDEX
 University of Nebraska - Lincoln DigitalCommons@University of Nebraska - Lincoln Business in Nebraska Bureau of Business Research 12-2013 STATE ENTREPRENEURSHIP INDEX Eric Thompson University of Nebraska-Lincoln,
GWINNETT COUNTY, GEORGIA
 GWINNETT COUNTY, GEORGIA ACTION PLAN 2006 OF CONSOLIDATED PLAN 2006-2010 ORIGINAL APPROVAL - 11-05-2005 [AMENDMENTS 4-18-2006; 12-12-2006; 6-19-2007; 10-16-2007; 10-23-2007] SUBMITTED TO: UNITED STATES
National Housing Trust Fund (HTF) -- Background:
 -- Background:") Department of Housing and Community Development Supportive Housing for Vulnerable Populations Notice of Funding Availability National Housing Trust Fund (HTF) August 2018 The Baker Polito Administration
Department of Housing and Community Development Supportive Housing for Vulnerable Populations Notice of Funding Availability National Housing Trust Fund (HTF) August 2018 The Baker Polito Administration
CITY OF MADISON, ALABAMA
 CITY OF MADISON, ALABAMA Request for Proposals No.02-10 Consulting Services for Madison Growth Plan Madison, Alabama 100 Hughes Road Madison, Alabama 35758 www.madisonal.gov Improving the Quality of Life
Mecklenburg County Community Development Block Grant (CDBG) FY 2018 Notice of Funding Availability
 FY 2018 Notice of Funding Availability") Mecklenburg County is preparing for its FY 2017-2018 Community Development Block Grant Program Annual Action Plan and Funding Allocation. As an Entitlement County, it anticipates receiving approximately
Mecklenburg County is preparing for its FY 2017-2018 Community Development Block Grant Program Annual Action Plan and Funding Allocation. As an Entitlement County, it anticipates receiving approximately
Employee Telecommuting Study
 Employee Telecommuting Study June Prepared For: Valley Metro Valley Metro Employee Telecommuting Study Page i Table of Contents Section: Page #: Executive Summary and Conclusions... iii I. Introduction...
NAPA COUNTY GRAND JURY
 NAPA COUNTY GRAND JURY 2016-2017 June 22, 2017 FINAL REPORT NAPA VALLEY TRANSPORTATION AGENCY VISION 2040 PLAN County Traffic Problems Need a Comprehensive Plan with Measurable Results 2 NAPA VALLEY TRANSPORTATION
GWINNETT COUNTY, GEORGIA
 GWINNETT COUNTY, GEORGIA ACTION PLAN 2007 OF CONSOLIDATED PLAN 2006-2010 SUBMITTED TO: UNITED STATES DEPARTMENT OF HOUSING AND URBAN DEVELOPMENT ATLANTA OFFICE OF COMMUNITY PLANNING AND DEVELOPMENT 40
July 1, 2015 thru September 30, 2015 Performance Report
 Grantee: Grant: Kern County, CA B-08-UN-06-0501 July 1, 2015 thru September 30, 2015 Performance Report 1 Grant Number: B-08-UN-06-0501 Grantee Name: Kern County, CA Grant Award Amount: $11,211,385.00
REQUEST FOR PROPOSALS. Uptown Main Street/US 25 Traffic Calming Analysis. Date Issued: June 5, 2018
 i REQUEST FOR PROPOSALS Uptown Main Street/US 25 Traffic Calming Analysis Date Issued: June 5, 2018 REQUEST FOR PROPOSALS (RFP) INSTRUCTIONS 1.1 Project Introduction The City of Greenwood (City) desires
ANNUAL REPORT TRANSFORMING A FORT INTO AN ECONOMIC FORCE
 017 ANNUAL REPORT TRANSFORMING A FORT INTO AN ECONOMIC FORCE 2017 ANNUAL REPORT CELEBRATING 100 YEARS THE BEGINNING Final Review of the 26th Division, Camp Devens GROWING IMPORTANCE 2017 marks the 100-year
Summary of Findings. Data Memo. John B. Horrigan, Associate Director for Research Aaron Smith, Research Specialist
 Data Memo BY: John B. Horrigan, Associate Director for Research Aaron Smith, Research Specialist RE: HOME BROADBAND ADOPTION 2007 June 2007 Summary of Findings 47% of all adult Americans have a broadband
HOME Investment Partnerships APPLICATION
 PY 2016 APPLICATION CYCLE APPLICATION CDBG PROGRAM OFFICE 121 Haynes Street, Marietta, GA 30060 Submission Requirements 2016 Application Instructions INTRODUCTION The Program (HOME) provides formula grants
Annual Job Growth Projected to Approach 60,000 by 2017
 For Immediate Release May 1, 2015 Annual Job Growth Projected to Approach 60,000 by 2017 Carson City, NV Nevada s employment outlook continues to show positive signs for the state s mending economy, according
Dane County Comprehensive Plan Economic Development Goals & Objectives HED Work Group July 7, 2006
 Dane County Comprehensive Plan Economic Development Goals & Objectives HED Work Group July 7, 2006 Section I. Goal 1: Dane County will help to build and promote a robust, sustainable economy that enhances
ENTERPRISE ROSE ARCHITECTURAL FELLOWSHIP ITHACA NEIGHBORHOOD HOUSING SERVICES, ITHACA, NY
 ENTERPRISE ROSE ARCHITECTURAL FELLOWSHIP ITHACA NEIGHBORHOOD HOUSING SERVICES, ITHACA, NY Opportunity for a two-year fellowship beginning in January 2019 JUL. 15, 2018 SEP. 2018 NOV. 2018 JAN. 01, 2019
Request for Proposal Project Based Housing and Urban Development Vouchers that Serve the Homeless
 Request for Proposal Project Based Housing and Urban Development Vouchers that Serve the Homeless Housing Authority of the City of Reno Serving Reno, Sparks, and Washoe County Release Date: June 16, 2016
Strategic Transportation Infrastructure Program
 Strategic Transportation Infrastructure Program Guidelines Community Airport Program Local Road Bridge Program Resource Road Program Local Municipal Initiatives Updated: September 2017 Government STIP
Final Report No. 101 April Trends in Skilled Nursing Facility and Swing Bed Use in Rural Areas Following the Medicare Modernization Act of 2003
 Final Report No. 101 April 2011 Trends in Skilled Nursing Facility and Swing Bed Use in Rural Areas Following the Medicare Modernization Act of 2003 The North Carolina Rural Health Research & Policy Analysis
2018 POLICY FRAMEWORK FOR PSRC S FEDERAL FUNDS
 2018 POLICY FRAMEWORK FOR PSRC S FEDERAL FUNDS TABLE OF CONTENTS Section 1: Background... 3 A. Policy Framework... 3 B. Development of the 2019-2022 Regional Transportation Improvement Program (TIP)..
Yale University 2017 Transportation Survey Report February 2018
 Walking and riding trollies to Yale Bowl for a football game. Photo courtesy of Yale University. Yale University 2017 Transportation Survey Report February 2018 A campus-wide transportation survey was
Wyoming Main Street Application Certified or Affiliate Levels (Letter of intent is due October 2, 2017) (Application is due December 1, 2017)
 (Application is due December 1, 2017)") Wyoming Main Street Application Certified or Affiliate Levels (Letter of intent is due October 2, 2017) (Application is due December 1, 2017) Submitted by: (Community) (Date) Wyoming Main Street Wyoming
Wyoming Main Street Application Certified or Affiliate Levels (Letter of intent is due October 2, 2017) (Application is due December 1, 2017) Submitted by: (Community) (Date) Wyoming Main Street Wyoming
Broadband KY e-strategy Report
 Broadband KY e-strategy Report Utilizations and Impacts of Broadband for Businesses, Organizations and Households This report was prepared by Strategic Networks Group in partnership with. May 24, 2012
COSCDA Federal Advocacy Priorities for Fiscal Year 2008
 COSCDA Federal Advocacy Priorities for Fiscal Year 2008 The Council of State Community Development Agencies (COSCDA) represents state community development and housing agencies responsible for administering
CITY OF GRANTS PASS SURVEY
 CITY OF GRANTS PASS SURVEY by Stephen M. Johnson OCTOBER 1998 OREGON SURVEY RESEARCH LABORATORY UNIVERSITY OF OREGON EUGENE OR 97403-5245 541-346-0824 fax: 541-346-5026 Internet: OSRL@OREGON.UOREGON.EDU
REQUEST FOR PROPOSALS
 REQUEST FOR PROPOSALS Downtown Triangle Redevelopment 1 st Street North, East Jackson Street, and Market Street City of Wisconsin Rapids 444 West Grand Avenue, Wisconsin Rapids, WI 54495 February 2017
Proposal for Better Aligning Block Groups & TAZs
 Proposal for Better Aligning Block Groups & TAZs Pennsylvania Data User Conference Ben Gruswitz Senior Planner, Office of Long-Range Planning CTPP Oversight Board Member Kim Korejko Manager of Data Coordination
Fal January M. T h o m s o n C o n s u l t i n g
 January 2016 Summary of the Sunshine Coast Housing Committee s Term 2013-2015 Provided to the Sunshine Coast Regional District, District of Sechelt and Town of Gibsons by Matt Thomson Coordinator for the
MASSACHUSETTS GAMING COMMISSION. Introducing the successful and ethical development of expanded gaming to the Commonwealth
 MASSACHUSETTS GAMING COMMISSION Introducing the successful and ethical development of expanded gaming to the Commonwealth AN ACT ESTABLISHING EXPANDED GAMING On November 22, 2011, Governor Deval Patrick
Partial Action Plan No. 5 for Tourism and Communications
 DRAFT FOR PUBLIC COMMENT (AS OF 9/18/03) LOWER MANHATTAN DEVELOPMENT CORPORATION Overview Partial Action Plan No. 5 for Tourism and Communications The Lower Manhattan Development Corporation (LMDC) has
Kitsap County Coordinated Grant Application Process 2019 Notice of Funding Availability
 Kitsap County Coordinated Grant Application Process 2019 Notice of Funding Availability Kitsap County Department of Human Services Block Grant Program & Housing and Homelessness Program Table of Contents
Neighborhood Traffic Calming (NTC) Program Update. Rebranded: Neighborhood Traffic Safety Program. Version: NTC Program Update, Living Document v8
 Program Update. Rebranded: Neighborhood Traffic Safety Program. Version: NTC Program Update, Living Document v8") Neighborhood Traffic Calming (NTC) Program Update Rebranded: Neighborhood Traffic Safety Program Version: NTC Program Update, Living Document v8 Last Updated: October 15, 2014 Why Update the NTC Program?
Neighborhood Traffic Calming (NTC) Program Update Rebranded: Neighborhood Traffic Safety Program Version: NTC Program Update, Living Document v8 Last Updated: October 15, 2014 Why Update the NTC Program?
Counting for Dollars: Sonoma County, California
 Counting for Dollars: Sonoma County, California Federal Assistance Programs that Distributed Funds in Sonoma County, California on the Basis of Census-Related Statistics, Fiscal Year 2008 This table lists
FEDERAL SPENDING AND REVENUES IN ALASKA
 FEDERAL SPENDING AND REVENUES IN ALASKA Prepared by Scott Goldsmith and Eric Larson November 20, 2003 Institute of Social and Economic Research University of Alaska Anchorage 3211 Providence Drive Anchorage,
Counting for Dollars: Mercer County, New Jersey
 Counting for Dollars: Mercer County, New Jersey Federal Assistance Programs that Distributed Funds in Mercer County, New Jersey on the Basis of Census-Related Statistics, Fiscal Year 2008 This table lists
Everett Wallace, James Cavallo, Norman Peterson, and Mary Nelson. March, 1997
 -92645 The submitted manuscript has been authored by a contractor of the U.S. Government under contract No. W-31-109-ENG-38. Accordingly, the U.S.Government retains a nonexclusive, royalty-freelicense
RESIDENT INPUT NEEDED!!!
 RESIDENT INPUT NEEDED!!! A Public hearing will be held January 31, 2017 at 7:00 p.m. in the Arcand Meeting Room Bellingham Municipal Center 10 Mechanic Street, Bellingham MA To discuss a potential grant
ICT SECTOR REGIONAL REPORT
 ICT SECTOR REGIONAL REPORT 1997-2004 (August 2006) Information & Communications Technology Sector Regional Report Definitions (by North American Industrial Classification System, NAICS 2002) The data reported
REQUEST FOR PROPOSAL
 REQUEST FOR PROPOSAL TO: FROM: INTERESTED CONSULTANTS TOWNSHIP OF MOON PROJECT: MOON TOWNSHIP ECONOMIC DEVELOPMENT MARKETING STRATEGY DATE: JULY 2, 2018 SUMMARY The Board of Supervisors of Moon Township,
Traffic Impact Analysis (TIA) POLICY
 POLICY") Ascension Parish Planning Commission Traffic Impact Analysis (TIA) POLICY This policy establishes requirements for studies that provide information on traffic projected to be generated by all proposed
Ascension Parish Planning Commission Traffic Impact Analysis (TIA) POLICY This policy establishes requirements for studies that provide information on traffic projected to be generated by all proposed
ARLINGTON COUNTY, VIRGINIA
 ARLINGTON COUNTY, VIRGINIA County Board Agenda Item Meeting of April 22, 2006 DATE: March 30, 2006 SUBJECT: Approval of the County s Annual Consolidated Plan for Fiscal Year (FY) 2007, which includes the
first edition GEORGIA NONPROFIT Employment Report In the Center of the Industry
 first edition GEORGIA NONPROFIT Employment Report In the Center of the Industry www.gcn.org Georgia Nonprofit Employment Report A joint product of The Johns Hopkins Employment Data Project and the Georgia
2016 Community Development Block Grant (CDBG) General Information
 General Information") Housing & Community Development Services 1690 W. Littleton Blvd. Suite 300 Littleton, CO 80120 (303) 738-8040 2016 Community Development Block Grant (CDBG) General Information The Community Development
Housing & Community Development Services 1690 W. Littleton Blvd. Suite 300 Littleton, CO 80120 (303) 738-8040 2016 Community Development Block Grant (CDBG) General Information The Community Development
Office of Oregon Health Policy and Research. Oregon Nursing Homes. A report on the utilization of nursing homes in the State of Oregon in 2002
 Office of Oregon Health Policy and Research Oregon Nursing Homes A report on the utilization of nursing homes in the State of Oregon in 2002 Winter 2003 Oregon Nursing Homes A report on the utilization
Higher Education Employment Report
 Higher Education Employment Report Second Quarter 2017 / Published December 2017 Executive Summary The number of jobs in higher education increased 0.8 percent, or 29,900 jobs, during the second quarter