NAVAL POSTGRADUATE SCHOOL THESIS
|
|
|
- Emma Bailey
- 6 years ago
- Views:
Transcription

1 NAVAL POSTGRADUATE SCHOOL MONTEREY, CALIFORNIA THESIS SIGNIFICANT FACTORS IN PREDICTING PROMOTION TO MAJOR, LIEUTENANT COLONEL, AND COLONEL IN THE UNITED STATES MARINE CORPS by Joel M. Hoffman March 2008 Thesis Co-Advisors: Bill Hatch Elda Pema Approved for public release; distribution is unlimited.
2 THIS PAGE INTENTIONALLY LEFT BLANK
3 REPORT DOCUMENTATION PAGE Form Approved OMB No Public reporting burden for this collection of information is estimated to average 1 hour per response, including the time for reviewing instruction, searching existing data sources, gathering and maintaining the data needed, and completing and reviewing the collection of information. Send comments regarding this burden estimate or any other aspect of this collection of information, including suggestions for reducing this burden, to Washington headquarters Services, Directorate for Information Operations and Reports, 1215 Jefferson Davis Highway, Suite 1204, Arlington, VA , and to the Office of Management and Budget, Paperwork Reduction Project ( ) Washington DC AGENCY USE ONLY (Leave blank) 2. REPORT DATE March REPORT TYPE AND DATES COVERED Master s Thesis 4. TITLE AND SUBTITLE: Significant Factors in Predicting Promotion to Major, Lieutenant Colonel, and Colonel in the United States Marine Corps 6. AUTHOR(S) Joel M. Hoffman 7. PERFORMING ORGANIZATION NAME(S) AND ADDRESS(ES) Naval Postgraduate School Monterey, CA SPONSORING /MONITORING AGENCY NAME(S) AND ADDRESS(ES) N/A 5. FUNDING NUMBERS 8. PERFORMING ORGANIZATION REPORT NUMBER 10. SPONSORING/MONITORING AGENCY REPORT NUMBER 11. SUPPLEMENTARY NOTES The views expressed in this thesis are those of the author and do not reflect the official policy or position of the Department of Defense or the U.S. Government. 12a. DISTRIBUTION / AVAILABILITY STATEMENT 12b. DISTRIBUTION CODE Approved for public release; distribution is unlimited 13. ABSTRACT (maximum 200 words) Multiple factors influence a Marine officer s probability of promotion. Currently, MMOA-4 counselors are not able to provide career advice based on statistical analysis of the multitude of variables that could be significant in an officer s potential to advance to the next higher grade. Development of a statistical counseling model provides MMOA-4 the ability to examine an officer s current predicted probability of promotion as well as his future potential for advancement given a set of possible career choices. Such a model may increase the effectiveness of the career counseling process and potentially impact USMC officer retention and performance. This study makes recommendations to improve the Marine Corps Performance Evaluation System (PES). The researcher s analysis of eight years of fitness report data indicates that current procedures (which use raw numbers to evaluate the effects of the Reviewing Officer s (RO) assessment) should be changed to a percentile system. The current system only provides a generalized output that has limited value in fitness report analysis. The raw numbers of the comparative assessment limit the possibility of comparing officers across a grade for each RO. The exact value of the percentile system allows for officers to be differentiated and compared across grade. This is similar to the relative value system used for Reporting Senior (RS) markings. This new system will allow officers to be shown as below average, average or above average for each RO, similarly to what is currently being recorded by each RS. Ultimately, this would increase the effectiveness of retention, promotion, command, and resident school selections by empowering the board members with the ability to screen officers utilizing the RO percentile system. 14. SUBJECT TERMS Marine Corps, Officer Promotions, Officer Career, Human Resource Management. 17. SECURITY CLASSIFICATION OF REPORT Unclassified 18. SECURITY CLASSIFICATION OF THIS PAGE Unclassified i 19. SECURITY CLASSIFICATION OF ABSTRACT Unclassified 15. NUMBER OF PAGES PRICE CODE 20. LIMITATION OF ABSTRACT NSN Standard Form 298 (Rev. 2-89) Prescribed by ANSI Std UU
4 THIS PAGE INTENTIONALLY LEFT BLANK ii
5 Approved for public release; distribution is unlimited SIGNIFICANT FACTORS IN PREDICTING PROMOTION TO MAJOR, LIEUTENANT COLONEL, AND COLONEL IN THE UNITED STATES MARINE CORPS Joel M. Hoffman Major, United States Marine Corps B.S., Indiana University, 1993 Submitted in partial fulfillment of the requirements for the degree of MASTER OF SCIENCE IN MANAGEMENT from the NAVAL POSTGRADUATE SCHOOL March 2008 Author: Joel M. Hoffman Approved by: Bill Hatch Thesis Co-Advisor Elda Pema Thesis Co-Advisor Robert N. Beck Dean, Graduate School of Business and Public Policy iii
6 THIS PAGE INTENTIONALLY LEFT BLANK iv
7 ABSTRACT Multiple factors influence a Marine officer s probability of promotion. Currently, MMOA-4 counselors are not able to provide career advice based on statistical analysis of the multitude of variables that could be significant in an officer s potential to advance to the next higher grade. Development of a statistical counseling model provides MMOA-4 the ability to examine an officer s current predicted probability of promotion as well as his future potential for advancement given a set of possible career choices. Such a model may increase the effectiveness of the career counseling process and potentially impact USMC officer retention and performance. This study makes recommendations to improve the Marine Corps Performance Evaluation System (PES). The researcher s analysis of eight years of fitness report data indicates that current procedures (which use raw numbers to evaluate the effects of the Reviewing Officer s (RO) assessment) should be changed to a percentile system. The current system only provides a generalized output that has limited value in fitness report analysis. The raw numbers of the comparative assessment limit the possibility of comparing officers across a grade for each RO. The exact value of the percentile system allows for officers to be differentiated and compared across grade. This is similar to the relative value system used for Reporting Senior (RS) markings. This new system will allow officers to be shown as below average, average or above average for each RO, similarly to what is currently being recorded by each RS. Ultimately, this would increase the effectiveness of retention, promotion, command, v
8 and resident school selections by empowering the board members with the ability to screen officers utilizing the RO percentile system. vi
9 TABLE OF CONTENTS I. INTRODUCTION...1 A. BACKGROUND...1 B. PROBLEM...6 C. PURPOSE...7 D. RESEARCH QUESTIONS Primary Research Question Secondary Research Questions...8 E. SCOPE AND LIMITATIONS...9 F. ORGANIZATION OF THE STUDY...9 II. MARINE CORPS OFFICER PROMOTIONS...11 A. LAWS, INSTRUCTIONS, AND ORDERS GOVERNING PROMOTION Promotion Process...12 B. MANPOWER MANAGEMENT PROMOTION BRANCH (MMPR)...25 III. LITERATURE REVIEW...27 A. OVERVIEW...27 B. PROMOTION Study by Long (1992) Study by Hamm (1993) Study by Grillo (1996) Study by Wielsma (1996) Study by Branigan (2001) Study by Ergun (2003) Study by Morgan (2005) Study by Perry (2006)...37 C. SUMMARY...38 IV. DATA AND PRELIMINARY ANALYSIS...41 A. DATA SOURCES TFDW & MMSB Data Data Issues...43 B. VARIABLES Dependent Variable Independent Variables...49 a. Demographics...49 b. Performance...53 c. Military Occupational Field...64 d. Combat...68 e. Commissioning...74 f. Assignment...79 C. SUMMARY...84 V. MODELS AND RESULTS...87 A. OVERVIEW...87 vii
10 B. MAJOR (O-4) PROMOTION MODEL Development of the Major Promotion Model Interactive Major Promotion Model...99 C. LIEUTENANT COLONEL (O-5) PROMOTION MODEL Development of the Lieutenant Colonel Promotion Model Interactive Lieutenant Colonel Promotion Model D. COLONEL (0-6) PROMOTION MODEL Development of the Colonel Promotion Model Interactive Colonel Promotion Model VI. CONCLUSIONS AND RECOMMENDATIONS A. CONCLUSIONS Limitations B. RECOMMENDATIONS APPENDIX A. MARINE CORPS PHYSICAL FITNESS TEST STANDARDS APPENDIX B. FEMALE PFT SCORING TABLE APPENDIX C. MALE PFT SCORING TABLE APPENDIX D. SAMPLE MASTER BRIEF SHEET FITNESS REPORT LISTINGS (MBS) APPENDIX E. MARINE CORPS FITNESS REPORT APPENDIX F. REPORTING SENIOR AND REVIEWING OFFICER PROFILES 157 APPENDIX G. REVIEWING OFFICER COMPARATIVE ASSESSMENT PROFILE161 APPENDIX H. INTERACTIVE MAJOR PROMOTION MODEL SNAPSHOT EXAMPLES APPENDIX I. INTERACTIVE LIEUTENANT COLONEL PROMOTION MODEL SNAPSHOT EXAMPLES APPENDIX J. INTERACTIVE COLONEL PROMOTION MODEL SNAPSHOT EXAMPLES LIST OF REFERENCES INITIAL DISTRIBUTION LIST viii
11 LIST OF FIGURES Figure 1. Manpower & Reserve Affairs Task Organization...2 Figure 2. Manpower Management Task Organization...3 Figure 3. Task Organization for Officer Assignments...4 Figure 4. Example Ground Career Path...5 Figure 5. Fiscal Year 2007 Promotion Flow Points...6 Figure 6. Manpower Management Task Organization...25 Figure 7. Reviewing Officer Description and Comparative Assessment...61 Figure 8. Response Probability for Binary Response Model..88 Figure 9. Probit Model...88 Figure 10. PFT Partial Effects for Major Promotion Board...95 Figure 11. Personal Awards Partial Effects for Major Promotion Board...96 Figure 12. Resident Career Level School Partial Effects for Major Promotion Board...97 Figure 13. Cumulative Relative Value Partial Effects for Figure 14. Major Promotion board...98 Cumulative Reviewing Officer Standard Deviation Partial Effects for Major Promotion Board...99 Figure 15. PFT Partial Effects for Lieutenant Colonel Promotion Board Figure 16. Combat Tour Partial Effects for Lieutenant Colonel Promotion Board Figure 17. Resident Intermediate Level School Partial Effects for Lieutenant Colonel Promotion Board.108 Figure 18. Figure 19. Figure 20. Cumulative Relative Value Partial Effects for Lieutenant Colonel Promotion Board Cumulative Reviewing Officer Percentile Partial Effects for Lieutenant Colonel Promotion Board.111 Cumulative Reviewing Officer Standard Deviation Partial Effects for Lieutenant Colonel Promotion Board Figure 21. Combat Tour Partial Effects for Colonel Promotion Board Figure 22. Post-college Education Partial Effects for Colonel Promotion Board Figure 23. Commander Billet Partial Effects for Colonel Promotion Board Figure 24. Cumulative RO Percentile Partial Effects for Colonel Promotion Board ix
12 THIS PAGE INTENTIONALLY LEFT BLANK x
13 LIST OF TABLES Table 1. Promotion Flow Points...22 Table 2. Race and Ethnic Profile Data...24 Table 3. TFDW Data and In-zone Population Comparison...44 Table 4. Description of Variables...44 Table 5. Promotion Statistics for FY08 In-zone Population...49 Table 6. Demographic-descriptive Statistics of Captains Selected and Not Selected for Promotion...50 Table 7. Demographic-descriptive Statistics of Majors Selected and Not Selected for Promotion...51 Table 8. Demographic-descriptive Statistics of Lieutenant Colonels Selected and Not Selected Table 9. for Promotion...52 Performance-descriptive Statistics of Captains Selected and Not Selected for Promotion...54 Table 10. Performance-descriptive Statistics of Majors Selected and Not Selected for Promotion...55 Table 11. Performance-descriptive Statistics of Lieutenant Colonels Selected and Not Selected for Promotion...56 Table 12. Example of Reviewing Officer Percentile System..63 Table 13. Military Occupational Field-descriptive Statistics of Captains Selected and Not Selected for Promotion...65 Table 14. Military Occupational Field-descriptive Statistics of Majors Selected and Not Selected for Promotion...65 Table 15. Military Occupational Field-descriptive Statistics of Lieutenant Colonels Selected and Not Selected for Promotion...66 Table 16. Combat-descriptive Statistics of Captains Selected and Not Selected for Promotion...69 Table 17. Combat-descriptive Statistics of Majors Selected and Not Selected for Promotion...69 Table 18. Combat-descriptive Statistics of Lieutenant Colonels Selected and Not Selected for Promotion...70 Table 19. Replaced Missing Values for Combat_Service Variable...72 Table 20. Combat Deployments...73 Table 21. Commissioning-descriptive Statistics of Captains Selected and Not Selected for Promotion...75 xi
14 Table 22. Commissioning-descriptive Statistics of Majors Selected and Not Selected for Promotion...76 Table 23. Commissioning-descriptive Statistics of Lieutenant Colonels Selected and Not Selected for Promotion...76 Table 24. Commissioning Mean Directional Effect on Selection for Promotion...77 Table 25. Assignment-descriptive Statistics of Captains Selected and Not Selected for Promotion...79 Table 26. Assignment-descriptive Statistics of Majors Selected and Not Selected for Promotion...80 Table 27. Assignment-descriptive Statistics of Majors Selected and Not Selected for Promotion...81 Table 28. Mean Comparison of Select & Non-select Samples..85 Table 29. Major Promotion Model Specifications...89 Table 30. Major Promotion Model Results...90 Table 31. Interactive Major Promotion Model Table 32. Lieutenant Colonel Promotion Model Specifications Table 33. Lieutenant Colonel Promotion Model Results Table 34. Interactive Lieutenant Colonel Promotion Model.113 Table 35. Colonel Promotion Model Specifications Table 36. Colonel Promotion Model Results Table 37. Table 38. Interactive Colonel Promotion Model Major Promotion Model Statistically Significant Independent Variables Table 39. Lieutenant Colonel Promotion Model Statistically Significant Independent Variables132 Table 40. Colonel Promotion Model Statistically Significant Independent Variables xii
15 ACKNOWLEDGMENTS I would like to thank all the individuals who provided support for my thesis. This was by no means an individual project. The support that everyone provided along the way was instrumental in my completion of the thesis. I apologize to those that I have unintentionally failed to mention. First, I appreciate the support from LtCol Ian Courtney (MMOA-4), LtCol William McWaters (MMPR), LtCol John Meade (MMSB), Maj Mike Bruno (M&RA), CWO-4 Jeff Stocker (MCD DLIFLC), and Mr. Scott Beebe (SAIC). Without them, this thesis would have a much lower level of detail. Next, the support from the Naval Postgraduate School (NPS) Acquisition Research Program (ARP) was of a great benefit to my thesis research. Specifically, Karey Shaffer and David Wood provided outstanding support in my efforts to complete my thesis. I appreciate the efforts of Janis Higginbotham and Pam Silva (NPS Thesis Processors) for always keeping me on track. Also, Professor Samuel Buttrey went the extra mile to show me how to build my promotion model in excel. I would not have completed this thesis without the guidance and support from my thesis advisors. CDR Bill Hatch, USN (Ret) and Professor Elda Pema were the key elements to the successful completion of my thesis. I can not thank them enough for all their help along this long journey. xiii
16 Finally, I want to thank my wife Sarah for all her loving support. She always understood when I had to go in and work on my thesis on the weekends. She never complained and was always there to give me words of encouragement. I could not have asked for a more loving and supportive wife. And for my children, Thomas and Riley, who probably are too young to understand why daddy had to do homework on the weekends. Hopefully, some day you will understand why daddy was always gone working on his thesis. xiv
17 I. INTRODUCTION As our corps' postures for the long war, and in order to help meet the challenges of frequent deployments, I want our corps' leadership to initiate policies to ensure all Marines, first termers and career Marines alike, are provided the ability to deploy to a combat zone. 1 General James T. Conway, USMC A. BACKGROUND The Marine Corps annually holds promotion boards to select its best-qualified officers for promotion. Marine Officer careers are examined in detail during the promotion board process. It is this examination that determines who qualifies for promotion and who fails selection. It is incumbent on the officers to ensure they are competitive for promotion; yet, it is the responsibility of the Marine Corps to ensure that individual officers understand the factors that will make them competitive among their peers. For this reason, Headquarters Marine Corps (HQMC) works to counsel officers on those factors that will make them competitive for promotion. Within Headquarters Marine Corps (HQMC), Manpower and Reserve Affairs (M&RA) functions as the Commandant s principal organization for supporting the human resource requirements of the Marine Corps. Manpower & Reserve Affairs assists the Commandant by planning, directing, 1 General Conway made this statement in ALMAR 002/07 while serving as the Commandant of the Marine Corps (Headquarters Marine Corps (HQMC), 2007, January 23). 1

18 coordinating, and supervising both active and reserve forces (HQMC, M&RA, PMD, 2007). Figure 1 provides the organizational structure for M&RA including the six divisions and Wounded Warrior Regiment that comprise the command structure. Figure 1. Manpower & Reserve Affairs Task Organization (Source: HQMC, M&RA, MMOA, Road Show Brief, 2007, August 5) Within M&RA exists the Manpower Management (MM) Division. The MM Division is broken down into ten branches that encompass a variety of personnel support missions. Their mission states that: Manpower Management, under the direction of the Director, Personnel Management Division, is responsible for the administration, retention, distribution, appointment, evaluation, awarding, promotion, retirement, discharge, separation, and 2
 Figure 2")
19 service records of commissioned officers, warrant officers, and enlisted personnel of the Marine Corps and Marine Corps Reserves. (HQMC, M&RA, MM, 2007) Figure 2 provides the organizational structure for the MM Division. Figure 2. Manpower Management Task Organization (Source: HQMC, M&RA, MMOA, Road Show Brief, 2007, August 5) Finally, the Manpower Management Officer Assignments-4 (MMOA-4) or Career Counseling Section falls under the organizational structure of the Manpower Management Officer Assignments (MMOA) Branch within the MM Division. The Career Counseling Section exists to support Marines with their career decisions. The mission of the Career Counseling Section is as follows: 3

20 Our mission is to provide, upon request, counseling to officers concerning competitiveness, future career decisions, and failure of selection for promotion to grades CWO- 2 to O-6. Additionally, MMOA-4 provides advisory opinions to the Board for Correction of Naval Records, responses to General Officer Inquiries, and other staff actions concerning review of Official Military Personnel Files. (HQMC, M&RA, MM, MMOA-4, 2007a) Figure 3 provides the task organization of MMOA, which contains the Career Counseling Section (MMOA-4). Figure 3. Task Organization for Officer Assignments 5) (Source: HQMC, M&RA, MMOA, Road Show Brief, 2007, August In keeping with its mission statement, the Career Counseling Section provides officers both with information 4

21 regarding possible career paths as well as guidance regarding career planning. Figure 4 is an example of a possible career path for a ground officer that the Career Counseling Section uses to counsel officers. Within this career path exists assignments within the operating forces, supporting establishment, joint establishment and the appropriate level of schooling. Figure 4. Example Ground Career Path (Source: HQMC, M&RA, MMOA-4, 2007) In order for officers to understand where they are in regards to their career progression, the Career Counseling Section counsels officers on promotion flow points. Figure 5 provides the average Time in Service (TIS) for officer promotions, as of Fiscal Year (FY) The promotion flow points established in the figure are in accordance with the 5
22 regulations set forth by the Defense Officer Personnel Management Act (DOPMA) (HQMC, M&RA, MM, 2007, June 27, Slide 1). Figure 5. Fiscal Year 2007 Promotion Flow Points (Source: HQMC, M&RA, MMOA-4, 2007) B. PROBLEM There are multiple factors considered when an officer is a candidate for promotion. Potential factors considered in promotion would be strong performance, Professional Military Education (PME) completion, first-class Physical Fitness Test (PFT), Military Occupational Specialty (MOS) credibility, and proper military appearance in the official photograph (HQMC, M&RA, MM, 2007, June 27, Slide 5). Currently, the Career Counseling Section possesses the 6
23 capability to counsel officers on descriptive statistics. For instance, they can inform officers that 70.1 percent of the in-zone officers that were selected for promotion to lieutenant colonel attended Intermediate Level School (ILS) (HQMC, M&RA, MM, 2006, September 22, p. 3). However, they do not possess the ability to counsel officers based on multivariate data analysis of variables that could be significant in predicting promotion. A multivariate data analysis system would be able to examine the predicted probability of selection for promotion while holding all other observable factors constant. Additionally, a model based on multivariate data analysis would be able to assist the Career Counseling Section with the quantitative aspects of the officer counseling process. C. PURPOSE First, the purpose of this research is to provide the career counseling section (MMOA-4) of Manpower and Reserve Affairs with multivariate data analysis and a model to support the officer counseling process. Additionally, this research will identify and evaluate significant factors in the selection for promotion. The results would be relevant both to officers in their efforts to advance their careers, and to the MMOA-4 in counseling them on promotion decisions. The current system is unable to examine the individual effects of key factors on selection for promotion. This is why the multivariate data analysis is superior to descriptive statistics. It will give the Career Counseling Section the ability to isolate a variable and to show the effect it has on promotion selection, while holding the other observable variables constant. 7
24 Second, this studies purpose is to improve the Performance Evaluation System (PES). The current system only provides a generalized output that has limited value in fitness report analysis. The raw numbers of the comparative assessment limit the possibility of comparing officers across a grade for each RO. The exact value of the percentile system allows for officers to be differentiated and compared across grade. This is similar to the relative value system used for Reporting Senior (RS) markings. This new system will allow officers to be shown as average, above average or below average for each RO, similarly to what is currently being recorded by each RS. Ultimately, this would increase the effectiveness of retention, promotion, command, and resident school selections by empowering the board members with the ability to screen officers with the RO percentile system. D. RESEARCH QUESTIONS 1. Primary Research Question What variables are significant in predicting promotion to major, lieutenant colonel, and colonel in the United States Marine Corps? 2. Secondary Research Questions a. Since the beginning of the current Global War on Terror (GWOT), what effect does combat service have on an officer s likelihood for promotion? b. What effects do physical fitness levels have (as measured by the Physical Fitness Test (PFT)) on promotions? 8
25 c. How significant are Fitness Reports (FITREPS) in predicting promotion? E. SCOPE AND LIMITATIONS The scope of the research will include a review of Marine Corps performance and promotion directives, an indepth review of current promotion statistics, an evaluation of the Marine Corps Total Force System (MCTFS) data contained within the Total Force Data Warehouse (TFDW), and a discussion of the feasibility of converting Fitness Report information into useable data. The thesis will conclude with a recommendation for transitioning the Career Counseling Section to a system that uses quantitative data analysis for officer counseling. The methodology for this research will primarily be quantitative and examined using personnel data from the MCTFS and the TFDW. The other research data will come from the Fitness Report Branch (MMSB) of Headquarters Marine Corps (HQMC). The Fitness Report Branch holds officer evaluations (fitness reports) that the researcher will examine in order to establish performance data. The data will focus on the captains, majors and lieutenant colonels that were in-zone for promotion on the Fiscal Year (FY) 2008 selection boards. F. ORGANIZATION OF THE STUDY This research will be organized into six separate chapters. Chapter I provides an introduction into the general contents of the research. Chapter II examines the current promotion process within the United States Marine Corps. Chapter III reviews the current literature that 9
26 relates to this study. Chapter IV analyzes the TFDW and fitness report data and describes the variables used in the study. Chapter V describes the models and results for the multivariate data analysis conducted in the study. The last chapter will provide a summary with conclusions, limitations, and recommendations. 10
27 II. MARINE CORPS OFFICER PROMOTIONS I guarantee you... if you have a six- to seven-year war and you don t get to the war zone, you needn t wonder what s going to happen when it s time for promotion. 2 Lieutenant General Ronald Coleman, USMC A. LAWS, INSTRUCTIONS, AND ORDERS GOVERNING PROMOTION The Marine Corps officer promotion system is based on a hierarchal structure of laws, instructions, and orders. In a military framework, the laws can be associated with strategic guidance, the instructions with operational guidance, and the orders with tactical guidance. The hierarchy originates with Congress establishing the foundation for the basis of promotions based on law. The Department of Defense (DoD) passes instruction down to the Secretary of the Army, Navy, and Air Force contained within a Department of Defense Instruction (DODINST). In turn, the Secretary of the Navy (SECNAV) establishes policies and procedures in the form of a Secretary of the Navy Instruction (SECNAVINST) for the Chief of Naval Operations (CNO) and the Commandant of the Marine Corps (CMC). Finally, the CMC provides clarifying information on the promotion process by issuing a Marine Corps Order (MCO) that is consistent and in-line with all of the above regulations. 2 Lieutenant General Coleman made this comment while serving as the Deputy Commandant for Manpower and Reserve Affairs. The statement was made at a Marine Corps Association meeting on 15 August 2007 and was published in the 27 August 2007 Marine Corps Times. 11
28 1. Promotion Process Title 10, United States Code is the foundation for officer promotions within the Department of Defense (DoD). It gives the military departments direction for the promotion process. The process begins with the law establishing the requirement for selection boards within each military department. The law states: Whenever the needs of the service require, the Secretary of the military department concerned shall convene selection boards to recommend for promotion to the next higher permanent grade, under subchapter II of this chapter, officers on the active-duty list in each permanent grade from first lieutenant through brigadier general in the Army, Air Force, or Marine Corps and from lieutenant (junior grade) through rear admiral (lower half) in the Navy. (USC, 2004, Title 10, p. 611) In the Department of the Navy (DoN), the selection board convenes when the Secretary of the Navy (SECNAV) releases the precept (Secretary of the Navy, 2006, March 28, p. 12). The precept identifies the members of the board including the board president and their responsibilities while serving on the promotion selection board (p. 12). The law within Title 10 also regulates the composition of the military department selection boards. The composition establishes requirements for grade, competitive category, active-duty, successive selection boards, and joint-duty assignments (USC, 2004, Title 10, pp ). The Department of Defense builds upon the law by tasking the Chairman of the Joint Chiefs of Staff (CJCS) with selecting an officer currently in a joint-duty billet to serve as a selection board member. This is conducted to ensure the 12
29 selection board fairly evaluates those officers eligible for promotion that are serving or who have already served on joint duty (DoD, 1996, September 24, p. 2). In order for the Navy to maintain an ethical and impartial board, each member is required to take an oath. Title 10 states: Each member of a selection board shall swear that he will perform his duties as a member of the board without prejudice or partiality and having in view both the special fitness of officers and the efficiency of his armed force. (USC, 2004, Title 10, p. 613) Safeguards are also in place to ensure that members of the board may ask their Service Secretary to be relieved as a board member if they believe they can not execute their duties without prejudice or partiality (DoD, 1996, September 24, p. 9). Title 10 governs the minimum time period that an officer must be notified of an upcoming selection board. It requires that each officer must be notified at least 30 days prior to the convening of a selection board (USC, 2004, Title 10, p. 614). Department of Defense Instruction (DODINST ) regulates that only the Secretary of the Military Department may personally address the selection board (DoD, 1996, September 24, p. 7). Within the boundaries of the law, each officer is authorized to communicate in writing, audio, or video with the promotion board (p. 9). This allows each officer the ability to incorporate material they feel may potentially help improve their opportunity for promotion. Policy on what information may be provided to a selection board is established by Title 10. This exists to 13
30 protect the interests of each officer that is eligible for promotion. Title 10 regulates the material contained in an officer s official military personnel file (OMPF) and any information that the Secretary of that military department views as important to the selection-board process (USC, 2004, Title 10, p. 614). Finally, information that is provided to the board must also be given to the officer in question. Title 10 requires, (i) that such information is made available to such officer; and (ii) that the officer is afforded a reasonable opportunity to submit comments on that information to the selection board (p. 615). The administrative procedures for the Secretary of each of the military departments are regulated by Title 10. These procedures are used when a service convenes a selection board. The law governs the number of officers that may be selected for promotion, names of the eligible officers, service records, guidance on the specific skills needed by the service, and any other information that may be relevant to the promotion board (p. 615). Additionally, the Secretary of Defense (SECDEF) and the Chairman of the Joint Chiefs of Staff (CJCS) work together to provide guidance to the Service Secretaries on the equal treatment of officers who are serving or have already served in a joint-duty assignment (p. 615). Finally, the law provides strict procedures for selection boards ability to change material once it has been provided to the board in order to maintain the integrity of the promotion process. Selection boards are provided specific direction on how an officer will be selected for promotion within the precept. The precept informs the board to select those 14
31 officers that have continued to demonstrate strong performance during their military careers and have the ability to serve at the next grade. Title 10 policy requires boards to select officers for promotion based on the following criteria: considers best qualified for promotion within each competitive category considered by the board (p. 616). Beyond selecting the best-qualified officer for promotion, selection boards isolate and identify certain skill sets that are important to that particular Service. Department of Defense Instruction (DODINST ) specifies the requirements of identifying the need for critical skills to the Service Secretaries: Information or guidelines on the needs of the Service concerned for officers having particular skills, including guidelines or information on the need for either a minimum number, or a maximum number, of officers with particular skills in a competitive category. Information or guidelines on officers with particular skills must be furnished to the board as part of the written instructions provided to the board at the time the board is convened. (DoD, 1996, September 24, p. 6) The boards are also provided detailed guidelines on how many officers may be selected within each of the promotion categories. The board is only limited to selecting 10 percent of officers from the below zone, and the board is authorized to exceed the allowable number of selections by up to 15 percent (USC, 2004, Title 10, p. 614). As noted earlier, the board selects the best-qualified officer for promotion from those that have been identified with a particular skill set. With this criterion, the law goes on to define the exact responsibilities of the 15
32 selection board when recommending an officer for promotion. The two criteria for selection are: (1) the officer receives the recommendation of a majority of the members of the board; and (2) a majority of the members of the board finds that the officer is fully qualified for promotion (p. 616). To keep the selection-board process from being influenced by outside authorities, the law outlines the protections that are afforded to the board members. These protections are in place to ensure that an officer does not feel undue pressure or command influence in the execution of his duties while serving as a member of the selection board. Additionally, Department of Defense Instruction (DODINST ) tasks the Secretaries of the military departments with providing written guidance to the members of the selection boards to maintain the integrity and fairness of the promotion selection board (DoD, 1996, September 24, p. 3). Title 10 reinforces the fact that the selection-board process should be fair and uninfluenced by outside individuals or pressures. The law charges each Service Secretary with ensuring that the selection-board process is free from bias; in particular, no one must: (1) censure, reprimand, or admonish the selection board or any member of the board with respect to the recommendations of the board or the exercise of any lawful function within the authorized discretion of the board; or (2) attempt to coerce or, by any unauthorized means, influence any action of a selection board or any member of a selection board in the formulation of the board's recommendations. (USC, 2004, Title 10, p. 616) 16
33 The final procedure to ensure the fairness and integrity of the selection-board process is a random interview of members that were part of the promotion process. Department of Defense Instruction (DODINST ) outlines that each Service Secretary must perform a random yearly interview of those individuals that were part of the selection-board process to ensure that the boards were in compliance with Title 10 and other regulations (DoD, 1996, September 24, p. 3). By law, each selection board has the responsibility to notify its Service Secretary of its results. The report delineates the names of all officers selected for promotion. Additionally, the report is certified with a signature from all members of the selection board (USC, 2004, Title 10, p. 617). The board members certify that they have given equal treatment to the records of all the officers considered for promotion. They also certify that the officers selected are the best qualified to continue to meet the requirements of their military department (p. 617). The board then provides a list of those officers that are required to demonstrate a need to be retained on active duty (p. 617). Additionally, the board provides a list of those officers not selected for promotion because they did not want to be considered for promotion to the next grade (p. 617). After the report has been certified by the selection board, Title 10 requires that the results of the board be forwarded to the Secretary of the military department. The Service Secretary has the responsibility of examining the report and ensuring that it is compliance with the Title 10 regulations. If the results of the selection board are not 17
34 in accordance with the law, the report will be returned to the board for correction (USC, 2004, Title 10, p. 618). The returned report will identify the reasons why it is not in adherence with the law. The selection board has the responsibility to comply with the guidance from the Secretary, to correct the selection report and to ensure it is in compliance with the law. Once the report is in compliance, it is resubmitted to the Secretary for further review. The process continues with the review of the report by the Chairman of the Joint Chiefs of Staff (CJCS). The CJCS reviews the report to ensure officers that have served or are serving in a joint-duty assignment were given equal treatment by the board members. Controls are in place to ensure that officers that were not given equal treatment due to their service in a joint-duty assignment are highlighted for further examination. The CJCS and the Service Secretary work together to rectify their disagreements through further proceedings, special selection boards, and other actions (p. 618). In the end, if the CJCS and the Service Secretary cannot agree upon the final results of the selection board, the case will be forwarded to the Secretary of Defense (SECDEF) for further action (p. 618). The SECDEF has the responsibility to resolve the differences in the selection board results between the CJCS and the Service Secretary (p. 618). If this is not possible, the results of the selection board will still be forwarded to the President. The President is the only level in the selection-board process that possesses the authority to remove an officer that has been selected for promotion 18
35 from the selection list (p. 618). The release of the officers names that have been selected for promotion is a regulated and strict process. The following rules apply for the release of officer names that have been selected for promotion in their respective Service: (A) In the case of officers recommended for promotion to a grade below brigadier general or rear admiral (lower half), such names may be disseminated upon, or at any time after, the transmittal of the report to the President. (B) In the case of officers recommended for promotion to a grade above colonel or, in the case of the Navy, captain, such names may be disseminated upon, or at any time after, the approval of the report by the President. (C) In the case of officers whose names have not been sooner disseminated, such names shall be promptly disseminated upon confirmation by the Senate. (p. 618) The minimum time periods that an officer must serve in each grade are governed by the law within Title 10. These time requirements are in place to ensure that each service promotes officers at a similar pace. The time-in-grade requirements begin with second lieutenants and move up through the grade structure to brigadier general. The requirements also apply equally to the Navy grades. Second Lieutenants must serve a minimum of 18 months in grade; first lieutenants serve two years; captains, majors, and lieutenant colonels serve three years; colonels and brigadier generals serve in that capacity for one year (p. 619). Although the minimum requirement is established by Title 10, the Service Secretaries are given the authority to lengthen the time-in-grade requirements (p. 619). This authority can be used by the Service Secretary as a grade- 19
36 shaping tool to either expand or shrink his respective service. Finally, the law outlines that each Service Secretary must provide officers at least two chances for selection for promotion to the next grade (USC, 2004, Title 10, p. 619). The Service Secretaries are also given additional authority on which officers they select and do not select for promotion. Title 10 allows each Secretary to select officers that are found to be exceptionally well-qualified from below the promotion zone (p. 619). Additionally, officers that are put on the active-duty list can only be ineligible for promotion for a period no longer than a year as determined by their respective Service Secretary (p. 619). The purpose of this one-year period is to allow the officer time to receive officer evaluations and to gain skills from serving on active duty (Secretary of the Navy, 2006, March 28, p. 7). Finally, the Service Secretaries may govern that officers will be ineligible for promotion to the next grade if they have a separation date that falls within 90 days of the start of their promotion board (USC, 2004, Title 10, p. 619). Each Service Secretary is required to maintain an active-duty list for his service. This list is used to maintain a record of the seniority level of each officer who is serving on active duty (p. 620). The Department of Defense defines this list as, A single list for the Army, the Navy, the Air Force, or the Marine Corps [ ] that contains the names of all officers of that Armed Force [ ] who are serving on active duty (DoD, 1996, September 24, p. 15). Just as important as the active-duty list are the competitive categories established by each Service 20
37 Secretary. Title 10 outlines the importance of the competitive categories for promotion: Under regulations prescribed by the Secretary of Defense, the Secretary of each military department shall establish competitive categories for promotion. Each officer whose name appears on an active-duty list shall be carried in a competitive category of officers. Officers in the same competitive category shall compete among themselves for promotion. (USC, 2004, Title 10, p. 621) The Marine Corps has established five competitive categories for officers broken down by Unrestricted, Restricted (Limited Duty Officers), Warrant Officer and Chief Warrant Officer, Active Reserve, and Specialist Officers (HQMC, 2006, August 9, pp. 1-13). The number of officers that are selected for promotion will be determined by the Service Secretary. The Service Secretaries are responsible for ensuring that they correctly quantify the correct number of officers required for promotion. This requirement is based on different mandates dictated in the regulations and set forth by the Secretary of Defense (USC, 2004 Title 10, p. 622). The Service Secretary will establish the required number of officers for promotion in accordance with projected mission objectives, officers needed to fill empty assignments, and the requirement of necessary grade and competitive category (p. 622). The Marine Corps further refines the requirement by stating: Each selection board is authorized to select to the next higher grade a specific number of officers. The unrestricted portion of the promotion plan forecasts vacancies for a promotion year. Officer accessions, attrition, 21
38 requirements, congressional and secretarial authorizations, and budgetary constraints all impact this variable. (HQMC, 2006, August 9, pp. 1-13) Once the promotion numbers are identified, the Service Secretary will establish the required promotion zones. The promotion zones establish the population of officers that will be determined eligible for promotion. The Secretary of the Navy s (SECNAV) guidance is, Promotion zones will be established to meet the separate promotion requirements of each competitive category. This may result in different promotion flow points and opportunity among the competitive categories (Secretary of the Navy, 2006, March 28, p. 10). Table 1 outlines the guidance that is applied to promotion flow points for promotion to major, lieutenant colonel and colonel for the active-duty list officers. As noted above, this is only guidance for the Services as they establish their promotion flows. If necessary, the Services may depart from the promotion flow guidelines and promote at a different rate in order to meet the required manpower needs for each grade (p. 10). Table 1. Promotion Flow Points (Source: Secretary of the Navy, 2006, 28 March, p. 10) 22
39 The promotion zones are based on five-year manpower requirement projections for each of the Services (USC, 2004 Title 10, p. 623). The Manpower Plans and Policy Division (MPP) is responsible for preparing the five-year officer promotion plan for the Marine Corps (HQMC, 2006, August 9, pp. 1-11). The SECNAV establishes guidance to ensure that future vacant positions for the Navy and Marine Corps are filled for the first fiscal year the plan is in effect (Secretary of the Navy, 2006, March 28, p. 3). The plan is based on each Service s end-strength requirements by grade and competitive category (p. 3). This is why the number of required officers needed by each Service is important to the grade-shaping process. If the numbers are not correctly established, a ripple effect could occur over the next five years. This is why the Chief of Naval Operations (CNO) and Commandant of the Marine Corps (CMC) are required to submit a five-year promotion plan every year to the Secretary of the Navy (SECNAV) (p. 5). The final step in the promotion process requires the Service Secretary to release the promotion list with the names of those officers that were selected for the next grade. For the Department of the Navy (DoN), the Secretary of the Navy (SECNAV) releases an All Navy (ALNAV) message which contains the list of those officers that were selected for promotion to the next grade (p. 18). The list categorizes the officers by their seniority in relation to their peers of the same competitive category (USC, 2004 Title 10, p. 624). The actual promotion of the officers is established by seniority of the promotion list and the needs of their Service (p. 624). Along with this list, the Secretary of the military department is responsible for 23
. Table 2. Race and Ethnic Profile Data (Source: DoD, 1996, 24 September, p.")
40 providing the Secretary of Defense (SECDEF) with a race and ethnic profile, as seen in Table 2 (DoD, 1996, September 24, p. 22). Table 2. Race and Ethnic Profile Data (Source: DoD, 1996, 24 September, p. 23) 24
 Division.")
41 B. MANPOWER MANAGEMENT PROMOTION BRANCH (MMPR) The promotion process for the Marine Corps is managed by the Manpower Management Promotion Branch (MMPR) within Headquarters Marine Corps. Figure 6 shows the command structure of MMPR within the Manpower Management (MM) Division. The MMPR mission statement reads: The mission of the Promotion Branch (MMPR) is to conduct regular and reserve promotion boards in order to ensure every Marine (officer and enlisted) has a fair and equitable opportunity for advancement to the next grade. MMPR provides support operations for accurate, timely, and quality service associated with all aspects of the officer and enlisted promotion processes. (HQMC, M&RA, MM, MMPR, 2007) Figure 6. Manpower Management Task Organization (Source: From HQMC, M&RA, MMOA, Road Show Brief, 2007, August 5) 25
42 It is the responsibility of the Promotion Branch (MMPR) to ensure that the Marine Corps promotion process is conducted in accordance with the laws, instructions and orders previously described in this research. The exact execution of the numerous regulations governing promotions is critical and key to a fair and unbiased promotion process. The ability to select the best-qualified officers for promotion rests upon this principle. The MMPR ensures that the eligible officers are notified of an upcoming board, and it provides the conduit for that officer to communicate with the board. Additionally, the MMPR provides the administrative support that allows the promotion board to effectively fulfill the duties it has been assigned. By this branch s efforts, the fairness and integrity of the promotion process is maintained for the Marine Corps. 26
43 III. LITERATURE REVIEW Our Nation has high expectations of her Marines. This is the result of the legacy of performance that has been handed down by generations of Marines who have worn the eagle, globe and anchor. Our discipline, pride, adherence to standards, selfless dedication to duty, and commitment to Country and Corps shape our warrior ethos. America expects, demands and deserves nothing but the best from the Marine Corps. Accordingly, our high standards of professional and personal performance, to include our physical fitness and military appearance, must be maintained and adhered to by every Marine. 3 General James T. Conway, USMC A. OVERVIEW Numerous studies have examined the factors that predict promotion in the Marine Corps. This study builds on that literature and generates new results for the factors that predict promotion. This chapter summarizes and evaluates prior studies on the determinants of promotion. B. PROMOTION 1. Study by Long (1992) Long (1992) analyzed the effect of background characteristics on the promotion to major, lieutenant colonel and colonel in the United States Marine Corps. He formulated his study to be used as a decision-making tool 3 General Conway made this statement in White Letter Number while serving as the Commandant of the Marine Corps (HQMC, 2007, November 26). 27
44 for Marine Officers in their careers. The source of his data was the Management Information (MI) Branch of Headquarters Marine Corps. The data included the officers that were in-zone for promotion for Fiscal Years (FY) 1986 to The study found that being married, attending appropriate-level professional school and having a postgraduate degree were statistically significant and positively correlated with promotion. Race, sex, and combat experience were determined to have no effect on promotion. Of note, the selection rate for those with combat experience was actually lower than those without combat experience for all three groups that were studied in his research. One of the limitations of the study was that it did not include any measures of performance. As Fitness Reports are the primary tool used by promotion boards in selecting officers for promotion, the explanatory power of the model is greatly reduced when this variable is omitted from the study. Additionally, examining the effect of promotion based on duty assignment is limited because the data was a snapshot from when the promotion board convened. The data did not contain duty assignments over the career of each officer in the study. 2. Study by Hamm (1993) The purpose of Hamm s (1993) research was to determine if minority officers attrited at higher rates and promoted at lower rates than other comparable officers. The study 28
45 used composite thirds at The Basic School (TBS), selection to captain, and selection to major as a measure to determine success as an officer. There were two sources of data used for the research. Data was collected from the Headquarter s Master Files (HMF) from the Manpower Analysis Branch and from The Basic School (TBS). The period of the data was for calendar years (CY) 1980 to The final data set had 17,870 observations for the 12-year period. The study concluded that the composite-third assignment at TBS and selection rates to captain were lower for black officers percent of black officers were shown to be assigned to the top third of their TBS class, and they were shown to have the lowest selection rate to captain of all the racial/ethnic groups compared in the research. However, the study concluded that there were no differences among racial groups when officers were selected for major. A limiting factor in the research was the low number of independent variables used to analyze the data. The study only used twenty independent variables. Numerous other variables could have been statistically significant and relevant in explaining promotion and composite thirds at TBS. Factors such as education level, fitness reports, assignments, and physical fitness levels may differ significantly among race groups, so the effect of race may be under or over-estimated. 3. Study by Grillo (1996) Grillo (1996) also studied the difference in promotion rates for minorities and women. Unlike Hamm (1993), Grillo 29
46 included education, dependents, awards, and performance index among the explanatory variables. The study also examined if the board precepts had an effect on promotion. The period studied was from Fiscal Year (FY) 1994 to The Manpower Analysis Section of Headquarters Marine Corps was used as the source for the data. The data was a cross-section consisting of 1,519 observations of captains that were being considered for promotion for the FY 1994 and 1995 promotion boards. The study found that performance evaluations and awards had the greatest effect on the predicted probability of being selected to major. It concluded that racial and gender differences had no significant effect on the promotion probability after taking into account performance. Also, the targeted Primary Military Occupational Skills (PMOS) in the board precept had no effect on selection for promotion. One of the limitations in the study was the small number of independent variables used in the model. The model was based on eight independent variables. The effect of these variables on promotion can be overstated because of omitted relevant variables. As in the Hamm (1993) study, including other variables such as assignments, combat experience, occupational field, and Armed Forces Qualification Test (AFQT) scores would potentially increase the model s explanatory power. 4. Study by Wielsma (1996) Wielsma (1996) analyzed the factors that affect performance, retention, and promotion to major in the Marine Corps. The emphasis of the study was on the effect of 30
47 graduate education on the three dependent variables. Numerous other variables were analyzed in the study; these were broken down into three main areas consisting of cognitive skills, affective traits, and demographic traits. This study combined data from a variety of sources. The sources included the Defense Manpower Data Center (DMDC), Marine Corps Automated Fitness Report System (AFRS), the Headquarter s Master File (HMF), and the Official Military Personnel File (OMPF). The data set consisted of longitudinal data of 1,087 officers followed in time from 1980 to Of note, of the 1,087 officers that entered in the Marine Corps in 1980, only 455 were still in the sample when the major promotion board convened. The study found that postgraduate education is associated with higher average performance levels, higher Basic School (TBS) rankings, being commissioned through the Naval Academy or Officer Candidate School, older officers, and being married. The composite ranking at the Basic School and having a postgraduate degree were statistically significant at the 0.01 level and being married at the 0.10 level in the promotion model. It is interesting to note that only three of the independent variables in the promotion model were statistically significant up to the 0.10 level. Wielsma (1996) noted that the positive correlation between postgraduate education and promotion to major may be positively biased due to the model s failure to correct for the retention and selection issues in the sample. More able officers may be more likely to stay and also more likely to promote. Another limiting factor in the study was the 31
48 postgraduate education variable. There was no difference made between how the postgraduate degree was obtained. Potential differences could affect the results of the study for instance, if officers received the degree from the Naval Postgraduate School (NPS) or worked on their off-duty time to get the degree. 5. Study by Branigan (2001) Branigan (2001) analyzed the factors that were correlated with retention and promotion to lieutenant colonel in the Marine Corps. The study s purpose was to examine the effect that graduate degrees had on promotion and retention to lieutenant colonel. The study s main focus was to analyze the effect of a graduate degree from the Naval Postgraduate School (NPS), specifically. The examination of different graduate education programs was one of the limitations identified in the Wielsma (1996) study. The Manpower Plans Division of Headquarters Marine Corps and the Center for Naval Analyses (CNA) provided the data for this study. The data consisted of cross-sectional and longitudinal data. The cross-sectional data consisted of whether a major was selected for promotion from the inzone population for the Fiscal Year (FY) 1998 to 2001 lieutenant colonel promotion boards. The longitudinal data consisted of multiple variables of interest in the sample for the time period of 1979 to The sample size of the promotion model was 1,627 officers. The study used four separate promotion models to examine the effects of graduate education on promotion to lieutenant colonel. Interestingly, receipt of a combat 32
49 fitness report was seen to be statistically insignificant in predicting promotion in all four models. The research did conclude that a Master s degree was statistically significant at the 0.01 level and positively correlated with promotion. The magnitude of the Master s degree fluctuated from to between the four models. Performance traits accounted for of the effect that the Master s degree had on promotion. Finally, it was illustrated that the non-nps degrees had a greater effect than those from NPS on promotion. A potential limitation in the study can be attributed to how the graduate education degrees were classified. Graduate degrees from Professional Military Education (PME) schools were entered into the non-nps graduate degree variable. This could be one of the reasons why the non-nps degrees had a greater effect on promotion as compared to the NPS degrees. For officers to attend a formal PME school, they are screened and selected by a formal board. This would account for higher-quality officers attending resident PME and the greater impact that the non-nps graduate degree had on promotion. 6. Study by Ergun (2003) The Ergun (2003) study examined the factors that influenced retention to 10 years of commissioned service and promotion to major and lieutenant colonel in the Marine Corps. The focus of the study was to evaluate if the different commissioning sources had an impact on retention and promotion. 33
50 The study used three samples to conduct the statistical analysis. These consisted of the Marine Corps Commissioned Officer Accession Career (MCCOAC) file from the Center for Naval Analysis (CNA), 1951 to 1998 (old) Marine Corps Fitness Report File, and 1998 to 2001 (new) Marine Corps Fitness Report File. The MCCOAC file consisted of 28,058 observations; the old fitness report file had 1.3 million fitness reports on 48,306 officers; the new fitness report file had 52,366 fitness reports on 17,436 officers. The sample size for the major and lieutenant colonel promotion models was significantly smaller than the data files explained above due to the attrition of officers from the start of their commissioned service. The sample size for the officers analyzed for promotion to major was 7,281, while the sample size for the lieutenant colonel model was 1,785. The results of the study concluded that the source of commissioning had an impact on the performance of an officer. In regards to promotion, the officers that attended the Naval Academy had lower promotion rates to major when compared to the other commissioning sources, except for the Marine Corps Enlisted Commissioning Program (MECEP). Officers that had prior enlisted experience had lower promotion rates to lieutenant colonel regardless of the commissioning program. However, both the MECEP and Enlisted Commissioning Program (ECP) were statistically significant at the 0.01 level and positively correlated with promotion to lieutenant colonel when compared to the Naval Academy source of entry. 34
51 Combat fitness reports were also examined in this study to see how they affect the Performance Index (PI). The reports were examined for the old- and new-style fitness reports for each grade level from second lieutenant to major. The study found having a combat fitness report was statistically significant (0.05 to 0.01 level) and positively correlated with a higher PI. One of the limitations in the study was the method that was used to formulate the Performance Index (PI) for the fitness report data. The method used the old and new fitness reports to create a 100-point system using the markings within the reports. This method is relevant in capturing the reporting senior markings; however, it does not capture the ratings from the reviewing officer. With the reviewing officer being the senior officer on the fitness report, the values of his markings would have a considerable effect on the PI used in the model. 7. Study by Morgan (2005) Morgan s (2005) research studied the factors that affected the retention and selection to major in the Marine Corps. The focus of the study was to examine the impact of an officer s career path on his progression in the Marine Corps. The primary research questions analyzed were whether the amount of time an officer spends in his primary military occupation specialty (PMOS) and the amount time spent in the Fleet Marine Force (FMF) effect the retention and promotion to major in the Marine Corps. The study used two samples in the research analysis. The samples consisted of the Marine Corps Commissioned 35
52 Officer Accession Career (MCCOAC) file and the Marine Corps Officer Fitness Report file. The MCCOAC file consisted of observations from 1980 to 1999 on officers starting at The Basic School (TBS) and the fitness report file contained reports from 1950 to The final data set consisted of 10 separate groups established from Fiscal Years 1980 to 1989, with a sample size of 8956 observations. The study concluded that the longer officers spent in their PMOSs and the FMF, the less likely they were to be promoted. When the time ratio increased above 60 percent of PMOS and FMF time, attrition increased, and promotion decreased. The commissioning source results were similar to that of the Ergun (2003) study. However, Morgan (2005) used the Platoon Leader Class (PLC) as the base variable instead of the United States Naval Academy (USNA) variable. This resulted in three variables being statistically significant at the 0.01 level and negatively correlated with promotion when compared to the PLC program. These variables were the Naval Reserve Officer Training Corps (NROTC), USNA, and a grouping of the enlisted commissioning programs (ECOMM). In the study, about 30 percent of the officers had obtained a combat fitness report. Morgan (2005) examined the combat fitness report to determine the effect it had on attrition. The research showed that an officer s possession of a combat fitness report was statistically significant (0.01 level). Service in combat was seen to increase an officer s diversity, thereby lowering the attrition level. A potential limitation in the study was the small number of independent variables used in the models. The results may be slightly overstated due to relevant variables 36
53 missing from the models. Variables such as education levels, AFQT scores, and physical fitness test (PFT) scores could have some explanatory power in the promotion and attrition models and perhaps could be correlated with the time a person spent in his Primary Military Occupational Skill (PMOS) field. 8. Study by Perry (2006) The purpose of the Perry (2006) study was to examine the factors that influence retention and promotion in the Marine Corps. The study focused on officers surviving to ten years of commissioned service, as well the factors that affected promotion to major and lieutenant colonel. The main focus of the study was the effect of primary military occupational specialty (PMOS) on promotion and retention. Like previous studies, this study used two samples. The MCCOAC and the Marine Officer Cohort data files were the two samples used in the research. The MCCOAC file contained 27,659 observations from Fiscal Years 1980 to 1999, while the Marine Officer Cohort file contained data from Fiscal Years 1980 to Due to the effects of attrition on the officer population, the sample size for the major and lieutenant colonel models were smaller than the total observations mentioned above. The major promotion model examined 11,776 observations, while the lieutenant colonel model had 5,737. The primary research question in the study examined the effect of PMOS on promotion. The variable of infantry was used as the base variable for the different PMOS comparisons. The results of the study showed that being a 37
54 pilot was negatively associated with promotion to major when compared to the base variable of infantry. Only three PMOSs were shown to be positively associated with promotion to major and lieutenant colonel. These PMOSs consisted of logistics, air command and control, and F/A-18 Pilot. Of particular interest was the married variable; this was found to be statistically significant and positively correlated with promotion in a majority of the previous studies. However, this variable was statistically insignificant for the logistic estimates for the major and lieutenant colonel promotion models. This study contained the most detail and depth of the previous studies analyzed in this chapter. The detail from the description of the United States Marine Corps Human Resource Development Process to the manpower models used in this thesis was quite comprehensive. It provided the reader with a complete understanding of Perry s (2006) results and an insight into the potential benefits of his study. C. SUMMARY The eight studies in the literature review identified relevant variables that affect promotion. The research found valuable results for the variables of interest. The studies did not analyze the effect of physical fitness on promotion. Thus, research should be conducted to analyze this variable and observe the potential effect it might have on field-grade promotions in the Marine Corps. Results differed when the combat service variable was analyzed in the different studies. Long (1992) and Branigan (2001) found combat service to have no effect on promotion. 38
55 This is quite surprising for the Long (1992) study, since it was conducted following the Gulf War. Ergun (2003) showed that possessing a combat fitness report increased an officer s Performance Index (PI), while Morgan (2005) reported that such a FITREP decreased effects on attrition. Four of the studies used fitness report data to examine the effect it had on promotion. The data consisted of the old and new style of fitness reports. However, the studies did not use the reviewing officer markings to analyze the effect these had on an officer s promotion. Reviewing officers are the senior officers on a fitness report, so their markings should carry the most weight by the nature of their seniority. Since the Global War on Terror (GWOT), the current Marine Corps policy makers have placed a greater emphasis on serving in combat and physical fitness. This renewed interest in combat service and physical fitness should have observable changes on the effects of promotion from what was reported in past research. The current data should reflect Marine Corps leadership s intent to establish a need for continued research of the factors that affect promotion. 39
56 THIS PAGE INTENTIONALLY LEFT BLANK 40
57 IV. DATA AND PRELIMINARY ANALYSIS The completion of fitness reports is a critical leadership responsibility. Inherent in this duty is the commitment of our commanders and all reporting officials to ensure the integrity of the system by giving close attention to accurate marking, narrative assessment, and timely reporting. Every commander and reporting official must ensure the scrupulous maintenance of the PES. (HQMC, 2006, May 11, p. 2) The purpose of this chapter is to describe the data used in this research. The dependent and independent variables will be described in detail. Additionally, the preliminary analysis will examine the factors that influence promotion to major, lieutenant colonel and colonel. A. DATA SOURCES The data for this research was obtained from two separate sources. The first data source was the Total Force Data Warehouse (TFDW); the second source was the Manpower Management Support Branch (MMSB). The two sources were merged together to complete three separate samples for studying the promotion to major, lieutenant colonel and colonel. 1. TFDW and MMSB Data The TFDW data used in this research consisted of crosssectional and panel data. TFDW data operates on the basis of capturing data on a snap-shot basis. Prior to 1998, the data was captured every three months; this was changed to a monthly basis in The data for the major, 41
58 lieutenant colonel and colonel selection boards was collected on the closest date to the board. For the lieutenant colonel and colonel board, the capture date of the data was 31 August The boards convened 6 September 2006 and 7 September 2006, respectively. The data for the major board that convened on 11 October 2006 was captured on 30 September The major, lieutenant colonel and colonel observations were 743, 519, and 196, respectively. The TFDW data provided 41 of the 56 variables used in the analysis. It was the source for the dependent variable of grade select. The independent variables included demographics, performance (PFT, water qualification, awards), military occupational specialty categories, combat service, commissioning source, and assignments. MMSB was used to collect the fitness report information on the officers in the research. Fitness report panel data was collected from 01 January 1999 to the date the board convened. Fitness report data was not collected before 1999, because prior to this time fitness reports included only qualitative information. The data collection provided independent performance variables of fitness report relative value measures and reviewing officer percentages. Additionally, assignment variables were produced to include the sum of commander, executive officer, primary staff, and other billets an officer served in as annotated on his fitness reports. 42
59 2. Data Issues The Lineal Control Number (LCN) assigned to an officer was used as the unique identifier to identify the officers that were in-zone. The LCN was used to build the filter within TFDW to target the officers being observed in this research project. The Promotion Selection Board message from Headquarters Marine Corps (HQMC) was the source document used to identify those officers that were in-zone for promotion (HQMC, 2006, July 11, p. 2). The captain, major, and lieutenant colonel samples pulled from TFDW contained 773, 530, and 228 observations, respectively. However, the actual in-zone population for the three groups was 744, 520, and 196. The main cause for the difference was the retiring population of officers that were included in the TFDW data. In other words, TFDW data included officers who were about to retire; however, officers who are within 90 days of retiring are not considered for promotion (HQMC, 2006, July 11, p. 1). Therefore, they were removed, and the original sample was reduced to 743, 519, and 196, respectively. To confirm these results, the researcher also used information from the Manpower Management Promotion Branch (MMPR). Utilizing the 90-day retirement window to remove officers from the sample and the actual list of in-zone officers supplied by Manpower Management Promotion Branch (MMPR), the three samples were able to come within one officer for the major and lieutenant colonel boards, and to match the colonel board. The data analyzed in this research as compared to the actual in-zone population is illustrated in Table 3. 43
60 Table 3. TFDW Data and In-zone Population Comparison TFDW Officers Initial Removed Officer from Population Sample New TFDW Officer Population Actual Inzone Population Difference in TFDW and Actual Population Major Board Lieutenant Colonel Board Colonel Board (Source: Author, 2008) B. VARIABLES A description of the variables that were used in the research is summarized in Table 4. The variables are explained in greater detail in the following paragraphs. Table 4. Description of Variables Variables Dependent Grade_select_O4 Grade_select_O5 Grade_select_O5 Variable Description Selected for promotion to O4 Selected for promotion to O5 Selected for promotion to O6 Variable Type Data Type Range Binary CS = 1 if selected = 0 otherwise Binary CS = 1 if selected = 0 otherwise Binary CS = 1 if selected = 0 otherwise Independent Demographics Number_Depns Number of dependents Continuous CS 0-10 a 0-7 b 0-8 c Years_Comm_Serv Years of commissioned Continuous CS 6-11 a b service c Months_Grade Months in Continuous CS a current grade b c GCT_Total General Classification Continuous CS a b Test Score c Gender Gender Binary CS = 1 if Female 44
61 = 0 otherwise White White Race Binary CS = 1 if White = 0 otherwise Black Black/African Binary CS = 1 if Black Other_race American Race American Indian, Alaskan Native, Asian, Native Hawaiian, or Other Pacific Island Race = 0 otherwise Binary CS = 1 if Other_race = 0 otherwise Marital_Status Marital Status Binary CS = 1 if Married = 0 otherwise Greater_College Doctorate, First- Professional, Post-Master s, or Master s degree Binary CS = 1 if Greater_College = 0 otherwise College Less_College 4 Bachelor s or Associate s degree High School diploma or Occupational Program Certificate Binary CS = 1 if College = 0 otherwise Binary CS = 1 if Less_College = 0 otherwise Performance PFT Water_Unq Water_Qualified Water_Waiver Water_CWSS_MCIWS RelVal_Cum_Low RelVal_Cum_High Physical Fitness Test Score Water Survival Unqualified Water Survival Class 1, 2, 3, 4, & WSQ Medical or Commanding General Waiver Combat Water Safety Swimmer or Instr. of Water Survival Sum of Low Relative Value Markings Sum of High Relative Value Markings Continuous CS a b c Binary CS = 1 if Water_Unq = 0 otherwise Binary CS = 1 if Water_Qualified = 0 otherwise Binary CS = 1 if Water_Waiver = 0 otherwise Binary CS = 1 if Water_CWSS_MCIWS = 0 otherwise Continuous Panel 0-8 a 0-6 b 0-4 c Continuous Panel 0-8 a 0-6 b 0-5 c 4 The Colonel Selection board data did not contain any Less_College observations. 45
62 RelVal_Cum_Avg Mean of Relative Value for Markings RelVal_Cum_sd Standard Deviation of relative value markings RO_PCT_Low Sum of bottom 10 percent of Reviewing Officer markings RO_PCT_High Sum of top 100 percent of Reviewing Officer markings RO_PCT_Avg Mean of Reviewing Officer Percentage markings RO_PCT_sd Standard Deviation of Reviewing Officer markings Personal_Awards Sum of Personal Awards Other_Awards Sum of all Other Awards Continuous Continuous Continuous Continuous Continuous Continuous Continuous Continuous Panel a b c Panel a b c Panel 0-9 a 0-8 b 0-6 c Panel 0-12 a 0-10 b 0-8 c Panel a b c Panel a b c Panel 0-6 a 0-7 b 1-7 c Panel 1-20 a 3-21 b 3-23 c Military Occupational Field Joint_MOS 5 Completed a Joint Tour Combat Combat Military Occupational Group Ground_Support Ground Support Military Occupational Group Service_Support Service Support Military Occupational Group Aviation_Fixed Aviation Fixed Military Binary CS = 1 if Joint_MOS = 0 otherwise Binary CS = 1 if Combat = 0 otherwise Binary CS = 1 if Ground_Support = 0 otherwise Binary CS = 1 if Service_Support = 0 otherwise Binary CS = 1 if Aviation_Fixed = 0 otherwise 5 The Major Selection board data did not contain any Joint_MOS observations. 46
63 Aviation_Rotary Aviation_Support Combat Crisis_Code Combat_Service1 Combat_Service2 Combat_Service3 Combat_Service4 6 Commissioning OCS NROTC USNA ENLPGM Other_Source Assignment FMF_Unit NONFMF_Unit Aviation Rotary Military Occupational Group Aviation Support Military Occupational Group Currently Serving in Combat Served 1 Tour in Combat Served 2 Tours in Combat Served 3 Tours in Combat Served 4 Tours in Combat Officer Candidate School Naval Reserve Officer Training Corps United States Naval Academy Contains MECEP, ECP, or MCP Commissioning Programs. Other Commissioning Source Currently Assigned to a FMF Unit Currently Assigned to a Non-FMF unit Binary CS = 1 if Aviation_Rotary = 0 otherwise Binary CS = 1 if Aviation_Support = 0 otherwise Binary CS = 1 if Crisis_Code = 0 otherwise Binary CS = 1 if Combat_Service1 = 0 otherwise Binary CS = 1 if Combat_Service2 = 0 otherwise Binary CS = 1 if Combat_Service3 = 0 otherwise Binary CS = 1 if Combat_Service4 = 0 otherwise Binary CS = 1 if OCS = 0 otherwise Binary CS = 1 if NROTC = 0 otherwise Binary CS = 1 if USNA = 0 otherwise Binary CS = 1 if ENLPGM = 0 otherwise Binary CS = 1 if Other_Source = 0 otherwise Binary CS = 1 if FMF_Unit = 0 otherwise Binary CS = 1 if NONFMF_Unit = 0 otherwise 6 The Colonel Selection board data had the only Combat_Service4 observations. 47
64 Billet_Cmdr Billet_XO Billet_Pri_Stf Billet_Other Ser_School_ALS Ser_School_Other Sum of Commander Billets Sum of Executive Officer Billets Sum of Principal Staff Officer Billets Sum of Other Billets Attended Resident Appropriate Level School Attended all Other Schools Continuous Panel 0-20 a 0-9 b 0-7 c Continuous Panel 0-11 a 0-6 b 0-7 c Continuous Panel 0-15 a 0-13 b 0-8 c Continuous Panel 0-23 a 0-20 b 0-16 c Continuous Panel 0-2 Continuous Panel 2-23 a 4-22 b 6-23 c Table Code a Represents FY08 Major Selection Board data range b Represents FY08 Lieutenant Colonel Selection Board data range c Represents FY08 Colonel Selection Board data range CS = Cross-sectional Data (Source: Author, 2008) 1. Dependent Variable The 52 dependent variable of Grade_select attained from the TFDW was used to determine whether an officer was selected for the next grade. This was a binary variable which resulted in a 0 or 1 outcome. A 0 resulted in an officer failing selection for the next grade, while a 1 was selection for the next higher grade. This variable was consistent for the major, lieutenant colonel, and colonel samples. The in-zone promotion statistics for the three Fiscal Year 2008 promotion boards are illustrated in Table 5. As seen from the table, the opportunity for promotion decreases with the increase in grade. There was a 36.4 percent 48
65 difference in selection rate between the major and colonel selection boards. This is reflective of the hierarchy (pyramid structure) within the Marine Corps. Additionally, the eligible population decreases as the grade of the promotion board increases. There were almost four times as many captains eligible for promotion than there were eligible lieutenant colonels. Table 5. Promotion Statistics for FY08 In-zone Population Eligible Selected Percentage Major Selection Board percent Lieutenant Colonel Selection Board percent Colonel Selection Board percent (Source: After MMPR, Selection Board Results, 2006, September 22) 2. Independent Variables The independent variables were broken down into six separate categories. The categories consisted of demographics, performance, military occupational field, combat, commissioning, and assignment. The variables ranged in type from binary to continuous as displayed in Table 4. Also, TFDW and MMSB were used to obtain the independent variables in the study. The categories for the independent variables will be discussed in further detail. a. Demographics There were twelve demographic variables in the sample. The majority of the demographic variables were self-explanatory in terms of their composition. The descriptive statistics for the demographic variables for officers who were selected and not selected for promotion for the Major, Lieutenant Colonel, and Colonel Promotion 49
66 Boards are shown in Tables 6, 7, and 8, respectively. The three race variables of White, Black, and Other_race contained missing observations. The missing observations occurred due to the Declined to Respond option existent within the race category. This resulted in the race category missing a total of 51, 12, and 4 observations for the Major, Lieutenant Colonel, and Colonel Samples, respectively. Table 6. Demographic-descriptive Statistics of Captains Selected and Not Selected for Promotion Captains Not Selected for Major Variables N Mean Std. Dev. Min Max Number_Depns Years_Comm_Serv Months_Capt GCT_Total Gender White Black Other_race Marital_Status Greater_College College Less_College Captains Selected for Major Variables N Mean Std. Dev. Min Max Number_Depns Years_Comm_Serv Months_Capt GCT_Total Gender White Black Other_race Marital_Status Greater_College
67 College Less_College (Source: Author, 2008) Table 7. Demographic-descriptive Statistics of Majors Selected and Not Selected for Promotion Majors Not Selected for Lieutenant Colonel Variables N Mean Std. Dev. Min Max Number_Depns Years_Comm_Serv Months_Maj GCT_Total Gender White Black Other_race Marital_Status Greater_College College Less_College Majors Selected for Lieutenant Colonel Variables N Mean Std. Dev. Min Max Number_Depns Years_Comm_Serv Months_Maj GCT_Total Gender White Black Other_race Marital_Status Greater_College College Less_College (Source: Author, 2008) 51
68 Table 8. Demographic-descriptive Statistics of Lieutenant Colonels Selected and Not Selected for Promotion Lieutenant Colonels Not Selected for Colonel Variables N Mean Std. Dev. Min Max Number_Depns Years_Comm_Serv Months_LtCol GCT_Total Gender White Black Other_race Marital_Status Greater_College College Lieutenant Colonels Selected for Colonel Variables N Mean Std. Dev. Min Max Number_Depns Years_Comm_Serv Months_LtCol GCT_Total Gender White Black Other_race Marital_Status Greater_College College (Source: Author, 2008) The descriptive statistics analyzed in Tables 6, 7, and 8 identified some large differences between those officers that were selected for promotion, as compared to those officers not selected. For the Major Selection Board, captains that had greater than a college degree were selected at a rate of 13.7 percent in contrast to those not selected, with a rate of 6.0 percent. This would result in 52
69 a 8.9 percent higher probability of promoting for having more than a college education. As the grade of the officer increased, the differences in the mean values of those officers that were selected and not selected for promotion increased for the Greater_College variable. Examining the O5 board in Table 7, 35.2 percent of majors selected for lieutenant colonel had greater than a college degree, while 28.8 percent of those not selected also held greater than a college degree. This would be a 9.7 percentage point difference for having more than a college education. Finally, the Colonel Selection Board displayed the largest differences for the Greater_College variable; 65.0 percent of lieutenant colonels that were selected held greater than a college degree; only 41.7 percent of those not selected had equivalent education. Greater than a college degree would result in a 22.9 percentage point difference between the select and not select groups. b. Performance The performance variables include all the quantitative performance measures that are used to assess officers. The variables ranged from physical fitness test scores, water qualification levels, fitness report results, and the number of personal and other awards. The descriptive statistics for the performance variables of the officers that were selected or not selected for promotion for the three samples are described in Tables 9, 10, and
70 Table 9. Performance-descriptive Statistics of Captains Selected and Not Selected for Promotion Captains Not Selected for Major Variables N Mean Std. Dev. Min Max PFT Water_Unq Water_Qualified Water_Waiver Water_CWSS_MCIWS RelVal_Cum_Low RelVal_Cum_High RelVal_Cum_Avg RelVal_Cum_sd RO_PCT_Low RO_PCT_High RO_PCT_Avg RO_PCT_sd Personal_Awards Other_Awards Captains Selected for Major Variables N Mean Std. Dev. Min Max PFT Water_Unq Water_Qualified Water_Waiver Water_CWSS_MCIWS RelVal_Cum_Low RelVal_Cum_High RelVal_Cum_Avg RelVal_Cum_sd RO_PCT_Low RO_PCT_High RO_PCT_Avg RO_PCT_sd Personal_Awards Other_Awards (Source: Author, 2008) 54
71 Table 10. Performance-descriptive Statistics of Majors Selected and Not Selected for Promotion Majors Not Selected for Lieutenant Colonel Variables N Mean Std. Dev. Min Max PFT Water_Unq Water_Qualified Water_Waiver Water_CWSS_MCIWS RelVal_Cum_Low RelVal_Cum_High RelVal_Cum_Avg RelVal_Cum_sd RO_PCT_Low RO_PCT_High RO_PCT_Avg RO_PCT_sd Personal_Awards Other_Awards Majors Selected for Lieutenant Colonel Variables N Mean Std. Dev. Min Max PFT Water_Unq Water_Qualified Water_Waiver Water_CWSS_MCIWS RelVal_Cum_Low RelVal_Cum_High RelVal_Cum_Avg RelVal_Cum_sd RO_PCT_Low RO_PCT_High RO_PCT_Avg RO_PCT_sd Personal_Awards Other_Awards (Source: Author, 2008) 55
72 Table 11. Performance-descriptive Statistics of Lieutenant Colonels Selected and Not Selected for Promotion Lieutenant Colonels Not Selected for Colonel Variables N Mean Std. Dev. Min Max PFT Water_Unq Water_Qualified Water_Waiver Water_CWSS_MCIWS RelVal_Cum_Low RelVal_Cum_High RelVal_Cum_Avg RelVal_Cum_sd RO_PCT_Low RO_PCT_High RO_PCT_Avg RO_PCT_sd Personal_Awards Other_Awards Lieutenant Colonels Selected for Colonel Variables N Mean Std. Dev. Min Max PFT Water_Unq Water_Qualified Water_Waiver Water_CWSS_MCIWS RelVal_Cum_Low RelVal_Cum_High RelVal_Cum_Avg RelVal_Cum_sd RO_PCT_Low RO_PCT_High RO_PCT_Avg RO_PCT_sd Personal_Awards Other_Awards (Source: Author, 2008) 56
73 The PFT variable was one of the secondary research questions in this thesis. The Physical Fitness Test is based on three events: pull-ups (males) or flexed arm hang (females), crunches, and a three-mile run. The scoring for the PFT is based upon a 0-to-300-point system. The minimum requirements to pass the test and the classifications for the PFT are described in Appendix A. Score, age, and gender are the three criteria that are used to compute a Marine s PFT score. Appendices B and C provide the female and male PFT scoring tables, respectively. A large difference exists between the mean PFT values for officers selected for promotion than that of officers not selected for promotion in the three samples. Starting with the Major Sample, the officers that were selected for promotion had a point difference over those that were not selected. The Lieutenant Colonel Sample was similar, with a point difference. However, the Colonel Sample had the smallest difference, with a point value of Overall, the officers who were selected for promotion had a higher mean PFT score in all three samples. The Relative Value marking is the next variable in the Performance category that will be analyzed. To fully understand Relative Value markings, the researcher examined the Master Brief Sheet (MBS). A sample of the MBS Fitness Report listings, along with a detailed explanation of the document, is contained in Appendix D. The MBS in this Appendix shows an officer with four fitness reports. Examining the Annual (AN) Report, during which the Marine Reported On (MRO) was serving in the billet of Operations 57
74 Officer from 04 May 1999 to 01 August 1999, the MRO received a Cumulative Relative Value of As seen by the MBS, the RS average for the seven reports he had written was In this example, the MRO received a score of 4.36, which equated to a Cumulative Relative Value of a Therefore, this officer would have been 6.11 points above the average of 90. The Marine Corps Fitness Report used to evaluate officer evaluations is displayed in Appendix E. The fitness report data were averaged for each officer. The first piece of information used to evaluate the effect of the fitness report on promotion was the Reporting Senior (RS) Cumulative Relative Value markings. The Relative Value is a score assigned to each fitness report based on the average for that officer. Appendix F explains how the Relative Value is calculated for each officer who writes fitness reports as a Reporting Senior. As illustrated in Appendix F, the system is based on a numerical scale of 80 to 100. A fitness report with a score of 80 is the worst report written by that Reporting Senior for that particular grade; a 90 is the average for that RS; a 100 is the best report written by the RS. For the reader to fully understand the Relative Value system, the researcher must explain the fitness report shown in Appendix E needs in more detail. Pages two thru four of the fitness report contain five categories labeled as Performance, Individual Character, Leadership, Intellect and Wisdom, and Fulfillment of Evaluation Responsibilities. The five categories are further separated into fourteen attributes. The attributes are marked on a scale using the 58
75 letters A through H. The letter A represents a value of 1 (worst), the letter B represents a value of 2, up to the letter G, which represents a value of 7 (best). The letter H is used when the Reporting Senior (RS) does not observe that attribute with the Marine Reported On (MRO). To calculate the report average, the observed attributes are added and divided by the total number of observed attributes. Hypothetically, an officer who has a total score of 50 for all fourteen attributes would have a report average of To comprehend the Reporting Senior (RS) markings and the weight they carry, the researcher needed to integrate the report average and relative value. In the above hypothetical example, the officer received a report average of This one observed report by the RS is not enough to generate a Relative Value. The Relative Value is generated by the RS when he writes two more reports on officers of the same grade as the individual with the 3.57 report. So, if the RS were to generate a 3.22 report and a 4.35 report, then there would be enough reports to calculate the Relative Value for that RS. In this example, the 3.22 would have a Relative Value of 80, the 3.57 a 90, and the 4.35 a 100. The Relative Value would change as the RS generated more fitness reports, and the values would be tracked under the Cumulative Relative Value. By analyzing the Reporting Senior Cumulative Relative Values in Tables 9, 10, and 11, the researcher observed that a difference existed between the averages of those officers selected for promotion and those for officers not selected. For the Major Sample, the average for the 59
76 officers not selected for promotion was This score was points lower than the average score for those officers that were selected (90.645). The greatest difference of is found in the Lieutenant Colonel Sample. The average for the officers selected for Lieutenant Colonel was a , as contrasted to a score of for those that were not selected. Finally, the Colonel Sample had the smallest margin (1.714) between the averages of the officers that were selected and those that were not selected. Those that were selected had a Cumulative Relative Value average of in contrast to those not selected, with a value of The Cumulative Reviewing Officer (RO) Comparative Assessment Marking is another aspect of the fitness report the researcher analyzed. Appendix F explains how the RO profile is generated from the comparative assessment markings. Appendix G shows what a sample Reviewing Officer (RO) Comparative Assessment Profile would be like for an officer. The report comparative assessment (commonly called the Reviewing Officer pyramid) allows the reviewing officer to grade the Marine Reported On (MRO) with a numerical value of 1 to 8 as displayed in Table 7. A value of 1 means a Marine that is Unsatisfactory, while an 8 is The Eminently Qualified Marine. The values of 2 through 7 contain the remainder of the performance indicators. Unlike the reporting senior s relative value, the Reviewing Officer Comparative Assessment Profile only contains the raw numbers. 60
 Using Appendix F as the example again, the researcher examined the Reviewing Officer Markings for the officer")
77 Figure 7. Reviewing Officer Description and Comparative Assessment (Source: HQMC, 2006, May 11) Using Appendix F as the example again, the researcher examined the Reviewing Officer Markings for the officer whose RS Relative Value Markings were examined above. This officer received a comparative assessment marking of 5 from the RO. In this example for the RO, one officer received a comparative assessment marking of 2, two received a 3, seven received a 4, seven received a 5, and five received a 6. The RO in this example did not use the 0, 7, or 8 assessment markings. By utilizing the comparative assessment markings, the researcher was able to convert the assessment markings into a percentile ranking. This was accomplished by conducting the following steps. First, the assessment markings by the Reviewing Officer (RO) were added together to get an aggregate number for the comparative assessment. This value represents the total number of fitness reports the RO has reviewed for that specific grade. Next, the 61
78 number of assessment markings for each level of the pyramid was divided by the total to generate a row percentage for each level. The row percentage represented the individual percentile for the eight levels in the RO pyramid. Note, if the RO did not use a level in the comparative assessment, then the result would be a zero for that row percentage. Finally, a cumulative percentage was calculated by adding the row percentages together. This was accomplished by starting at the bottom of the pyramid (Assessment Mark 1) and adding the row percentages until the top of the pyramid was reached (Assessment Mark 8). The result would be a Cumulative Percentage for each level of the RO pyramid. To put the above system into perspective, the example that was previously used from Appendix D will be utilized again. This example is illustrated in Table 8 using the Reviewing Officer (RO) who has reviewed 22 fitness reports. In this example, the RO has utilized five of the eight assessment markings in evaluating the MROs. As noted previously, the RO did not evaluate officers in the 1, 7, or 8 assessment marking blocks. From this example, the two officers who received an assessment mark of 3 were in the rd percentile for that reviewing officer. From the previous example of the officer serving in the operation s officer billet, his assessment marking of 5 put him in the th percentile for that RO. 62
79 Table 12. Example of Reviewing Officer Percentile System Assessment Mark RO Report Distribution Row Percentage Cumulative Percentage 8 0 N/A N/A 7 0 N/A N/A percent 100 percent percent percent percent percent percent percent percent 4.54 percent 1 0 N/A N/A (Source: Author, 2008) The researcher examined the differences in the Reviewing Officer Percentile Average (RO_PCT_Avg) variable for the three different samples as displayed in Tables 9, 10, and 11. Starting with the Major Sample, the average for the captain not selected for promotion was in the RO s 58.8th percentile, while the captain selected was in the 72.4th percentile resulting in a 13.6th percent difference between the two groups. For the Lieutenant Colonel Sample, the margin between the two groups would be slightly larger with a percentage point difference. The officers who were not selected for promotion were in the reviewing officer s 64.14th percentile, while those who were selected for promotion were in the 79.02th percentile. Once again, the Colonel Sample would show the smallest difference (8.84 percentage points) of the three samples. The lieutenant 63
80 colonels that were selected for promotion were in the 74.6th percentile, while those that were selected were in the 83rd percentile. In addition to using the fitness report averages, the researcher also analyzed the differences attributed to the average number of low and high reports. The four variables used to examine this effect were: RelVal_Cum_Low, RelVal_Cum_High, RO_PCT_Low, and RO_PCT_High. The RelVal_Cum_Low was the sum of the low relative marking reports (80) given by the Reporting Senior (RS), while the RelVal_Cum_High was the sum of the high relative marking reports (100). The same methodology was applied to the Reviewing Officer (RO) Percentile System. The RO_PCT_Low contained the sum of the bottom 10 percent of the reports for the RO markings, while the RO_PCT_High contained the sum of the top 100 percent of the reports. The effect of all four variables was consistent among all three samples, as shown in Tables 9, 10, and 11. The officers who were not promoted in all three samples had higher RelVal_Cum_Low and RO_PCT_Low fitness report scores when contrasted to those officers who were selected for promotion. The opposite effect was observed for the RelVal_Cum_High and RO_PCT_High reports. The officers that were selected for promotion had a higher average of RelVal_Cum_High and RO_PCT_High reports. c. Military Occupational Field The Military Occupational Field category contained seven independent variables based upon individual Military Occupational Specialties (MOSs). It should be noted that the Joint_MOS variable is a MOS variable. It takes on a value of 1 when an officer has the Joint MOS of 9701 or 64
81 9702. As illustrated in Table 4, the Major Sample did not contain any observations for this variable. This is due to the policy of captains being too junior to be designated as a Joint Qualified Officer (JQO). Tables 13, 14, and 15 describe the Military Occupational Field (to include Joint_MOS) descriptive statistics of officers selected and not selected for promotion for the three samples. Table 13. Military Occupational Field-descriptive Statistics of Captains Selected and Not Selected for Promotion Captains Not Selected for Major Variables N Mean Std. Dev. Min Max Combat Ground_Support Service_Support Aviation_Fixed Aviation_Rotary Aviation_Support Captains Selected for Major Variables N Mean Std. Dev. Min Max Combat Ground_Support Service_Support Aviation_Fixed Aviation_Rotary Aviation_Support (Source: Author, 2008) Table 14. Military Occupational Field-descriptive Statistics of Majors Selected and Not Selected for Promotion Majors Not Selected for Lieutenant Colonel Variables N Mean Std. Dev. Min Max Joint_MOS Combat Ground_Support
82 Service_Support Aviation_Fixed Aviation_Rotary Aviation_Support Majors Selected for Lieutenant Colonel Variables N Mean Std. Dev. Min Max Joint_MOS Combat Ground_Support Service_Support Aviation_Fixed Aviation_Rotary Aviation_Support (Source: Author, 2008) Table 15. Military Occupational Field-descriptive Statistics of Lieutenant Colonels Selected and Not Selected for Promotion Lieutenant Colonels Not Selected for Colonel Variables N Mean Std. Dev. Min Max Joint_MOS Combat Ground_Support Service_Support Aviation_Fixed Aviation_Rotary Aviation_Support Lieutenant Colonels Selected for Colonel Variables N Mean Std. Dev. Min Max Joint_MOS Combat Ground_Support Service_Support Aviation_Fixed Aviation_Rotary Aviation_Support (Source: Author, 2008) 66
83 The Joint_MOS variable only showed a difference for the means of the lieutenant colonel sample. There was a total of 21 observations for the Joint_MOS variable in the Colonel Sample. Of the 21 officers, 4 were not selected for promotion, while 17 were selected for promotion. As described in the table, this equates to 4.2 percent (4 out of 96 officers) of those officers not selected for promotion, and 17 percent (17 out of 100 officers) of those officers selected for promotion to Colonel. The overall selection rate for the Joint_MOS variable was percent. This was percent higher than the in-zone selection rate of 51.0 percent. Examining the Military Occupational Fields, the researcher found the Aviation_Fixed variable had the greatest margin for the Major Sample. Out of the 100 captains not selected for promotion, 24.0 percent (24 officers) were from the Aviation Fixed Occupational Field; however, from the 643 captains selected for promotion, only 16.6 percent (107 officers) were from this field. A 7.4 percentage point difference existed within in this field. Overall, the Aviation Fixed Occupational Field had an 81.7 percent selection rate (107 out of 131 officers). This was 5.7 percentage points lower than the overall in-zone population selection rate of 87.4 percent. For the Lieutenant Colonel Sample, the Combat and Aviation_Rotary variables had the largest margins for the officer selection rates. Specifically, 28.7 percent (96 officers) of the 335 majors in the Combat Occupational Field were selected for lieutenant colonel, while 12.5 percent (23 officers) of the 184 majors from the Combat Occupational 67
84 Field were not selected for promotion. The Combat Occupational Field had a 80.7 percent promotion rate (96 out of 119). This was 15.7 percentage points higher than the overall in-zone population promotion rate of 65.0 percent. The Aviation Rotary Occupational Field experienced the exact opposite effect as the Combat Occupational Field. The Aviation Rotary Occupational Field had 14.0 percent (47 officers) of the 335 majors selected for lieutenant colonel, while 24.5 percent (45 officers) of the 184 majors not selected for promotion would be from the Aviation Rotary Occupational Field. Overall, the Aviation Rotary Occupational Field had a 51.1 percent promotion rate (47 out of 92 officers). This was 13.9 percentage points lower than the overall in-zone population promotion rate of 65.0 percent. Finally, the Ground Support Occupational Field for the Colonel Sample had a slight margin (6.0 percent) between the select and not-select groups. Out of the 96 lieutenant colonels not selected for promotion, 26.0 percent (25 officers) were from the Ground Support Occupational Field. From the 100 officers selected for promotion, 32.0 percent (32 officers) were from this field. Overall, the Ground Support Occupational Field had a 56.1 percent promotion rate (32 out of 57 officers). This was 5.1 percentage points higher than the overall in-zone population promotion rate of 51.0 percent. d. Combat The combat variables identify if an officer is currently serving in a combat zone (Crisis_Code) as well as the officer s number of previous combat tours 68
85 (Combat_Service). The Combat_Service variable was represented by four separate variables. The variables were labeled as Combat_Service1, Combat_Service2, Combat_Service3, and Combat_Service4 and represented one, two, three, and four combat tours, respectively. The descriptive statistics for the combat variables of the officers that were selected or not selected for promotion for the three samples are described in Tables 16, 17, and 18. Table 16. Combat-descriptive Statistics of Captains Selected and Not Selected for Promotion Captains Not Selected for Major Variables N Mean Std. Dev. Min Max Crisis_Code Combat_Service Combat_Service Combat_Service Captains Selected for Major Variables N Mean Std. Dev. Min Max Crisis_Code Combat_Service Combat_Service Combat_Service (Source: Author, 2008) Table 17. Combat-descriptive Statistics of Majors Selected and Not Selected for Promotion Majors Not Selected for Lieutenant Colonel Variables N Mean Std. Dev. Min Max Crisis_Code Combat_Service Combat_Service Combat_Service
86 Majors Selected for Lieutenant Colonel Variables N Mean Std. Dev. Min Max Crisis_Code Combat_Service Combat_Service Combat_Service (Source: Author, 2008) Table 18. Combat-descriptive Statistics of Lieutenant Colonels Selected and Not Selected for Promotion Lieutenant Colonels Not Selected for Colonel Variables N Mean Std. Dev. Min Max Crisis_Code Combat_Service Combat_Service Combat_Service Combat_Service Lieutenant Colonels Selected for Colonel Variables N Mean Std. Dev. Min Max Crisis_Code Combat_Service Combat_Service Combat_Service Combat_Service (Source: Author, 2008) The Crisis_Code variable s effect was consistent across all three samples. If an officer was serving in a combat zone after the promotion board convened, he had a higher average chance of being selected for promotion as seen in Tables 16, 17, and 18. The difference between those selected in contrast to those not selected was fairly small for all three samples. The Colonel Sample displays the largest difference (4.7 percentage points) between the two groups. Out of the 96 lieutenant colonels not selected for promotion, 7.3 percent (7 officers) were serving in a combat 70
87 zone. From the 100 officers selected for promotion, 12 percent (12 officers) were currently serving in a combat zone. Overall, the effect of serving in a combat zone had a 63.2 percent selection rate (12 out of 19 officers). This was 12.2 percentage points higher than the overall in-zone population selection rate of 51.0 percent. The influence of the Combat_Service variable was the third secondary research question in this study. The combat service variable was annotated with an officer having zero, one, two, three, or four combat tours. Only the Colonel Sample had one officer with four combat tours. The variables used to capture this were: Combat_Service1, Combat_Service2, Combat_Service3, and Combat_Service4. The variables were binary and took on a 1 or 0 value. For instance, the Combat_Service3 variable would have a value of 1 if an officer completed three combat tours. The following list contains the combat tours captured in the TFDW Data that were used to code the four variables: Persian Golf, Operation Just Cause (Panama), Operation Desert Storm, Operation Enduring Freedom (OEF), and Operation Iraqi Freedom (OIF). Observations for Operation Just Cause (Panama) were not found in the Lieutenant Colonel Sample. It should be noted for the Combat_Service1 variable that the original sample from TFDW contained 79 missing observations for the three samples. The missing values were replaced utilizing the research capabilities of the Marine Corps Total Force System (MCTFS). 7 The values of the observations that were replaced for the 79 missing 7 Chief Warrant Officer-4 Jeff Stocker, Defense Language Institution Marine Detachment Personnel Officer was instrumental in finding the exact values for the 79 missing observations. 71
88 values for the Combat_Service1 variable are displayed in Table 19. The data correction made it possible for the researcher to identify 42 officers that had one combat tour that were originally observed as a missing variable. Additionally, 9 officers were found to have two combat tours. Table 19. Replaced Missing Values for Combat_Service Variable Combat Tours Major Sample Lieutenant Colonel Sample Colonel Sample Total Total (Source: Author, 2008) The number of combat deployments for the three samples is contained within Table 20. Additionally, the table contains the percentage of officers who have deployed to a combat zone in comparison to the in-zone population. The percentage of combat deployments is relatively consistent among the three samples. The percentage of those officers that did not have a combat tour only fluctuated by 8.3 percentage points among the three samples. This is interesting because as the grade of an officer increases, the percentage of combat tours should increase due to an increase in experience associated with time. The rise in this percentage due to increased experience would be associated with those officers who served in the Persian Gulf or Operation Desert Storm in the early 1990s. 72
89 Table 20. Combat Deployments Combat Major Sample Lieutenant Colonel Sample Colonel Sample Tours N percent Population N percent Population N percent Population percent percent percent percent percent percent percent percent percent percent percent percent 4 0 n/a 0 n/a percent (Source: Author, 2008) By examining the four Combat_Service variables in Tables 16, 17, and 18, the researcher found the Combat_Service1 variable has the greatest deviation among the four variables across all three samples. The largest differences in the means of those selected from those not selected for promotion were observed in the Lieutenant Colonel Sample. Of important note is that the differences in the mean of the Major Sample having the opposite effect of that observed in the other two samples. Analyzing the Major Sample, the researcher found the Combat_Service1 variable had the smallest margin for the officer selection rate. As noted previously, the mean of this variable had the opposite effect than the other two samples. The Combat_Service1 variable showed that 71.4 percent (459 officers) of the 643 captains with one combat tour were selected for major; yet, 75.0 percent (75 officers) of the 100 captains with one combat tour were not selected for promotion. The captains with one combat tour had a 86.0 percent selection rate (459 out of 534). Surprisingly, this was 1.4 percentage points lower than the overall in-zone population selection rate of 87.4 percent. The Lieutenant Colonel Sample experienced the opposite effect with the largest margin in the means of 73
90 those officers selected for promotion when compared against those officers not selected for promotion. The Combat_Service1 variable showed that 70.7 percent (237 officers) of the 335 majors selected for lieutenant colonel had one combat tour; yet, 50.5 percent (93 officers) of the 184 majors with one combat tour were not selected. A difference of 20.2 percentage points existed between the means of those officers with one combat tour in the select group and those in the not select groups. Overall, the Combat_Service1 variable had a 71.8 percent selection rate (237 out of 330 officers). This was 6.8 percentage points higher than the overall in-zone population selection rate of 65.0 percent. Finally, the effects of the Colonel Sample were similar to those of the Lieutenant Colonel Sample, but the magnitude was slightly lower. The Combat_Service1 variable showed that 81.0 percent (81 officers) of the 100 lieutenant colonels selected for colonel had one combat tour; yet, 62.5 percent (60 officers) of the 96 lieutenant colonels with one combat tour were not selected. An 18.5 percentage point difference existed between the means of the lieutenant colonels with one combat tour in the selected and notselected groups. Overall, the Combat_Service1 variable had a 57.4 percent selection rate (81 out of 141 officers). This was 6.4 percentage points higher than the overall inzone population selection rate of 51.0 percent. e. Commissioning There were five variables identifying the commissioning source in the sample. The variables were binary, and they consisted of an officer being commissioned 74
91 by one of the five programs: Officer Candidate School (OCS), Naval Reserve Officer Training Corps (NROTC), United States Naval Academy (USNA), Enlisted Programs (ENLPGM), and Other Source of Entry (Other_Source). The ENLPGM variable consisted of one of the three programs: Meritorious Enlisted Commissioning Education Program (MECEP), Enlisted Commissioning Program (ECP), or the Meritorious Commissioning Program (MCP). The Other_Source variable consisted mainly of interservice transfers and other military academy graduates. The descriptive statistics for the Commissioning variables for officers selected and not selected for promotion for the Major, Lieutenant Colonel, and Colonel Promotion Boards is demonstrated in Tables 21, 22, and 23. Table 21. Commissioning-descriptive Statistics of Captains Selected and Not Selected for Promotion Captains Not Selected for Major Variables N Mean Std. Dev. Min Max OCS NROTC USNA ENLPGM Other_Source Captains Selected for Major Variables N Mean Std. Dev. Min Max OCS NROTC USNA ENLPGM Other_Source (Source: Author, 2008) 75
92 Table 22. Commissioning-descriptive Statistics of Majors Selected and Not Selected for Promotion Majors Not Selected for Lieutenant Colonel Variables N Mean Std. Dev. Min Max OCS NROTC USNA ENLPGM Other_Source Majors Selected for Lieutenant Colonel Variables N Mean Std. Dev. Min Max OCS NROTC USNA ENLPGM Other_Source (Source: Author, 2008) Table 23. Commissioning-descriptive Statistics of Lieutenant Colonels Selected and Not Selected for Promotion Lieutenant Colonels Not Selected for Colonel Variables N Mean Std. Dev. Min Max OCS NROTC USNA ENLPGM Other_Source Lieutenant Colonels Selected for Colonel Variables N Mean Std. Dev. Min Max OCS NROTC USNA ENLPGM Other_Source (Source: Author, 2008) 76
93 There were a total of 23 missing variables for the three samples. The Major Sample had 18 missing variables, leaving 725 commissioning observations. The Lieutenant Colonel Sample had the least amount of missing variables (only 1), leaving the data with 518 commissioning observations. Finally, the Colonel Sample was missing 4 commissioning observations, resulting in a total of 192 observations. The mean characteristics on an officer being selected or not selected for promotion was consistent for some of the commissioning variables and was mixed for the others. The mean directional effect each commissioning variable had on an officer s selection for promotion is demonstrated in Table 24. The minus sign (-) in the table was used to symbolize that the mean of a variable was lower for those officers being selected than for those not selected, while the positive sign (+) symbolized that the mean of a variable was higher for those officers being selected than for those not selected. The OCS and NROTC were the only two consistent variables across all three samples. The OCS variable had a consistent downward effect on the mean of those selected for promotion, while the NROTC had an upward effect on all three selection boards. Table 24. Commissioning Mean Directional Effect on Selection for Promotion Major Board 77 Lieutenant Colonel Board Colonel Board OCS NROTC + + +
94 USNA ENLPGM Other_Source (Source: Author, 2008) After examining the mean directional difference (Table 24), the researcher then annotated the largest magnitude for each sample. Starting with the Major Sample, the researcher discovered the OCS variable had the largest margin for the officer selection rate. As noted previously, the mean direction of this variable was downward. The OCS variable showed that 58.0 percent (364 officers) of the 628 captains with the OCS commissioning source were selected for major, while 68.0 percent (66 officers) of the 97 captains with an OCS commissioning source were not selected for promotion. The captains with the OCS commissioning source had a 84.7 percent selection rate (364 out of 430). This was 2.7 percentage points lower than the overall in-zone population selection rate of 87.4 percent. The NROTC variable had the largest margins for the officer selection rates for the Lieutenant Colonel Sample, as displayed in Table 22. The NROTC variable demonstrated that 20.6 percent (69 officers) of the 335 majors with the NROTC commissioning source were selected for lieutenant colonel, while 15.3 percent (28 officers) of the 183 majors from the NROTC commissioning source were not selected for promotion. The NROTC commissioning source displayed a 71.1 percent promotion rate (69 out of 97). This was 6.1 percentage points higher than the overall in-zone population promotion rate of 65.0 percent. 78
95 Finally, the Colonel Sample was similar to the Major Sample; specifically, the OCS variable held the greatest mean difference between those officers selected for promotion and those officers not selected (as displayed in Table 23). Out of the 92 lieutenant colonels not selected for promotion, 53.3 percent (49 officers) were from the OCS commissioning source. From the 100 officers selected for promotion, 46.0 percent (46 officers) had a OCS commissioning source. Overall, the OCS commissioning source had a 48.1 percent selection rate (46 out of 95 officers). This was 2.9 percentage points lower than the overall inzone population promotion rate of 51.0 percent. f. Assignment The assignment category contained nine independent variables based upon unit, billet, and school characteristics. The assignment-descriptive statistics of officers selected and not selected for promotion for the three samples are described in Tables 25, 26, and 27. Table 25. Assignment-descriptive Statistics of Captains Selected and Not Selected for Promotion Captains Not Selected for Major Variables N Mean Std. Dev. Min Max FMF_Unit NONFMF_Unit Billet_Cmdr Billet_XO Billet_Pri_Stf Billet_Other Ser_School_ALS Ser_School_Other
96 Captains Selected for Major Variables N Mean Std. Dev. Min Max FMF_Unit NONFMF_Unit Billet_Cmdr Billet_XO Billet_Pri_Stf Billet_Other Ser_School_ALS (Source: Author, 2008) Table 26. Assignment-descriptive Statistics of Majors Selected and Not Selected for Promotion Majors Not Selected for Lieutenant Colonel Variables N Mean Std. Dev. Min Max FMF_Unit NONFMF_Unit Billet_Cmdr Billet_XO Billet_Pri_Stf Billet_Other Ser_School_ALS Ser_School_Other Majors Selected for Lieutenant Colonel Variables N Mean Std. Dev. Min Max FMF_Unit NONFMF_Unit Billet_Cmdr Billet_XO Billet_Pri_Stf Billet_Other Ser_School_ALS Ser_School_Other (Source: Author, 2008) 80
97 Table 27. Assignment-descriptive Statistics of Majors Selected and Not Selected for Promotion Lieutenant Colonels Not Selected for Colonel Variables N Mean Std. Dev. Min Max FMF_Unit NONFMF_Unit Billet_Cmdr Billet_XO Billet_Pri_Stf Billet_Other Ser_School_ALS Ser_School_Other Lieutenant Colonels Selected for Colonel Variables N Mean Std. Dev. Min Max FMF_Unit NONFMF_Unit Billet_Cmdr Billet_XO Billet_Pri_Stf Billet_Other Ser_School_ALS Ser_School_Other (Source: Author, 2008) The unit variable consisted of FMF_Unit and NONFMF_Unit. The FMF_Unit variable represented an officer who was serving in a Fleet Marine Force (FMF) Unit at the time the promotion board convened. The NONFMF_Unit variable contained all other units. The billets were separated into the following categories: Billet_Cmdr, Billet_XO, Billet_Pri_Stf, and Billet_Other. The Billet_Cmdr variable took on a value of 1 any time an officer was serving in the billet with the billet description of commander or commanding officer in the title on the fitness report. It should be noted that the 81
98 acronym of CO was recognized as commanding officer, and Cmdr was seen as commander. The Billet_XO billet was recognized as an officer serving in an executive officer billet at any level in a command. The Billet_Pri_Stf was used to signify officers serving as a principal staff officer. This billet consisted of the following billet descriptions: S1, S2, S3, S4, S6, Administrative Officer, Intelligence Officer, Operations Officer, Logistics Officer, Communications Officer, Assistant Chief of Staff (AC/S) G-1, AC/S G-2, AC/S G-3, AC/S G-4, AC/S G-6, and any N staff billet. Finally, Billet_Other contained those observations that were not captured in one of the other three billet variables. The student billets were not contained within the billet variables. The Ser_School_ALS and Ser_School_Other captured the effects of the school billets. It should also be noted that these variables were from panel data, so their observations took on a range for each officer. For example, an officer could have (2) Billet_Cmdr, (3) Billet_XO, (4) Billet_Pri_Stf, and (3) Billet_Other fitness reports contained over the eight year period. The school variables were based on the variables of Ser_School_ALS and Ser_School_Other. The Ser_School_ALS variable identifies officers who attended resident Appropriate Level School (ALS) for their grade. The Ser_School_ALS variable corresponded to Career Level Schools (CLS) for captains, Intermediate Level School (ILS) for majors, and Top Level School (TLS) for lieutenant colonels. The Ser_School_Other variable applied to all the other service schools that officers had attended during their career. 82
99 Within the assignment category, the means of the FMF_Unit variable had a large effect on the Major Sample, as seen in Table 25. Analyzing the 100 captains not selected for promotion, the researcher observed that 21.0 percent (21 officers) were serving in an FMF unit; however, from the 643 captains selected for promotion, 34.5 percent (222 officers) served in a FMF unit. A captain serving in a FMF Unit at the time the promotion board would have convened experienced a 91.4 percent selection rate to major (222 out of 243 officers). Also, within the Major Sample, the mean of was observed for billet commander fitness reports for those not selected for promotion, while a was the mean for those selected for major. Finally, 94.2 percent (213 out of 226 officers) of those captains that attended resident Career Level School were selected for promotion. This was 6.8 percentage points higher than the overall in-zone population selection rate of 87.4 percent. Unlike the Major Sample, the Lieutenant Colonel Sample saw very little deviation in the FMF_Unit variable among those officers selected (28.4 percent) for promotion from those not selected (27.2 percent). Additionally, the researcher found a mean of billet commander fitness reports for those not selected for promotion; he found a mean of for those selected for promotion. Finally, 76.3 percent (116 out of 152 officers) of those majors that attended resident Intermediate Level School were selected for promotion. This was 11.3 percentage points higher than the overall in-zone population selection rate of 65.0 percent. 83
100 The Colonel Sample displayed some of the greatest differences for the assignment category. Similar to the Lieutenant Colonel Sample, there was a small difference between the select (17.0 percent) and not select (12.5 percent) mean values for those currently assigned to a FMF Unit. However, the Billet_Cmdr variable had the greatest difference for the three samples. A lieutenant colonel selected for promotion to colonel had almost 4 times as many commander billets than an officer not selected for promotion. As seen in Table 27, this is commander billets in contrast to billets. Also, attendance at resident Appropriate Level School (ALS) had the largest difference in the Colonel Sample. The lieutenant colonels who attended resident Top Level School (TLS), experienced a selection rate of 81.8 percent (27 out of 33 officers). This was 30.8 percentage points higher than the overall in-zone population promotion rate of 51.0 percent. C. SUMMARY This chapter described the cross-sectional and panel data extracted from the TFDW, and the career information from the MMSB. The data consisted of 53 variables (including Grade_Select) that were used to examine the effect they would have on selection for promotion to major, lieutenant colonel, and colonel. Table 28 summarizes the comparison between the means of those officers selected for promotion against those officers not selected. The table contains the difference in terms of positive and negative numbers. A negative number for the difference column represents that the mean value for the not-selected officer sample was higher than the mean value 84
101 of the selected officer sample. A positive difference number for the samples displays the opposite effect. Table 28. Mean Comparison of Select & Non-select Samples Mean Values for Major Sample Mean Values for Lieutenant Colonel Sample Mean Values for Colonel Sample Demographics Not Not Not Selected Selected Difference Selected Selected Difference Selected Selected Difference Number_Depns Years_Comm_Serv Months_Grade GCT_Total Gender White Black Other_race Marital_Status Greater_College College Less_College a n/a n/a n/a Performance PFT Water_Unq Water_Qualified Water_Waiver Water_CWSS_MCIWS RelVal_Cum_Low RelVal_Cum_High RelVal_Cum_Avg RelVal_Cum_sd RO_PCT_Low RO_PCT_High RO_PCT_Avg RO_PCT_sd Personal_Awards Other_Awards
102 MOS Category Joint_MOS b n/a n/a n/a Combat Ground_Support Service_Support Aviation_Fixed Aviation_Rotary Aviation_Support Combat Crisis_Code Combat_Service Combat_Service Combat_Service Combat_Service4 c n/a n/a n/a n/a n/a n/a Commissioning OCS NROTC USNA ENLPGM Other_Source Assignment FMF_Unit NONFMF_Unit Billet_Cmdr Billet_XO Billet_Pri_Stf Billet_Other Ser_School_ALS Ser_School_Other Table Code a b c Colonel Sample did not contain any Less_College observations. Major Sample did not contain any Joint_MOS observations. Colonel Sample contained the only Combat_Service4 observations. (Source: Author, 2008) 86
103 V. MODELS AND RESULTS Officers are selected for promotion for their potential to carry out the duties and responsibilities of the next higher grade based upon past performance as indicated in their official military personnel file. Promotions should not be considered a reward for past performance, but as incentive to excel in the next higher grade. (HQMC, 2006, August 9, p. 2) A. OVERVIEW The researcher chose the Probit Model to examine the effects of the independent variables described in Chapter IV on the dependent variable of Grade_Select. Grade_Select is a binary variable with two potential outcomes: select for promotion (Grade_Select = 1) or not select for promotion (Grade_Select = 0). Wooldridge describes the Probit Model by explaining it is, A model for binary responses where the response probability is the standard normal cumulative distribution function (cdf) evaluated at a linear function of the program (Wooldridge, 2006, p. 868). He goes on to explain the meaning of the cdf as, A function that gives the probability of a random variable being less than or equal to any specified real number (p. 861). The response probability for the binary response model is described in Figure 8. Within the figure, y represents the dependent variable of Grade_Select. The x variable represents the independent variables contained within the six categories of demographics, commissioning, performance, military occupational field, combat, and assignment. For instance, x 1 would be Number_Depns, x 2 Years_Comm_Serv, x 3 87
104 Years_Serv continuing on through the other independent variables until reaching x 53 Ser_School_Other variable. Figure 8. Response Probability for Binary Response Model Py= Py= x1 x2 x k ( 1x) = ( 1,,, ) (Source: Wooldridge, 2006, p. 583) As mentioned earlier, the Probit Model is the multivariate statistical technique the researcher used to examine the effect of the independent variables on selection for promotion. The Probit Model is described in greater detail as illustrated in Figure 9. Figure 9. Probit Model In the Probit Model, G is the standard normal cumulative distribution function (cdf), which is expressed as an integral: z Gz ( ) =Φ( z) φ( vdv ), where φ ( z) is the standard normal density φ 1/2 2 ( z) = (2 π) exp( z / 2). (Source: Wooldridge, 2006, p. 584) B. MAJOR (O-4) PROMOTION MODEL 1. Development of the Major Promotion Model As stated earlier, the promotion model was developed from six categories of independent variables. The six categories were used to estimate the predicted probability of promotion. This was performed in a sequential order 88
105 starting with the independent variable category of demographics and progressing to the assignment category, as displayed in Table 29. The addition of different independent variable categories was used to analyze the change in marginal effects across the six models. The addition of variables to a model can cause the marginal effects of the variables to either increase or decrease in magnitude. Furthermore, the addition of independent variables can cause variables to become statistically significant (1 percent, 5 percent, or 10 percent level); or, it can have the reverse effect and cause the variables to become statistically insignificant. Wooldridge explains the meaning of statistically significant as, Rejecting the null hypothesis that a parameter is equal to zero against the specified alternative, at the chosen significance level (Wooldridge, 2006, p. 870). Table 29. Major Promotion Model Specifications Model 1: Grade_Select_04 = (Demographics) Model 2: Grade_Select_04 = (Demographics, Commissioning) Model 3: Grade_Select_04 = (Demographics, Commissioning, Performance) Model 4: Grade_Select_04 = (Demographics, Commissioning, Performance, Military Occupational Field) Model 5: Grade_Select_04 = (Demographics, Commissioning, Performance, Military Occupational Field, Combat,) Model 6: Grade_Select_04 = (Demographics, Commissioning, Performance, Military Occupational Field, Combat, Assignment) (Source: Author, 2008) Model 6 was the final promotion model containing 38 of the independent variables. The base case for the model was a single white male captain who possessed an Associate s or Bachelor s degree; attended the United States Naval Academy; 89
106 had a Water Qualification level of 1, 2, 3, 4, or was Water Survival Qualified (WSQ); had served in the military occupational field of combat; and was not serving in the Fleet Marine Force (FMF). The results for the model are shown in Table 30. The results contain the magnitude of the marginal effects, standard errors, statistical significance (1 percent, 5 percent, and 10 percent level) and the sign of the coefficient. A negative sign on the coefficient explains that the variable reduces the overall predicted probability of promotion, while a positive sign has the opposite effect and increases the overall predicted probability of promotion. Table 30. Major Promotion Model Results Model 1 Model 2 Model 3 Model 4 Model 5 Model 6 Demographics Number_Depns ( ) ( ) ( ) ( ) ( ) ( ) [ ] [- [ ] [ ] [ ] [ ] ] Years_Comm_Serv ( ) ( ) ( ) ( ) ( ) ( ) [ ] [- [ ] [ ] [ ] [ ] ] Months_Capt ( ) ( ) ( ) ( ) ( ) ( ) [ ] [ ] [ ] [ ] [ ] [ ] GCT_Total ( ) ( ) ( ) ( ) ( ) ( ) [ ] [ ] [ ] [ ] [ ] [ ] Female ( ) ( ) ( ) ( ) ( ) ( ) [ ] [ ] [ ] [ ] [ ] [ ] Black ( ) ( ) ( ) ( ) ( ) ( ) [ ] [- [ ] [ ] [ ] [ ] ] Other_Race ( ) ( ) ( ) ( ) ( ) ( ) [ ] [- [ ] [ ] [ ] [ ] ] Marital_Status ( ) ( ) ( )** ( )** ( )** ( )* [ ] [ ] [ ] [ ] [ ] [ ] Greater_College ( )** ( ) * ( ) ( ) ( ) ( ) 90
107 [ ] [ ] [ ] [ ] [ ] [ ] Less_College ( ) [ ] Commissioning OCS ( ) ( ) ( ) ( ) ( ) [- [ ] [ ] [ ] [ ] ] NROTC ( ) ( ) ( ) ( ) ( ) [ ] [ ] [ ] [ ] [ ] ENLPGM ( ) ( ) ( ) ( ) ( ) [ ] [ ] [ ] [ ] [ ] Other_Source ( ) ( ) ( ) ( ) ( ) [ ] [ ] [ ] [ ] [ ] Performance PFT ( )*** ( )** * ( )** * ( )** * [ ] [ ] [ ] [ ] Water_Waiver ( ) ( ) ( ) ( ) [ ] [ ] [ ] [ ] Water_CWSS_MCIWS ( ) ( ) ( ) ( )* [ ] [ ] [ ] [ RelVal_Cum_Avg ( )** ( )** ( )** ( )** [ ] [ ] [ ] [ ] RelVal_Cum_sd ( ) ( ) ( ) ( ) [ ] [ ] [ ] [ ] RO_PCT_Avg ( ) ( ) ( ) ( ) [ ] [ ] [ ] [ ] RO_PCT_sd ( )*** ( )** * ( )** * ( )** * [ ] [ ] [ ] [ ] Personal_Award ( )*** ( )** * ( )** * ( )** * [ ] [ ] [ ] [ ] Other_Award ( ) ( ) ( ) ( ) [ ] [ ] [ ] [ ] MOS Category Ground_Support ( ) ( ) ( ) [ ] [ ] [ ] Service_Support ( ) ( ) ( ) [ ] [ ] [ ] Aviation_Fixed ( ) ( ) ( ) [ ] [ ] [ ] Aviation_Rotary
108 ( ) ( ) ( ) [ ] [ ] [ ] Aviation_Support ( ) ( ) ( ) [ ] [ ] [ ] Combat Crisis_Code ( ) ( ) [ ] [ ] Combat_Service ( ) ( ) [ ] [ ] Combat_Service ( ) ( ) [ ] [ ] Combat_Service ( ) ( ) [ ] [ ] Assignment FMF_Unit ( ) [ ] Billet_Cmdr ( ) [ ] Billet_XO ( ) [ ] Billet_Pri_Staff ( ) [ ] Ser_School_CLS ( )** [ ] Ser_School_Other ( )** [ ] Constant ( ) ( ) ( )*** ( )** * ( )** * ( )** * Observations R squared Coefficients on same line as variable Standard errors in parentheses * significant at 10 percent; ** significant at 5 percent; *** significant at 1 percent Partial Effects in brackets (Source: Author, 2008) The results of the six models changed as more variables were added to the separate models. Model 6, which contained all the variables in the model, ended up with eight statistically significant variables spread among the 1 percent, 5 percent, and 10 percent levels of significance. 92
109 The Pseudo R-squared ranged among the six models from in Model 1 to in Model 6. Wooldridge describes the Pseudo R-squared in the terms of the R-squared by explaining, Therefore, we can compute a pseudo R-squared for probit and logit that is directly comparable to the usual R-squared from the estimation of a linear probability model (Wooldridge, 2006, p. 590). He goes on to define the R-squared as, In a multiple regression model, the proportion of the total sample variation in the dependent variable that is explained by the independent variable (Wooldridge, 2006, p. 868). Therefore, in Model 6, of the dependent variable (Grade_Select_O4) is explained by the independent variables used in the Probit Model. The Less_College variable from the Demographic category was used in Model 1, as seen in Table 30. This variable was statistically insignificant in its effect on the predicted probability of a captain being selected for major. It should be noted that this variable was dropped from Model 2 when the Commissioning category was added. This resulted from missing observations in the Commissioning category that ended up removing the Less_College variable from Models 2 through 6. The PFT variable in the Performance category of the independent variables was added in Model 3. This variable remained statistically significant at the 1 percent level for all the models. Of interest, the variable s magnitude remained consistent at for the partial effects for all of the models. The effects of this variable in percentage terms will be discussed later in this section. 93
110 Five of the statistically significant variables from Model 6 are analyzed in detail in Figures 10 through 14. The percent change caused by the partial effects was calculated by dividing the partial effect (df/dx) of the variable by the model promotion rate. The figures make the partial effects of the variables easier to understand by comparing two Marines with similar backgrounds and qualifications. In the following figures, the captains are identical in all observable aspects relating to the research variables, except for the variable being analyzed. These aspects would include the independent variables of gender, marital status, number of dependents, race, education, Physical Fitness Test (PFT) scores, combat assignments, etc. Again, the only difference between the Marines being compared is in the variable being analyzed. As evidenced in Figure 10, Marine B has a 4.1-percent greater predicted probability of being promoted than does Marine A due to the 29 point difference in the PFT scores. The value of 29 was chosen because it represented one standard deviation for the PFT variable. Additionally, 259 was designated as the score to represent Marine B, because it was the average PFT score for the captain that was selected for promotion from the summary statistics. As noted previously, the officers are identical in all the observable variables from the research data, except for the PFT variable. This demonstrates that high levels of physical fitness will increase a captain s opportunity for promotion. 94
111 Figure 10. PFT Partial Effects for Major Promotion Board (Source: Author, 2008) As displayed in Figure 11, Marine B has a 3.6-percent greater predicted probability of being promoted than does Marine A due to the increase in one additional award. The award variable was statistically significant at the 1 percent level. Marine B was shown to have two personal awards, and Marine A was shown to have one award because this represented one standard deviation for the personal award variable. Additionally, the value of two was designated as the number of personal awards for Marine B, due to the fact that 2.3 was the average number of awards for the captain that was selected for promotion from the summary statistics. 95
 In Figure 12, Marine B has a 5-percent greater predicted probability of being promoted than does Marine A due to")
112 Figure 11. Personal Awards Partial Effects for Major Promotion Board (Source: Author, 2008) In Figure 12, Marine B has a 5-percent greater predicted probability of being promoted than does Marine A due to attending resident Career Level School (CLS) as a captain. Unlike the PFT and Personal Awards variables that were statistically significant at the 1-percent level, the resident CLS variable was statistically significant at the 5-percent level. Since the CLS variable was binary, the values chosen for Marine A (CLS = 0) matched those of the captain who did not attend CLS; Marine B (CLS = 1) represented the captain who did attend resident CLS. Overall, holding all the observable factors in the sample constant, resident schooling was shown to be an important factor in the selection for major. 96
113 Figure 12. Resident Career Level School Partial Effects for Major Promotion Board Resident Career Level School Partial Effects 04 Board: Attending CLS = 5% Increase in Predicted Probability of Promotion (Significant at 5%) Marine A (Capt) Marine A & B are identical twins in all observable aspects except for CLS. Marine B (Capt) Did not attend CLS Attended CLS Marine B has a 5% greater predicted probability of being promoted to Maj than Marine A. (Source: Author, 2008) The effects of the fitness report on promotion as recorded in the Reporting Senior s Cumulative Relative Value are analyzed in Figure 13. For the Major Promotion Board, this variable was statistically significant at the 5-percent level. The summary statistics for a captain (Marine B) that was selected for promotion had an average cumulative relative value of Taking one standard deviation (3.1) from 90.6, the value of 87.5 is used to represent Marine A. To recap from Chapter 4, the value of 90 for the Cumulative Relative Value represents the average Marine Reported On (MRO) as compared to the other Marines that a Reporting Senior (RS) has evaluated for the same grade. As demonstrated in the figure, the difference of 3.1 between the two captains represented a 3.4-percent greater predicted 97
114 probability of promotion for Marine B due to the increased cumulative relative value. Therefore, the Reporting Senior Cumulative Relative Value was shown to identify that increased performance as designated in the increased Cumulative Relative Value markings is correlated with an increase in promotion to major. Figure 13. Cumulative Relative Value Partial Effects for Major Promotion board (Source: Author, 2008) The effect of a captain s consistency on selection for major was analyzed by examining the Cumulative Reviewing Officer s standard deviation, as shown in Figure 14. A onepoint increase in Cumulative Reviewing Officer Standard Deviation (RO_PCT_sd) variable resulted in a 0.8-percent decrease in the predicted probability of promotion for the Major Promotion board. The summary statistic for the captain that was selected for promotion resulted in a value 98
115 of 21.5 for the RO_PCT_sd variable. By adding one standard deviation (6.8) to this value, the researcher can provide Marine A with a RO_PCT_sd value of The one standard deviation difference between these two officers in the figure would result in Marine B having a 5-percent greater predicted probability of being promoted, due to the lower standard deviation value. This demonstrates that consistent performance is directly correlated with higher levels of selection for promotion. Figure 14. Cumulative Reviewing Officer Standard Deviation Partial Effects for Major Promotion Board Cumulative RO Standard Deviation Partial Effects 04 Board: 1 Point Increase = 0.8% Decrease Increase in Predicted Probability of Promotion (Significant at 1%) Marine A (Capt) Marine A & B are identical twins in all observable aspects except RO Std Dev Marine B (Capt) RO Standard Deviation: 28.3 RO Standard Deviation: 21.5 Marine B has a 5% greater predicted probability of being promoted to Maj than Marine A. (Source: Author: 2008) 2. Interactive Major Promotion Model A snapshot of the Interactive Major Promotion Model is shown in Table 31. The captain with the characteristics 99
116 shown in the model has an 87.4 percent predicted probability of being promoted, with an error of plus or minus 8 percent. As the values for the variables in the model are changed, the predicted probability of promotion will either increase or decrease depending on the sign (negative or positive) of the coefficient. Additionally, the margin by which the predicted probability of promotion increases or decreases is directly related to the magnitude attributed to the coefficient. The characteristics of the captain displayed in the model have the same promotion rate as the average selection rate (87.4) established for the in-zone population in the Fiscal Year (FY) 2008 Major Promotion Board. Appendix H contains sample snap-shots of the Interactive Major Promotion Model with different variables being changed in the model. The variables that have been changed are highlighted to display the before and after difference. The magnitude of the change was one standard deviation for the variables in the appendix, unless the variable was binary. If the variable was binary, then the change was either a zero or one. Table 31. Interactive Major Promotion Model Promotion Factors for Major Board Enter Here Number of Dependents 2 Years of Commissioned Service 8.7 Months as a Captain 62 General Classification Test (GCT) Score 126 Gender Female Race White Marital Status Married Education College Source of Entry ENLPGM Physical Fitness Test (PFT) Score 280 Water Qualification Level Water Qualified Relative Value Cumulative Average 90.5 Relative Value Cumulative Standard Deviation 5 100
117 Reviewing Officer Percentile Average 69.1 Reviewing Officer Percentile Standard Deviation 26 Personal Awards 2 Other Awards 11 Military Occupational Specialty (MOS) Category Ground Support Serving in Combat During Board Crisis Code 1 combat tour 1 2 combat tours 0 3 combat tours 0 Unit Assignment NON-FMF Unit Commander Billets 4 Executive Officer Billets 1 Principal Staff Officer Billets 2 Career Level School 0 Other Service Schools 10 Predicted Probability of Promotion Error Major Board In-Zone Selection Percentage (Source: Author, 2008) 87.4 percent +/- 8 percent 87.4 percent C. LIEUTENANT COLONEL (O-5) PROMOTION MODEL 1. Development of the Lieutenant Colonel Promotion Model Similar to the Major Promotion Model, the Lieutenant Colonel Promotion Model was developed from six categories of independent variables. The six categories were used to estimate the predicted probability of promotion, as seen in Table
118 Table 32. Lieutenant Colonel Promotion Model Specifications Model 1: Grade_Select_05 = (Demographics) Model 2: Grade_Select_05 = (Demographics, Commissioning) Model 3: Grade_Select_05 = (Demographics, Commissioning, Performance) Model 4: Grade_Select_05 = (Demographics, Commissioning, Performance, Military Occupational Field) Model 5: Grade_Select_05 = (Demographics, Commissioning, Performance, Military Occupational Field, Combat,) Model 6: Grade_Select_05 = (Demographics, Commissioning, Performance, Military Occupational Field, Combat, Assignment) (Source: Author, 2008) The results for the six model specifications developed in Table 32 are displayed in Table 33. Model 6 is the final promotion model and, thus, contains 40 of the independent variables. The base case for the model was a single white male major who possessed an Associate s or Bachelor s degree; attended the United States Naval Academy; had a Water Qualification level of 1, 2, 3, 4, or was Water Survival Qualified (WSQ); had served in the military occupational field of combat; and was not serving in the Fleet Marine Force (FMF). The Lieutenant Colonel Promotion Model results contain the magnitude of the marginal effects, standard errors, statistical significance (1 percent, 5 percent, and 10 percent level) and the sign of the coefficient. A negative sign on the coefficient explains that the variable reduces the overall predicted probability of promotion to lieutenant colonel, while a positive sign has the opposite effect and increases the overall predicted probability of promotion. 102
119 Table 33. Lieutenant Colonel Promotion Model Results Model 1 Model 2 Model 3 Model 4 Model 5 Model 6 Demographics Number_Depns ( ) ( ) ( ) ( ) ( ) ( ) [ ] [ ] [ ] [ ] [ ] [ ] Years_Comm_Serv ( ) ( ) ( ) ( ) ( ) ( ) [ ] [ ] [ ] [ ] [ ] [ ] Months_Maj ( ) ( ) ( )** ( )** ( )** ( )** [ ] [ ] [ ] [ ] [ ] [ ] GCT_Total ( ) ( ) ( ) ( ) ( ) ( ) [ ] [ ] [ ] [ ] [ ] [ ] Female ( ) ( ) ( ) ( ) ( ) ( ) [ ] [ ] [ ] [ ] [ ] [ ] Black ( )** ( )** ( ) ( ) ( ) ( ) [ ] [ ] [ ] [ ] [ ] [ ] Other_Race ( ) ( ) ( ) ( ) ( ) ( ) [ ] [ ] [ ] [ ] [ ] [ ] Marital_Status ( )* ( )* ( ) ( ) ( ) ( ) [ ] [ ] [ ] [ ] [ ] [ ] Greater_College ( )* ( ) ( ) ( ) ( ) ( ) [ ] [ ] [ ] [ ] [ ] [ ] Less_College ( ) ( ) ( ) ( ) ( ) ( ) [ ] [ ] [ ] [ ] [ ] [ ] Commissioning OCS ( )** ( ) ( ) ( ) ( ) [ ] [ ] [ ] [ ] [ ] NROTC ( ) ( ) ( ) ( ) ( ) [ ] [ ] [ ] [ ] [ ] ENLPGM ( )** ( ) ( )* ( )* ( )* [ ] [ ] [ ] [ ] [ ] Other_Source ( )** ( ) ( ) ( ) ( ) [ ] [ ] [ ] [ ] [ ] Performance PFT ( )*** ( )*** ( )*** ( )*** [ ] [ ] [ ] [ ] Water_Unq ( ) ( ) ( ) ( ) [ ] [ ] [ ] [ ] Water_Waiver ( ) ( ) ( ) ( ) [ ] [ ] [ ] [ ] Water_CWSS_MCIWS ( ) ( ) ( ) ( ) [ ] [ ] [ ] [ ] RelVal_Cum_Avg ( )*** ( )*** ( )*** ( )*** [ ][ [ ] [ ] [ ] RelVal_Cum_sd ( )* ( ) ( ) ( ) [ ] [ ] [ ] [ ] 103
120 RO_PCT_Avg ( )** ( )** ( )** ( )** [ ] [ ] [ ] [ ] RO_PCT_sd ( )*** ( )*** ( )*** ( )*** [ ] [ ] [ ] [ ] Personal_Award ( )* ( ) ( ) ( ) [ ] [ ] [ ] [ ] Other_Award ( ) ( ) ( ) ( ) [ ] [ ] [ ] [ ] MOS Category Joint_MOS ( ) ( ) ( ) [ ] [ ] [ ] Ground_Support ( ) ( ) ( ) [ ] [ ] [ ] Service_Support ( ) ( ) ( ) [ ] [ ] [ ] Aviation_Fixed ( )*** ( )*** ( ) [ ] [ ] [ ] Aviation_Rotary ( )*** ( )** ( ) [ ] [ ] [ ] Aviation_Support ( )** ( )** ( )* [ ] [ ] [ ] Combat Crisis_Code ( ) ( ) [ ] [ ] Combat_Service ( )** ( )** [ ] [ ] Combat_Service ( ) ( ) [ ] [ ] Combat_Service ( ) ( ) [ ] [ ] Assignment FMF_Unit ( ) [ ] Billet_Cmdr ( ) [ ] Billet_XO ( ) [ ] Billet_Pri_Staff ( ) [ ] Ser_School_ILS ( )*** [ ] Ser_School_Other ( ) [ ] Constant ( ) ( ) ( )*** ( )*** ( )*** ( )*** Observations
121 R Squared Coefficients on same line as variable Standard errors in parentheses * significant at 10 percent; ** significant at 5 percent; *** significant at 1 percent Partial Effects in brackets (Source: Author, 2008) Quite similar to the Major Promotion Models, the results of the six models changed as more variables were added to the separate models. Model 6, which contained all the variables in the model, ended up with nine statistically significant variables spread among the 1 percent, 5 percent, and 10 percent levels of significance. Six of the statistically significant variables from Model 6 are analyzed in detail in Figures 15 through 20. Consistent with the comparison done for the Major Board variables, the Lieutenant Colonel Board used the same type of figures to make the partial effects of the variables easier to understand and compared two similar Marines. The majors are identical in all observable aspects of the model, except for the variable being analyzed. For instance, these aspects could include gender, marital status, number of dependents, race, education, Physical Fitness Test (PFT) scores, combat assignments, etc. The only difference between the two majors being compared is the variable in question. The Pseudo R-squared ranged among the six models from in Model 1 to in Model 6. In Model 6, this would account for of the dependent variable (Grade_Select_O5) being explained by the independent variables used in the Probit Model. As evidenced in Figure 15, a major that increases his PFT score by one point will increase his predicted probability for promotion by 0.38 percent, holding all else constant. In the example, Marine B would have a
122 percent greater predicted probability of being promoted than does Marine A because of the 32-point increase in his PFT score. The 0.38 percent was calculated by dividing the partial effect (df/dx) by the observed probability of promotion (.663) in the model. The 32 point difference was chosen to compare the difference between a 230- and a 262- point PFT score because it represented one standard deviation for the PFT Score variable. The PFT variable was statistically significant at the 1-percent level. Figure 15. PFT Partial Effects for Lieutenant Colonel Promotion Board (Source: Author, 2008) As displayed in Figure 16, Marine B has a 21-percent greater predicted probability of being promoted than does Marine A for having one combat tour (as compared to Marine A s zero combat tours). The combat tour variable was statistically significant at the 5-percent level. The
123 percent was calculated by dividing the 0.14 partial effect (df/dx) on the one combat tour variable by the observed probability of promotion (.663) in the model. Figure 16. Combat Tour Partial Effects for Lieutenant Colonel Promotion Board (Source: Author, 2008) Holding all else constant, Marine B has a 23-percent greater predicted probability of being promoted than does Marine A due to attending resident Intermediate Level School (ILS) as a major, as shown in Figure 17. The ILS variable was statistically significant at the 1-percent level. Since the ILS variable was binary, the values chosen for Marine A (ILS = 0) was a major who did not attend resident ILS, and Marine B (ILS = 1) represented the major who attended resident ILS. The 23 percent was found by dividing the partial effect (df/dx) for the Intermediate Level School (ILS) variable by the observed probability of 107
124 promotion (.663) in the model. Overall, holding all the observable factors in the sample constant, resident schooling was shown to be an important factor in the selection for lieutenant colonel. Figure 17. Resident Intermediate Level School Partial Effects for Lieutenant Colonel Promotion Board (Source: Author, 2008) The partial effects of the Reporting Senior s Cumulative Relative Value are analyzed in Figure 18. This variable was statistically significant at the 1-percent level. An average cumulative relative value of 92.2 was used to represent Marine B in the figure. This value was quite similar to the summary statistics for average cumulative relative value (92.4) for the majors that were selected for lieutenant colonel. Taking one standard deviation (3.2) from 92.2, the value of 89 is used to 108
125 represent Marine A. As demonstrated in the figure, the difference of 3.2 relative value points between the two majors resulted in a 28-percent greater predicted probability of promotion for Marine B due to the increased cumulative relative value. The 8.7 percent was calculated by dividing the partial effect (df/dx) on the Cumulative Relative Value variable by the observed probability of promotion (.663) in the model. The Reporting Senior Cumulative Relative Value displays that increased performance (as annotated in the increased Cumulative Relative Value markings) leads to an increase in promotion to lieutenant colonel. Figure 18. Cumulative Relative Value Partial Effects for Lieutenant Colonel Promotion Board (Source: Author, 2008) 109
126 Similar to the partial effects of the Reporting Senior s Cumulative Relative Value shown in the above figure, the partial effects of the Cumulative Reviewing Officer Percentiles are analyzed in Figure 19. This variable was statistically significant at the 5-percent level. The summary statistics for the average percentile of the major that was selected for lieutenant colonel had an cumulative reviewing officer percentile of The value of 79.0 was used to represent Marine B in the figure. One standard deviation represented by 13.6 percentile points was subtracted from 79.0 (Marine B), to obtain the value of 65.4 (Marine A). The difference of 13.6 percentile points between the two majors resulted in a 15-percent greater predicted probability of promotion for Marine B due to the increased cumulative reviewing officer percentile. In other terms, for every 1-percentage point increase in the cumulative reviewing officer percentile, the result will be a 1.1- percent increase in the predicted probability of promotion to lieutenant colonel. The 1.1 percent was calculated by dividing the partial effect (df/dx) of the Cumulative Reviewing Officer Percentile variable by the observed probability of promotion (.663) in the model. Consistent with the Reporting Senior Cumulative Relative Value results, the Cumulative Reviewing Officer Percentile variable demonstrates that increased performance as annotated in the increased Cumulative Reviewing Officer Percentile markings, results in a increase in promotion to lieutenant colonel. 110
127 Figure 19. Cumulative Reviewing Officer Percentile Partial Effects for Lieutenant Colonel Promotion Board (Source: Author, 2008) The average of the Cumulative Reviewing Officer Percentile markings were shown to have a positive effect on promotion. Now, the researcher can analyze the consistency of a major s performance as captured by the Cumulative Reviewing Officer s Standard Deviation for its effect on promotion as seen in Figure 20. Holding all other observable variables in the model constant, a one-point increase in Cumulative Reviewing Officer Standard Deviation (RO_PCT_sd) variable resulted in a 2.1-percent decrease in the predicted probability of promotion for a major in the sample. The summary statistic for the major that was selected for promotion resulted in a value of 20.9 for the RO_PCT_sd variable. By adding one standard deviation (7.3) to this value, the researcher can illustrate that Marine A 111

128 will have a RO_PCT_sd value of The 7.3-point difference between these two officers has resulted in a 15- percent greater predicted probability of being promoted for Marine B. This demonstrates that consistent performance is directly correlated with higher levels of selection for promotion. Figure 20. Cumulative Reviewing Officer Standard Deviation Partial Effects for Lieutenant Colonel Promotion Board (Source: Author, 2008) 2. Interactive Lieutenant Colonel Promotion Model A snapshot of the Interactive Lieutenant Colonel Promotion Model is shown in Table 34. As shown in the promotion model, the major with the characteristics shown in the model has a 65.0 percent predicted probability of being promoted, with an error of plus or minus 9 percent. As the 112
129 values for the variables in the model are changed, the predicted probability of promotion will either increase or decrease depending on the sign (negative or positive) of the coefficient. Additionally, the margin by which the predicted probability of promotion increases or decreases is directly related to the magnitude attributed with the coefficient. The characteristics of the major displayed in the model have the same promotion rate as the average selection rate (65.0 percent) established for the in-zone population in the Fiscal Year (FY) 2008 Lieutenant Colonel Promotion Board. Appendix I contains sample snapshots of the Interactive Lieutenant Colonel Promotion Model with different variables being changed in the model. The variables that have been changed are highlighted to display the before and after difference. The magnitude of the change was one standard deviation for the variables in the appendix, unless the variable was binary. If the variable was binary, then the change was either a zero or one. Table 34. Interactive Lieutenant Colonel Promotion Model Promotion Factors for Lieutenant Colonel Board Enter Here Number of Dependents 3 Years of Commissioned Service 14 Months as a Major 58 General Classification Test (GCT) Score 126 Gender Male Race Black Marital Status Married Education Greater_College Source of Entry ENLPGM Physical Fitness Test (PFT) Score 240 Water Qualification Level Water Waiver Relative Value Cumulative Average 92 Relative Value Cumulative Standard Deviation 4 Reviewing Officer Percentile Average 74 Reviewing Officer Percentile Standard Deviation
130 Personal Awards 3 Other Awards 10 Joint Military Occupational Specialty (MOS) 0 Military Occupational Specialty (MOS) Category Combat Serving in Combat During Board Crisis Code 1 combat tour 0 2 combat tours 0 3 combat tours 0 Unit Assignment NON-FMF Unit Commander Billets 2 Executive Officer Billets 1 Principal Staff Officer Billets 2 Intermediate Level School 1 Other Service Schools 10 Predicted Probability of Promotion 65.0 percent Error +/- 9 percent Lieutenant Colonel Board In-Zone Selection Percentage 65.0 percent (Source: Author, 2008) D. COLONEL (0-6) PROMOTION MODEL 1. Development of the Colonel Promotion Model Similar to the Lieutenant Colonel Promotion Model, the Colonel Promotion Model was developed from six categories of independent variables. The six categories were used to estimate the predicted probability of promotion as seen in Table 35. Table 35. Colonel Promotion Model Specifications Model 1: Grade_Select_06 = (Demographics) Model 2: Grade_Select_06 = (Demographics, Commissioning) Model 3: Grade_Select_06 = (Demographics, Commissioning, Performance) Model 4: Grade_Select_06 = (Demographics, Commissioning, Performance, Military Occupational Field) Model 5: Grade_Select_06 = (Demographics, Commissioning, Performance, Military Occupational Field, Combat,) Model 6: Grade_Select_06 = (Demographics, Commissioning, Performance, Military Occupational Field, Combat, Assignment) (Source: Author, 2008) 114
131 The results for the six model specifications developed in Table 35 are displayed in Table 36. Model 6 is the final promotion model and, thus, contains 37 of the independent variables. The base case for the model was a single white male lieutenant colonel who possessed an Associate s or Bachelor s degree; attended the United States Naval Academy; had a Water Qualification level of 1, 2, 3, 4, or was Water Survival Qualified (WSQ); had served in the military occupational field of combat; and was not serving in the Fleet Marine Force (FMF). The Colonel Promotion Model results contain the magnitude of the marginal effects, standard errors, statistical significance (1 percent, 5 percent, and 10 percent level) and the sign of the coefficient. A negative sign on the coefficient explains that the variable reduces the overall predicted probability of promotion to colonel, while a positive sign has the opposite effect and increases the overall predicted probability of promotion. Table 36. Colonel Promotion Model Results Model 1 Model 2 Model 3 Model 4 Model 5 Model 6 Demographics Number_Depns ( ) ( ) ( ) ( ) ( ) ( ) [ ] [ ] [ ] [ ] [ ] [ ] Years_Comm_Serv ( ) ( ) ( ) ( ) ( ) ( ) [ ] [ ] [ ] [ ] [ ] [ ] Months_LtCol ( ) ( ) ( ) ( ) ( ) ( ) [ ] [ ] [ ] [ ] [ ] [ ] GCT_Total ( ) ( ) ( ) ( ) ( ) ( )* [ ] [ ] [ ] [ ] [ ] [ ] Female ( ) ( ) ( ) ( ) ( ) ( ) [ ] [ ] [ ] [ ] [ ] [ ] Black ( ) ( ) ( ) ( ) ( ) ( ) [ ] [ ] [ ] [ ] [ ] [ ] Marital_Status ( )* ( )* ( )* ( )* ( )* ( )** 115
132 [ ] [ ] [ ] [ ] [ ] [ ] Greater_College ( )* ( )** ( )** ( )** ( )** ( )** ** * [ ] [ ] [ ] [ ] [ ] [ ] Commissioning OCS ( ) ( ) ( ) ( ) ( ) [ ] [ ] [ ] [ ] [ ] NROTC ( ) ( ) ( ) ( ) ( ) [ ] [ ] [ ] [ ] [ ] ENLPGM ( ) ( ) ( ) ( ) ( )* [ ] [ ] [ ] [ ] [ ] Other_Source ( ) ( ) ( ) ( ) ( ) [ ] [ ] [ ] [ ] [ ] Performance PFT ( ) ( ) ( ) ( ) [ ] [ ] [ ] [ ] Water_Waiver ( ) ( ) ( )* ( )* [ ] [ ] [ ] [ ] Water_CWSS_MCIWS ( ) ( ) ( ) ( ) [ ] [ ] [ ] [ ] RelVal_Cum_Avg ( ) ( ) ( ) ( ) [ ] [ ] [ ] [ ] RelVal_Cum_sd ( )** ( )** ( )** ( ) [ ] [ ] [ ] [ ] RO_PCT_Avg ( )** ( )** ( )** ( )** * * * [ ] [ ] [ ] [ ] RO_PCT_sd ( ) ( ) ( ) ( ) [ ] [ ] [ ] [ ] Personal_Award ( ) ( ) ( ) ( ) [ ] [ ] [ ] [ ] Other_Award ( )* ( ) ( ) ( ) [ ] [ ] [ ] [ ] MOS Category Joint_MOS ( ) ( ) ( ) [ ] [ ] [ ] Ground_Support ( ) ( ) ( ) [ ] [ ] [ ] Service_Support ( ) ( ) ( ) [ ] [ ] [ ] Aviation_Fixed ( ) ( ) ( ) 116
133 [ ] [ ] [ ] Aviation_Rotary ( ) ( ) ( ) [ ] [ ] [ ] Aviation_Support ( ) ( ) ( )* [ ] [ ] [ ] Combat crisis_code ( ) ( ) [ ] [ ] Combat_Service ( )** ( )* [ ] [ ] Combat_Service ( ) ( )** [ ] [ ] Combat_Service ( ) ( ) [ ] [ ] Assignment FMF_Unit ( ) [ ] Billet_Cmdr ( )** * [ ] Billet_XO ( ) [ ] Billet_Pri_Staff ( ) [ ] Ser_School_TLS ( ) [ ] Ser_School_Other ( ) [ ] Constant ( ) ( )* ( ) ( ) ( ) ( ) Observations R Squared Coefficients on same line as variable Standard errors in parentheses * significant at 10 percent; ** significant at 5 percent; *** significant at 1 percent Partial Effects in brackets (Source: Author, 2008) * The results of the six models changed as more variables were added to the separate models. Model 6, which contained all the variables in the model, ended up with ten statistically significant variables distributed among the 1 117
134 percent, 5 percent, and 10 percent levels of significance. The ranges in the changes of the variables across the six models depended on the variable in question. The Pseudo R- squared ranged among the six models from in Model 1 to in Model 6. In Model 6, this would account for of the dependent variable (Grade_Select_O6) being explained by the independent variables used in the Probit Model. For instance, the Greater_College variable had a partial effect of in Model 1, while Model 6 was The independent variable categories of commissioning, performance, MOS category, combat, and assignment accounted for a increase in the partial effect of the variable. Additionally, this variable went from the 1-percent level of significance in Model 1, to the 5-percent level in Model 6. The Cumulative Reviewing Officer Percentile (RO_PCT_Avg) variable remained consistent from the introduction in Model 4, to the final of Model 6. The partial effect of this variable in Model 4 was recorded at , while in Model 6 it was The independent variable categories of MOS Category, Combat, and Assignment only attributed a increase in the magnitude of the partial effect. In terms of statistical significance, this variable was similar to the Greater_College variable, since it also was reduced from a 1-percent level of significance to a 5-percent level. Four of the variables from Model 6 are analyzed in detail in Figures 21 through 24. The figures make the partial effects of the variables easier to understand by 118
135 comparing two similar Marines. These Marines are identical in all observable aspects, except for the variable being analyzed. These aspects could include months as a lieutenant colonel, commissioning source, gender, marital status, number of dependents, race, education, Physical Fitness Test (PFT) scores, combat assignments, etc. The only observable difference between the two Marines is the variable in question. Holding all other observable variables constant, Marine B with one combat tour has a 54-percent greater predicted probability of being promoted than does Marine A, as displayed in Figure 21. The One Combat Tour variable was statistically significant at the 10-percent level for the Colonel Promotion Model. Since the Combat Tour variable was binary, the values chosen for Marine A (Combat_Service1 = 0) matched those of a lieutenant colonel who has not deployed to combat, and Marine B (Combat_Service1 = 1) represented the lieutenant colonel who had one combat tour. The 54- percent increase in predicted probability of promotion was calculated by dividing the 0.30 partial effect (df/dx) of the Combat_Service1 variable by the observed probability of promotion (0.553) in the model. Overall, holding all the observable factors in the sample constant, having been deployed to combat was associated with a large magnitude for increased selection for colonel. 119
136 Figure 21. Combat Tour Partial Effects for Colonel Promotion Board Combat Tour Partial Effects 06 Board: 1 Combat tour = 54% Increase in the Predicted Probability of Promotion (Significant at 10% level) Marine A (LtCol) Marine A & B are identical twins in all observable aspects except combat tours. Marine B (LtCol) No Combat tours 1 Combat tour Marine B has a 54% greater predicted probability of being promoted to Col than Marine A. (Source: Author, 2008) The Greater_College variable was statistically significant at the 5-percent level for the Colonel Board. This variable was statistically insignificant for the Major and Lieutenant Colonel Promotion Models. As displayed in Figure 22, Marine B has a 60-percent greater predicted probability of being promoted than Marine A due to his advanced degree. Marine B would need to have either a Master s, Post-Master s, First-Professional, or a Doctorate Degree to be represented by the Greater_College variable. The 60 percent was formulated by dividing the 0.33 partial effect (df/dx) on the Greater_College variable by the observed probability of promotion (.553) in the model. Overall, holding all the observable factors in the sample constant, a lieutenant colonel that invests in his education 120
137 beyond an Associates or Bachelor s degree would greatly improve his opportunity for promotion to Colonel. Figure 22. Post-college Education Partial Effects for Colonel Promotion Board Post-college Education Partial Effects 06 Board: Post-college Education = 60% Increase in the Predicted Probability of Promotion (Significant at 5% level) Marine A (LtCol) Bachelor s Degree Marine A & B are identical twins in all observable aspects except education. Marine B (LtCol) Master s Degree Marine B has a 60% greater predicted probability of being promoted to Col than Marine A. (Source: Author, 2008) The summary statistics showed that the lieutenant colonel that was selected for promotion had an average of 2.6 commander billet fitness reports, as opposed to the 0.7 of the lieutenant colonel who was not selected. Analyzing the model results in Figure 23, a lieutenant colonel with one additional commander billet fitness report will increase his predicted probability for promotion by 44 percent, holding all other observable variables constant. The 44 percent was calculated by dividing the partial effect (df/dx) by the observed probability of promotion (.553) in the model. In the example, Marine B would have an 88- percent greater predicted probability of being promoted than 121
138 does Marine A because of the additional two commander billet fitness reports. The difference of 2 was selected as the comparison number because the standard deviation for the Billet_Cmdr variable was 1.8. The 88-percent increase in predicted probably of promotion can be attributed to the command screening process for lieutenant colonel commands. Basically, the command screening process already starts the process of differentiation of performance among lieutenant colonels that will soon be accomplished at the Colonel Promotion Board. Figure 23. Commander Billet Partial Effects for Colonel Promotion Board Commander Billet Partial Effects 06 Board: 1 Commander Billet = 44% Increase in the Predicted Probability of Promotion (Significant at 1% level) Marine A (LtCol) Marine A & B are identical twins in all observable aspects except # of Cmdr billets. Marine B (LtCol) 1 Commander Billet 3 Commander Billets Marine B has a 88% greater predicted probability of being promoted to Col than Marine A. (Source: Author, 2008) The Cumulative Reviewing Officer Percentile variable was statistically significant at the 5-percent level. The summary statistics for the average percentile of the lieutenant colonel (Marine B) that was selected for colonel 122
139 had a cumulative reviewing officer percentile of One standard deviation represented for the RO_PCT_Avg variable was 10.5 percentile points. The one standard deviation value was used as the difference to contrast Marine B (83.0) to Marine A (72.5). The difference of 10.5 percentile points between the two lieutenant colonels resulted in a 61-percent greater predicted probability of promotion for Marine B due to the increased cumulative reviewing officer percentile. Holding all other observable variables constant, for every 1-percentage point increase in the cumulative reviewing officer percentile, the result will be a 5.8-percent increase in the predicted probability of promotion to colonel. The 5.8 percent was calculated by dividing the partial effect (df/dx) on the Cumulative Reviewing Officer Percentile variable by the observed probability of promotion (.553) in the model. The Cumulative Reviewing Officer Percentile variable demonstrates that the Reviewing Officer (RO) (the senior officer on the fitness report) greatly influences increased promotion by the percentile he assigns to the lieutenant colonel he is evaluating. 123
140 Figure 24. Cumulative RO Percentile Partial Effects for Colonel Promotion Board Cumulative RO Percentile Partial Effects 06 Board: 1% Point Change = 5.8% Increase in the Predicted Probability of Promotion (Significant at 5% level) Marine A (LtCol) Marine A & B are identical twins in all observable aspects except RO Percentiles. Marine B (LtCol) RO Percentile: 72.5 RO Percentile: 83 Marine B has a 61% greater predicted probability of being promoted to Col than Marine A. (Source: Author, 2008) 2. Interactive Colonel Promotion Model A snap-shot of the Interactive Colonel Promotion Model is shown in Table 37. As shown in the promotion model, the lieutenant colonel with the characteristics shown in the model has a predicted probability of being promoted of 51.0 percent with an error of plus or minus 19 percent. As the researcher changes the values for the variables in the model, the predicted probability of promotion will either increase or decrease depending on the sign (negative or positive) of the coefficient. Additionally, the margin by which the predicted probability of promotion increases or decreases is directly related to the magnitude attributed to the coefficient. The characteristics of the lieutenant colonel displayed in the model have the same promotion rate 124
141 as the average selection rate (51.0 percent) established for the in-zone population in the Fiscal Year (FY) 2008 Colonel Promotion Board. Appendix J contains sample snap-shots of the Interactive Colonel Promotion Model with different variables being changed in the model. The variables that have been changed are highlighted to display the before and after difference. The magnitude of the change was one standard deviation for the variables in the appendix, unless the variable was binary. If the variable was binary, then the change was either a zero or one. 125
142 Table 37. Interactive Colonel Promotion Model Promotion Factors for Colonel Board Enter Here Number of Dependents 3 Years of Commissioned Service 20 Months as a Lieutenant Colonel 54 General Classification Test (GCT) Score 130 Gender Male Race White Marital Status Married Education Greater_College Source of Entry Other Entry Source Physical Fitness Test (PFT) Score 238 Water Qualification Level Water Qualified Relative Value Cumulative Average 93.1 Relative Value Cumulative Standard Deviation 5 Reviewing Officer Percentile Average 81 Reviewing Officer Percentile Standard Deviation 19 Personal Awards 4 Other Awards 13 Joint Military Occupational Specialty (MOS) 0 Military Occupational Specialty (MOS) Category Ground Support Serving in Combat During Board No 1 combat tour 1 2 combat tours 1 3 combat tours 0 Unit Assignment FMF Unit Commander Billets 3 Executive Officer Billets 1 Principal Staff Officer Billets 5 Top Level School 0 Other Service Schools 12 Predicted Probability of Promotion Error Colonel Board In-zone Selection Percentage (Source: Author, 2008) 51.0 percent +/- 19 percent 51.0 percent 126
143 VI. CONCLUSIONS AND RECOMMENDATIONS Since the birth of our Nation, our liberty has been purchased by valiant men and women of deep conviction, great courage, and bold action; the cost has often been in blood and tremendous sacrifice. As America s sentinels of freedom, United States Marines are counted among the finest legions in the chronicles of war. Since 1775, Marines have marched boldly to the sounds of guns and have fought fiercely and honorably to defeat the scourge of tyranny and terror. We are Marines that is what we do. 8 General James T. Conway, USMC A. CONCLUSIONS The study of officer promotions has been examined over the years by many different individuals. The focus of the studies has remained fairly consistent in terms of certain observable aspects. The consistency can be seen in a majority of the studies; indeed, most models include gender, race, education, and commissioning source as independent variables. However, the difference in the studies can be observed by examining each researcher s focus on the specific effects of certain variables on promotion. Past literature has studied the specific effects of Primary Military Occupational Specialty (PMOS), minority status, gender, education, commissioning source, and assignment patterns on promotion. 8 General Conway made this statement in the 2007 Commandant of the Marine Corps Birthday Message (Headquarters Marine Corps (Conway, 2007, November 10). 127
144 The focus of this research was to isolate and examine those factors that a promotion board would possibly consider when selecting or not selecting an officer for promotion. The researcher identified those variables examined to determine if an officer is the best qualified for promotion. The researcher felt this information could then be used as a tool by the Marine Corps Career Counselors to educate officers on their career choices. Additionally, the researcher specifically wanted to examine the most recent data (Fiscal Year 2008 Promotion Board Data) available to analyze the effects of time on the importance of certain factors. With the Global War of Terror (GWOT) continuing in Afghanistan and Iraq, the effects of deployment to a combat zone on promotion was of significant interest. Also, with the high level of attention given to physical fitness in the Marine Corps, the researcher had an interest in analyzing the effects of increased Physical Fitness Test (PFT) scores. Finally, with the change of the fitness report in early 1999 to a quantitative system that could be measured, the researcher wanted to see if those markings had an effect on promotion. The purpose of the study was to develop a useable promotion model for the Career Counseling Section (MMOA-4) of Manpower and Reserve Affairs (M&RA). The idea behind the model was to equip the career counselors with a tool that could be used to help officers make better career decisions. The model would give the counselors the ability to educate officers on the quantitative measures associated with their decisions. 128
145 The data for this research was obtained from two separate sources. The first data source was the Total Force Data Warehouse (TFDW); the second source was the Manpower Management Support Branch (MMSB). The two sources were merged together to complete three separate samples for studying the promotion to major, lieutenant colonel and colonel. The TFDW data used in this research consisted of crosssectional and panel data. The major, lieutenant colonel and colonel observations were 743, 519, and 196, respectively. The TFDW data provided 41 of the 56 variables used in the analysis. It was the source for the dependent variable of grade select. The independent variables were assigned to six categories of demographics, commissioning source, performance, military occupational field, combat service, and assignments. MMSB was used to collect the fitness report information on the officers from 01 January 1999 to the date the board convened. Fitness report data was not collected before 1999 because of the qualitative nature of the old fitness reports. The data collection provided independent performance variables of fitness report relative value measures and reviewing officer percentages. Additionally, assignment variables were produced to include commander, executive officer, primary staff, and other billets. Three samples from the above data were produced to identify the statistically significant factors in predicting promotion to major, lieutenant colonel, and colonel. The explanatory power or goodness of fit of the models increased as the grade of the promotion board increased. The Pseudo 129
146 R-squared for the major, lieutenant colonel, and colonel final model (Model 6) was , , and respectively. Therefore, examining the colonel model, 50 percent of the independent variables explained the effects of the dependent variable on whether a lieutenant colonel was selected for promotion. As the grade of the promotion board increased, the number of statistically significant (1 percent, 5 percent, and 10 percent level) variables also increased. The major model had eight statistically significant variables; the lieutenant colonel model had nine, and the colonel model had ten. Tables 38, 39, and 40 contain only the independent variables that were statistically significant in the three models. 130
147 Table 38. Major Promotion Model Statistically Significant Independent Variables Model 1 Model 2 Model 3 Model 4 Model 5 Model 6 Demographics Marital_Status ( ) ( ) ( )** ( )** ( )** ( )* [ ] [ ] [ ] [ ] [ ] [ ] Performance PFT ( )** * ( )** * ( )** * ( )** * [ ] [ ] [ ] [ ] Water_CWSS_MCIWS ( ) ( ) ( ) ( )* [ ] [ ] [ ] [ RelVal_Cum_Avg ( )** ( )** ( )** ( )** [ ] [ ] [ ] [ ] RO_PCT_sd ( )** * ( )** * ( )** * ( )** * [ ] [ ] [ ] [ ] Personal_Award ( )** * ( )** * ( )** * ( )** * [ ] [ ] [ ] [ ] Assignment Ser_School_CLS ( )** [ ] Ser_School_Other ( )** [ ] Constant ( ) ( ) ( )** * ( )** * ( )** * ( )** * Observations R squared Coefficients on same line as variable Standard errors in parentheses * significant at 10 percent; ** significant at 5 percent; *** significant at 1 percent Partial Effects in brackets (Source: Author, 2008) 131
148 Table 39. Lieutenant Colonel Promotion Model Statistically Significant Independent Variables Model 1 Model 2 Model 3 Model 4 Model 5 Model 6 Demographics Months_Maj ( ) ( ) ( )** ( )** ( )** ( )** [ ] [ ] [ ] [ ] [ ] [ ] Commissioning ENLPGM ( )* ( ) ( )* ( )* ( )* * [ ] [ ] [ ] [ ] [ ] Performance PFT ( )** * ( )** * ( )** * ( )** * [ ] [ ] [ ] [ ] RelVal_Cum_Avg ( )** * ( )** * ( )** * ( )** * [ ][ [ ] [ ] [ ] RO_PCT_Avg ( )** ( )** ( )** ( )** [ ] [ ] [ ] [ ] RO_PCT_sd ( )** * ( )** * ( )** * ( )** * [ ] [ ] [ ] [ ] MOS Category Aviation_Support ( )** ( )** ( )* [ ] [ ] [ ] Combat Combat_Service ( )** ( )** [ ] [ ] Assignment Ser_School_ILS ( )** * [ ] Constant ( ) ( ) ( )** * ( )** * ( )** * ( )** * Observations R Squared Coefficients on same line as variable Standard errors in parentheses * significant at 10 percent; ** significant at 5 percent; *** significant at 1 percent Partial Effects in brackets (Source: Author, 2008) 132
149 Table 40. Colonel Promotion Model Statistically Significant Independent Variables Model 1 Model 2 Model 3 Model 4 Model 5 Model 6 Demographics GCT_Total ( ) ( ) ( ) ( ) ( ) ( )* [ ] [ ] [ ] [ ] [ ] [ ] Marital_Status ( )* ( )* ( )* ( )* ( )* ( )** [ ] [ ] [ ] [ ] [ ] [ ] Greater_College ( )* ( )** ( )** ( )** ( )** ( )** ** * [ ] [ ] [ ] [ ] [ ] [ ] Commissioning ENLPGM ( ) ( ) ( ) ( ) ( )* [ ] [ ] [ ] [ ] [ ] Performance Water_Waiver ( ) ( ) ( )* ( )* [ ] [ ] [ ] [ ] RO_PCT_Avg ( )** ( )** ( )** ( )** * * * [ ] [ ] [ ] [ ] MOS Category Aviation_Support ( ) ( ) ( )* [ ] [ ] [ ] Combat Combat_Service ( )** * ( )* [ ] [ ] Combat_Service ( ) ( )** [ ] [ ] Assignment Billet_Cmdr ( )** * [ ] Constant ( ) ( )* ( ) ( ) ( ) ( ) Observations R Squared Coefficients on same line as variable Standard errors in parentheses * significant at 10 percent; ** significant at 5 percent; *** significant at 1 percent Partial Effects in brackets (Source: Author, 2008) 133
150 As can be seen among the three models, some of the variables were statistically significant in more than one sample. Specifically, this research analyzed the three variables of combat service, physical fitness, and fitness reports in detail. The difference of one combat tour was observed to be statistically significant at the 5- and 10-percent level for the Lieutenant Colonel and Colonel Boards respectively. The effect of one combat tour was calculated by taking the partial effect and dividing it by the model promotion rate. For the Lieutenant Colonel Board, holding all observable factors constant, a major with one combat tour would have a 21-percent increased predicted probability of promotion over a major with zero combat tours. Doing the same for the Colonel Board, a lieutenant colonel would increase his predicted probability of being promoted by 54 percent by having one combat tour. The effects of physical fitness were not statistically significant for the Colonel Board. However, the Physical Fitness Test (PFT) score was statistically significant at the 1-percent level for both the Major and Lieutenant Colonel Promotion Boards. A captain who increased his PFT score by one point would increase his predicted probability of promotion by 0.14 percent. For a major, the 1-point increase would increase his chance by 0.38 percent. Therefore, a major who had a 262-point score on his PFT would have a 12.2-percent greater predicted probability of being promoted than a major with a 230 PFT. The effects of the fitness report were examined using the Reporting Senior s (RS s) Cumulative Relative Value 134
151 Markings. This variable was statistically significant at the 5-percent level for the Major Board and the 1-percent level for the O5 Board. The variable was positively correlated with an officer being selected for promotion. Holding all observable aspects in the model constant, a onepoint increase in the Cumulative Relative Value would result in a 1.1 percent increase in promotion to major and an 8.7 percent increase in promotion to lieutenant colonel. A major with a Cumulative Relative Value of 92.2 would have a 28-percent predicted probability of being promoted over a major with a value of 89. Next, the researcher wanted to examine the effects of the Reviewing Officer (RO) comparative assessment markings on promotion. Since the comparative assessment markings consisted only of raw numbers, a system had to be created to isolate the quantitative aspects of this variable. By utilizing the comparative assessment markings, the researcher was able to convert the assessment markings into a percentile ranking. This was accomplished by conducting the following steps. First, the assessment markings by the Reviewing Officer (RO) were added together to get an aggregate number for the comparative assessment. This value represents the total number of fitness reports the RO has reviewed for that specific grade. Next, the number of assessment markings for each level of the pyramid was divided by the total to generate a row percentage for each level. The row percentage represented the individual percentile for the eight levels in the RO pyramid. Note, if the RO did not use a level in the comparative assessment, then the result would be a zero 135
152 for that row percentage. Finally, a cumulative percentage was calculated by adding the row percentages together. This was accomplished by starting at the bottom of the pyramid (Assessment Mark 1) and adding the row percentages until the top of the pyramid was reached (Assessment Mark 8). The result would be a Cumulative Percentage for each level of the RO pyramid (See Table 12). The Cumulative Reviewing Officer (RO) Percentile Average variable was created through the above methodology. This variable was statistically significant at the 5- percent level for the Lieutenant Colonel and Colonel Promotion Boards. The summary statistics displayed that major that was selected for promotion had a Cumulative RO Percentile average score of 79.0, as compared to the major who was not selected with a Additionally, the summary statistics for the lieutenant colonel that was selected for promotion showed a percentile of 83.0, in contrast to the 74.6 for the lieutenant colonel who was not selected. Holding all observable aspects in the model constant, a 1- percentage point increase in the Cumulative RO Percentile average would result in a 1.1-percent increase in promotion to lieutenant colonel and a 5.8-percent increase in promotion to colonel. A lieutenant colonel with a Cumulative RO Percentile average of 83 would have a 61- percent greater predicted probability of being promoted than a lieutenant colonel with a value of Finally, the researcher wanted to examine the effects of an officer s consistency on his predicted probability of being promoted. To capture this effect, a standard deviation variable was created for the RS Cumulative 136
153 Relative Value Average and the Cumulative RO Percentile Average. The RO Percentile Standard Deviation variable was statistically significant at the 1-percent level for the MAJOR and Lieutenant Colonel Promotion Board models. Holding all observable aspects in the model constant, a onepoint increase in the RO Percentile Standard Deviation would result in a 0.8-percent decrease in promotion to major and a 2.1-percent decrease in promotion to lieutenant colonel. A major with a RO Percentile Standard Deviation of 19.3 would have a 15-percent greater predicted probability of being promoted than a major with a value of Limitations One of the major limitations of the study was the sample size of the three samples used to estimate the predicted probability of promotion. The sample size was 743 for the MAJOR Board sample, 519 for the Lieutenant Colonel Board, and 196 for the Colonel Board. Additionally, missing values caused the sample size to decrease for all three samples. This resulted in the MAJOR Promotion Model consisting of 640 observations, the Lieutenant Colonel Model of 480 observations, and the Colonel Model of 170 observations. Another limitation of the study was the use of crosssectional data. The cross-sectional data captures the observation at one point in time. For instance, the FMF_Unit variable identifies an officer that is assigned to the Fleet Marine Force at the time the data is pulled. It does not identify the officer s assignment pattern over his entire career in the Marine Corps. The value of this variable is clearly limited, since it only identifies a 137
154 small part of an officer s career path. Additionally, this variable is limited in the fact it only compares FMF and non-fmf unit assignments. Other assignments (such as Marine Security Guard Duty, Recruiting Duty, or Drill Instructor Duty) may have some explanatory value in their effect on promotion. B. RECOMMENDATIONS The first recommendation is for the Career Counseling Section (MMOA-4) to utilize the promotion model developed by this research. Three samples of this interactive model are shown in Tables 31, 33, and 35. This interactive promotion model can serve as a tool to enhance the career counseling process. The value of the model is not in the overall predicted probability of promotion that the model assigns to an officer. The value comes from the change an officer has some control over. For instance, in Appendix H, the model was run both for a captain who had not attended resident Career Level School (CLS) and for a captain who had resident attended CLS. The predicted probability of being promoted in the first example was 87.4 percent for all the characteristics that were entered into the model. In the second example (only changing the CLS variable), the captain who attended resident CLS had a 93.3 percent predicted probability of being promoted. First, it is the researcher s opinion that the value of the model does not come from informing the captain that his predicted probability of promotion will increase from 87.4 to 93.3 percent. Instead, the captain should be informed that attending resident CLS may increase his predicted probability of being promoted by 5.9 percent. Second, the 138
155 promotion models should not be used to show an officer the changes in predicted probability of promotion on the factors they have no control over, such as gender and race. The model should only be used to counsel officers on militaryrelated factors (i.e., the CLS example above). More specifically, if adding the number of dependents increases the predicted probability of promotion, this is not the type of information the model was created to be used for. Finally, the model should only be distributed to MMOA-4 for their use in the career counseling process. The second recommendation is for the Reviewing Officer (RO) Comparative Assessment in the fitness report to be changed to a percentile system. The current system utilizing raw numbers only gives a general view of where the Marine Reported On (MRO) falls among his peers. The percentile system is superior to the current system because it assigns an exact value (percentile) to the Reviewing Officer s (RO) markings. This gives the MRO the capability to identify exactly where he ranks among his peers. The percentile system would also allow command, promotion, and school boards to better differentiate among officers using this system. It would also give the RO a better idea on the potential impact he would be having on an officer s career by the percentile that was assigned to that officer. Finally, this system is consistent with the relative value system that is currently in place for the Reporting Seniors (RSs). The raw numbers from the RS s report average are put into perspective when they are assigned a relative value. This similar system should be followed for the RO comparative assessment markings. 139
156 THIS PAGE INTENTIONALLY LEFT BLANK 140
157 APPENDIX A. MARINE CORPS PHYSICAL FITNESS TEST STANDARDS (Source: Headquarters Marine Corps, 2002, May 10) 141
158 THIS PAGE INTENTIONALLY LEFT BLANK 142
159 APPENDIX B. FEMALE PFT SCORING TABLE (Source: Headquarters Marine Corps, 2002, May 10) 143
160 THIS PAGE INTENTIONALLY LEFT BLANK 144
161 APPENDIX C. MALE PFT SCORING TABLE (Source: Headquarters Marine Corps, 2002, May 10) 145
162 THIS PAGE INTENTIONALLY LEFT BLANK 146
163 APPENDIX D. SAMPLE MASTER BRIEF SHEET FITNESS REPORT LISTINGS (MBS) 147
164 148
165 (Source: Headquarters Marine Corps, 2006, May 11) 149
166 THIS PAGE INTENTIONALLY LEFT BLANK 150
167 APPENDIX E. MARINE CORPS FITNESS REPORT 151
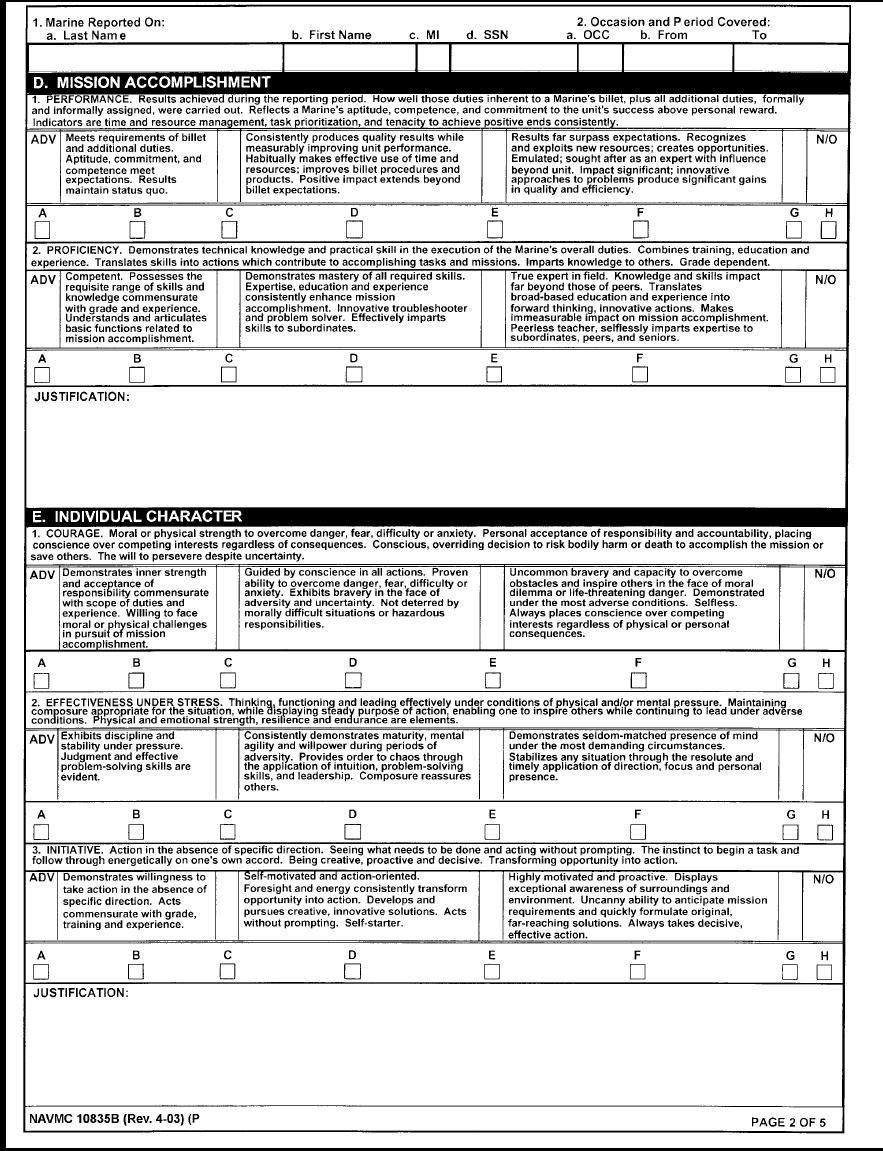
168 152
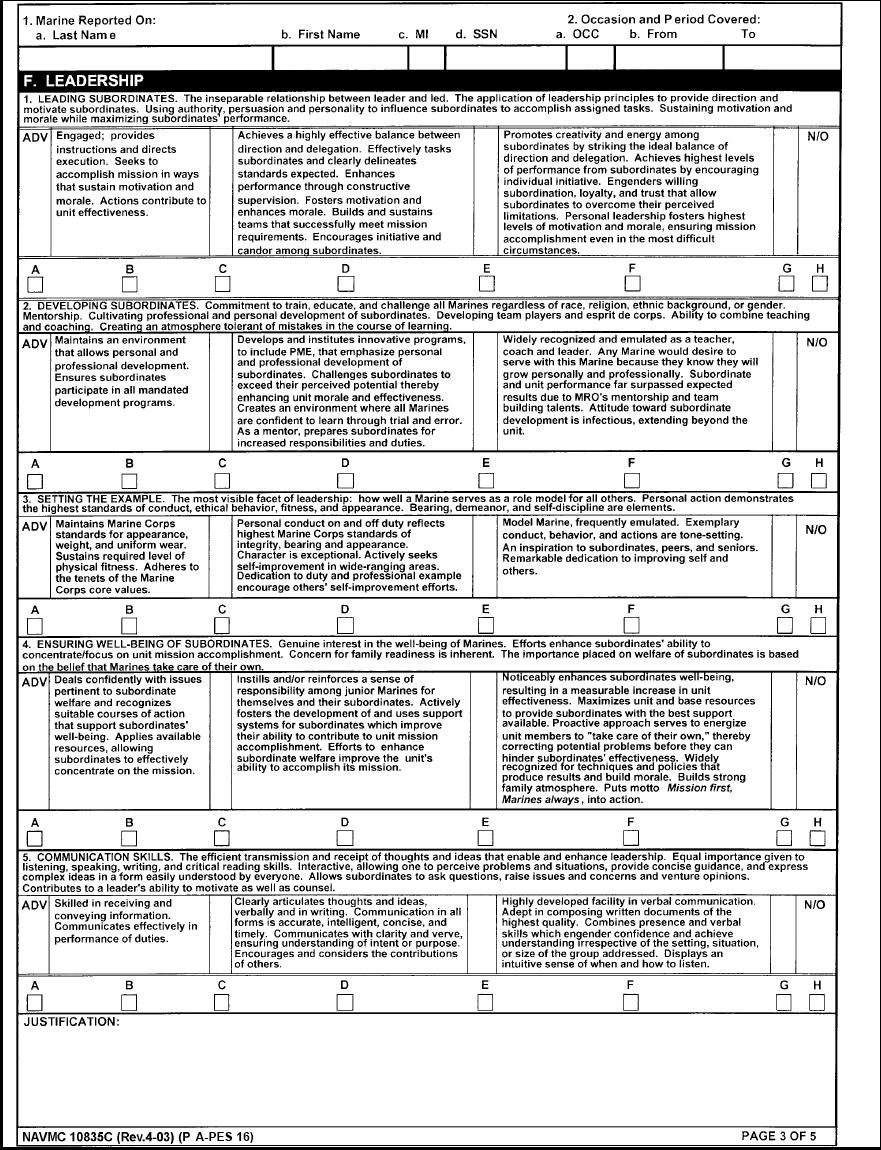
169 153
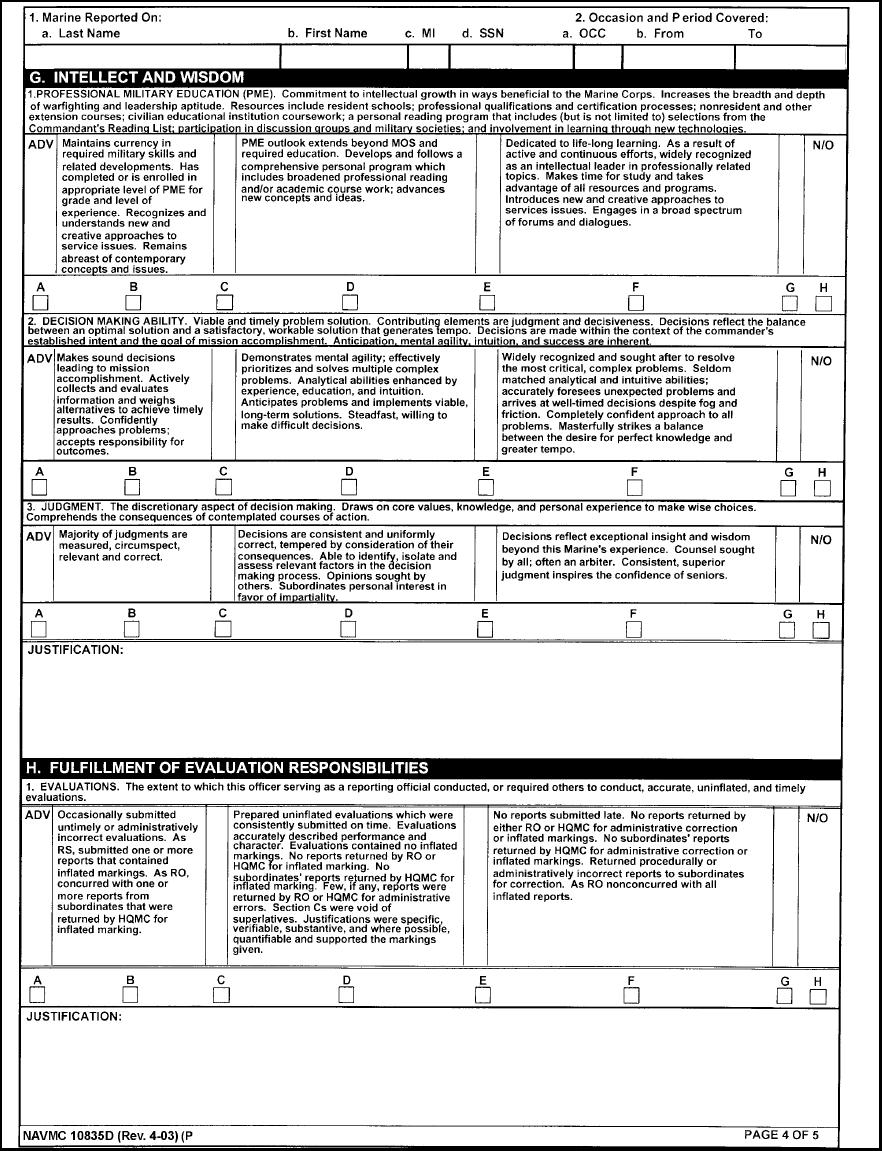
170 154
MCO P C MMPR-1 09 AUG Subj: MARINE CORPS PROMOTION MANUAL, VOLUME 1, OFFICER PROMOTIONS (SHORT TITLE: MARCORPROMMAN, VOL 1, OFFPROM)
") MCO P1400.31C MMPR-1 09 AUG 2006 MARINE CORPS ORDER P1400.31C W/CH 1 From: Commandant of the Marine Corps To: Distribution List Subj: MARINE CORPS PROMOTION MANUAL, VOLUME 1, OFFICER PROMOTIONS (SHORT
MCO P1400.31C MMPR-1 09 AUG 2006 MARINE CORPS ORDER P1400.31C W/CH 1 From: Commandant of the Marine Corps To: Distribution List Subj: MARINE CORPS PROMOTION MANUAL, VOLUME 1, OFFICER PROMOTIONS (SHORT
Restricted Officer Info Brief. Capt Raul P. Garza Restricted Officer Planner HQMC, M&RA, MPP Oct 2014
 Restricted Officer Info Brief Capt Raul P. Garza Restricted Officer Planner HQMC, M&RA, MPP-35 22 Oct 2014 1 Restricted Officer Planner Duties Develop, implement, and maintain RO plans and programs including
NAVAL POSTGRADUATE SCHOOL THESIS
 NAVAL POSTGRADUATE SCHOOL MONTEREY, CALIFORNIA THESIS AN ANALYSIS OF THE MARINE CORPS ENLISTMENT BONUS PROGRAM by Billy H. Ramsey March 2008 Thesis Co-Advisors: Samuel E. Buttrey Bill Hatch Approved for
U.S. Naval Officer accession sources: promotion probability and evaluation of cost
 Calhoun: The NPS Institutional Archive DSpace Repository Theses and Dissertations 1. Thesis and Dissertation Collection, all items 2015-06 U.S. Naval Officer accession sources: promotion probability and
Department of Defense INSTRUCTION
 Department of Defense INSTRUCTION NUMBER 1320.14 December 11, 2013 Incorporating Change 1, Effective March 7, 2018 USD(P&R) SUBJECT: Commissioned Officer Promotion Program Procedures References: See Enclosure
DEPARTMENT OF THE NAVY OFFICE OF THE SECRETARY 1000 NAVY PENTAGON WASHINGTON DC
 SECNAV INSTRUCTION 1420.1B From: Secretary of the Navy DEPARTMENT OF THE NAVY OFFICE OF THE SECRETARY 1000 NAVY PENTAGON WASHINGTON DC 20350-1000 SECNAVINST 1420.1B N132F/PERS-48 March 28,2006 Subj: PROMOTION,
Military to Civilian Conversion: Where Effectiveness Meets Efficiency
 Military to Civilian Conversion: Where Effectiveness Meets Efficiency EWS 2005 Subject Area Strategic Issues Military to Civilian Conversion: Where Effectiveness Meets Efficiency EWS Contemporary Issue
DEPARTMENT OF THE NAVY HEADQUARTERS UNITED STATES MARINE CORPS 2 NAVY ANNEX WASHINGTON, DC
 DEPARTMENT OF THE NAVY HEADQUARTERS UNITED STATES MARINE CORPS 2 NAVY ANNEX WASHINGTON, DC 20380-1775 MCO 1520.28B PLS MARINE CORPS ORDER 1520.28B From: To: Subj: Ref: Encl: Commandant of the Marine Corps
Marine Officer Promotions: Incentivizing and Retaining Top Performers. Captain Michael J. Lorino
 Marine Officer Promotions: Incentivizing and Retaining Top Performers Captain Michael J. Lorino Conference Group 9 Major Ryan C. Leaman 20 February, 2009 1 Report Documentation Page Form Approved OMB No.
Redefining how Relative Values are determined on Fitness Reports EWS Contemporary Issues Paper Submitted by Captain S.R. Walsh to Maj Tatum 19 Feb 08
 Redefining how Relative Values are determined on Fitness Reports EWS Contemporary Issues Paper Submitted by Captain S.R. Walsh to Maj Tatum 19 Feb 08 1 Report Documentation Page Form Approved OMB No. 0704-0188
OPNAVINST A N13 6 Dec Subj: LATERAL TRANSFER AND REDESIGNATION OF OFFICERS IN THE NAVY
 DEPARTMENT OF THE NAVY OFFICE OF THE CHIEF OF NAVAL OPERATIONS 2000 NAVY PENTAGON WASHINGTON, DC 20350-2000 OPNAVINST 1210.5A N13 OPNAV INSTRUCTION 1210.5A From: Chief of Naval Operations Subj: LATERAL
Contemporary Issues Paper EWS Submitted by K. D. Stevenson to
 Combat Service support MEU Commanders EWS 2005 Subject Area Logistics Contemporary Issues Paper EWS Submitted by K. D. Stevenson to Major B. T. Watson, CG 5 08 February 2005 Report Documentation Page Form
Subj: ROLES AND RESPONSIBILITIES OF THE STAFF JUDGE ADVOCATE TO THE COMMANDANT OF THE MARINE CORPS
 DEPARTMENT OF THE NAVY HEADQUARTERS UNITED STATES MARINE CORPS 3000 MARINE CORPS PENTAGON WASHINGTON, DC 20350-3000 MCO 5430.2 JA MARINE CORPS ORDER 5430.2 From: Commandant of the Marine Corps To: Distribution
Study of female junior officer retention and promotion in the U.S. Navy
 Calhoun: The NPS Institutional Archive DSpace Repository Theses and Dissertations Thesis and Dissertation Collection 2016-03 Study of female junior officer retention and promotion in the U.S. Navy Mundell,
Who becomes a Limited Duty Officer and Chief Warrant Officer an examination of differences of Limited Duty Officers and Chief Warrant Officers
 Calhoun: The NPS Institutional Archive DSpace Repository Theses and Dissertations Thesis and Dissertation Collection 2006-06 Who becomes a Limited Duty Officer and Chief Warrant Officer an examination
ACTIVE DUTY CAREER RETENTION AND PERMANENT LIMITED DUTY (PLD) POLICY FOR COMBAT WOUNDED MARINES
 POLICY FOR COMBAT WOUNDED MARINES") ACTIVE DUTY CAREER RETENTION AND PERMANENT LIMITED DUTY (PLD) POLICY FOR COMBAT WOUNDED MARINES Date Signed: 5/17/2006 MARADMIN Active Number: 228/06 R 170730Z MAY 06 FM CMC WASHINGTON DC(UC) TO AL MARADMIN(UC)
ACTIVE DUTY CAREER RETENTION AND PERMANENT LIMITED DUTY (PLD) POLICY FOR COMBAT WOUNDED MARINES Date Signed: 5/17/2006 MARADMIN Active Number: 228/06 R 170730Z MAY 06 FM CMC WASHINGTON DC(UC) TO AL MARADMIN(UC)
The Affect of Division-Level Consolidated Administration on Battalion Adjutant Sections
 The Affect of Division-Level Consolidated Administration on Battalion Adjutant Sections EWS 2005 Subject Area Manpower Submitted by Captain Charles J. Koch to Major Kyle B. Ellison February 2005 Report
SECNAVINST B CMC (MPP-35) 7 Feb 2006
 7 Feb 2006") DEPARTMENT OF THE NAVY OFFICE OF THE SECRETARY 1000 NAVY PENTAGON WASHINGTON, DC 20350-1000 SECNAVINST 1412.9B CMC (MPP-35) SECNAV INSTRUCTION 1412.9B From: Secretary of the Navy Subj: MARINE CORPS LIMITED
DEPARTMENT OF THE NAVY OFFICE OF THE SECRETARY 1000 NAVY PENTAGON WASHINGTON, DC 20350-1000 SECNAVINST 1412.9B CMC (MPP-35) SECNAV INSTRUCTION 1412.9B From: Secretary of the Navy Subj: MARINE CORPS LIMITED
Report No. D February 9, Internal Controls Over the United States Marine Corps Military Equipment Baseline Valuation Effort
 Report No. D-2009-049 February 9, 2009 Internal Controls Over the United States Marine Corps Military Equipment Baseline Valuation Effort Report Documentation Page Form Approved OMB No. 0704-0188 Public
Acquisition. Air Force Procurement of 60K Tunner Cargo Loader Contractor Logistics Support (D ) March 3, 2006
 March 3, 2006") March 3, 2006 Acquisition Air Force Procurement of 60K Tunner Cargo Loader Contractor Logistics Support (D-2006-059) Department of Defense Office of Inspector General Quality Integrity Accountability Report
March 3, 2006 Acquisition Air Force Procurement of 60K Tunner Cargo Loader Contractor Logistics Support (D-2006-059) Department of Defense Office of Inspector General Quality Integrity Accountability Report
Closing the Barn Doors After the Cows Have Left: MCRC s Solution to the Recruiter Shortfall EWS Subject Area Manpower
 Closing the Barn Doors After the Cows Have Left: MCRC s Solution to the Recruiter Shortfall EWS 2005 Subject Area Manpower Closing the Barn Doors After the Cows Have Left: MCRC s Solution to the Recruiter
Department of Defense INSTRUCTION
 Department of Defense INSTRUCTION NUMBER 1320.13 October 30, 2014 USD(P&R) SUBJECT: Commissioned Officer Promotion Reports (COPRs) References: See Enclosure 1 1. PURPOSE. In accordance with the authority
DEPARTMENT OF THE NAVY HEADQUARTERS UNITED STATES MARINE CORPS 3000 MARINE CORPS PENTAGON WASHINGTON DC
 DEPARTMENT OF THE NAVY HEADQUARTERS UNITED STATES MARINE CORPS 3000 MARINE CORPS PENTAGON WASHINGTON DC 20350-3000 MCO 1130.80B MPP-20 MARINE CORPS ORDER 1130.80B From: Commandant of the Marine Corps To:
NAVAL POSTGRADUATE SCHOOL THESIS
 NAVAL POSTGRADUATE SCHOOL MONTEREY, CALIFORNIA THESIS THE EFFECTS OF INDIVIDUAL AUGMENTATION (IA) ON NAVY JUNIOR OFFICER RETENTION by Michael A. Paisant March 2008 Thesis Advisor: Second Reader: Samuel
NAVAL POSTGRADUATE SCHOOL THESIS
 NAVAL POSTGRADUATE SCHOOL MONTEREY, CALIFORNIA THESIS AN ANALYSIS OF MARINE CORPS DELAYED ENTRY PROGRAM (DEP) ATTRITION BY HIGH SCHOOL GRADUATES AND HIGH SCHOOL SENIORS by Murat Sami Baykiz March 2007
Comparison of Navy and Private-Sector Construction Costs
 Logistics Management Institute Comparison of Navy and Private-Sector Construction Costs NA610T1 September 1997 Jordan W. Cassell Robert D. Campbell Paul D. Jung mt *Ui assnc Approved for public release;
Aviation Logistics Officers: Combining Supply and Maintenance Responsibilities. Captain WA Elliott
 Aviation Logistics Officers: Combining Supply and Maintenance Responsibilities Captain WA Elliott Major E Cobham, CG6 5 January, 2009 Report Documentation Page Form Approved OMB No. 0704-0188 Public reporting
Chief of Staff, United States Army, before the House Committee on Armed Services, Subcommittee on Readiness, 113th Cong., 2nd sess., April 10, 2014.
 441 G St. N.W. Washington, DC 20548 June 22, 2015 The Honorable John McCain Chairman The Honorable Jack Reed Ranking Member Committee on Armed Services United States Senate Defense Logistics: Marine Corps
Information Technology
 December 17, 2004 Information Technology DoD FY 2004 Implementation of the Federal Information Security Management Act for Information Technology Training and Awareness (D-2005-025) Department of Defense
DEPARTMENT OF THE NAVY HEADQUARTERS UNITED STATES MARINE CORPS 2 NAVY ANNEX WASHINGTON, DC
 DEPARTMENT OF THE NAVY HEADQUARTERS UNITED STATES MARINE CORPS 2 NAVY ANNEX WASHINGTON, DC 20380-1775 MCO 1754.8A RA MARINE CORPS ORDER 1754.8A From: Commandant of the Marine Corps To: Distribution List
The Military Health System How Might It Be Reorganized?
 The Military Health System How Might It Be Reorganized? Since the end of World War II, the issue of whether to create a unified military health system has arisen repeatedly. Some observers have suggested
Battle Captain Revisited. Contemporary Issues Paper Submitted by Captain T. E. Mahar to Major S. D. Griffin, CG 11 December 2005
 Battle Captain Revisited Subject Area Training EWS 2006 Battle Captain Revisited Contemporary Issues Paper Submitted by Captain T. E. Mahar to Major S. D. Griffin, CG 11 December 2005 1 Report Documentation
Fiscal Year 2011 Department of Homeland Security Assistance to States and Localities
 Fiscal Year 2011 Department of Homeland Security Assistance to States and Localities Shawn Reese Analyst in Emergency Management and Homeland Security Policy April 26, 2010 Congressional Research Service
NAVAL POSTGRADUATE SCHOOL Monterey, California THESIS THE EFFECT OF MARINE CORPS ENLISTED COMMISSIONING PROGRAMS ON OFFICER RETENTION
 NAVAL POSTGRADUATE SCHOOL Monterey, California THESIS THE EFFECT OF MARINE CORPS ENLISTED COMMISSIONING PROGRAMS ON OFFICER RETENTION by William E. O Brien June 2002 Thesis Advisor: Co-Advisor: Janice
Enlisted-to-Officer Commissioning Programs Final Report
 Marine Corps Combat Development Command 3300 Russell Road Quantico, VA 22134-5130 Enlisted-to-Officer Commissioning Programs Final Report 9 August 2010 Distribution Statement A Approved for public release;
(c) DoD Instruction of 11 March 2014 (d) SECNAVINST D (e) CNO WASHINGTON DC Z Apr 11 (NAVADMIN 124/11)
 DoD Instruction of 11 March 2014 (d) SECNAVINST D (e) CNO WASHINGTON DC Z Apr 11 (NAVADMIN 124/11)") DEPARTMENT OF THE NAVY OFFICE OF THE CHIEF OF NAVAL OPERATIONS 2000 NAVY PENTAGON WASHINGTON DC 20350-2000 OPNAVINST 1320.6 N13 OPNAV INSTRUCTION 1320.6 From: Chief of Naval Operations Subj: 1,095-DAY
DEPARTMENT OF THE NAVY OFFICE OF THE CHIEF OF NAVAL OPERATIONS 2000 NAVY PENTAGON WASHINGTON DC 20350-2000 OPNAVINST 1320.6 N13 OPNAV INSTRUCTION 1320.6 From: Chief of Naval Operations Subj: 1,095-DAY
Report Documentation Page
 Report Documentation Page Form Approved OMB No. 0704-0188 Public reporting burden for the collection of information is estimated to average 1 hour per response, including the time for reviewing instructions,
Required PME for Promotion to Captain in the Infantry EWS Contemporary Issue Paper Submitted by Captain MC Danner to Major CJ Bronzi, CG 12 19
 Required PME for Promotion to Captain in the Infantry EWS Contemporary Issue Paper Submitted by Captain MC Danner to Major CJ Bronzi, CG 12 19 February 2008 Report Documentation Page Form Approved OMB
Financial Management
 August 17, 2005 Financial Management Defense Departmental Reporting System Audited Financial Statements Report Map (D-2005-102) Department of Defense Office of the Inspector General Constitution of the
a. To provide information, policy, and procedural guidance for U.S. Navy personnel
 PERS-443 BUPERS INSTRUCTION 1560.21F From: Chief of Naval Personnel Subj: LEGISLATIVE FELLOWS PROGRAM Ref: (a) DoD Instruction 1322.06 of 12 October 2016 (b) 10 U.S.C. (c) DoD Instruction 1000.17 of 30
White Space and Other Emerging Issues. Conservation Conference 23 August 2004 Savannah, Georgia
 White Space and Other Emerging Issues Conservation Conference 23 August 2004 Savannah, Georgia Report Documentation Page Form Approved OMB No. 0704-0188 Public reporting burden for the collection of information
POLICIES CONCERNING THE NAVAL POSTGRADUATE SCHOOL
 SECNAV INSTRUCTION 1524.2C DEPARTMENT OF THE NAVY OFFICE OF THE SECRETARY 1000 NAVY PENTAGO N WASHINGTON DC 20350 1 000 SECNAVINST 1524.2C ASN (M&RA) October 21, 2014 From: Subj: Ref: Encl: Secretary of
DEPARTMENT OF THE NAVY HEADQUARTERS UNITED STATES MARINE CORPS 3000 MARINE CORPS PENTAGON WASHINGTON, DC
 DEPARTMENT OF THE NAVY HEADQUARTERS UNITED STATES MARINE CORPS 3000 MARINE CORPS PENTAGON WASHINGTON, DC 20350-3000 MCO 1306.18A DMCS MARINE CORPS ORDER 1306.18A From: To: Subj: Commandant of the Marine
Application of a uniform price quality adjusted discount auction for assigning voluntary separation pay
 Calhoun: The NPS Institutional Archive Theses and Dissertations Thesis Collection 2011-03 Application of a uniform price quality adjusted discount auction for assigning voluntary separation pay Pearson,
Report No. D-2011-RAM-004 November 29, American Recovery and Reinvestment Act Projects--Georgia Army National Guard
 Report No. D-2011-RAM-004 November 29, 2010 American Recovery and Reinvestment Act Projects--Georgia Army National Guard Report Documentation Page Form Approved OMB No. 0704-0188 Public reporting burden
DOD Leases of Foreign-Built Ships: Background for Congress
 Order Code RS22454 Updated August 17, 2007 Summary DOD Leases of Foreign-Built Ships: Background for Congress Ronald O Rourke Specialist in National Defense Foreign Affairs, Defense, and Trade Division
United States Military Casualty Statistics: Operation Iraqi Freedom and Operation Enduring Freedom
 Order Code RS22452 Updated 9, United States Military Casualty Statistics: Operation Iraqi Freedom and Operation Enduring Freedom Summary Hannah Fischer Information Research Specialist Knowledge Services
Office of Inspector General Department of Defense FY 2012 FY 2017 Strategic Plan
 Office of Inspector General Department of Defense FY 2012 FY 2017 Strategic Plan Report Documentation Page Form Approved OMB No. 0704-0188 Public reporting burden for the collection of information is estimated
Demographic Profile of the Active-Duty Warrant Officer Corps September 2008 Snapshot
 Issue Paper #44 Implementation & Accountability MLDC Research Areas Definition of Diversity Legal Implications Outreach & Recruiting Leadership & Training Branching & Assignments Promotion Retention Implementation
Report No. D February 22, Internal Controls over FY 2007 Army Adjusting Journal Vouchers
 Report No. D-2008-055 February 22, 2008 Internal Controls over FY 2007 Army Adjusting Journal Vouchers Report Documentation Page Form Approved OMB No. 0704-0188 Public reporting burden for the collection
Department of Defense INSTRUCTION
 Department of Defense INSTRUCTION NUMBER 1334.02 December 7, 2012 USD(P&R) SUBJECT: Frocking of Commissioned Officers References: See Enclosure 1 1. PURPOSE. This Instruction: a. Reissues DoD Directive
Change 162 Manual of the Medical Department U.S. Navy NAVMED P Aug 2017
 Change 162 Manual of the Medical Department U.S. Navy NAVMED P-117 30 Aug 2017 To: Holders of the Manual of the Medical Department 1. This Change. Completely revises Chapter 7, Medical Service Corps. 2.
Opportunities to Streamline DOD s Milestone Review Process
 Opportunities to Streamline DOD s Milestone Review Process Cheryl K. Andrew, Assistant Director U.S. Government Accountability Office Acquisition and Sourcing Management Team May 2015 Page 1 Report Documentation
Independent Auditor's Report on the Attestation of the Existence, Completeness, and Rights of the Department of the Navy's Aircraft
 Report No. DODIG-2012-097 May 31, 2012 Independent Auditor's Report on the Attestation of the Existence, Completeness, and Rights of the Department of the Navy's Aircraft Report Documentation Page Form
Evolutionary Acquisition an Spiral Development in Programs : Policy Issues for Congress
 Order Code RS21195 Updated April 8, 2004 Summary Evolutionary Acquisition an Spiral Development in Programs : Policy Issues for Congress Gary J. Pagliano and Ronald O'Rourke Specialists in National Defense
Staffing Cyber Operations (Presentation)
") INSTITUTE FOR DEFENSE ANALYSES Staffing Cyber Operations (Presentation) Thomas H. Barth Stanley A. Horowitz Mark F. Kaye Linda Wu May 2015 Approved for public release; distribution is unlimited. IDA Document
INSTITUTE FOR DEFENSE ANALYSES Staffing Cyber Operations (Presentation) Thomas H. Barth Stanley A. Horowitz Mark F. Kaye Linda Wu May 2015 Approved for public release; distribution is unlimited. IDA Document
Report No. DODIG Department of Defense AUGUST 26, 2013
 Report No. DODIG-2013-124 Inspector General Department of Defense AUGUST 26, 2013 Report on Quality Control Review of the Grant Thornton, LLP, FY 2011 Single Audit of the Henry M. Jackson Foundation for
Department of Defense INSTRUCTION
 Department of Defense INSTRUCTION NUMBER 1332.32 December 27, 2006 USD(P&R) SUBJECT: Selective Early Retirement of Officers on an Active Duty List and the Reserve Active Status List and Selective Early
NAVAL POSTGRADUATE SCHOOL THESIS
 NAVAL POSTGRADUATE SCHOOL MONTEREY, CALIFORNIA THESIS VOLUNTARY EDUCATION OF ENLISTED SERVICE MEMBERS: AN ANALYSIS OF PROGRAM EFFECTS ON RETENTION AND OTHER OUTCOME MEASURES by Douglas L. Barnard Elizabeth
Comparison of. Permanent Change of Station Costs for Women and Men Transferred Prematurely From Ships. I 111 il i lllltll 1M Itll lli ll!
 Navy Personnel Research and Development Center San Diego, California 92152-7250 TN-94-7 October 1993 AD-A273 066 I 111 il i lllltll 1M Itll lli ll!ii Comparison of Permanent Change of Station Costs for
NAVAL POSTGRADUATE SCHOOL MONTEREY, CALIFORNIA THESIS
 NAVAL POSTGRADUATE SCHOOL MONTEREY, CALIFORNIA THESIS AN ANALYSIS OF FACTORS AFFECTING PROMOTION, RETENTION, AND PERFORMANCE FOR USMC OFFICERS: A GRADUATE EDUCATION PERSPECTIVE by Ronald J. Wielsma March,
Report No. D July 25, Guam Medical Plans Do Not Ensure Active Duty Family Members Will Have Adequate Access To Dental Care
 Report No. D-2011-092 July 25, 2011 Guam Medical Plans Do Not Ensure Active Duty Family Members Will Have Adequate Access To Dental Care Report Documentation Page Form Approved OMB No. 0704-0188 Public
Submitted by Captain RP Lynch To Major SD Griffin, CG February 2006
 The End of the Road for the 4 th MEB (AT) Subject Area Strategic Issues EWS 2006 The End of the Road for the 4 th MEB (AT) Submitted by Captain RP Lynch To Major SD Griffin, CG 11 07 February 2006 1 Report
An assessment of the educational and training needs of a Marine Naval Academy graduate
 Calhoun: The NPS Institutional Archive Theses and Dissertations Thesis Collection 2008-06 An assessment of the educational and training needs of a Marine Naval Academy graduate Styskal, Michael S. Monterey
The Security Plan: Effectively Teaching How To Write One
 The Security Plan: Effectively Teaching How To Write One Paul C. Clark Naval Postgraduate School 833 Dyer Rd., Code CS/Cp Monterey, CA 93943-5118 E-mail: pcclark@nps.edu Abstract The United States government
Veterans Affairs: Gray Area Retirees Issues and Related Legislation
 Veterans Affairs: Gray Area Retirees Issues and Related Legislation Douglas Reid Weimer Legislative Attorney June 21, 2010 Congressional Research Service CRS Report for Congress Prepared for Members and
On 10 July 2008, the Training and Readiness Authority
 By Lieutenant Colonel Diana M. Holland On 10 July 2008, the Training and Readiness Authority (TRA) policy took effect for the 92d Engineer Battalion (also known as the Black Diamonds). The policy directed
DEPARTMENT OF THE NAVY OFFICE OF THE SECRETARY NAVY PENTAGON WASHINGTON DC
 SECNAV INSTRUCTION 5420.199 DEPARTMENT OF THE NAVY OFFICE OF THE SECRETARY 1 000 NAVY PENTAGON WASHINGTON DC 20350-1000 SECNAVINST 5420.199 DUSN (M) From: Subj: Ref: Encl: Secretary of the Navy NAVAL INNOVATION
PERS 408. Information Systems Technician (IT) Distribution. For The. USN-USMC Spectrum Mgmt Conference. ITCS(SW) Walker, John (Jay) Enlisted Detailer
 Distribution. For The. USN-USMC Spectrum Mgmt Conference. ITCS(SW) Walker, John (Jay) Enlisted Detailer") PERS 408 Information Systems Technician (IT) Distribution For The USN-USMC Spectrum Mgmt Conference ITCS(SW) Walker, John (Jay) Enlisted Detailer DISTRIBUTION A: A: Approved for for public public release
PERS 408 Information Systems Technician (IT) Distribution For The USN-USMC Spectrum Mgmt Conference ITCS(SW) Walker, John (Jay) Enlisted Detailer DISTRIBUTION A: A: Approved for for public public release
Human Capital. DoD Compliance With the Uniformed and Overseas Citizens Absentee Voting Act (D ) March 31, 2003
 March 31, 2003") March 31, 2003 Human Capital DoD Compliance With the Uniformed and Overseas Citizens Absentee Voting Act (D-2003-072) Department of Defense Office of the Inspector General Quality Integrity Accountability
March 31, 2003 Human Capital DoD Compliance With the Uniformed and Overseas Citizens Absentee Voting Act (D-2003-072) Department of Defense Office of the Inspector General Quality Integrity Accountability
Panel 12 - Issues In Outsourcing Reuben S. Pitts III, NSWCDL
 Panel 12 - Issues In Outsourcing Reuben S. Pitts III, NSWCDL Rueben.pitts@navy.mil Report Documentation Page Form Approved OMB No. 0704-0188 Public reporting burden for the collection of information is
Military Health System Conference. Putting it All Together: The DoD/VA Integrated Mental Health Strategy (IMHS)
") 2010 2011 Military Health System Conference Putting it All Together: The DoD/VA Integrated Mental Health Strategy (IMHS) Sharing The Quadruple Knowledge: Aim: Working Achieving Together, Breakthrough Achieving
2010 2011 Military Health System Conference Putting it All Together: The DoD/VA Integrated Mental Health Strategy (IMHS) Sharing The Quadruple Knowledge: Aim: Working Achieving Together, Breakthrough Achieving
Small Business Innovation Research (SBIR) Program
 Program") Small Business Innovation Research (SBIR) Program Wendy H. Schacht Specialist in Science and Technology Policy August 4, 2010 Congressional Research Service CRS Report for Congress Prepared for Members
Small Business Innovation Research (SBIR) Program Wendy H. Schacht Specialist in Science and Technology Policy August 4, 2010 Congressional Research Service CRS Report for Congress Prepared for Members
Screening for Attrition and Performance
 Screening for Attrition and Performance with Non-Cognitive Measures Presented ed to: Military Operations Research Society Workshop Working Group 2 (WG2): Retaining Personnel 27 January 2010 Lead Researchers:
U.S. Military Casualty Statistics: Operation New Dawn, Operation Iraqi Freedom, and Operation Enduring Freedom
 U.S. Military Casualty Statistics: Operation New Dawn, Operation Iraqi Freedom, and Operation Enduring Freedom Hannah Fischer Information Research Specialist February 5, 2013 CRS Report for Congress Prepared
Subj: OFFICE OF DIRECTOR OF NATIONAL INTELLIGENCE MILITARY FELLOWSHIP PROGRAM
 DEPARTMENT OF THE NAVY OFFICE OF THE CHIEF OF NAVAL OPERATIONS 2000 NAVY PENTAGON WASHINGTON, DC 20350-2000 OPNAVINST 1500.83 N2/N6 OPNAV INSTRUCTION 1500.83 From: Chief of Naval Operations Subj: OFFICE
REPORT DOCUMENTATION PAGE
 REPORT DOCUMENTATION PAGE Form Approved OMB No. 0704-0188 Public reporting burden for this collection of information is estimated to average 1 hour per response, including the time for reviewing instructions,
Report No. D July 30, Data Migration Strategy and Information Assurance for the Business Enterprise Information Services
 Report No. D-2009-097 July 30, 2009 Data Migration Strategy and Information Assurance for the Business Enterprise Information Services Report Documentation Page Form Approved OMB No. 0704-0188 Public reporting
Forecasting U.S. Marine Corps reenlistments by military occupational specialty and grade
 Calhoun: The NPS Institutional Archive Theses and Dissertations Thesis Collection 2006-09 Forecasting U.S. Marine Corps reenlistments by military occupational specialty and grade Conatser, Dean G. Monterey,
Exemptions from Environmental Law for the Department of Defense: Background and Issues for Congress
 Order Code RS22149 Updated August 17, 2007 Summary Exemptions from Environmental Law for the Department of Defense: Background and Issues for Congress David M. Bearden Specialist in Environmental Policy
NOTICE OF DISCLOSURE
 NOTICE OF DISCLOSURE A recent Peer Review of the NAVAUDSVC determined that from 13 March 2013 through 4 December 2017, the NAVAUDSVC experienced a potential threat to audit independence due to the Department
February 8, The Honorable Carl Levin Chairman The Honorable James Inhofe Ranking Member Committee on Armed Services United States Senate
 United States Government Accountability Office Washington, DC 20548 February 8, 2013 The Honorable Carl Levin Chairman The Honorable James Inhofe Ranking Member Committee on Armed Services United States
SSgt, What LAR did you serve with? Submitted by Capt Mark C. Brown CG #15. Majors Dixon and Duryea EWS 2005
 SSgt, What LAR did you serve with? EWS 2005 Subject Area Warfighting SSgt, What LAR did you serve with? Submitted by Capt Mark C. Brown CG #15 To Majors Dixon and Duryea EWS 2005 Report Documentation Page
Navy Ford (CVN-78) Class Aircraft Carrier Program: Background and Issues for Congress
 Class Aircraft Carrier Program: Background and Issues for Congress") Order Code RS20643 Updated November 20, 2008 Summary Navy Ford (CVN-78) Class Aircraft Carrier Program: Background and Issues for Congress Ronald O Rourke Specialist in Naval Affairs Foreign Affairs, Defense,
Order Code RS20643 Updated November 20, 2008 Summary Navy Ford (CVN-78) Class Aircraft Carrier Program: Background and Issues for Congress Ronald O Rourke Specialist in Naval Affairs Foreign Affairs, Defense,
Developmental Test and Evaluation Is Back
 Guest Editorial ITEA Journal 2010; 31: 309 312 Developmental Test and Evaluation Is Back Edward R. Greer Director, Developmental Test and Evaluation, Washington, D.C. W ith the Weapon Systems Acquisition
DOD INSTRUCTION RETENTION DETERMINATIONS FOR NON-DEPLOYABLE SERVICE MEMBERS
 DOD INSTRUCTION 1332.45 RETENTION DETERMINATIONS FOR NON-DEPLOYABLE SERVICE MEMBERS Originating Component: Office of the Under Secretary of Defense for Personnel and Readiness Effective: July 30, 2018
The Landscape of the DoD Civilian Workforce
 The Landscape of the DoD Civilian Workforce Military Operations Research Society Personnel and National Security Workshop January 26, 2011 Bernard Jackson bjackson@stratsight.com Juan Amaral juanamaral@verizon.net
Manpower System Analysis Thesis Day Brief v.3 / Class of March 2014
 Calhoun: The NPS Institutional Archive Graduate School of Business and Public Policy (GSBPP) Thesis Day Programs and Documents 2014-03 Manpower System Analysis Thesis Day Brief v.3 / Class of March 2014
DEPARTMENT OF THE NAVY FOREIGN AREA OFFICER PROGRAMS
 SECNAV INSTRUCTION 1301.7 DEPARTMENT OF THE NAVY OFFICE OF THE SECRETARY I 000 NAVY PENTAGON WASHINGTON DC 20350 1 000 SECNAVINST 1301.7 DUSN (PPOI) 23 January 2013 From: Subj: Secretary of the Navy DEPARTMENT
Preliminary Observations on DOD Estimates of Contract Termination Liability
 441 G St. N.W. Washington, DC 20548 November 12, 2013 Congressional Committees Preliminary Observations on DOD Estimates of Contract Termination Liability This report responds to Section 812 of the National
ASAP-X, Automated Safety Assessment Protocol - Explosives. Mark Peterson Department of Defense Explosives Safety Board
 ASAP-X, Automated Safety Assessment Protocol - Explosives Mark Peterson Department of Defense Explosives Safety Board 14 July 2010 Report Documentation Page Form Approved OMB No. 0704-0188 Public reporting
NAVAL POSTGRADUATE SCHOOL THESIS
 NAVAL POSTGRADUATE SCHOOL MONTEREY, CALIFORNIA THESIS ANALYSIS OF THE MARINE CORPS EDUCATIONAL TIER SYSTEM by Andrew L. Holmes March 2013 Thesis Advisor: Second Reader: Elda Pema Mark J. Eitelberg Approved
Reserve Officer Commissioning Program (ROCP) Officer and Reserve Personnel Readiness
 Officer and Reserve Personnel Readiness") Reserve Officer Commissioning Program (ROCP) Officer and Reserve Personnel Readiness Jennifer Griffin and Michelle Dolfini-Reed April 2017 Cleared for Public Release DISTRIBUTION STATEMENT A. Approved
Reserve Officer Commissioning Program (ROCP) Officer and Reserve Personnel Readiness Jennifer Griffin and Michelle Dolfini-Reed April 2017 Cleared for Public Release DISTRIBUTION STATEMENT A. Approved
DEPARTMENT OF THE NAVY BOARD FOR CORRECTION OF NAVAL RECORDS 2 NAVY ANNEX WASHINGTON DC
 BOARD FOR CORRECTION OF NAVAL RECORDS 2 NAVY ANNEX WASHINGTON DC 20370-5100 BJG Docket No: 24-99 5 August 1999 From: To: Chairman, Board for Correction of Naval Records Secretary of the Navy Subj: CWO-2~~~~
Demographic Profile of the Officer, Enlisted, and Warrant Officer Populations of the National Guard September 2008 Snapshot
 Issue Paper #55 National Guard & Reserve MLDC Research Areas Definition of Diversity Legal Implications Outreach & Recruiting Leadership & Training Branching & Assignments Promotion Retention Implementation
RESERVE OFFICER PROMOTIONS PERS-80
 RESERVE OFFICER PROMOTIONS PERS-80 Scope & Purpose Scope: This brief covers the process for Active-Duty Officer regular statutory promotion boards as governed by SECNAVINST 1420.1 (series) Provides an
PROMOTION AMD REDUCTION
 CHAPTER 6 PROMOTION AMD REDUCTION PART A: GENERAL 6000 AUTHORITY 6001 DEFINITIONS 6002 REGULAR COMMISSIONED OFFICERS (MALE) 6003 REGULAR COMMISSIONED OFFICERS (WOMEN) 6004 REGULAR WARRANT OFFICERS 6005
Potential Savings from Substituting Civilians for Military Personnel (Presentation)
") INSTITUTE FOR DEFENSE ANALYSES Potential Savings from Substituting Civilians for Military Personnel (Presentation) Stanley A. Horowitz May 2014 Approved for public release; distribution is unlimited. IDA
INSTITUTE FOR DEFENSE ANALYSES Potential Savings from Substituting Civilians for Military Personnel (Presentation) Stanley A. Horowitz May 2014 Approved for public release; distribution is unlimited. IDA
Information Technology
 May 7, 2002 Information Technology Defense Hotline Allegations on the Procurement of a Facilities Maintenance Management System (D-2002-086) Department of Defense Office of the Inspector General Quality
Defense Health Care Issues and Data
 INSTITUTE FOR DEFENSE ANALYSES Defense Health Care Issues and Data John E. Whitley June 2013 Approved for public release; distribution is unlimited. IDA Document NS D-4958 Log: H 13-000944 Copy INSTITUTE