OVERVIEW AND SUMMARY 4 BACKGROUND OF ST. MARY MEDICAL CENTER SERVICE AREA 10 SUMMARY OF INDICATORS ST. MARY MEDICAL CENTER SERVICE AREA 11
|
|
|
- Raymond Barber
- 5 years ago
- Views:
Transcription


1 Table of Contents OVERVIEW AND SUMMARY 4 BACKGROUND OF ST. MARY MEDICAL CENTER SERVICE AREA 10 SUMMARY OF INDICATORS ST. MARY MEDICAL CENTER SERVICE AREA 11 Population Characteristics and Description with Comparison by County, State and U.S. 12 Secondary Data Sources 13 Areas of Concern Comparison for Northwest Indiana 14 Health Indicators Greater than State and National Average in Lake, Porter and Jasper Counties 15 ONLINE KEY INFORMANT SURVEY SUMMARY OF FINDINGS 16 DEATH, DISEASE AND CHRONIC CONDITIONS 20 Summary Comparison Chart of Leading Causes of Death , Area-Wide 22 Comparison Chart of Rate Gaps in Mortality in Lake and Porter Counties vs. U.S. 24 St Mary Medical Center Health Needs Assessment SURVEY OF THE COMMUNITY Key Findings in the Survey of Residents TOP HEALTHCARE PRIORITIES 27 Social Challenges 27 Health Challenges 28 Obesity 30 Weight Control 31 HEALTHCARE BARRIERS Community Health Needs Assessment Implementation Plan Difficulty Accessing Healthcare Services 32 Access to Mental Health Services 33 Cost of Prescription Medicine as a Barrier to Affordability 34 Access to Primary Care 35 As required by Internal Revenue Code 501 (r)(3) Explaining Why You Don't Have a Primary Care Doctor 36 Knowledge of Healthcare Name and Services EIN of Hospital Organization Operating Hospital Facility: 37 St. Mary Medical Center, Inc.: Date Approved by Authorized Governing Body: Community Foundation of Northwest Indiana, Inc. Board of Directors / June 15, 2016 St. Mary Medical Center, Inc. Board of Directors / June 29, 2016
2 HEALTHCARE EXPERIENCE 38 Healthcare Preferences 38 Service Locations 39 Getting Healthcare Information 41 Rating Healthcare Services 42 MANAGING YOUR HEALTH 43 Describe Your Health 43 Support for Addressing Health Needs 44 Use of Tobacco 44 Household Diagnosis and the Effect on Lifestyle 45 Prevalence of Preventive Procedures 47 Visiting the Emergency Room 50 Complementary Medicine 52 VIOLENCE 54 Victims of Violence 54 CANCER 56 Lowering Individual Risk 56 Cancer Screening 57 Needs of Cancer Patients 59 Improving Cancer Care 59 DEMOGRAPHICS OF SURVEY RESPONDENTS 61 Gender 61 Age 61 Ethnicity 62 Income 62 Number in Household 62 Health Insurance 63 Educational Level 63 APPENDIX I 64 Page 2 of 63
3 OVERVIEW AND SUMMARY The 2016 Community Health Needs Assessment (CHNA) examines the health status, behaviors and most pressing health needs of the community served by St. Mary Medical Center (SMMC). The study, which uses a combination of qualitative and quantitative data, follows a format similar to a 2013 assessment. Insights gained through this survey process inform the hospital s plans to address health disparities and bring about improvements in the health status of the community as outlined in its Implementation Plan. A CHNA is conducted every three years according to regulations pursuant to Section 501(r)(3) of the Internal Revenue Service Code. The 2013 assessment identified issues impacting the quality of life and health in the SMMC community establishing the baseline status for the service area. The 2016 report describes incremental changes toward fulfilling the goal of better health and an increased lifespan for area residents. Understanding health disparities, behaviors and barriers among residents was a key component of the CHNA. To this end, health status and behavior information was gathered alongside demographic statistical data to highlight the needs of the at-risk populations for preventable disease or injury within the service area of SMMC. In the 2016 assessment for SMMC, the local survey data identified the numerous areas that might lead to the pre-disposition of certain groups toward negative health outcomes. Increased access to preventive services for all SMMC service area residents was targeted as a key goal that would boost the quality of life and contribute to closing the gap in disparity of health of certain populations. Improved accessibility, as the 2013 study predicted, would also support the healthcare of the community by lowering costs, especially those associated with expensive care for late-stage disease, theoretically resulting from a lack of preventative care. In reality, by 2016, the complexity of access remained a key concern in the SMMC service area as social barriers including economic constraints due to a lack of training and job opportunities, lack of public transportation and affordable housing, persist, along with chronic elevated rates of substance abuse and obesity. Page 3 of 63
4 Areas of Opportunity Identified Through St. Mary Medical Center Service Area Assessment Unemployment and Job Training Nutrition, Physical Activity and Weight Not listed in last assessment Fruit/Vegetable consumption; Prevalence of obesity; Leisure time physical activity Top Focus Group concerns: Lack of nutrition; cost of healthy foods; food deserts; education Survey participants describe joblessness, and lack of training as number one social problem Survey concerns about personal motivation, responsibility and management, lack of nutrition education, access to healthy, affordable food, not enough support from community, schools, churches and employers Access to Health Services Cancer Difficulty Accessing Healthcare: Cost of prescriptions; cost of doctor visits Top Focus Groups Concern: Barriers to access (health literacy; poverty; insurance issues; cost of care; Medicaid; hours of operation; use of ER; transportation; language barrier Need for a local trauma center Cancer Death Rate Accessing Healthcare: Less difficult but certain persistent barriers include affordability of services, cost of prescriptions, doctor visits, co-pays and insurance; Language barrier limits awareness of resources Cancer Death Rate continuing major concern Incidents of violent crime---the statewide rate of 334 per 100,000 is eclipsed by the rate in Lake County at 403 per 100, remains very low in the Porter County (at 127 per 100,000), which is part of the SMMC service area. In the SMMC population, obesity (48.83 percent), diabetes (43.88 percent) 2 and cancer (41.27 percent) are perceived as the three most critical health issues, according to area residents and key community informants. Concern about heart health issues has dropped significantly in the SMMC communities. Northwest Indiana and Lake and Porter Counties have not been spared in the growth of cancer rates experienced across the state. Alcohol remains the most frequently abused substance in the SMMC service area, with an Adult Excessive Drinking Rate 3 that is higher in Porter County (18.1 percent) than either neighboring Lake County (15 percent) or Indiana (15.8 percent). 1 County rankings and roadmaps 2 Community Needs Health Survey Page 4 of 63
5 Key Informants join with community residents surveyed in Northwest Indiana to acknowledge the growth in heroin and opioid use, as well as the abuse of prescription painkillers. The Substance Abuse Priority Score for Porter County at 1.76 is higher than both Lake County (1.46) and Indiana at Supporting evidence for this includes visits to ERs across the state for pain relief. In the SMMC service area, the survey puts the number of pain relief visits to the ER at 15.58, significantly higher than the percentage overall in the current Community Health Needs Survey of Northwest Indiana, at 8.9 percent. Page 5 of 63
6 Areas of Opportunity Identified Through St. Mary Medical Center Service Area Assessment Heart Disease & Stroke Heart Disease Death Rate Stroke Death Rate Heart Disease Rate Stroke Death Rate persistent major concerns Diabetes Diabetes Mellitus Death Rate Diabetes Death Rate major problem Kidney Disease now viewed as Chronic Kidney Disease Kidney Disease Rate moderate problem by Key Informants Family Planning Injury and Violence Prevention Maternal, Infant & Child Health Oral Health Substance Abuse Tobacco Use Teen Births Firearm-Related Death Rate Homicide Rate Violent Crime Victimization Lack of Prenatal Care Low Birthweight Infant Mortality Recent Dental Visits Top Focus Group Concern: Prevalence of Drug Use; Easy Access/Parental Complacency; Limited Treatment Programs; Inadequate Funding Current Smokers Teen Births lining up with Indiana and U.S. numbers Violence and Firearm-related death rate improve slightly, still a problem Prenatal Care, Low Birth Weight, Premature Birth improve, within range or better than Indiana and U.S. Higher percentage of adults getting annual check-ups Alcohol abuse chronic NWI problem and substance abuse grows; lack of facilities and funds for treatment; abuse of prescription painkillers especially in Porter County Response to cessation and education as smoking rate declines Although about one-third of the CHNA population (32.05 percent) share a concern about mental illness as a community health issue, percent in the SMMC service area population say they don t need mental health services. But in a question about conversations with physicians, it appears there is an opportunity for more discussion on this topic. When asked whether physicians had talked about lifestyle changes that would improve health, percent of the SMMC service area residents indicated that these discussions had occurred and another 51 percent said their physicians had discussed risk factors for chronic disease. However, only percent of residents reported that their physician had discussed mental health needs with them. Page 6 of 63
7 Overall, individuals who were surveyed for the 2016 CHNA gave high marks to the medical community for addressing issues related to achieving better health. Porter County maintains a greater percentage of population that has insurance, is more likely to get prenatal care, has a better ratio of physicians to community members, more homeowners and fewer people who smoke than Lake County, Indiana. In some key areas there has been improvement in mortality rate from firearm-related incidents, kidney and heart disease, respiratory disease and infant death rate, even when Lake and Porter Counties are averaged together, compared to the CHNA in the SMMC service area in The rate of age-adjusted death from cancer in the SMMC communities in the 2013 report was high at 199.1, however, in the secondary source data used in this 2016 report, when Lake County cancer deaths (186.5) are averaged with Porter County cancer deaths (174.4) that figure is 180.4, still significantly lower than three years ago. Smoking has dropped dramatically in the survey sample with about 7.5 percent of participants in the SMMC area acknowledging that they are still smoking. That number is down significantly from the 2013 CNHA report, which showed smokers at a 20.1 percent level in the SMMC service area. But the benchmark statistics on smoking in both Porter and Lake Counties are more in line with the 20 percent charted three years ago: The current Indiana Indicators report tracks smoking rates of 22.9 percent in Indiana, 18.9 percent in the U.S., 19 percent in Porter and 23.8 percent in Lake. The unemployment rate is an important health statistic according to the Community Health Needs Survey 2016, in which about 55 percent of survey respondents identified the lack of job opportunities as the number one social issue in the community. Those surveyed in the SMMC service area strongly agreed with the larger CHNA group, percent of them said joblessness was their top concern. Today s unemployed rate is higher in both Lake (7.8 percent) and Porter (6.6 percent) Counties than in Indiana (5.5 percent) and the U.S. (5.1), and survey results show there is a strong belief this affects the health of the community. Affordable housing ranked second on the list of social concerns in the SMMC area, which, in the Porter County area may be squeezed by socioeconomic factors including a percent rate of homeowner occupied units, more than Indiana at 69.5 percent and Lake County at 68.9 percent. Page 7 of 63
8 Other positive findings: Individuals in the SMMC service area take health education seriously and are having preventive procedures more often than ever before. About 86 percent of those surveyed had a blood pressure screening and 76 percent reported screening for cholesterol on a regular basis. Flu shots (65.42 percent) and diabetes screening (62.88 percent) are at record levels in SMMC communities. Residents surveyed also reported mammograms at percent with for pap smears. The correlation relationship between education and healthcare needs was reported in responses to multiple survey questions that went deeper into health management issues in the 2016 CHNA. When asked about the prevalence of obesity in the community, residents overwhelmingly cited (77.29 percent) personal responsibility---unhealthy diet and exercise habits---but 46 percent added that a lack of knowledge about nutrition was also undermining weight control. More and better information about cancer care including individual counseling and nutritional and diet therapy were two out of three top choices, which SMMC study participants ranked as very valuable, further establishing the link to obesity as a root cause of other health problems. The importance of education throughout a range of issues was underlined in research released last year by Lake Area United Way (LAUW) and United Way of Porter County (UWPC). Starting in May 2015, LAUW and UWPC, using the Harwood model for Community Conversations, hosted dozens of small groups across Northwest Indiana, with more than 500 participants. Two of the five major concerns that emerged from the study were Lack of a comprehensive, sufficient support system that meets the educational, emotional and social development needs of children and youth, followed by a Lack of strong, quality educational opportunities for all children, regardless of the community they live in or their socioeconomic status. 4 Also on the educational theme, respondents in the SMMC service area, reported getting healthcare information most often from their doctor (80.74 percent) and more than 85 percent said they have a primary care doctor. (About 36 percent of those surveyed who do not have a physician said that the reason was because they did not need one.) While there was no direct comparison made in the 2013 assessment, 73.8 percent of adults in the SMMC service area 2013 assessment were determined to obtain a specific source of ongoing medical care. They surpassed that goal. 4 Let s Talk Regional Report, LAUW and UWPC, 2015: Page 8 of 63

9 BACKGROUND OF ST. MARY MEDICAL CENTER SERVICE AREA Crown Point Hobart Portage Valparaiso Valparaiso Gary Lake Station Merrillville Gary St. Mary Medical Center, located in Lake County, Indiana, but drawing population from nearby Porter County as well, has a higher demographic profile compared with the overall CNHA 2016 report. For example, percent of the SMMC survey respondents reported a household income of more than $75,000, compared to the entire CHNA survey population, which has fewer households (33.40 percent) at that income level. High school graduation rates in Porter County are way above both state and national rates at 91.6 percent. To better understand the unique needs of the SMMC service area, responses to a survey were sorted by the zip codes from which the hospital draws 80 percent of its patients. A survey of area residents was conducted online and a concerted effort was made to also collect responses via paper copies, which were made available in English and Spanish to individuals who were most likely to experience barriers to good health. (The 2013 CHNA survey was conducted by telephone and did not put a particular focus on targeting individuals who were likely to experience health barriers.) Page 9 of 63
10 SUMMARY OF INDICATORS ST. MARY MEDICAL CENTER SERVICE AREA Poor cardiovascular health and stroke have traditionally been the leading cause of death in Lake and Porter Counties and in this survey, though heart disease is still prevalent; it is no longer the killer it once was. The death rate from cancer also has declined since the 2013 CHNA report for SMMC, when the area had a cancer mortality rate at Though heart and cardiovascular disease have slowed in both counties, Porter County has had the most significant improvement with heart disease death rate at and 35.0 rate of death from stroke, better than Indiana in both heart disease (181.9) and stroke at 41.7 percent. Porter County at 46.6 shows a lower death rate from respiratory disease than Indiana at 61.1 and less deaths from cirrhosis and liver disease (10.7 percent) versus Indiana s total 18.7 percent. On the other hand, Porter County had a higher rate of suicide at 16.6 percent than Indiana at 14.4 percent or Lake County at 14 percent. The rate of unintentional injury death in Porter County has grown significantly to 48.2 percent dwarfing Lake County (32.8 percent) and the state, which reports a 45.1 percent rate of death. The rate for Alzheimer s Disease (36.8 percent) in Porter County has also picked up above Lake County (21.5 percent) and Indiana (29.4 percent) as a cause of death. Page 10 of 63
11 Population Characteristics and Description with Comparison by County, State and U.S. Social Determinants of Health Lake Porter Indiana U.S. Population 494, ,168 6,619, million Median Household Income $49,035 $64,530 $48,737 $53,482 Homeowner Occupied Units 68.90% 77.40% 69.50% N/A High School graduation rates 87.00% 91.60% 87.60% 86.30% Unemployment Rate 7.80% 6.60% 5.50% 5.10% Children not insured 7.80% 6.50% 8.00% 7.10% Adults not insured 19.90% 15.50% 19.30% 13.30% Poverty below 100% FPL 18.20% 11.40% 15.50% 15.60% Prenatal Through 18 Years Teen Births Sought prenatal care during first trimester 68.20% 75.80% 67.50% 69.50% Smoked throughout pregnancy 10.20% 10.50% 15.10% 9.10% Breastfeeding rate 72.20% 83.50% 79.30% 79.20% Low Birth Weight 8.40% 6.80% 7.90% 8.00% Preterm 9.80% 8.80% 9.70% 11.40% Modifiable Health Risks Adult Obesity 35.50% 30.60% 31.40% 27.80% Diabetes Prevalence 12.60% 9.00% 10.20% 9.50% Physical inactivity 29.70% 27.00% 27.90% 26.20% Access to exercise opportunities 91.00% 82.00% N/A N/A Substance Abuse Substance Abuse Priority Score N/A Adult Excessive Drinking (Binge) 15.00% 18.10% 15.80% N/A People who smoke 23.80% 19.00% 22.90% 18.90% Percentage of pregnant women who smoke 13.00% 9.70% 15.10% N/A Access to Care Adults who visit the dentist once per year 64.70% 68.90% 68.10% 65.40% Residents could not see a doctor due to cost 15.30% 14.00% 15.90% 16.60% Physician to resident ratio *IUN study data has been updated with information from Centers for Disease Control and Prevention (CDC). National Center for Health Statistics. VitalStats. County Health Ranking (2015) Lake County. County Snapshot. Retrieved from Page 11 of 63
12 Perceptions about Northwest Indiana and Lake County within the community are changing in terms of consequences, especially in categories that may be modified like heart health or respiratory disease. The growing concern about cancer in the resident surveys indicates statistical increase, but also reflects frustration with a disease that remains beyond the reach of lifestyle changes or other options that directly affect its outcome and progression. Secondary Data Sources A study done in of Lake, Porter and Jasper Counties health markers produced notable results in Northwest Indiana. In spite of economic and racial diversity, the three counties struggled with modifiable healthcare issues at similar rates. The number of uninsured; those women seeking prenatal care in the first trimester; adults who are overweight or may have diabetes, and adult excessive drinking do not vary as widely as might be expected in counties where the average income is disparate. Poverty-stricken or prosperous, urban or rural, Hoosiers do not typically take good care of their health. Even when residents have access to exercise opportunities, as in Lake and Porter Counties, the percentage of obesity, for example, stays above 30 percent and the rate for physical inactivity is also static at 29.7 percent for Lake County and 27 percent for Porter County. When comparing the results of the SMMC service area to the demographic concerns that emerge from other studies and reports, there is little evidence that residents feel burdened by poor health. The numbers of those survey participants who need treatment for a chronic disease in SMMC, for instance (42.59 percent), seldom suggest that they are not getting the help they need (1.39 percent). Among those who live in the SMMC area, or who have illnesses, or have others in their households who have been diagnosed, say that the condition is not automatically an impediment to their lifestyle. In cases of physical conditions such as cancer or heart disease, major impairment to everyday life is experienced by about 30 percent of those affected. Depression causes the most disruption in percent of cases. 5 Indiana University Northwest Study by NURS B230 Nursing Students: Kellie Brooks, Chelsea Buchanan, Emily Devine, Alexis Magnant, Victoria Zepeda, with Crystal Shannon PhD, MBA, RN (Faculty) Page 12 of 63
13 Areas of Concern Comparison for Northwest Indiana NWI Indiana Children, 0-17 years live in poverty 24.31% 21.00% Unemployment rate is higher than Indiana or U.S. 6.9% (approx.) 5.50% Population receiving SNAP benefits higher than Indiana or U.S % 10.70% Access to primary care services is lower than Indiana or U.S % 65.00% Preventable hospital events - Medicare Enrollees higher than Indiana or U.S * 229.0* Many of these demographic areas of concern are also identified as major or minor problems by Key Informants in Northwest Indiana communities and survey participants in the SMMC service area. The local survey population was asked to make choices about possible solutions. For example, a shortage of doctors in the certain areas of Northwest Indiana was not perceived by residents to be a major problem, according to the community survey, though it was recognized by some Key Informants. There were numerous complaints in the SMMC area about difficulties and delays when trying to see a physician, which could be a symptom of a shortage of providers that is not yet recognized. About 75 percent of those who participated in the overall CNHA 2016 feel that the healthcare services provided locally are good to excellent. The violence indicator reads two ways as well. Though the rate for violent crime may be higher in Lake County and lower in Porter County than that of the average for the state and the country, the participants in the survey in the SMMC service area indicated they are personally unaffected by domestic, street, gang or criminal violence in the past five years. About 95 percent say that they have not been a victim in the SMMC communities and that number drops only one point to 94 percent when the entire Northwest Indiana survey area is asked the same question. Page 13 of 63
14 Health Indicators Greater than State and National Average in Lake, Porter and Jasper Counties Diabetes - Adult and Medicare High Cholesterol - Adult and Medicare Heart Disease - Medicare High Blood Pressure - Medicare Obesity GC/Chlamydia Infections (Lake County only) HIV Prevalence (Lake County only) Cancers: Breast, Cervical, Colon-Rectal, Prostate Lung (Porter and Jasper Counties only) Low Birth Weight (Lake County only) Mortality Premature Death Heart Disease Stroke (Jasper County only) Unintentional Injury (Porter and Jasper Counties) MVA (Jasper County only) Pedestrian Accidents (Lake County only) Homicide (Lake and Porter Counties) Suicide (Porter County only) Infant Mortality (Lake County only) *IUN study used data from these sources: Centers for Disease Control and Prevention (CDC). (2015). Lake County, IN retrieved from Centers for Disease Control and Prevention (CDC). (2015). Jasper County, IN retrieved from Centers for Disease Control and Prevention (CDC). National Center for Health Statistics. VitalStats. National Center for Health Statistics, final mortality data, and period linked birth/infant death data, 1995-present. Retrieved November 5, 2015 from County Health Ranking (2015) Lake County. County Snapshot. Retrieved from Page 14 of 63
15 ONLINE KEY INFORMANT SUMMARY OF FINDINGS Primary research for this assessment used data obtained through an online survey of Key Informants recommended by representatives from Franciscan Alliance, Methodist Hospitals and Community Healthcare System. The 166 potential participant list included community leaders, physicians, public health representatives and professionals, social service providers and others qualified by knowledge, work experience and network to identify the chief concerns of the communities in which they work. Professional Research Consultants, Inc. (PRC) first contacted the key informants by to provide a link to the online survey and reminder s were sent to increase percentage of response. Eventually 64 key community stakeholders provided qualitative information for the survey (Appendix I). In the 2013 survey of Key Informants, focus groups were held to solicit this input from community leaders. Using the online format, we were able to solicit input from more community leaders which we felt provided additional value in gathering these key insights. 10 Major of Health Issues Identified by Key Informants 2016 Major Health Issue Problem Substance Abuse 56.30% Nutrition, Physical Activity and Weight 52.50% Diabetes 52.50% Mental Health 50.00% Heart Disease and Stroke 49.20% Cancer 45.20% Tobacco Use 40.30% Dementia/Alzheimer's Disease 39.70% Injury and Violence 39.30% Infant and Child Health 27.60% Page 15 of 63
16 Online Key Informant Survey Participation Key Informant Type Number Invited Number Participating Community/ Business Leader Other Health Provider 36 8 Physician 30 7 Public Health Representative 16 6 Social Services Provider The 40 organizations that participated and contributed to the key informant report are listed in Appendix I. Minority populations represented: African-Americans, American Indians, Asians, children, disabled, elderly, ethnic minorities, Hispanics, homeless, LGBT individuals, Middle Eastern descent, mixed race and undocumented residents. Medically underserved populations represented: children, disabled, elderly, ethnic minorities, those with HIV, homeless, LGBT individuals, low income residents, Medicare/Medicaid recipients, the mentally ill, non-english speaking residents, single parents, substance abusers, undocumented residents, uneducated residents, the uninsured/underinsured, those living in food deserts, veterans, women, young adults and young mothers. The Key Informants Report differed significantly from the 2013 Community Needs Assessment in certain critical areas. Access to care had been the dominant theme in the report three years ago, but now community and government leaders are focused on substance abuse. Although alcohol and binge-drinking remain the most problematic of substances (59 percent), the Key Informants cited the growing abuse of heroin and prescription drugs. As one physician on the panel said, Patient compliance and refusal, access to appropriate programs and access to behavioral healthcare professionals, contribute to the denial of the problem and the stigma attached to it. Diabetes and lifestyle choices that contribute to obesity in the Northwest Indiana area continue to challenge residents, as well as heart disease and cancer. Concerns about Alzheimer s Disease and dementia were identified as growing problems for the local population and, while access to care still appears on the list of Key Informant discussion topics, it was not as much of a priority as it was three years ago. Page 16 of 63
17 On the subject of nutrition, physical activity and weight, the Key Informants expressed frustration that the most poverty-stricken areas of Northwest Indiana are also food deserts. Communities with no safe place to walk or exercise. Shortage of fresh foods, vegetables and fruits in some areas, cost of fresh foods, said a public health representative and Key Informant. That concern was repeated over and over again by physicians, social workers and business leaders who participated in the online discussion. Obesity is the major issue in Northwest Indiana communities and the levels are unprecedented, as one doctor reported. Key Informants, who also identified diabetes as another major issue with links to obesity, raised the matter of a lack of endocrinologists and other healthcare providers who could help manage diabetes as a cause for concern. A social services provider commented that there are approximately 499,200 adults who have diabetes in Indiana and another 289,000 adults who are pre-diabetic. Mental illness, cited by 50 percent of the Key Informants, is another major problem in the Northwest Indiana communities that they feel has been ignored. There is a lack of services, facilities and providers in the mental health field and many trained professionals are unwilling to work in Northwest Indiana for wages that are often substandard. One health provider said, We are seeing an increasing number of young children with significant mental health issues. Insurance coverage for mental health issues is viewed as inadequate and the stigma attached to treatment for depression or substance abuse pushes families into avoidance and denial. Cancer is at epidemic proportions, according to the Key Informants. One Key Informant social services provider said that about 2.4 million Indiana residents, or two in five people now living in Indiana will eventually develop cancer. Key Informants also discussed environmental issues in Northwest Indiana related to lung cancer, especially air quality. Page 17 of 63
18 Aging Baby Boomers present a special challenge for healthcare providers in Northwest Indiana and the incidence of dementias, including Alzheimer s Disease, is constantly growing. One community leader said, There is very little knowledge of the disease in the community and even less knowledge of where to go to get treatment. In some cultures, it is not discussed. In the middle tier of health issues considered important by Key Informants is a culture of violence pervasive in some Northwest Indiana communities. Also, the many issues tied to poverty including infant mortality, HIV/AIDS and dental care. Hearing and vision problems and the vulnerabilities of senior residents were some other topics that were less urgent to Key Informants, but not less important. Page 18 of 63
19
20 Death, Disease and Chronic Conditions Looking at the top five causes of death in the St. Mary Medical Center service area the landscape has changed from 2013 to Lake and Porter Counties in Indiana have shown improvement in four key areas of disease including heart disease and cancer. There are fewer deaths from kidney conditions, firearms, stroke and diabetes. The gains, especially in areas of preventable disease, are encouraging because direct links to unhealthy lifestyle behaviors present the greatest opportunity to improve the health of the community as a whole through lifestyle modification. There are a range of influences and behaviors driving the decline in firearm-related incidents and homicide. Other mortality outcomes, may also prove to respond to behavior modification and social pressure. Awareness of the dangers of certain types of prescription medicine has come to light recently. Physicians are increasingly careful of drugs for pain relief that are addictive. There is growing attention paid to the terrible consequences of mental illness, a primary cause of an increase in rates of suicide and drug and alcohol-related deaths. The high number of deaths attributed to Alzheimer s Disease in Porter County contributed to the rise in the number of fatalities from these mental illnesses in Northwest Indiana as a whole, bringing the Alzheimer s Disease mortality rate on par with Indiana, which is higher than the national average. A similar rise in suicides in Porter County, took the self-inflicted death rate up past the U.S. average as well. Porter County mortality rates helped to improve Northwest Indiana averages in categories of firearm-related deaths, homicides, cancer, infant mortality, stroke and chronic lower respiratory disease, however. Improved mortality in the face of a daunting statistical pattern offers opportunities for Northwest Indiana to enact modifications and lifestyle changes in all communities that could produce better outcomes in the future. Awareness and achievement can build progress in healthcare. Page 20 of 63
21 SUMMARY COMPARISON CHART OF LEADING CAUSES OF DEATH, AREA-WIDE Age-Adjusted Death Rate LC-PC AVG Leading Causes of Death SMMC Service Area 2013 Comparison to Previous Assessment Indiana Compared to Indiana US Compared to US Healthy People 2020 Diseases of the Heart Malignant Neoplasms (Cancers) Chronic Lower Respiratory Disease (CLRD) N/A Cerebrovascular Disease (Stroke) Diabetes Mellitus ** Unintentional Injuries Kidney Disease N/A Firearm-Related Homicide/Legal Intervention Alzheimer's Disease N/A Pneumonia/Influenza N/A Intentional Self-Harm (Suicide) Motor Vehicle Crashes Cirrhosis/Liver Disease 10.7* Drug-Induced making progress work to do *most recent cirrhosis data from Duneland Health Council includes, Lake, Porter and LaPorte Counties **percentage revised down since 2013 report Page 21 of 63
22 COMPARISON CHART OF RATE GAPS IN MORTALITY IN LAKE AND PORTER COUNTIES VS U.S. Age-Adjusted Death Rate Lake County Porter County County Average Indiana U.S. county average% GAP (+/- fed rate) Homicide/Legal Intervention % Firearm-Related % Kidney Disease % Diabetes Mellitus % Malignant Neoplasms (Cancers) % Intentional Self-Harm (Suicide) % Cerebrovascular Disease (Stroke) % Pneumonia/Influenza N/A % Drug-Induced 16 N/A % Infant Mortality % Diseases of the Heart % Alzheimer's Disease % Unintentional Injuries % Chronic Lower Respiratory Disease (CLRD) % Cirrhosis/Liver Disease 10.7* % Motor Vehicle Crashes 6.5 N/A % county average improves on US rate sis data from Duneland Health Council includes, Lake, Porter and LaPorte Counties Mortality - County Average vs. U.S. / Gaps 2013/tables/1tabledatadecoverviewpdf/table_1_crime_in_the_united_states_by_volume_and_rate_pe r_100000_inhabitants_ xls#overview Page 22 of 63
23 Page 23 of 63
24
25 Key Findings in the Survey of Residents A primary source of information for the Community Health Needs Assessment was obtained through online and printed questionnaires completed by 1738(+) individuals who live in 41 Northwest Indiana and 4 Illinois zip codes. The 35- question survey covered key indicators such as the significance of social problems ranging from affordable housing to public safety; health concerns including substance abuse and dental health; reasons for obesity; difficulties of accessing medical and mental health services; exposure to physical violence; impediments to weight loss; use of non-traditional therapies and nutritional supplements; cancer care and education; sources of health information in general and demographic questions. The results were then sorted by zip code to examine the unique responses of each hospital s service area. Although some results in the St. Mary Medical Center ninezip code service area tracked similarly to the larger Northwest Indiana group, there were also marked differences. The 2016 CHNA was conducted jointly by Community Healthcare System, Methodist Hospitals and Franciscan Alliance. The partnership of the three largest not-forprofit health systems in the circumference of the Northwest Indiana and south suburban Chicago area promoted more efficient data collection; a broad platform for comparison of health needs within a diverse geographic and demographic population, and a method that eliminated overlapping demands on residents and communities for duplicate information. The survey results from the broader geographic area do share thematic characteristics, but the St. Mary Medical Center service area has its own unique components based on location, density of population, socioeconomic diversity and county public health infrastructure. Page 25 of 63
26 TOP HEALTHCARE PRIORITIES Social Challenges As part of this survey, we asked area residents to tell us what they considered to be the most pressing social problems in their community. What do you feel are the 3 most important social problems in your community? St. Mary Medical Center Needs Survey 2016 Community Health Needs Survey 2016 Lack of Employment Opportunities 57.96% 54.70% Affordable Housing 40.69% 33.63% Lack of Education/ Job Training 36.64% 35.55% Public Transportation 34.98% 31.99% Poor Health of Residents 28.23% 27.44% Pollution (Clean, safe air quality) 27.48% 23.99% Public Safety 22.67% 22.83% Violence 20.57% 22.94% Poverty 19.37% 18.91% Hunger (Food Insecurity) 11.26% 8.35% Other 0.00% 10.68% Examining the responses of the survey participants who reside in the SMMC service area revealed the impact of lack of job opportunities and affordable education. Porter County has more new housing construction and single family dwellings than other service areas and home ownership in the SMMC communities is about 78 percent. The third-ranking concern is lack of education and job training. Ironically healthcare providers are one of the largest sectors of employers in Northwest Indiana with more than 65,000 jobs in the tri-county area. Nursing programs have had difficulty keeping up with the demand for trained graduates. Page 26 of 63
27 The lack of public transportation hurts newer communities as well as the mature neighborhoods in Lake County because without transportation, job options may be limited. But the SMMC service area residents are also concerned about the air quality and poor health in general. In other survey questions, it becomes clear that the communities in the SMMC area have a keen awareness of the prevalence and problems of obesity and poverty, though they may not experience those issues themselves. Health Challenges What do you feel are the 3 most important health problems in your community? St Mary Medical Center Needs Survey 2016 Community Health Needs Survey 2016 Obesity 48.83% 47.24% Diabetes 43.88% 43.28% Cancer 41.27% 43.28% Heart Disease/Stroke 34.94% 36.18% Substance Abuse (alcohol, drugs) 30.12% 28.21% Mental Health 29.44% 32.05% Smoking and Tobacco 27.79% 25.54% Breathing Problems 18.43% 20.48% Asthma 11.28% 10.30% Dental/Oral Health 4.95% 7.56% Injuries 1.93% 2.97% Hearing/Vision Problems 1.65% 3.20% Infant Mortality 1.10% 1.51% HIV/ AIDS 0.55% 1.34% Other 0.00% 2.56% Page 27 of 63
28 The five top health concerns for the SMMC have changed since the Community Health Needs Assessment in 2013, though all medical priorities mentioned were among the top 10. The top five health problems according to study participants are: Obesity, Diabetes, Cancer, Heart Disease and Stroke, and Substance Abuse. Mental Health remained in the middle of the priorities list, but Injuries and Violence Prevention dropped as did concerns about respiratory health. The accidental injury death rate has grown according to secondary data, yet it is not considered as much of a threat. Asthma and other respiratory conditions are perceived as less of a problem than the diseases have been in reality, as noted in the 2013 CHNA. Looking at the numbers from the 2013 CHNA in the larger population and SMMC, obesity has grown in reality as well as in the minds of community members. Likewise, the high infant mortality rate of a few years ago, along with low birth weight and prenatal healthcare, is having much less impact on those surveyed in the SMMC communities than in the previous CHNA. Hearing and vision issues and HIV/AIDS, which had a larger presence in the study a few years ago, have dwindled, but concerns over mental health (stress, depression) and substance abuse are working their way to the top and are major problems for the population in the SMMC service area. Page 28 of 63
29 Obesity What do you feel are the 3 top reasons why obesity is an issue in your community? St. Mary Medical Center Needs Survey 2016 Community Health Needs Survey 2016 Unhealthy diet and exercise habits 77.29% 71.29% Lack of knowledge about nutrition 46.04% 46.76% Lack of access to healthy and affordable food (fruits and vegetables) 44.82% 37.65% Lack of access to low cost weight loss programs 37.35% 29.71% Healthy habits not promoted/supported in the community, schools 26.68% 27.82% Lack of recreation/physical activity programs 21.19% 21.53% Lack of access to parks and places to exercise 12.20% 10.76% Lack of support from employers 11.74% 10.53% Safety reasons (personal/traffic/neighborhood) 9.60% 8.35% Obesity is not a problem in my community 6.55% 6.35% Lack of support from hospitals and medical professionals 6.40% 5.94% Other (please specify) 0.00% 7.47% Responses to the questions about obesity speak to a perception of universal sentiment of personal accountability. More than 70 percent of the time, respondents attributed the obesity problem to unhealthy diet and exercise habits. There is enough blame to go around with a high frequency of answers included a concern about the general lack of nutrition knowledge within the SMMC community, also the difficulty and expense of healthy foods like fresh fruit and vegetables. (Access is to healthy food is less of a concern in adjacent communities studied in the Community Health Needs Survey.) Residents of the SMMC area worry more about lack of access to low cost weight programs than the general population who participated in the area-wide survey. The residents of the SMMC area feel that to a certain extent health programs are not supported by the community and employers. They also believe there are not enough outlets for exercise. But, as with the overall survey, residents have the least complaint with healthcare providers, hospitals and medical professionals. Page 29 of 63
30 Weight Control Obesity appears to be impacting about the same number of households in the SMMC service area as in the larger study of Northwest Indiana, according to the responses of participants. Eating habits and stress were identified as the primary barriers to weight control for the residents of the SMMC service area. The cost of fruits and vegetables and a dislike of exercise were also identified as challenges for the SMMC population. An interesting fact, demographic statistics show that both Lake and Porter County have consistently been ranked high for good access to exercise including health clubs, bike and walking trails and other safe spaces. Lake County is at a 91 percent in the current County Health Rankings and Roadmaps, within a point or two of the rating of Top Performers in the U.S. Porter County bounces around percent range for good access to exercise. What keeps you or your household members from your healthy weight? St. Mary Medical Center Service Area Needs Survey 2016 Community Health Needs Survey 2016 Eating habits 21.77% 47.61% Stress 19.73% 41.40% Not a problem for anyone in my household 13.13% 28.01% Don't like to exercise 10.88% 24.00% Cost and lack of healthy foods (fruit and vegetables) 10.81% 20.57% Not enough safe parks, sidewalks, walking trails, low-cost gym memberships 6.81% 14.23% Medical condition 5.90% 12.35% Other 3.79% 9.18% Don't know nutritional value in restaurant meals 3.72% 8.47% Don't like fruits and vegetables 1.83% 4.14% Don't have support from health professionals 1.62% 4.20% Page 30 of 63
31 HEALTHCARE BARRIERS Difficulty Accessing Healthcare Services In looking at barriers, access to basic health services appears to have improved over the last three-year period and it has dropped from the top concern. As in the previous survey, respondents were most worried about cost and co-pays, though the largest percentages in both the NWI communities study and the SMMC area research showed that residents did not have a problem with access. The secondary data shows the SMMC service area residents who were able to obtain health insurance in the last three years gained just one percentage point, and did not realize the same benefit as participants in the CHNA Finding programs, transportation and primary care doctors proved less difficult for the communities within the SMMC service area. The SMMC communities have the best doctor-topopulation ratio in Northwest Indiana. The barrier creating a difficulty for survey respondents in the SMMC (and it mirrors the study findings in the whole CHNA population) was difficulty getting appointments and navigating the hours when a physician is available. Of course, this may be attributable to a shortage of doctors that has not yet surfaced as a concern. Page 31 of 63
32 Which of the following make it harder for you and your household members to get healthcare services? St. Mary Medical Center Needs Survey 2016 Community Health Needs Survey 2016 Don't have trouble getting healthcare services 17.30% 49.27% Cost of co-pays 10.25% 25.93% Limited hours at doctor's office/clinic 7.36% 18.40% Not able to get timely appointment to see doctor/provider 6.95% 17.87% Lack of doctors/providers who accept my insurance 5.48% 13.99% Lack of insurance 3.60% 12.93% Unable to find a primary care doctor 2.96% 6.00% Can't find programs/services that meets my needs 2.49% 7.70% Public transportation that is not available or too limited 2.44% 6.11% Don't know what is available in my community 2.18% 8.58% Lack of affordable transportation 2.03% 5.06% Unable to find a specialist 1.07% 3.41% Language barrier 0.30% 1.65% Other 0.00% 6.41% Access to Mental Health Services There is less concern about accessing mental health services in the SMMC area than in the responses of residents of the greater geographic area. The largest number in the survey group indicated that they do not need mental health services. Considering roadblocks to physical and medical health services, the SMMC service area participants said that the cost of co-pays was a secondary difficulty to getting help for mental health illness. Respondents were more likely to be aware of what is available in the community, but have trouble getting an appointment, similar to difficulty when trying to access medical care. The majority of respondents in all of the Northwest Indiana communities that were measured, including the SMMC service area, did not think stigma was a significant barrier to getting professional help for mental health issues. Page 32 of 63
33 Which of the following make it harder for you and your household members to get mental healthcare services, such as counseling for loss, divorce, stress, depression, substance abuse or other issue? Check all that apply St. Mary Medical Center Community Health Needs Survey 2016 Needs Survey 2016 Don't need mental health services 21.29% 57.94% Cost of co-pay 6.40% 14.16% Don t have problem getting services 4.35% 9.64% Don't know what is available in my community 4.25% 12.55% Can't find program/services that meets my needs 4.03% 10.95% Lack of doctors/providers who accept my insurance 3.71% 9.28% Lack of insurance 3.60% 10.05% Concern about what other people think 3.33% 8.63% Limited hours at doctor's office/clinic 3.28% 8.03% Not able to get timely appointment to see doctor/provider 3.23% 7.91% Unable to find a doctor/provider 3.06% 5.65% Lack of affordable transportation 1.77% 3.57% Other (please specify) 0.00% 3.33% Cost of Prescription Medicine as a Barrier to Affordability Was there a time within the past year that you did not purchase or took less of a prescription medication because you could not afford it? Community Health Needs Survey 2016 Yes No Blank 29.38% 70.62% 2.07% St. Mary Medical Center Service Area Needs Survey 2016 St. Mary Medical Center Service Area Needs Survey % 69.32% 1.16% 14.50% 85.50% N/A The cost of prescription medicine is perceived as a major and growing health barrier in Northwest Indiana and especially true in the SMMC service area. In the 2016 survey, 30 percent of the respondents said that they did not purchase or took less of a prescription medication because of cost. That percentage represents an Page 33 of 63
34 increase of 100 percent in survey participants who found themselves in that predicament in 2013 (14.5%). Participants in the survey of the larger population experienced the same rate of difficulty with the cost of prescriptions. Access to Primary Care Do you have a primary care doctor? Yes No Community Health Needs Survey % 17.88% St. Mary Medical Center Service Area Needs Survey % 21.46% St. Mary Medical Center Service Area Needs Survey 2013* 73.80% N/A *"determined to have a specific source of ongoing medical care" The majority of those surveyed in the SMMC service area have a primary care doctor, though more than 20 percent of those participants in the survey do not. In general, research shows that residents who have a primary care physician who they visit routinely are more likely to engage in healthy behaviors like preventive care. The second best scenario for well-being is a regular healthcare provider or healthcare home, a clinic or facility where the patient feels comfortable visiting on a regular basis. In 2013, the respondents were questioned about having a healthcare home, rather than a doctor. Those participants in the previous assessment have exceeded their determination in both the large communities study and the subset at SMMC. Page 34 of 63
35 Do you have a primary care doctor? 90% 80% 70% 60% 50% 40% 30% 20% 10% 0% Community Health Needs Survey 2016 St. Mary Medical Center Service Area Needs Survey 2016 St. Mary Medical Center Service Area Needs Survey 2013* Yes No Explaining Why You Don t Have a Primary Care Doctor About 36 percent of people surveyed in the SMMC service area who say that they do not have a primary care doctor, say they do not need one. (This is also true by a wider margin in the Northwest Indiana area.) The next largest group (16 percent) say that doctors are too costly. In the SMMC service area the next most frequent reason for not having a doctor is a preference to see specialists. Other concerns are relatively minor, though no insurance is still on the list as is distrust of doctors. If no, what is the main reason you do not have a primary care doctor? St. Mary Medical Center Service Area Needs Survey 2013 St. Mary Medical Center Service Area Needs Survey 2016 Community Health Needs Survey 2016 Don't need one at this time N/A 35.85% 31.75% Too costly 16.60% 16.04% 11.98% Other (Difficulties and delays) 41.70% 14.15% 13.65% Prefer to see specialists for all health needs N/A 10.38% 9.19% Don't have insurance 15.90% 5.66% 15.32% Not enough doctors in my community N/A 5.66% 5.01% Can't get an appointment N/A 4.72% 4.46% Can't find a doctor who takes my insurance N/A 3.77% 6.41% Don't trust doctors N/A 2.83% 2.23% Page 35 of 63
36 Knowledge of Healthcare Services Which of the following do you need to know more about in order to get the healthcare services you need? St. Mary Medical Center Service Area Needs Survey 2016 Community Health Needs Survey 2016 The specifics of what insurance covers and doesn't cover 47.02% 54.94% Advance information from your insurance company about the costs of needed services 38.21% 42.17% The availability of discounted or no-cost prescription medications 36.79% 44.25% The healthcare services that are available in your community 35.09% 43.65% Programs in your community to help people pay for health services they can't afford 16.19% 39.79% Low or no cost transportation options in your community 13.49% 12.99% While the SMMC service area has higher socioeconomic demographics, there are indications that those surveyed are confused or concerned that they are not getting the information they need, especially about insurance. This mirrors concerns about lack of helpful information within the Northwest Indiana population itself. At the top of the list of specifics, both groups are baffled by medical insurance companies, the costs and what is and is not covered. Both groups of participants feel that they are not getting adequate information from other sources too. This belief is widespread as 55 percent in the greater Northwest Indiana area registered a complaint and 47 percent in the SMMC service area also said they were not getting details on coverage. In the second most popular answer choice, insurance companies were seen as not providing adequate advance information about the costs of needed services. Page 36 of 63
37 HEALTHCARE EXPERIENCE Healthcare Preferences When you need healthcare, where do you usually go for services? St. Mary Medical Center Service Area Needs Survey 2016 Community Health Needs Survey 2016 A doctor's office 75.00% 70.46% Clinic or urgent/immediate care facility 15.15% 17.91% Hospital Emergency Department 3.38% 3.11% Free or low cost clinic 2.79% 5.93% Other 2.79% 2.00% Veteran's Administration Healthcare 0.88% 0.59% The SMMC service area resident, like most in participants in the Northwest Indiana survey, are likely to receive healthcare services from their doctor. The survey results show respondents who use alternatives to a physician, will probably visit an urgent care facility (15 percent) or a hospital ER (3.38 percent). A very small number of SMMC service area respondents say that they would go to a free or low cost clinic. Page 37 of 63
38 Service Locations St. Mary Medical Center Service Area Needs Survey 2016 Type of Care Primarily in NWI Primarily Outside of NWI Need Service But Don't Get It Don't Need Service Eye/vision care 93.50% 2.11% 4.38% 0.00% Primary care 90.18% 2.68% 2.38% 4.76% Dental/Oral healthcare 87.31% 3.28% 7.31% 2.09% Surgery 61.98% 11.08% 1.05% 25.90% Specialist care 50.59% 10.09% 2.37% 36.94% Chronic disease treatment 42.59% 4.48% 1.39% 51.54% Mental healthcare 26.68% 3.43% 6.24% 63.65% Prenatal care 23.03% 0.97% 0.16% 75.85% Cancer care 15.75% 7.72% 0.47% 76.06% Community Health Needs Survey 2016 Type of Care Primarily in NWI Primarily Outside of NWI Need Service But Don't Get It Don't Need Service Primary care 89.06% 3.63% 3.08% 5.20% Eye/vision care 86.54% 5.33% 5.09% 3.41% Dental/oral healthcare 83.17% 7.03% 7.51% 2.64% Surgery 60.67% 9.65% 0.99% 30.18% Specialist care 54.13% 8.50% 2.32% 36.21% Chronic disease treatment 46.25% 4.87% 1.56% 48.31% Mental healthcare 23.35% 3.99% 5.25% 67.72% Prenatal care 20.04% 1.29% 0.45% 78.73% Cancer care 16.76% 7.34% 0.25% 76.22% More than 50 percent of the SMMC area residents stay close to home for healthcare services including specialist (50.59 percent), surgery (61.98 percent), primary care (90.18 percent), dental/oral (87.31 percent), and eye/vision (93.5 percent). Of those who need surgery or specialized care about percent leave the area and Page 38 of 63
39 about 8 percent of cancer patients in the SMMC area, get treatment outside of Northwest Indiana. Proportionally these percentages reflect the larger CHNA study whose participants are most likely to go outside NWI for surgery and specialist care too. Though the majority of both populations surveyed indicated they do not need these types of specialized care right now. SMMC service area respondents indicated that an area of their health that may be neglected is regular visits to the dentist and eye and vision care. This tendency is lower percentage wise in the SMMC service area where economic pressures may not be as great as within the healthcare purchasing Northwest Indiana population as a whole. The need-to-get-care-but-don t lines for the entire area and the SMMC service area show up at about a 6 percent rate in the question of untreated mental illness. This could be attributable to the lack of providers, facilities and programs to treat mental problems or the lack of knowledge about treatment and availability of resources for NWI residents who may have substance abuse problems or other mental health issues. Page 39 of 63
40 Getting Healthcare Information What are the three primary ways that you receive health information? St. Mary Medical Center Service Area Needs Survey 2016 Community Health Needs Survey Needs Survey 2016 My doctor (doctor's office, clinic) 80.74% 79.92% Internet 52.23% 50.06% Hospital 28.20% 26.79% Family 27.73% 27.37% Friends, co-workers/neighbors 27.58% 28.07% Media (radio, TV, newspapers, etc.) 22.80% 25.96% Social media (Facebook, Instagram, Twitter) 14.18% 12.72% A Nurse 14.02% 14.45% Urgent Care/ Immediate Care Clinic 9.71% 11.76% Emergency Room 6.16% 5.88% Other 5.86% 5.31% Community organization 4.62% 4.09% Church 3.39% 3.32% School 2.77% 2.62% There is an alignment in how SMMC area residents receive information about healthcare. Almost 80 percent of the respondents in the CHNA s larger geographic area get healthcare information from their doctors, but that number is slightly higher (80.74 percent) in the SMMC service area. In every category there are similar margins. Another example of a frequent source of information is the Internet, 50 percent of the respondents in the wider geographic area are using the web and percent of the residents in the SMMC service area use the web for healthcare information. Among traditional information sources like friends, family and churches, the SMMC group and the NWI-wide survey report similar numbers. These findings suggest that a variety of communication channels, including social media, need to continue to be employed to deliver healthcare information to the residents of the SMMC service area. Page 40 of 63


41 Rating Healthcare Services The response to the ratings question was slightly more negative as to the providers in the SMMC service area compared with the 2013 survey, but more spread out in terms of ratings per category than in the previous assessment. The excellent rating that was given in the 2013 survey dropped by more than two-thirds in 2016 and there were slightly fewer who gave the healthcare services a very good, rating than in the previous study. But 39 percent of the SMMC survey participants gave a good rating in the 2016 survey and to keep this in perspective, almost 79 percent of respondents gave healthcare quality a good or better rating. The increase in the fair-to-poor category was about 30 percent over the previous assessment with both the overall CHNA survey and the data from the SMMC market. The scores saw the low end gain and the top scores diminish. There were fewer poor ratings in the survey of all the communities, but the larger pool of participants only gave slightly higher ratings than the SMMC service area residents in the other categories. Page 41 of 63
42 MANAGING YOUR HEALTH Describe Your Health How would you describe your overall health? Excellent Very Good Good Fair Poor Don't Know/Not Sure Community Health Needs Survey 2016 St. Mary Medical Center Service Area Needs Survey 2016 St. Mary Medical Center Service Area Needs Survey % 32.09% 40.87% 15.64% 3.66% 0.58% 6.51% 32.27% 42.40% 15.05% 2.60% 0.43% 18.80% 30.60% 33.10% 12.50% 4.90% There has been a dramatic shift in how the residents of the SMMC service area selfdescribed overall health. Just three years ago, almost 19 percent of those surveyed said they were in excellent health and now that number has dropped to barely more than 7 percent. This might be explained by the fact that the 2016 survey most likely included a higher number of responses from individuals with greater health needs and disparities. For the 2016 survey, we made a concerted effort to survey underserved individuals. Fewer SMMC service area community members were willing to say that they are in very good health, although the number of survey participants from the community who believe that their health is good, fair or poor, have all increased. The majority say that they are in good health, but slightly fewer participants in the SMMC service area say that they are in poor health, then the population of the Northwest Indiana communities as a whole. Page 42 of 63
43 Support for Addressing Health Needs Has your doctor or healthcare provider talked to you about each of the following? St. Mary Medical Center Service Area Needs Survey 2016 Lifestyle changes that would improve your Your mental health (depression, Risk factors for chronic diseases health, such as diet, exercise, smoking anxiety, substance abuse) Yes 70.62% 51.33% 34.54% No 29.38% 48.67% 65.46% Though physicians have little hesitation to discuss lifestyle changes that could improve quality of life, there appears to be a reluctance to explore mental health needs with the patient. That would be a simple step that could create an opportunity to increase awareness and influence outcomes, while continuing to foster communications between doctors and patients. Use of Tobacco If you smoke, have you tried to quit in the past year? Never Yes No Smoked Former Smoker Community Health Needs Survey % 7.30% 58.87% 25.88% St. Mary Medical Center Needs Survey % 6.00% 58.62% 27.85% St. Mary Medical Center Needs Survey % 0.00% 53.00% 26.90% State of Indiana % U.S. Smokers % Page 43 of 63
44 In spite of the macro data on tobacco use in Northwest Indiana, both the SMMC service area population and the more encompassing study of the Region show numbers of self-described non-smokers that are much lower than the state and national numbers. Though the SMMC service area number is almost 8 percent, it is much lower than the rate indicated in the 2013 assessment (20.10 percent). In Indiana the numbers of smokers have dropped, but at a slower pace than what is seen in Northwest Indiana (from 25.6 percent in the 2013 CHNA) and in the U.S. Across the country the statistics show that the number of smokers has stabilized or in some cases gone up. In rural areas, according to data in Indiana counties, the rate of smoking remains stubbornly above average. Not surprisingly, rural areas in Indiana have less access to healthcare, complicated by shortages of healthcare professionals and transportation. Household Diagnosis and the Effect on Lifestyle Have you or someone in your household been diagnosed with any of the conditions listed? Has that limited your lifestyle? St. Mary Medical Health Needs Survey 2016 Diagnosis You or someone in your household has This condition limits or has caused major been diagnosed impairment of your lifestyle Obesity 21.23% 41.60% Diabetes 19.00% 27.23% Depression\Mental Health Issues 18.64% 51.67% Heart Condition 16.86% 31.22% Cancer 13.29% 34.23% Lung disease 10.97% 50.41% Page 44 of 63
45 Have you or someone in your household been diagnosed and has that limited your lifestyle? Diagnosis Community Health Needs Survey 2016 You or someone in your household has been diagnosed This condition limits or has caused major impairment to your lifetyle Diabetes 92.46% 26.21% Heart Condition 92.28% 27.80% Obesity 91.86% 34.35% Cancer 89.46% 29.41% Depression\Mental Health 88.35% 44.98% Lung disease 87.50% 39.49% Across both groups measured in this study the two illnesses most likely to limit lifestyle choices are depression and other mental health issues and respiratory ailments. The SMMC service area seems to feel an impact on lifestyle with modifiable issues like obesity and heart conditions than the larger NWI communities studied in the CHNA. More than 52 percent of participants in the SMMC service area report an impact on lifestyle when someone in the household suffers with mental illness. In the survey of the larger population, the lifestyle effects are less, at 45 percent. Even though about 89 percent of residents in the larger survey area had a person in the house diagnosed with a mental condition, there was a seven-point difference with the SMMC service area in terms of the impact on lifestyle. When dealing with lung disease, the differences in lifestyle impediment between the SMMC service area and the Northwest Indiana area, there is more than a 10-point margin, with less impact on lifestyle in the larger population. Obesity, diabetes and heart disease are generally easier for households to manage, with obesity still the toughest challenge of the three for a household anywhere in Northwest Indiana. Page 45 of 63
46 Prevalence of Preventive Procedures Preventive Procedure St. Mary Medical Center Service Area Needs Survey 2016 Yes No N/A Blood Pressure Screening 85.88% 12.25% 1.87% Cholesterol Screening 75.88% 21.20% 2.92% Flu Shot 65.42% 30.70% 3.87% Pap Smear 64.11% 22.24% 13.65% Breast Exam/Mammogram 63.92% 20.06% 16.02% Diabetes Screening 62.88% 30.37% 6.75% Immunization Screening 41.71% 40.72% 17.57% Colon Exam 35.74% 47.34% 16.93% Well Exam for My Child 34.34% 12.96% 52.69% Skin Cancer Screening 25.58% 60.40% 14.03% Pneumonia Shot 21.17% 59.93% 18.89% Prostate Screening 18.76% 38.17% 43.07% Lung Screening 12.97% 65.53% 21.50% Page 46 of 63
47 Preventive Procedure Community Health Needs Survey 2016 Yes No N/A Cholesterol Screening 85.78% 12.30% 1.92% Flu Shot 78.36% 18.83% 2.81% Breast Exam/Mammogram 66.94% 29.20% 3.86% Pap Smear 66.39% 26.18% 7.43% Well Exam for My Child 63.43% 19.76% 16.82% Blood Pressure Screening 61.77% 22.50% 15.73% Immunization Screening 43.25% 39.93% 16.82% Lung Screening 36.91% 47.50% 15.59% Diabetes Screening 32.26% 13.33% 54.41% Skin Cancer Screening 26.76% 59.37% 13.87% Pneumonia Shot 23.13% 58.00% 18.87% Prostate Screening 19.72% 38.73% 41.55% Colon Exam 16.37% 60.85% 22.78% Page 47 of 63
48 A large population in both the SMMC service area and the greater Northwest Indiana area are getting tested more frequently and having more preventive treatments than in the past. Higher numbers of insured patients and a large proportion of the population surveyed saying they have a primary care physician that they see at office visits, should influence better outcomes for cardiovascular and other major health problems in the future. There are differences in testing priorities between the SMMC area population and the larger encompassing CHNA. Though the SMMC has blood pressure screening at the top of the preventive procedure list, in the larger population blood pressure is in the middle of the list, more than 20 percentage points below top-ranking cholesterol screening and well behind the second most prevalent preventive procedure: a flu shot. The two populations agree on pap smears and mammograms, but the larger survey population ranks well-exam for their child fifth and the SMMC population is more concerned with diabetes and immunizations screenings and colonoscopies. There are tests and procedures in both populations that those surveyed did not understand. Within SMMC more than 50 percent of the respondents did not know Page 48 of 63
49 what a well exam for a child is and more than 54 percent of the general CHNA survey were puzzled about the diabetes screening. Though obesity, diabetes, pneumonia and other medical conditions that can sometimes be fatal or lead to other fatal diseases, have been challenging in Northwest Indiana, routine testing and early warning create an opportunity for the physician to intervene if there is a problem. But even if there is nothing detected, screening procedures provide an opportunity for physicians and patients to discuss lifestyle changes and behavior modification that could ultimately bring death rates down. Visiting the Emergency Room Throughout Northwest Indiana about half of residents did not have a reason to visit a hospital emergency room in the past year. In the SMMC service area less than half did visit the ER. The top category of reasons for the trip to the ER falls under miscellaneous: that category ---common illnesses --- accounted for more than 24 percent of the trips in the SMMC service area and about 12 percent across the CHNA area, according to those who were surveyed. In the SMMC service area approximately 16 percent of ER visits were for pain relief. It has been suggested by other research in the state and the nation, that an increasing number of emergency room visits seeking opiate painkillers are the result of a growing addiction to prescription medications. Public safety and law enforcement studies show that ERs have been a hunting ground for street dealers who get prescriptions for pain and then sell the drugs to addicts. Although this survey shows that the percentage of patients who show up at the ER for substance abuse is very small at slightly more than 1 percent in both the SMMC service area Page 49 of 63
50 and in Northwest Indiana. Injury, heart condition and broken bones are three reasons common to both groups of survey participants who visited the ER in the past year. The SMMC service area residents are more likely to have visited the ER for respiratory problems (14.2 percent) but the two groups are proportionately similar for diabetes and blood sugar issues. The SMMC population goes to the ER for broken bones and injuries more often than the larger group. For both groups of respondents, dental needs or cancer were among the least likely reasons for residents to visit the ER. The percentages of those surveyed who went to the ER to see a doctor, are small (4 percent) for the SMMC service area and to participants in the larger Northwest Indiana area. Stroke victims are also unlikely to go to the ER. In the past 12 months have you or anyone in your household visited the ER for any of the following? St. Mary Medical Center Service Area Needs Survey 2016 Community Health Needs Survey 2016 Did not visit the ER in the past 12 months 44.28% 51.33% Common illness (colds, ear infections, fever, rash, flu) 24.42% 11.72% Injury 19.74% 10.71% Pain Relief 15.58% 8.94% Breathing problems (asthma, COPD) 14.29% 8.81% Heart Condition 12.21% 7.67% Broken bones 9.61% 4.63% Depression/Anxiety/Mental Health Issues 4.68% 3.61% Blood sugar (diabetes) 3.90% 3.11% Just needed access to a physician 3.90% 3.61% Dental/Oral health 3.12% 2.03% Cancer 2.86% 1.77% Stroke 2.86% 1.46% Substance Abuse (alcohol, drugs) 1.04% 1.08% Other 0.00% 12.80% Page 50 of 63
51 Complementary Medicine Perhaps it is simply a sign of the times that at least three-quarters of the participants in the SMMC service area, as well as the larger CHNA survey population, are interested in complementary medicine. There is an even more favorable rate to the idea of complementary therapies and dietary supplements in SMMC, which may provide another opportunity for health improvement in Northwest Indiana. Do you feel your health could be improved through the use of complementary medicine such as Dietary Supplements and Herbs, Meditation, Body Movement Therapies, etc.? Community Health Needs Survey % 25.00% Yes No St. Mary Medical Center Service Area Needs Survey % 23.68% Page 51 of 63
52 Overall, what do you feel hospitals and healthcare organizations could do to help improve the health of your community? There were almost 350 responses to this question from the St. Mary Medical service area and the majority of the answers tied directly back to making healthcare more affordable and accessible. One commenter said, Be more interactive in the community. Raise awareness about the risks and treatments for chronic disease. Also, be more supportive, network and [provide] health screenings with transportation for those who can t drive. Comments also asked for more willingness to help with children and lower the cost of weight loss programs. There were numerous supportive comments too, including, Continue giving care and teaching prevention passionately! Participants in the survey often asked for lower and more affordable costs, but were also interested in wellness programs, classes, preventive education and help with weight control. One person explained that there should be more emphasis on actual healthcare rather than what was called patient satisfaction. Another person in the survey complained that obesity is often treated like a side effect, when ultimately it is the problem that caused the damage in the first place. Many participants in the survey asked for more free or low-cost healthcare options and would like to see more screenings taking place in schools. One participant wrote, Health club[s] should be available at an affordable price and there should be a special concentration on older people over 50. Gyms around NWI cater to [the] younger generation. There were numerous supportive comments about hospitals and healthcare service providers. For example, several people who took the survey said: I think they are doing a good job. I think they do a good job, and I think they do a great job already More outreach would be welcomed by commenters in the survey. Participants want lower costs on everything, but especially lab tests. People also asked for more alternative and optional therapies including yoga for treatment of stress. Many called for more educational programs on everything from gerontology to the ingredients of food. Stop pushing drugs, surgeries, and invasive treatments, and start preventive and curing natural treatments, suggested one of the participants. Another respondent wanted, one person to coordinate all your healthcare. Specialists should educate the primary care doctor, so patients have an informed doctor. Page 52 of 63
53 There were suggestions for free medication and screenings, especially for those who cannot afford healthcare. Work together, one person suggested to the team of doctors, nurses, and caregivers that helped out during a recent hospital stay. There were numerous complaints about an inability to get doctor appointments and scheduling. Requests included more health fairs, job opportunities in the healthcare sector as well as participation of hospitals in health fairs, farmer s markets and other community events. Respondents asked for more classes on everything from the latest medical discoveries to insurance benefits. VIOLENCE Victims of Violence Northwest Indiana is known for high rates of violent crimes---higher than average in the state and the nation. However, only a small proportion of those surveyed indicated that they have experienced a violent crime. Six percent of those surveyed in the Northwest Indiana communities reported that they or a member of their household had been a victim of a violent crime sometime in the past five years. The risk is less in the SMMC service area where less than 5.41 percent of survey participants reported involvement in a violent incident during that timeframe. Have you or a member of your household been the victim of physical violence in the past five years? (domestic/street/gang/criminal violence) Yes No Community Health Needs Survey % 94.00% St. Mary Medical Center Service Area Needs Survey % 94.59% Violent Crime Rate Porter County % Violent Crime Rate Lake County % Violent Crime Rate Indiana % Page 53 of 63
54 Page 54 of 63
55 CANCER There is not much differentiation as to what the SMMC service area respondents thought would help lower the risk for an individual s getting cancer compared with those from the greater Northwest Indiana area. Free screening is the top choice of both populations in fighting cancer; more education about screening tests is a second choice. Overall, the Northwest Indiana respondents believe strongly that employer incentives work (33 percent), while those who live in the SMMC service area consider that idea less of a solution to achieving lower cancer rates (30 percent). There is a slight disconnect between the larger study and SMMC participants on public information on detection and prevention. Both groups find tobacco cessation programs, healthier food choices, school and doctor education would be helpful in bringing down the rates of cancer. Lowering Individual Risk Which of the following efforts do you feel would be most effective to help lower an individual's risk for cancer? (Choose 3.) St. Mary Medical Center Service Area Needs Survey 2016 Community Health Needs Survey 2016 Access to the free screening resources in the community 67.60% 73.65% Education on screening guidelines 31.56% 34.19% Stress reduction 29.89% 31.49% Employer incentives for good health behaviors 29.75% 32.87% Healthier food choices in the community 28.07% 29.64% Public information on detection and prevention 25.70% 31.23% Nutrition counseling and weight loss programs 22.77% 26.22% Physician educating patients on preventative measures 22.35% 25.82% Education programs in our schools 22.21% 24.37% Tobacco cessation programs 20.11% 23.85% Other 0.00% 2.50% Page 55 of 63
56 Cancer Screening Once again the top choice for encouragement to get screened for cancer is to make screenings free or bring down the costs, in both the SMMC service area and the Northwest Indiana communities. The idea of affordability dominates this question as high numbers of participants predict positive encouragement if insurance companies would provide better coverage for preventive cancer testing. Next, study participants also cite positive effects when healthcare providers urge individuals to get tested for cancer. Needs of Cancer Patients Participants in the SMMC service area place high value on individual counseling for cancer patients, which reflects back on many of the comments in the open-ended questions in the survey. Other suggestions that got high marks in the study of the SMMC service area respondents, placed an emphasis on support and sympathy in professional settings, including hospice services (75.41 percent), access to support groups and information about palliative care. Large percentages of both SMMC and CHNA think practical help with nutritional therapy, stress reduction and rehabilitation services would encourage cancer patients. Though online education got the poorest ranking from both study populations, more than 50 percent of the SMMC participants as well as the CHNA survey group felt it could be very valuable for cancer patients to have online education. Page 56 of 63
57 How valuable do you feel each of the following are to people who have cancer? St. Mary Medical Center Service Area Needs Survey 2016 Very Valuable Somewhat Valuable Not Very Valuable Not at All Valuable Individual counseling 78.18% 18.51% 2.98% 0.33% Hospice services 75.41% 18.73% 4.56% 1.30% Nutritional and diet therapy 74.51% 20.62% 3.73% 1.14% Support groups in the community 69.16% 24.68% 5.52% 0.65% Exercise and stress reduction activities 74.11% 20.06% 5.18% 0.65% Rehabilitative services 69.10% 25.75% 3.82% 1.33% Educational programs in the community 68.48% 26.24% 4.80% 0.48% Complementary medicine (diet, supplements and herbs, meditation, body movement therapies) 69.81% 23.32% 4.79% 2.08% Spiritual counseling 66.67% 25.49% 6.21% 1.63% Access to clinical research trials in the community 68.15% 22.98% 6.18% 2.69% Pallative care options 66.96% 26.82% 4.67% 1.56% Educational resources online 64.25% 30.31% 4.78% 0.66% Support groups online 53.70% 31.48% 12.29% 2.53% How valuable do you feel are each of the following are to people who have cancer? Community Health Needs Survey 2016 Very Valuable Somewhat Valuable Not Very Valuable Not at All Valuable Individual counseling 78.48% 17.82% 2.80% 0.91% Hospice services 77.08% 17.80% 3.81% 1.32% Nutritional and diet therapy 74.69% 21.23% 3.04% 1.04% Exercise and stress reduction activities 72.59% 22.97% 3.83% 0.62% Rehabilitative services 71.33% 23.94% 3.60% 1.13% Support groups in the community 68.99% 25.14% 4.70% 1.17% Educational programs in the community 68.85% 26.18% 4.29% 0.68% Pallative care options 68.57% 25.34% 4.42% 1.67% Complementary medicine (diet, supplements and herbs, meditation, body movement therapies) 68.34% 24.29% 5.75% 1.62% Access to clinical research trials in the community 67.63% 25.17% 5.25% 1.95% Spiritual counseling 66.39% 26.15% 5.44% 2.02% Educational resources online 63.28% 31.25% 4.91% 0.56% Support groups online 53.07% 32.10% 11.55% 3.28% Page 57 of 63
58 Improving Cancer Care Thinking about those you may know who have been diagnosed with cancer, what could hospitals do to improve care to patients and their loved ones? A dozen themes emerged from the more than 300 answers to this question from the SMMC service area respondents. Those surveyed in the SMMC study asked for honesty especially for outcomes that could be expected when using chemotherapy and radiation. Patients and families would like to have resources and information about their condition as well as counseling services. Care was emphasized often with references to caregivers and physicians and the word compassion was used. The commenters also frequently chose the words more and better. One individual commented, Learn about the biggest issues the patient has, their fears and the things in their life most impacted and biggest needs created to establish and support that specific issue. Someone to assist to pay bills, provide little sums of cash, grocery shop, an understanding person to talk with Everyone does not have supportive families, or churches, etc. Seek to ask these questions. Many never ask and [people] may fall through the cracks into decline [and] regression. There were many calls for assistance and follow-up work. The words provide and available came up frequently. Bring in the spiritual aspect of recovery and hope, one person commented. One survey participant cautioned about giving hope, but first making sure that it is valid, because false hope is worse than no hope. There were dozens of calls for more preventive care and many who told of experiences with patients whose diagnosis just came too late. There were numerous references to the importance of early detection. One participant said, Cancer affects not only the patient, but the family and caretakers. I think when a patient has cancer, it would be helpful for each patient to have a medical person helping them Page 58 of 63
59 with the insurance part. Someone to help make the calls to insurance and make sure the patient is going to the right place. Someone to help map out the process. This was one of numerous requests for someone who acted as a cancer concierge. The families of cancer patients want to be involved. They want big rooms to accommodate everyone who can visit and special waiting areas because cancer patients immune systems are fragile. Offer complete holistic approach to services, one individual said, suggesting that treatment often seems fragmented and disorganized. A cancer referring center that provides educational services for patients and families to assist and coordinate care would be ideal. There were comments about cost of care, but most were about more intangible assistance like the need for emotional support, counseling and empathy. Some commenters said that they would appreciate more providers who listen and communicate. Long delays on doctor appointments and test results were mentioned. One commenter urged healthcare professionals: Do not prolong the suffering! Page 59 of 63
60 DEMOGRAPHICS OF SURVEY RESPONDENTS Gender What is your gender? Female Male Community Health Needs Survey % 17.09% St. Mary Medical Center Service Area Needs Survey % 16.13% U.S. Census 51% 49% Sources: U.S. Census Bureau; Indiana Business Research Center Age Community Health Needs Survey 2016 St. Mary Medical Center Service Area Needs Survey 2016 St. Mary Medical Center Service Area Needs Survey 2013 Census Current Sources: U.S. Census Bureau; Indiana Business Research Center What is your age? 75 or older 3.36% 12.42% 16.43% 24.26% 27.04% 10.61% 5.89% 3.54% 13.85% 18.92% 24.00% 25.23% 10.46% 4.00% % 45.60% 17.50% Under % 24.80% 27.00% 14.70% Page 60 of 63
61 Ethnicity What is your ethnicity? Community Health Needs Survey 2016 St. Mary Medical Center Service Area Needs Survey 2016 St. Mary Medical Center Service Area Needs Survey 2013 Hispanic or Latino Black or African American White or Caucasian Asian or Pacific Islander American Indian or Alaskan Native Other 9.13% 27.14% 72.86% 0.98% 1.04% 1.83% 6.50% 15.48% 73.22% 1.39% 1.24% 28.40%* 71.60% Census Lake County % 45.40% 70.90% 18.10% 45.40% *non-white Income What is your average household income? Community Health Needs Survey 2016 St. Mary Medical Center Service Area Needs Survey 2016 $0-$24,999 $25000-$49,000 $50,000-$74,999 $75,000-$99,999 $100,000-$124,999$125,000-$149,999 $150,000-up 14.89% 20.79% 20.93% 17.77% 12.92% 5.20% 7.51% 11.26% 24.17% 23.01% 18.54% 12.91% 5.46% 4.64% Number in Household How many people are in your household, including yourself? Community Health Needs Survey 2016 St. Mary Medical Center Service Area Needs Survey or more 13.05% 39.40% 21.79% 15.79% 9.98% 12.42% 39.60% 19.25% 17.70% 11.02% Page 61 of 63
62 Health Insurance Community Health Needs Survey 2016 St. Mary Medical Center Service Area Needs 2016 Do you have health insurance? Yes St. Mary Medical Center Service Area Needs % 15.90% Lake County - Porter County 2016 Avg %** U.S. Census % State of Indiana % *self-reported SMMC survey **Porter County (15.5%) and Lake County (19.9%) average No 93.07% 6.93% 96.12% 3.88%* Educational Level What is your highest level of education? St. Mary Medical Center Educational Level Service Area Needs Survey 2016 Community Health Needs Survey 2016 Did not finish high school, no GED 0.78% 2.09% High School diploma/ged 13.35% 13.77% Some college 20.03% 19.06% Technical/trade school or apprenticeship 8.70% 6.72% Associates degree 16.93% 17% Bachelor degree 25.00% 26.70% Graduate degree 15.22% 14.75% Page 62 of 63
63
64 2016 Online Key Informant Survey Results Northwestern Indiana Prepared for: Franciscan Alliance, Methodist Hospitals, and Community Hospital By: Professional Research Consultants, Inc P Street Omaha, NE March 2016
65 ONLINE KEY INFORMANT SURVEY Table of Contents Introduction 3 Participation 4 Evaluation of Health Issues 7 Key Informant Input 9 Substance Abuse 10 Nutrition, Physical Activity & Weight 12 Diabetes 14 Mental Health 16 Heart Disease & Stroke 18 Cancer 20 Tobacco Use 22 Dementias, Including Alzheimer s Disease 24 Injury & Violence 26 Infant & Child Health 28 Respiratory Disease 29 Chronic Kidney Disease 30 Access to Healthcare Services 32 Oral Health 34 Sexually Transmitted Diseases 35 HIV/AIDS 36 Family Planning 37 Hearing & Vision 38 Immunization & Infectious Diseases 39 Arthritis, Osteoporosis & Chronic Back Conditions 40 Resources 41 Resources Available to Address the Significant Health Needs 42 2
66 Introduction
67 ONLINE KEY INFORMANT SURVEY Participation ONLINE KEY INFORMANT SURVEY To solicit input from key informants, those individuals who have a broad interest in the health of the community, an Online Key Informant Survey was implemented. A list of recommended participants was provided by Franciscan Alliance, Methodist Hospitals, and Community Hospital; this list included names and contact information for physicians, public health representatives, other health professionals, social service providers, and a variety of other community leaders. Potential participants were chosen because of their ability to identify primary concerns of the populations with whom they work, as well as of the community overall. Key informants were contacted by , introducing the purpose of the survey and providing a link to take the survey online; reminder s were sent as needed to increase participation. In all, 64 community stakeholders took part in the Online Key Informant Survey, as outlined below: Online Key Informant Survey Participation Key Informant Type Number Invited Number Participating Community/Business Leader Other Health Provider 36 8 Physician 30 7 Public Health Representative 16 6 Social Services Provider Final participation included representatives of the organizations outlined below. 411 Newspaper CCNI City of East Chicago Health Department City of East Chicago City of Gary Community Development Department Community HealthNet, Inc. Edgewater Behavioral Health Services 4
68 ONLINE KEY INFORMANT SURVEY Franciscan Alliance Franciscan St. Margaret Health Gary Health and Human Services Department Gary Mental Health Geminus Corporation Greater Portage Chamber of Commerce HealthLinc HEC Hobart Family YMCA Ivy Tech Community College Jasper County Health Department Lake Area United Way Lakeshore Chamber of Commerce Lakeshore Public Media Merrillville Community Schools Multicultural Wellness Network MOTTEP Northwest Indiana Community Action Northwest Indiana Forum Portage Police Department Portage Township YMCA Porter-Starke Services Sojourner Truth House Southern Lake County St. Anthony The Arc Northwest Indiana The Salvation Army The Salvation Army East Chicago Corps The Times Town of Hebron Town of Kouts Town of Morocco West Lake Special Education YWCA of Northwest Indiana Through this process, input was gathered from several individuals whose organizations work with low-income, minority populations, or other medically underserved populations. Minority populations represented: African-Americans, American Indians, Asians, children, the disabled, the elderly, ethnic minorities, Hispanics, the homeless, LGBT individuals, those of Middle Eastern descent, mixed race individuals, and undocumented residents Medically underserved populations represented: children, the disabled, the elderly, ethnic minorities, those with HIV, the homeless, LGBT individuals, low income residents, Medicare/Medicaid recipients, the mentally ill, non-english speaking residents, single parents, substance abusers, undocumented residents, uneducated residents, the uninsured/underinsured, those living in food deserts, veterans, women, young adults, and young mothers 5
69 ONLINE KEY INFORMANT SURVEY In the online survey, key informants were asked to rate the degree to which various health issues are a problem in their own community. Follow-up questions asked them to describe why they identify problem areas as such, and how these might be better addressed. Results of their ratings, as well as their verbatim comments. NOTE: These findings represent qualitative rather than quantitative data. The Online Key Informant Survey was designed to gather input from participants regarding their opinions and perceptions of the health of the residents in the area. Thus, these findings are based on perceptions, not facts. 6
70 Evaluation of Health Issues
71 ONLINE KEY INFORMANT SURVEY Survey respondents were presented with 20 health issues and asked to rate each as a major problem, moderate problem, minor problem, or no problem at all in their own community. The following table illustrates these responses. Evaluation of Health Issues Health Issue Major Problem Moderate Problem Minor Problem No Problem At All Substance Abuse 56.3% 25.0% 14.1% 4.7% Nutrition, Physical Activity, and Weight 52.5% 27.9% 9.8% 9.8% Diabetes 52.5% 26.2% 11.5% 9.8% Mental Health 50.0% 31.3% 15.6% 3.1% Heart Disease and Stroke 49.2% 27.1% 11.9% 11.9% Cancer 45.2% 38.7% 9.7% 6.5% Tobacco Use 40.3% 33.9% 21.0% 4.8% Dementia/Alzheimer's Disease 39.7% 39.7% 19.0% 1.7% Injury and Violence 39.3% 32.8% 24.6% 3.3% Infant and Child Health 27.6% 37.9% 29.3% 5.2% Respiratory Diseases 23.7% 45.8% 18.6% 11.9% Chronic Kidney Disease 23.6% 32.7% 29.1% 14.5% Access to Health Care Services 23.4% 40.6% 23.4% 12.5% Oral Health/Dental Care 21.7% 41.7% 23.3% 13.3% Sexually Transmitted Diseases 14.5% 40.0% 30.9% 14.5% HIV/AIDS 14.3% 33.9% 37.5% 14.3% Family Planning 13.3% 45.0% 25.0% 16.7% Hearing and Vision Problems 12.1% 36.2% 37.9% 13.8% Immunization and Infectious Diseases 10.5% 42.1% 35.1% 12.3% Arthritis/Osteoporosis/Back Conditions 8.8% 57.9% 21.1% 12.3% 8
72 Key Informant Input
73 4.7% ONLINE KEY INFORMANT SURVEY Substance Abuse Most key informants taking part in an online survey characterized Substance Abuse as a major problem in the community. Perceptions of Substance Abuse as a Problem in the Community (Key Informants, 2016) Major Problem Moderate Problem Minor Problem No Problem At All 56.3% 25.0% 14.1% Sources: Notes: PRC Online Key Informant Survey, Professional Research Consultants, Inc. Asked of all respondents. BARRIERS TO TREATMENT Among those rating this issue as a major problem, the greatest barriers to accessing substance abuse treatment are viewed as: Denial/Stigma Incidence/Prevalence Don't want help, like the easy way of not having problems when high on a drug. - Public Health Representative Acceptance of the problem and cost. - Other Health Provider Patient compliance and refusal, access to appropriate programs, access to behavioral healthcare professionals. - Physician Shame, problem identification and desire. - Social Services Provider Being honest with oneself. - Community/Business Leader The stigma, the cost and the basic "where can I go for help?". - Community/Business Leader Denial that we have a problem in the region. - Community/Business Leader For those who lack job opportunities and social support, it can be difficult to find the motivation to break free from addiction. - Social Services Provider They want something that will keep them numb to the real world. - Social Services Provider Most families are in denial and the criminal justice system needs to update their policy for incarceration of youth with substance abuse. - Social Services Provider Opiate abuse seen in our Emergency Rooms daily. - Physician Number of deaths reported as a result of overdoses. Number of failed employment applications because of failed drug tests. Amount of drug related crimes in parts of the region. - Community/Business Leader Number of people diagnosed with substance abuse addictions. - Other Health Provider Again, referring to the 2009 Community Epidemiological Study, substance abuse, lack of prevention, intervention and treatment are major issues in Newton County. - Community/Business Leader 10
74 ONLINE KEY INFORMANT SURVEY Lack of Treatment Facilities Lack of long term residential treatment. Insurance. Co-pays for treatment. Transportation. - Social Services Provider Lack of programs and centers, financial barriers. - Community/Business Leader Too few facilities. - Community/Business Leader Affordable Care/Services Again, there are a variety of reasons, financial, mental, emotional etc. - Community/Business Leader Access to Care/Services Cost, stigma and knowing where to get treatment. - Other Health Provider Cost and number of facilities. - Community/Business Leader Money and knowledge of their existence. - Community/Business Leader Availability, cost, fear of punishment and lack of support. - Public Health Representative Very limited access but lots of pain doctors, maybe there is an inverse relationship. - Physician Location and accessibility. - Community/Business Leader Awareness of Resources Lack of knowledge about places that help with this problem. - Social Services Provider Unaware of available resources. - Social Services Provider MOST PROBLEMATIC SUBSTANCES Key informants (who rated this as a major problem ) most often identified alcohol, heroin or other opioids, and prescription medications as the most problematic substances abused in the community. Most Problematic Second- Most Problematic Third-Most Problematic Total Mentions Alcohol 59.3% 14.8% 18.5% 25 Heroin or Other Opioids 14.8% 25.9% 18.5% 16 Prescription Medications 11.1% 18.5% 18.5% 13 Marijuana 7.4% 7.4% 11.1% 7 Cocaine or Crack 3.7% 7.4% 14.8% 7 Methamphetamines or Other Amphetamines 0.0% 18.5% 7.4% 7 Over-The-Counter Medications 0.0% 3.7% 7.4% 3 Inhalants 3.7% 3.7% 0.0% 2 Club Drugs (e.g. MDMA, GHB, Ecstasy, Molly) 0.0% 0.0% 3.7% 1 11
75 ONLINE KEY INFORMANT SURVEY Nutrition, Physical Activity & Weight A majority of key informants taking part in an online survey characterized Nutrition, Physical Activity & Weight as a major problem in the community. Perceptions of Nutrition, Physical Activity, and Weight as a Problem in the Community (Key Informants, 2016) Major Problem Moderate Problem Minor Problem No Problem At All 52.5% 27.9% 9.8% 9.8% Sources: Notes: PRC Online Key Informant Survey, Professional Research Consultants, Inc. Asked of all respondents. TOP CONCERNS Among those rating this issue as a major problem, reasons frequently related to the following: Lifestyle Difficult to overcome a lifelong pattern of bad decisions, overeating, lack of exercise, smoking, drug/alcohol abuse and other dangerous behaviors. - Community/Business Leader Changing habits and providing healthy options. - Other Health Provider That's very broad and can be the result of a variety of things - Community/Business Leader Sedentary lifestyle, substance abuse, culture mindset of the region. Lack of access to quality facilities, affordability of recreational/fitness opportunities, deeper underlying psychological issues, lack of access to quality food. - Community/Business Leader Poor nutrition, sedentary lifestyles and obesity. - Social Services Provider People need to get up and move. Children spend too much time with their electronic games. - Other Health Provider So many places to eat out and such large portion sizes. Cost of eating healthy. You can buy a burger on the dollar menu anywhere, but a salad is $5.00. Cost of joining a gym or hiring a trainer. - Community/Business Leader Big challenge, again, low to moderate income and seasonal accessibility to exercise. - Community/Business Leader Lack of Healthy Food Options For Gary, lack of food shopping options. Gary is classified as a food dessert. Many of our consumers identify that they do little to no constructive physical activity. - Other Health Provider We do not have health food stores or lots of restaurants specializing in healthy foods. We do have private gyms, but those are not always available to those most in need. Many areas of Northwest Indiana do not have safe or convenient areas to walk. - Community/Business Leader Food deserts, lack of healthy foods, stress of poverty and survival thinking are some. - Social Services Provider Insufficient supply of healthy food options, such as grocery stores in Gary, poverty, low income. - Other Health Provider Communities with no safe place to walk or exercise. Shortage of fresh foods, vegetables and 12
76 ONLINE KEY INFORMANT SURVEY Health Education fruits in some areas, cost of fresh foods. - Public Health Representative Knowledge about a well-balanced diet that fits the budget. - Community/Business Leader The challenge is that some people whether single or raising families do not know about good nutrition. They do not know how to cook healthy for themselves or their families. Too often I am at the store and see overweight moms and/or fathers. - Community/Business Leader Lack of major and prolonged emphasis throughout our lives and in every community on wellbeing. - Community/Business Leader Complacency and lack of education. Physician Lack of opportunities and information. - Social Services Provider Obesity I believe that Indiana has the 8th highest percentage of obese adults in the nation, and ranks 25th for the number of overweight and obese children. - Social Services Provider Because of the number of obese people in our community. Also, studies released by Purdue University. - Other Health Provider Significant incidence of obesity. - Public Health Representative Obesity in Northwest Indiana is a major issue. Physician Unprecedented obesity. Physician 13
77 ONLINE KEY INFORMANT SURVEY Diabetes A high percentage of key informants taking part in an online survey characterized Diabetes as a major problem in the community. Perceptions of Diabetes as a Problem in the Community (Key Informants, 2016) Major Problem Moderate Problem Minor Problem No Problem At All 52.5% 26.2% 11.5% 9.8% Sources: Notes: PRC Online Key Informant Survey, Professional Research Consultants, Inc. Asked of all respondents. CHALLENGES Among those rating this issue as a major problem, the biggest challenges for people with diabetes are seen as: Nutrition, Physical Activity and Weight It pertains to lack of physical activity and proper nutrition. I deal with the low income population and both root causes are rapid. - Other Health Provider Diet and exercise. - Community/Business Leader Diet, supplies, exercise and medication. - Public Health Representative Our community has poor ratings for obesity and physical activity levels. We are a target market for type 2 diabetes. Over 10% of our adult population suffers from diabetes. - Social Services Provider Obesity and quality of life. - Social Services Provider Access to healthy foods that are affordable and convenient to obtain. There are a number of food deserts in this region. This causes individuals with no or limited access to transportation to not be able to shop in locations that provide healthy foods. - Community/Business Leader Access to Care/Services Food deserts and availability of fresh produce and fish. - Community/Business Leader Adequate care and access to that care. Also follow up on their end or having a health care official to follow up with them. - Community/Business Leader Access to Endocrinologists or individuals capable of caring for patients with diabetes. Physician Access to Endocrinology. - Physician Access to care, challenge of managing chronic disease when poor. Complexity of disease management in the context of multiple co-morbid conditions and lack of social support. - Public Health Representative Insurance covers insulin, but not needles. Insurance covers testing devices, but not strips to accompany them. Transportation for regular medical visits and medicines. - Social Services Provider 14
78 ONLINE KEY INFORMANT SURVEY Health Education Prevention. - Community/Business Leader Prevention/education about the disease, access to treatment. - Other Health Provider From my experience, I was diagnosed with diabetes a few years ago and my physician only scared me with a death diagnosis and offered no resources for me to even learn what diabetes was. When I inquired several times, I was simply told to check the hospital. - Community/Business Leader Education. - Community/Business Leader Patient teaching and compliance. - Public Health Representative Diet and education - Other Health Provider Access to Healthy Lifestyle Incidence/Prevalence Compliance Comorbidities Lack of support groups for maintaining a healthier body. - Community/Business Leader Access to a healthy way of living. - Social Services Provider Maintaining a healthy lifestyle, with access to nutritious food and to exercise opportunities. Education about healthy living and diabetes management. - Social Services Provider Lifestyle and personal choices, heredity, proper care, self and medical attention. - Community/Business Leader Feedback from the community at health fairs, workshops, presentations and area churches. There are approximately 499,200 adults in Indiana who have diabetes. There are approximately 289,500 additional adults in Indiana who have pre-diabetes. - Social Services Provider Number of people diagnosed with diabetes and renal failure. - Other Health Provider Patient compliance. - Other Health Provider Obesity, hypertension, stroke, kidney disease and smoking. - Public Health Representative 15
79 ONLINE KEY INFORMANT SURVEY Mental Health One-half of key informants taking part in an online survey characterized Mental Health as a major problem in the community. Perceptions of Mental Health as a Problem in the Community (Key Informants, 2016) Major Problem Moderate Problem Minor Problem No Problem At All 50.0% 31.3% 15.6% Sources: Notes: PRC Online Key Informant Survey, Professional Research Consultants, Inc. Asked of all respondents. CHALLENGES Among those rating this issue as a major problem, the following represent what key informants see as the main challenges for persons with mental illness: Lack of Resources Areas like ours generally do not have a lot in the way of vast medical resources. Mental health is always going to be an issue in an area like ours. - Community/Business Leader Not enough resources. - Community/Business Leader Lack of services and/or long term assistance - Community/Business Leader Facilities and cost of care at CMHCs. - Other Health Provider Lack of treatment programs, the social stigma and ability to pay. - Community/Business Leader Long-term care. - Physician Lack of treatment facilities and stigma. - Community/Business Leader Mental illness. We have limited resources in the community to treat this need and an underserved population. - Community/Business Leader There are very limited inpatient options for young children under 12, and also limited resources for outpatient counseling services. Many parents report issues. - Community/Business Leader Access, transportation, insurance and co-pays, too few psychiatrists, turnover in the workforce that serves them because of poor pay. Laws that do not address those who refuse service and therefore have poor quality of life. - Social Services Provider Getting consistent and ongoing help, availability, and access to care. - Public Health Representative Lack of Community Support There is a lack of social support for many suffering from mental illness, especially for those who are homeless or at risk of homelessness. - Social Services Provider Good services for monitoring and medication if needed. Getting and keeping a job, family supports, misunderstanding from local authorities, police and sheriff. - Social Services Provider There are so many people with mental health issues who are not supervised or located in an area where they have something to do (work, helping others). They are out wandering the streets or loitering in public places. - Community/Business Leader 16
80 ONLINE KEY INFORMANT SURVEY Biggest challenge is educating the community about mental health and helping to remove the many stigmas that prevent citizens from getting the care they need. Another big challenge is insurance that covers mental health treatment. - Other Health Provider Affordable Care/Services Incidence/Prevalence Denial/Stigma Comorbidities Costs and access. Too few providers. - Physician Ability to pay for treatment, stigma associated with the condition. - Other Health Provider Multiple people with the diagnosis are unable to afford their medications or doctor care. - Public Health Representative The people that come through the program - Other Health Provider We are seeing an increasing number of young children with significant mental health issues. Because of the number of people diagnosed with mental health issues. - Other Health Provider Acknowledgement of having a mental health issue, access to care, awareness of care provided. - Community/Business Leader The negative stigma associated with mental health, which causes families to be in denial, is a challenge. - Social Services Provider Depression, drugs and alcohol abuse, untreated mental conditions and lack of access to stabilizing and maintenance programs, lack of social workers/prevention programs. - Community/Business Leader Addiction and access. - Physician 17
81 ONLINE KEY INFORMANT SURVEY Heart Disease & Stroke Nearly one-half of key informants taking part in an online survey characterized Heart Disease & Stroke as a major problem in the community. Perceptions of Heart Disease and Stroke as a Problem in the Community (Key Informants, 2016) Major Problem Moderate Problem Minor Problem No Problem At All 49.2% 27.1% 11.9% 11.9% Sources: Notes: PRC Online Key Informant Survey, Professional Research Consultants, Inc. Asked of all respondents. TOP CONCERNS Among those rating this issue as a major problem, reasons frequently related to the following: Incidence/Prevalence By testimony of different people that we talk to in our facility. - Social Services Provider Because of the number of people diagnosed with heart and stroke issues. - Other Health Provider Feedback from the community at health fairs, workshops, presentations and area churches. Heart disease/stroke are still responsible for almost one-third of all Indiana deaths and remain a major public health issue. In 2009, 13,442 Indiana residents died. - Social Services Provider The number of people I hear and see with heart problems - Other Health Provider We see many, many people at the YMCA who come in for post-cardiac rehab purposes. Additionally, we have literally had two heart attacks in our building recently. - Community/Business Leader Lifestyle A combination of my prior responses, stressful environment, lifestyle preferences, heredity and everyone knows someone with heart disease and stroke. - Community/Business Leader We are like much of the US, we smoke too much, move too little, eat foods that put us at risk, and have too many with diabetes. - Public Health Representative With a community that is 67% low to moderate income, the eating habits and distance necessary to travel for medical attention plays a huge role in heart disease and stroke. - Community/Business Leader Number one killer. Bad lifestyle choices make the region more prone than other parts of the nation. - Community/Business Leader Comorbidities Smoking, obesity and diabetes. - Public Health Representative Significant occurrence of obesity, risk for heart disease. Significant number of prescriptions filled for anti-hypertensive and antilipemics. - Public Health Representative Obesity rates are high, leading to chronic diseases such as diabetes, heart attacks and strokes. - Community/Business Leader 18
82 ONLINE KEY INFORMANT SURVEY Lack of Specialty Services Vulnerable Populations We do not have a center specializing in this area and many in Northwest Indiana end up in Chicago for treatment. - Community/Business Leader My students have parents and grandparents being hospitalized for heart disease and stroke. I find it interesting that almost all of them find the medical care they need in South Bend, Indianapolis, or in Chicago. They do not trust the hospitals here. - Community/Business Leader Data suggests these are major concerns, especially among persons of color. - Other Health Provider Gary is a predominately African American community and African Americans have high incidences of high blood pressure and diabetes which lead to heart disease and strokes. - Community/Business Leader Leading Cause of Death Environmental Issues Health Education Heart disease is the number one killer of all people. - Social Services Provider Number one cause of death. - Social Services Provider Number of deaths from these diseases. - Community/Business Leader The effects of the regional environment as well as a lack of knowledge that it is a number one killer. - Community/Business Leader Not enough knowledge by patients - Community/Business Leader 19
83 ONLINE KEY INFORMANT SURVEY Cancer The greatest share of key informants taking part in an online survey characterized Cancer as a major problem in the community. Perceptions of Cancer as a Problem in the Community (Key Informants, 2016) Major Problem Moderate Problem Minor Problem No Problem At All 45.2% 38.7% 9.7% 6.5% Sources: Notes: PRC Online Key Informant Survey, Professional Research Consultants, Inc. Asked of all respondents. TOP CONCERNS Among those rating this issue as a major problem, reasons frequently related to the following: Incidence/Prevalence Number of people diagnosed with cancer in our community. - Other Health Provider Impacts a large part of our population. Smoking remains high, as does other unhealthy life choices. Limited treatment resources. Expensive cost of care. - Community/Business Leader The number of people affected. - Community/Business Leader Statistics indicate the prevalence of various types of cancer in the community. - Other Health Provider Based on incidence and the number of people seeking treatment. High incidence of smoking endemic in this area. Also, reports on a number of people that actually go to Chicago for care. - Physician Number of people affected. - Other Health Provider A high percentage of the people in this community are affected by this problem. - Social Services Provider I talk with a lot of clients or people on the outside with cancer. Plus many have died in the last two years. - Other Health Provider More and more people are being diagnosed. Medical professionals in this area are quick to perform surgery, slow to establish treatment, and begin treatment fight for the attest treatment options. Patients are not as well informed in this community. - Social Services Provider Feedback from the community at health fairs, workshops, presentations and area churches. About 2.4 million Indiana residents, or 2 in 5 people, now living in Indiana, will eventually develop cancer. - Social Services Provider It seems a large population suffers with it. - Social Services Provider Seems to me more and more people have cancer and we are spending billions on research. People are living longer with cancer, but we do not seem to be any closer to a cure than we were 20 years ago. - Community/Business Leader Multiple people with the diagnosis. - Public Health Representative 20
84 ONLINE KEY INFORMANT SURVEY Environmental Issues Our legacy and current industrial and agricultural toxins exposure. Behavioral health issues within the region, not high on health consciousness and prevention. Everyone knows someone with cancer. - Community/Business Leader The incidents of cancer in the community seem to be on the rise. I personally know of more cases, and often these cases seem to be related to the environment like lung cancer in a nonsmoker as opposed personal habits. - Community/Business Leader Access to Care/Services Air quality, tobacco use - Physician Air quality, tobacco use, diet. - Other Health Provider Cancer treatment in the most difficult cases is being focused towards cancer centers specializing in the disease. We don't really have that. - Community/Business Leader There is no Cancer treatment center in NWI. You see advertisement for one in Chicago but nothing for NWI. - Social Services Provider Cancer treatment for young patients seems to fall in a gap between pediatrics and seniors, juveniles in their teens. Where do they go for treatment? - Community/Business Leader The perception is that there are high instances of cancer and low in market solutions for care. - Social Services Provider Leading Cause of Death Without knowing the actual statistics, cancer has to be the number one reason for death in Newton County. The statistics may not indicate it because most times these patients have to re-locate to an area that offers the treatment and care needed. - Community/Business Leader It kills people. - Social Services Provider Young women dying from breast cancer. - Community/Business Leader Prevention We have a high rate of cancer in our community due to lack of healthcare, education, poverty and job resources. This decreases time spent on preventative care. By the time someone seeks medical counseling the disease has already ran its course. - Public Health Representative 21
85 4.8% ONLINE KEY INFORMANT SURVEY Tobacco Use Key informants taking part in an online survey generally characterized Tobacco Use as a major problem in the community. Perceptions of Tobacco Use as a Problem in the Community (Key Informants, 2016) Major Problem Moderate Problem Minor Problem No Problem At All 40.3% 33.9% 21.0% Sources: Notes: PRC Online Key Informant Survey, Professional Research Consultants, Inc. Asked of all respondents. TOP CONCERNS Among those rating this issue as a major problem, reasons frequently related to the following: Incidence/Prevalence Used to Mask Stress Vulnerable Populations Smoking is common among NWI residents. - Social Services Provider Almost all of our clients smoke. - Social Services Provider Want to believe it is trending down but still a major health issue in our community. - Community/Business Leader Many smokers. - Public Health Representative Number of people diagnosed as tobacco dependent by the ISDH Tobacco Cessation Commission. - Other Health Provider Look around, a fourth of the cars on the road are driven by smokers. NWI has much higher prevalence of tobacco use than the national average. - Community/Business Leader High incidence of smokers entering the healthcare system, observed high density of smoking. - Physician It just is, all you have to do is look around. - Community/Business Leader We are the highest ranked city for tobacco use in Porter County. Lots of shift workers from the mills and trade jobs smoke. - Community/Business Leader Because I can see people every day entering my building having this dependency on tobacco. - Social Services Provider Ease of access and life stresses. - Other Health Provider Easily accessible, still has a sexy or calming connotation. - Community/Business Leader People turn to tobacco to help deal with the stress in their lives. - Social Services Provider I don't know why, I just know it is, especially with pregnant women. - Public Health Representative 22
86 ONLINE KEY INFORMANT SURVEY Comorbidities Major comorbidity in our population. - Physician Leading Cause of Death Death rate from related cancer is extremely high. - Other Health Provider 23
87 ONLINE KEY INFORMANT SURVEY Dementias, Including Alzheimer s Disease Key informants taking part in an online survey equally characterized Dementias, Including Alzheimer s Disease as a major problem and a moderate problem in the community. Perceptions of Dementia/Alzheimer's Disease as a Problem in the Community (Key Informants, 2016) Major Problem Moderate Problem Minor Problem No Problem At All 39.7% 39.7% 19.0% Sources: Notes: PRC Online Key Informant Survey, Professional Research Consultants, Inc. Asked of all respondents. TOP CONCERNS Among those rating this issue as a major problem, reasons frequently related to the following: Aging Population Incidence/Prevalence As population ages this is becoming more of a problem. The cost of dementia care is out of reach for most people. - Public Health Representative Because of the aging population in the area and the number of people diagnosed. - Other Health Provider Baby boomers are getting older and due to the large number of people in that age group, the influx of dementia. Alzheimer's disease is prevalent. - Social Services Provider Aging population base of region with longer lifespans means an increasing part of the population will experience these issues. - Community/Business Leader More and more people are living longer and it is a disease that affects mainly older people. - Community/Business Leader We have an aging population and to the extent that the onset of dementia is caused by aging, we are at risk. Further, research has found a correlation between the general health of individuals and Alzheimer's. At risk populations. - Community/Business Leader Aging population, lack of behavioral health resources. Physician Anecdotal information points to an increase in persons presenting with these conditions. - Other Health Provider All of my answers in this survey are from my experience with the students at Merrillville High School and their families. The answers are all pointed to what my students or their families share with me. Students are living with grandparents. - Community/Business Leader The number of elder/not so old people I meet with dementia/alzheimer's. - Other Health Provider There is no known cure and you hear more and more of families that are dealing with family members. - Social Services Provider Feedback from the community at health fairs, workshops, presentations and area churches. It 24
88 ONLINE KEY INFORMANT SURVEY Health Education is estimated that 1 in 10 persons over 65 and roughly half of those over 85 have AD. In Indiana as of 2010, 120,000, increased by 20% since Social Services Provider There is very little knowledge of the disease in the community and even less knowledge of where to go to get treatment. In some cultures it is not discussed. - Community/Business Leader There is still not enough known about this disease. - Community/Business Leader Numbers of individuals aging and those with special needs especially. Not enough education or outreach in this area. Outside of family members or staff, no one to really help. - Social Services Provider Access to Care/Services This area has be become highly specialized and is difficult to treat in an area that does not have a center specializing in it. - Community/Business Leader FQHC - Public Health Representative 25
89 ONLINE KEY INFORMANT SURVEY Injury & Violence The largest share of key informants taking part in an online survey characterized Injury & Violence as a major problem in the community. Perceptions of Injury and Violence as a Problem in the Community (Key Informants, 2016) Major Problem Moderate Problem Minor Problem No Problem At All 39.3% 32.8% 24.6% Sources: Notes: PRC Online Key Informant Survey, Professional Research Consultants, Inc. Asked of all respondents. TOP CONCERNS Among those rating this issue as a major problem, reasons frequently related to the following: Incidence/Prevalence Culture of Violence Our social services deal with this problem at least once every week. - Social Services Provider Based on Gary crime statistics, news and media and conversations with consumers. - Other Health Provider See it firsthand. - Physician The violent crime statistics for this area indicate this is a major problem. - Other Health Provider Number of deaths and injuries. - Community/Business Leader It occurs. It is not openly addressed out of both fear and ignorance. - Physician Access to guns and people's responses to situations are of an aggressive and often violent nature. - Community/Business Leader Gary, East Chicago, Hammond and Chicago. Students are incarcerated for felonies, including murder in our area and with this black lives matter and Beyoncé's militant half time show, students don't understand the balance of government. - Community/Business Leader Though crime rates are down, violence is still a large part of our environment, rape, domestic violence, murder and bullying. All a sign of the frustration of poverty, poor educational opportunities and lack of access to many things. - Social Services Provider Lots of shootings and killings in the area. - Social Services Provider High number of shootings and violence, spilling over from gangs/drug trade, especially as a result of having high crime Chicago in our backyard. - Community/Business Leader Poverty Poverty and lack of education, and jobs are a major issue - Community/Business Leader Poverty, lack of education, gangs and guns. - Public Health Representative Trauma Centers We do not have a level 1 or Level 2 trauma center in Northwest Indiana. Our people end up 26
90 ONLINE KEY INFORMANT SURVEY Domestic Violence being transported out of the area for treatment of serious injuries. - Community/Business Leader Domestic abuse is a big issue for many who come for our services. Many others have lost loved ones to violence. - Social Services Provider 27
91 5.2% ONLINE KEY INFORMANT SURVEY Infant & Child Health Key informants taking part in an online survey most often characterized Infant & Child Health as a moderate problem in the community. Perceptions of Infant and Child Health as a Problem in the Community (Key Informants, 2016) Major Problem Moderate Problem Minor Problem No Problem At All 27.6% 37.9% 29.3% Sources: Notes: PRC Online Key Informant Survey, Professional Research Consultants, Inc. Asked of all respondents. TOP CONCERNS Among those rating this issue as a major problem, reasons frequently related to the following: Affordable Care/Services Infant Mortality Parental Involvement Health Education Lack of funds and education for young parents. - Community/Business Leader I believe that the cost for things like this for young mothers is unaffordable or they are unaware of any kind of help for them. - Social Services Provider Lack of financial resources for many families. - Community/Business Leader Number of children living in poverty and low income households not receiving adequate wellchild checkups. - Community/Business Leader In , I worked at the IUPUI public opinion lab and we conducted a survey on prenatal health. The issue at the time was that Lake County was #1 in the state for infant mortality. It is devastating that this ranking has not changed in all these years. - Community/Business Leader Feedback from the community at health fairs, workshops, presentations and area churches. Indiana's infant mortality rate was 7.7 deaths per 1,000 live births, well below the Healthy People 2010 goal of 6.0 deaths per 1,000 live births. - Social Services Provider Indiana is in the bottom 20% on infant mortality rates for the country. The 7 county area of NWI have higher than average rates as well. - Social Services Provider Children in NW Indiana are more and more being raised by grandparents or foster homes. The lack of vested interest here increases the chances for infant and child health to take a back seat. Grandparents cannot afford proper medical care. - Community/Business Leader We served many single mothers with this problem. - Social Services Provider Lack of awareness of preventative health interventions. - Other Health Provider Young uneducated parents - Community/Business Leader 28
92 ONLINE KEY INFORMANT SURVEY Respiratory Disease The greatest share of key informants taking part in an online survey characterized Respiratory Disease as a moderate problem in the community. Perceptions of Respiratory Diseases as a Problem in the Community (Key Informants, 2016) Major Problem Moderate Problem Minor Problem No Problem At All 23.7% 45.8% 18.6% 11.9% Sources: Notes: PRC Online Key Informant Survey, Professional Research Consultants, Inc. Asked of all respondents. TOP CONCERNS Among those rating this issue as a major problem, reasons frequently related to the following: Environmental Issues Asthma especially in childhood, air quality issues especially in summer, smoking, industrial and agricultural toxin exposure. - Community/Business Leader Our air quality has improved over the last 20 years, but the amount of people with respiratory problems increases. - Community/Business Leader Leading Cause of Death Pollution of the mills and other industrial companies. - Social Services Provider Environment we live in. - Community/Business Leader Smoking and pollution. - Public Health Representative Non-cancerous lung ailments are the third leading cause of death in the region, having claimed 7,014 lives throughout Lake, Porter and LaPorte counties between 1999 and Social Services Provider 29
93 ONLINE KEY INFORMANT SURVEY Chronic Kidney Disease Key informants taking part in an online survey generally characterized Chronic Kidney Disease as a moderate problem in the community. Perceptions of Chronic Kidney Disease as a Problem in the Community (Key Informants, 2016) Major Problem Moderate Problem Minor Problem No Problem At All 23.6% 32.7% 29.1% 14.5% Sources: Notes: PRC Online Key Informant Survey, Professional Research Consultants, Inc. Asked of all respondents. TOP CONCERNS Among those rating this issue as a major problem, reasons frequently related to the following: Incidence/Prevalence Comorbidities Vulnerable Populations Feedback from the community at health fairs, workshops, presentations and area churches. The number of dialysis centers in our communities. It is estimated that more than 10% of adults in the United States, more than 20 million people have CKD. - Social Services Provider The number of people I see at the transfusion center. - Other Health Provider Number of people on dialysis. - Community/Business Leader The number of people diagnosed with renal failure. - Other Health Provider Several dialysis clinics in the region. Demographics of those more likely to develop. - Community/Business Leader Due to high blood pressure and other chronic diseases, kidney disease is on the rise. - Social Services Provider A number of people have diabetes and high blood pressure issues. Left unchecked, these diseases can cause major issues with a person's kidneys because a number of people do not have their diabetes and high blood pressure under control. - Community/Business Leader In my local community, there is a high incidence of kidney disease related to diabetes and high blood pressure, the latter of which has higher rates of occurrence in African American communities. - Community/Business Leader Greater prevalence in African American population. Results from hypertension and diabetes, which are severe problems also. - Community/Business Leader Because it is. High proportion of African-Americans, prevalence of hypertension and diabetes. - Public Health Representative 30
94 ONLINE KEY INFORMANT SURVEY Access to Care/Services This area is rather specialized and those with severe cases end up in places that specialize in the area. - Community/Business Leader Nutrition Non-Healthy food choices in the community and poverty. - Public Health Representative 31
95 ONLINE KEY INFORMANT SURVEY Access to Healthcare Services Key informants taking part in an online survey frequently characterized Access to Healthcare Services as a moderate problem in the community. Perceptions of Access to Healthcare Services as a Problem in the Community (Key Informants, 2016) Major Problem Moderate Problem Minor Problem No Problem At All 23.4% 40.6% 23.4% 12.5% Sources: Notes: PRC Online Key Informant Survey, Professional Research Consultants, Inc. Asked of all respondents. TOP CONCERNS Among those rating this issue as a major problem, reasons frequently related to the following: Lack of Resources The communities are growing at a rapid pace and the hospitals/emergency care units aren't able to keep up. Doctors aren't always accepting new patients. And as the communities grow, transportation is becoming an even bigger problem. - Social Services Provider We do not have a level two or level one trauma center in Northwest Indiana. Most people I know end up in Chicago or Indianapolis for treatment of very serious conditions. - Community/Business Leader Lack of a coordinated system for assessment, follow-up and supportive services for chronic disease, aftercare treatment and elderly care. - Other Health Provider Elder services. - Community/Business Leader Cancer treatment. There seems to not be enough access to cancer treatment. - Community/Business Leader You would be hard-pressed to find another county that is as under served in medical accessibility, to include prevention, counseling, treatment and care, as Newton County, Indiana. The obvious lack of a hospital and several of the towns. - Community/Business Leader Primary care for Indiana and Illinois patients. - Physician Affordable Care/Services Lack of insurance, underinsured, transportation, co-pays and deductibles. - Social Services Provider Health Insurance, nutritional food options, access to medication, mental health and adequate housing. - Public Health Representative Insurance, Income - Other Health Provider Not enough people with adequate, affordable insurance coverage. - Other Health Provider Money, insurance coverage. - Community/Business Leader Information and affordability. - Other Health Provider 32
96 ONLINE KEY INFORMANT SURVEY Transportation Lack of Providers Transportation and health care coverage - Community/Business Leader Public transportation limits mobility. Poor benefits for working poor limits ability to pay, barriers posed by lack of Medicaid expansion, despite HIP Public Health Representative Need many more physicians for primary care and Psychiatry. - Other Health Provider TYPE OF CARE MOST DIFFICULT TO ACCESS Key informants (who rated this as a major problem ) most often identified primary care, mental health care, chronic disease care, and substance abuse treatment as the most difficult to access in the community. Most Difficult to Access Second-Most Difficult to Access Third-Most Difficult to Access Total Mentions Primary Care 23.1% 18.2% 18.2% 7 Mental Health Care 15.4% 18.2% 27.3% 7 Chronic Disease Care 23.1% 18.2% 0.0% 5 Substance Abuse Treatment 7.7% 18.2% 18.2% 5 Elder Care 7.7% 9.1% 9.1% 3 Specialty Care 7.7% 9.1% 0.0% 2 Prenatal Care 0.0% 9.1% 9.1% 2 Dental Care 0.0% 0.0% 18.2% 2 Severe Trauma Care 7.7% 0.0% 0.0% 1 Urgent Care 7.7% 0.0% 0.0% 1 33
97 ONLINE KEY INFORMANT SURVEY Oral Health Key informants taking part in an online survey most often characterized Oral Health as a moderate problem in the community. Perceptions of Oral Health as a Problem in the Community (Key Informants, 2016) Major Problem Moderate Problem Minor Problem No Problem At All 21.7% 41.7% 23.3% 13.3% Sources: Notes: PRC Online Key Informant Survey, Professional Research Consultants, Inc. Asked of all respondents. TOP CONCERNS Among those rating this issue as a major problem, reasons frequently related to the following: Affordable Care/Services The cost of taking care of your teeth is out of control. - Community/Business Leader Lack of insurance and the high cost of dental care. Transportation. - Social Services Provider Access to and affordability of care. High rates of smoking. - Public Health Representative No emergency access for poor. Physician Many children without resources for appropriate dental hygiene. Physician Lack of Providers One of the biggest issues, lack of provider. - Community/Business Leader Incidence/Prevalence By what I see every day here in my facility. - Social Services Provider 34
98 ONLINE KEY INFORMANT SURVEY Sexually Transmitted Diseases Two-fifths of key informants taking part in an online survey characterized Sexually Transmitted Diseases as a moderate problem in the community. Perceptions of Sexually Transmitted Diseases as a Problem in the Community (Key Informants, 2016) Major Problem Moderate Problem Minor Problem No Problem At All 14.5% 40.0% 30.9% 14.5% Sources: Notes: PRC Online Key Informant Survey, Professional Research Consultants, Inc. Asked of all respondents. TOP CONCERNS Among those rating this issue as a major problem, reasons frequently related to the following: Incidence/Prevalence Unprecedented levels. - Physician The number of people diagnosed with sexually transmitted diseases. - Other Health Provider Health Education Again no education in schools. - Public Health Representative Vulnerable Populations Rates among children and minorities. - Community/Business Leader 35
99 ONLINE KEY INFORMANT SURVEY HIV/AIDS The largest share of key informants taking part in an online survey characterized HIV/AIDS as a minor problem in the community. Perceptions of HIV/AIDS as a Problem in the Community (Key Informants, 2016) Major Problem Moderate Problem Minor Problem No Problem At All 14.3% 33.9% 37.5% 14.3% Sources: Notes: PRC Online Key Informant Survey, Professional Research Consultants, Inc. Asked of all respondents. TOP CONCERNS Among those rating this issue as a major problem, reasons frequently related to the following: Incidence/Prevalence Number of people diagnosed with HIV/AIDS. - Other Health Provider There is a rising cause of HIV/AIDs in heterosexual women, especially African American women. - Social Services Provider Drug Use Drug use, risky behavior. - Other Health Provider HIV Trauma HIV trauma. - Other Health Provider 36
100 ONLINE KEY INFORMANT SURVEY Family Planning Key informants taking part in an online survey largely characterized Family Planning as a moderate problem in the community. Perceptions of Family Planning as a Problem in the Community (Key Informants, 2016) Major Problem Moderate Problem Minor Problem No Problem At All 13.3% 45.0% 25.0% 16.7% Sources: Notes: PRC Online Key Informant Survey, Professional Research Consultants, Inc. Asked of all respondents. TOP CONCERNS Among those rating this issue as a major problem, reasons frequently related to the following: Health Education Teenage Pregnancy Birth Outcomes I think too few people understand the concept of family planning - Community/Business Leader I have taught at North Newton High School for over twenty five years and lived in the community my entire life. In my opinion, family planning and overall parenting skill are very much needed. - Community/Business Leader Not enough education in Lake County. Individuals still experiencing unexpected pregnancy and not recognizing the impact on them, the family and the economy. - Social Services Provider No real education in schools. - Public Health Representative Teenage pregnancy. Just this morning, a 7 month pregnant girl approached a teacher about what to do about the baby. She passed on an abortion but was very scared. The teacher had her talk to another teacher who just adopted a baby a year ago. - Community/Business Leader The number teens and young adult with children and not wanting them. - Other Health Provider We have the highest number of low birth weight and miscarriages in the region. - Public Health Representative 37
101 ONLINE KEY INFORMANT SURVEY Hearing & Vision Slightly more key informants taking part in an online survey characterized Hearing & Vision as a minor problem than a moderate problem in the community. Perceptions of Hearing and Vision as a Problem in the Community (Key Informants, 2016) Major Problem Moderate Problem Minor Problem No Problem At All 12.1% 36.2% 37.9% 13.8% Sources: Notes: PRC Online Key Informant Survey, Professional Research Consultants, Inc. Asked of all respondents. TOP CONCERNS Among those rating this issue as a major problem, reasons frequently related to the following: Incidence/Prevalence There are lots of people that have these conditions and they aren't always dealt with because of financial issues. - Social Services Provider Access to Care/Services The number of people diagnosed with hearing and vision problems. - Other Health Provider Not sure how far you would have to travel to find the closest facility to address these conditions. - Community/Business Leader Lack of access in primary Ophthalmology services, especially emergent. - Physician 38
102 ONLINE KEY INFORMANT SURVEY Immunization & Infectious Diseases The greatest share of key informants taking part in an online survey characterized Immunization & Infectious Diseases as a moderate problem in the community. Perceptions of Immunization and Infectious Diseases as a Problem in the Community (Key Informants, 2016) Major Problem Moderate Problem Minor Problem No Problem At All 10.5% 42.1% 35.1% 12.3% Sources: Notes: PRC Online Key Informant Survey, Professional Research Consultants, Inc. Asked of all respondents. TOP CONCERNS Among those rating this issue as a major problem, reasons frequently related to the following: Access to Care/Services Health Education Incidence/Prevalence School-aged children most times travel out of the county to be immunized. Older adults travel to clinics or urgent care to fight infectious diseases. - Community/Business Leader Lack of awareness and access for all sectors of the community. - Other Health Provider Immunizations are a hot issue nationwide and parents are not appropriately informed as to the benefits and risks of them. As they affect young people, there needs to be programs in schools for students to learn to identify/care for diseases. - Community/Business Leader The number of people diagnosed. - Other Health Provider 39
103 ONLINE KEY INFORMANT SURVEY Arthritis, Osteoporosis & Chronic Back Conditions Most key informants taking part in an online survey characterized Arthritis, Osteoporosis & Chronic Back Conditions as a moderate problem in the community. Perceptions of Arthritis/Osteoporosis/Back Conditions as a Problem in the Community (Key Informants, 2016) Major Problem Moderate Problem Minor Problem No Problem At All 8.8% 57.9% 21.1% 12.3% Sources: Notes: PRC Online Key Informant Survey, Professional Research Consultants, Inc. Asked of all respondents. TOP CONCERNS Among those rating this issue as a major problem, reasons frequently related to the following: Incidence/Prevalence Aging Population Feedback from the community at health fairs, workshops, presentations and area churches. - Social Services Provider Personally know of several citizens that are on disability benefits due to arthritis and major back conditions. - Community/Business Leader Number of folks I see with some type of immobility in limbs. - Community/Business Leader Too many people suffering with this. - Community/Business Leader I believe this condition is affecting the growing aging population in my community. Additionally, I believe this condition affects people who have an accident and gunshot victims. - Other Health Provider 40

104 Resources
105 ONLINE KEY INFORMANT SURVEY Resources Available to Address the Significant Health Needs The following represent potential measures and resources (such as programs, organizations, and facilities in the community) available to address the significant health needs identified in this report. This list is not exhaustive, but rather outlines those resources identified in the course of conducting this Community Health Needs Assessment. Access to Healthcare Services 211 Affordable Health Care Act Community Care Network Community HealthNet Department of Children Services Dial-A-Ride FQHC Grocery Store HealthLinc Healthcare Systems HIP 2.0 Housing Authority Indiana Child Protective Services Legislators Marram Health Clinic Mental Health Facilities Methodist Hospital Navigators Newton County Ambulance Service Newton County Counseling of Aging Newton County Drug Coalition Newton County Step Ahead Program NorthShore Health Centers Porter Regional Hospital Porter Starke Services SHIP Social Workers Sojourner Truth House St. Mary Medical Center State Health Insurance Programs Township Trustee Arthritis, Osteoporosis & Chronic Back Conditions Cancer Community HealthNet Doctor's Office Hospitals American Cancer Society Cancer Health Treatment Centers Cancer Resource Center Cancer Support Centers Cancer Treatment Centers of America Cancer Wellness Center Chicago Teaching Hospitals Community Health of Munster Community HealthNet Community Hospital Doctor's Office Educational Resources FQHC Franciscan Alliance Hospice Hospitals HPV Immunizations IUN Medical School IWIN Foundation Marram Health Clinic Media Methodist Hospital Non-Profits NorthShore Health Centers Northwest Indiana Hospitals Northwest Indiana Oncology Pink Ribbon Society Porter Regional Hospital 42
106 ONLINE KEY INFORMANT SURVEY Primary Care Rush University Medical Center St. Catherine's Hospital St. Franciscan Hospital St. Mary Medical Center Support Groups The Salvation Army University of Chicago Hospital Chronic Kidney Disease Chicago Teaching Hospitals DaVita Comprehensive Renal Care Demand Response Transit Systems Dialysis Clinics Doctor's Office FQHC Fresenius Dialysis Hospitals IUN Medical School Media Methodist Hospital Northwest Indiana Hospitals Northwest Indiana Nephrology Association Primary Care Dementias, Including Alzheimer s Disease Active Day Alzheimer's Association Alzheimer's Foundation Assisted Living Facilities Bureau of Developmental Disabilities Colleges/Universities Community HealthNet Doctor's Office FQHC Hospitals Long-Term Care Facilities Media Mental Health Facilities Methodist Hospital Northwest Indiana Community Diabetes Action Primary Care Rush University Medical Center SCH Behavioral Health Senior Citizen Facilities Bridges to Wellness Chicago Teaching Hospitals Community HealthNet Community Hospital System Diabetes.org Doctor's Office Educational Resources Endocrinology Centers in NWI Fitness Centers/Gyms FQHC Franciscan Alliance Hospitals IU Health IUN Medical School Media Methodist Hospital MHS, Hoosier Insurance Non-Profits NorthShore Health Centers Northwest Indiana Hospitals One Region Health Committee Payment Structures for Medications/Devices Porter Regional Hospital Primary Care Purdue Extension St. Anthony's Hospital St. Catherine's Hospital St. Mary Medical Center The Salvation Army Wellness Programs YMCA Family Planning Zumba Classes Birthright Doctor's Office FQHC Maternal Health Clinic 43
107 ONLINE KEY INFORMANT SURVEY Northwest Indiana Healthy Start Nurse Partners Hearing & Vision Parents as Teachers Planned Parenthood Doctor's Office Moses Eye Care Heart Disease & Stroke HIV/AIDS Ambulance Services American Heart Association Cardiology Associates of Northwest Indiana Chicago Teaching Hospitals Community HealthNet Community Hospital Doctor's Office Fitness Centers/Gyms Franciscan Alliance Heart Institute Hospitals IUN Medical School Media Methodist Hospital Northwest Cardiovascular Physicians Northwest Indiana Hospitals Porter Regional Hospital Primary Care St. Catherine's Hospital St. Mary Medical Center YMCA Aliveness Project Community HealthNet Immunization & Infectious Diseases Community HealthNet Doctor's Office Healthcare Systems Infant & Child Health Activists Community Care Network Coroner County Services Vaccines Doctor's Office Health Department HealthLinc Hospitals Legislators Maternal Child Health Network Non-Profits NorthShore Health Centers Northwest Indiana Healthy Start School System WIC YMCA Injury & Violence Mental Health Boys and Girls Club Churches Crime Tracker Maps Domestic Violence Shelters Edgewater Behavioral Health Services Expanded Neighborhood Watch Efforts Gary for Life Initiative Gary Police Department Geminus Fathers Program Haven House Hospitals Lake County Sheriff's Department Legislators Level One Trauma Care in Oak Lawn Mental Health Facilities Methodist Hospital Police Department Project Outreach and Prevention on Youth Violence Sojourner Truth House CMHCs 44
108 ONLINE KEY INFORMANT SURVEY Colleges/Universities Community HealthNet Community Hospital Doctor's Office Edgewater Behavioral Health Services Edgewater Systems for Balanced Living Employers Faith Based Institutions FQHC Increased Funding From State and Federal Governments IUN Medical School Media Mental Health Facilities Methodist Hospital Mirram Health Care Pharmacy Police Department Porter Starke Services Primary Care Regional Health Clinics Regional Mental Health Center Special Services Court St. Catherine's Hospital St. Margaret Dyer Hospital Wabash Nutrition, Physical Activity & Weight Anytime Fitness Boys and Girls Club Bridges to Wellness City Government Community Center Community Health System Bariatric Center Community HealthNet Department of Children Services E.C. Fitness Center Employers Fitness Centers/Gyms Food Pantry Franciscan Health Care Bariatric Program Healthcare Systems Hospitals Oral Health Hudson Campbell Fitness Center Legislators Local Government Media Multicultural Wellness Network MOTTEP Newton County Step Ahead Program Northwest Indiana Food Pantry Omni Fitness Parks and Recreation Primary Care Purdue Extension School System St. Catherine's Hospital St. Margaret Dyer Hospital The Salvation Army Township Trustee Travel Teams YMCA Community HealthNet NorthShore Health Centers Respiratory Diseases Hospitals Medical Equipment Suppliers Primary Care Pulmonary Specialists of Northwest Indiana Sexually Transmitted Diseases Community HealthNet Doctor's Office Hospitals NorthShore Health Centers Planned Parenthood School System Substance Abuse AA/NA Capital City Center for Addiction Recovery 45
109 ONLINE KEY INFORMANT SURVEY Colleges/Universities Court System Edgewater Behavioral Health Services Edgewater Systems for Balanced Living Employers Empower Porter County Frontline Foundation Grace Beyond Borders Healthcare Systems HIDTA Hospitals Media Mental Health Facilities Methodist Hospital Newton County Drug Coalition Non-Profits Northwest Indiana Treatment Center Police Department Porter County Substance Abuse Treatment Center Porter Regional Hospital Porter Starke Services Primary Care Purdue Extension Regional Health Clinics Regional Mental Health Center School System St. Catherine's Hospital Tobacco Use St. Mary Medical Center The Salvation Army Turning Point Community HealthNet Doctor's Office Edgewater Behavioral Health Services Geminus Fathers Program Hospitals Increased Taxes on Tobacco Indiana Quit Line ISDH Tobacco Cessation Commission Lake County Tobacco Cessation Coalition Local Government Media Newton County Drug Coalition Porter County Tobacco Cessation Porter Starke Services Primary Care Regional Health Clinics School System Smoking Ban in Public Spaces Smoking Cessation Programs Strict Enforcement of Underage Smoking Laws 46
110 Overview St. Mary Medical Center 2016 Community Health Needs Assessment Implementation Plan The hospitals of the Community Healthcare System Community Hospital, St. Catherine Hospital and St. Mary Medical Center - conducted a Community Health Needs Assessment in 2016 with cooperation from all area not-for-profit hospitals. The purpose of this study was to gather quantitative and qualitative data to identify major health challenges in our community. The full Community Health Needs Assessment can be found on each hospital s website. The 2016 Implementation Plan builds on the progress and changing healthcare needs of the communities served by St. Mary Medical Center. It takes into account the findings of both the 2013 and 2016 Community Health Needs Assessments that examines the challenges and opportunities for addressing health disparities and improving the quality of life for the residents we serve. The Community Health Needs Assessment gathered quantitative and qualitative data to pinpoint major health challenges and set a baseline for improvement in our communities. While our community continues to lag in a number of important health measures, there were noted improvements from the 2013 study. Efforts to improve access to care, educate the community about health and wellness opportunities and increase preventative screenings are having a positive effect on the health of the community. The 2016 Implementation Plan builds on these strategies and considers new ones to drive further improvements. St. Mary Medical Center Service Area/CHNA identified areas of opportunity for health improvement: Access to Health Services Cancer Chronic Kidney Disease Diabetes Heart Disease & Stroke Injury & Violence Prevention Maternal, Infant & Child Health Family Planning Mental Health & Mental Disorders & Substance Abuse Nutrition, Physical Activity & Weight Unemployment & Job Training Substance Abuse Tobacco Use In developing these programs to improve the health of the community, each hospital will draw upon its broad base of physicians and allied health professionals, as well as the expertise of
111 other hospitals and entities within the Community Healthcare System and throughout the community-at-large. St. Mary Medical Center has established important partnerships with several community-based organizations to create a stronger network of access across its service areas. Our hospital entered into a new medical collaboration with the Valparaiso YMCA, expanding the hospital s reach in Porter County increasing the communities access to preventive screenings, health education, and outpatient services. The addition of a Cancer Care Services manager improved collaboration with the American Cancer Society and cancer related organizations. This position and additional efforts allowed us to increase offerings of free cancer screenings, specifically in the areas of colon cancer, skin cancer and ovarian cancer, while also promoting growth in lung cancer and breast cancer screening opportunities. The hospital s Quality Care Navigation program continues to coordinate care for patients across disciplines and beyond hospital walls, ensuring access to needed services and medical care continues once patients leave the hospital. These efforts should ultimately improve disease management and mortality rates, specifically in the identified areas of cancer and heart disease. Addressing Community Needs The 2016 report shows some gains since 2013 CHNA, we continue to strive to achieve the goals identified in the Healthy People 2020 initiatives (HP 2020). For that reason, our hospital will continue to focus on the following priority areas: Diabetes, Heart Disease & Stroke, Nutrition & Weight Status and Maternal, Infant & Child Health and Cancer. All of these areas have a common link to modifiable lifestyle risk factors, education and access to medical services. Key issues of concerns according to area residents and key community informants differed significantly from the 2013 survey in certain critical areas. Access to care was an issue that had been dominant three years ago. Since 2013, St. Mary Medical Center has established a health clinic located within Hobart High School that serves to provide primary health care needs for the entire Hobart community. In 2016, key leaders that were interviewed are now focused on substance abuse. Other areas of concern include diabetes, obesity, heart disease, health education and prevention. These areas align with the focus areas chosen. In targeting these areas for health improvement, the hospitals will seek to: Align and enhance resources to focus on these health issues Develop partnerships and collaborations for outreach screening and education initiatives and to target at-risk populations Expand best practice efforts through the primary care setting, in particular, our employed and Community Healthcare Partner (CHP) physicians Seek additional opportunities to achieve our goals Leverage our resources to provide services by partnering with other community groups and seek grant funding 2
112 Community Health Needs: Other areas of concern The Community Health Needs assessment conducted by the hospitals of the Community Healthcare System identified some areas of concern not identified in our hospital s implementation plan. These areas include: St. Mary Medical Center Service Area/CHNA identified areas of opportunity: Access to Health Services Chronic Kidney Disease Injury & Violence Prevention Mental Health & Mental Disorders Substance Abuse Many of these areas are being addressed by the hospitals of the Community Healthcare System as well as by other community organizations. For example, Community Healthcare System supports a large cancer program with a separate research foundation focused on improving access to clinical trials for area residents as well as providing free support and mind-body services through its Cancer Resource Centre. All hospitals are very active in providing routine, low-cost and free screening programs for a variety of cancers including colon, breast, and lung cancers. There is focused attention on mental health, and growing awareness to address mental illness, trauma and stress. All of our Community Healthcare System hospitals utilize the behavioral health program at St. Catherine Hospital which recently added an Older Adult Behavioral Health Services unit to its Adult BHS Unit, and also opened an outpatient treatment center in Portage and St. John. As the hospital focuses on lifestyle, education, prevention and access to care issues surrounding its four focus areas, positive outcomes will likely have positive effects on the health needs not addressed. To have the greatest impact, however, the hospital has chosen to focus on four of the most serious health conditions and the related lifestyle issues facing our community. We are encouraged by the improvements documented in heart and stroke related issues as well as diabetes. We will continue to strategize and create a variety of means to address nutrition/obesity and infant and maternal health, specifically targeting those residents at highest risk for these issues. This plan is a living document that is flexible and adaptable as these areas of concern improve or decline. We maintain a nimble approach to support the needs of the community as priorities change. We will continue to track activities related to our community initiatives and report on our efforts on an ongoing basis. [See Attachment.] Diabetes Diabetes is becoming a major health challenge in our community as well as our country. There is a growing concern that the increase in the number of people diagnosed with Type 2 Diabetes and the complexity of their care might overwhelm existing healthcare systems. Diabetes lowers 3
113 life expectancy up to 15 years, increases the risk of heart disease 2 to 4 times and is the leading cause of kidney failure, non-traumatic lower limb amputations and adult-onset blindness. St. Mary Medical Center s service area reported gains in age-adjusted death rates for Diabetes from the 2013 survey. Opportunities to improve continue as current rates remain higher than rates for the state, nation and our Healthy People 2020 goals. To address Diabetes in our community, we will continue to build upon some innovative approaches that have been used within our healthcare system, such as the education and screening programs that have been carried out at area churches, for example. Since 2013, we have implemented increased education and support with an expanded calendar of Diabetes management education (led by our Certified Diabetes Educator) at our hospital, Portage YMCA and Valparaiso Health Center locations. Our Health and Wellness nurse at the Portage YMCA also includes Diabetes awareness information in the LAUNCH program for elementary school children. Early identification and prevention will be key strategies to stem the rise in early onset of Type 2 Diabetes, so offering free or discounted A1C screenings as well as access to medical professionals within the community will be important. Lifestyle change has also been proven effective in preventing or delaying the onset of Type 2 Diabetes in high risk individuals. We will continue to provide increased education and support to assist individuals, and children, in making these important lifestyle changes which will also positively impact rates for heart disease and obesity in our community as well. Health Challenge: High Death Rates for Diabetes Why: Reasons for health challenge: diabetes is underdiagnosed; there are high blood sugar rates in adults; more preventive care is needed; and there is poor disease management among adults with diabetes. Long-Term Measurement: Goal: HP 2020 Death Rate:* (revised down from 19.6 in the 2013 CHNA). Current: 2016 St. Mary Medical Center s CHNA Diabetes Death Rate: Change from 2013: Diabetes death rate in SMMC service area IMPROVED from 30.4 (2013) to 25.3 (2016). *Death Rate is age-adjusted deaths per 100,000 population. 4
114 ACTIVITIES/HOSPITAL PROGRAM: In order to address the identified community health need, we will accomplish the following activities: OUTPUTS: Once accomplished, these activities will produce the following evidence or service delivery: PROGRESS FROM 2013 SURVEY & MEASUREMENTS: Identify improvement or changes from 2013 and actions that will support achieving our HP 2020 goal: Provide measurement standards: IMPACT: If accomplished, we expect these activities will lead to the following changes in public health conditions in our service area by 2020: Increase number of A1C Screenings and nurse encounters to help identify diabetes symptoms Identify more adults at risk for diabetes; Assist them in getting appropriate education or medical intervention Finger stick glucose screenings have been discontinued as accepted screening measure. There are added opportunities for free or discounted A1C screenings to the community. Measurement: Number of adults receiving A1C screenings and encounters with clinical staff at public venues: Number of individuals identified with high A1C levels; provided follow-up information Decrease mortality rate of adults with diabetes to HP 2020 rate of 16.1 (revised down from 19.6). Hold Ongoing Diabetes Awareness Events Increase awareness of diabetes signs and symptoms; Identify accessible health services and resources available for those with diabetes We have developed and implemented wide-ranging efforts to bring Diabetes awareness to the community. Diabetes awareness is a prominent part of our Stroke Awareness Fairs two held annually held at the Portage Y and one at our hospital. We also held awareness events at the senior centers in Portage and Hobart, as well as at the community health fair in Valparaiso s Shorewood subdivision. We will continue these activities and add events as resources allow. With the addition of the Valparaiso YMCA partnership, we will add events and expand educational opportunities beyond those already mentioned such as expanding a highly successful program conducted by our Decrease mortality rate of adults with diabetes to HP 2020 rate of 16.1 (revised down from 19.6). 5
115 ACTIVITIES/HOSPITAL PROGRAM: In order to address the identified community health need, we will accomplish the following activities: OUTPUTS: Once accomplished, these activities will produce the following evidence or service delivery: PROGRESS FROM 2013 SURVEY & MEASUREMENTS: Identify improvement or changes from 2013 and actions that will support achieving our HP 2020 goal: Provide measurement standards: IMPACT: If accomplished, we expect these activities will lead to the following changes in public health conditions in our service area by 2020: Diabetes educator with 5 th Graders in the School City of Hobart. We plan to expand this best practice with the Valparaiso YMCA regarding pre-diabetes education. We have also provided Diabetes awareness resources to our senior health fairs, stroke fairs and other ongoing health events. Expand Diabetes Education Classes to the Public Provide education and information to adults to better manage their disease Offer classes at additional locations such as Valparaiso YMCA and perhaps business locations Measurement: Number of events/programs where diabetes education/resources are made available. Number of attendees at these events Since 2013, we expanded the availability of classes to include the Valparaiso Health Center and Portage Township YMCA. With the new partnership at the Valparaiso YMCA, we will expand to offer classes there as well. Additional opportunities to explore for public diabetes education opportunities will include working with area organizations such as churches, neighborhood associations or others who may be interested in hosting classes for their members. Decrease mortality rate of adults with diabetes to HP 2020 rate of 16.1 (revised down from 19.6). Measurement: Number of classes offered Number of attendees at classes 6
116 ACTIVITIES/HOSPITAL PROGRAM: In order to address the identified community health need, we will accomplish the following activities: OUTPUTS: Once accomplished, these activities will produce the following evidence or service delivery: PROGRESS FROM 2013 SURVEY & MEASUREMENTS: Identify improvement or changes from 2013 and actions that will support achieving our HP 2020 goal: Provide measurement standards: IMPACT: If accomplished, we expect these activities will lead to the following changes in public health conditions in our service area by 2020: Certified Diabetes Educator/Physician Partnership Build relationships with physicians taking care of diabetes patients, especially primary care physicians Provide all inpatient Diabetes patients information on outpatient diabetes education program We have distributed diabetes education information in all Community Care Network physician offices, and will reach out to our Community Healthcare Partner providers as well. Health & Wellness nurses will make inperson visits with physicians to ensure documents and class schedules are provided to appropriate patients. Through our partnership with the Portage, and Valpo YMCAs, we are facilitating physician referrals of appropriate patients into the Valparaiso YMCA s, year-long Diabetes Prevention Program. Decrease mortality rate of adults with diabetes to HP 2020 rate of 16.1 (revised down from 19.6). Measurement: Number of physicians visited Number of patients referred for education Offer Pre-Diabetes Education in Workplaces and Public Venues Provide free prediabetes education classes to adults-at-risk. Over the past few years, our Business Development Director has formed relationships with area businesses and organizations to bring health and wellness resources to the workplace. We are working with Urschel Labs to bring monthly Lunch-and-Learns for employees to learn about diabetes and related issues. We are also working to bring prediabetes education to the Valpo Y 7
117 ACTIVITIES/HOSPITAL PROGRAM: In order to address the identified community health need, we will accomplish the following activities: OUTPUTS: Once accomplished, these activities will produce the following evidence or service delivery: PROGRESS FROM 2013 SURVEY & MEASUREMENTS: Identify improvement or changes from 2013 and actions that will support achieving our HP 2020 goal: Provide measurement standards: IMPACT: If accomplished, we expect these activities will lead to the following changes in public health conditions in our service area by 2020: staff, and working with Occupational Health and New Healthy Me as they work with area businesses to provide services as well. We are continuing to pursue these opportunities with businesses, schools, municipalities, and others on an ongoing basis. Measurement: Number of programs completed Number of attendees at each program Seek grant funding to support diabetes and education awareness efforts Secure funding and complete implementation of additional diabetes educational programs in schools, work or public venues Opportunities may present from various foundations and funding sources may be available to sponsor or support specific initiatives, particularly for high-risk groups or school-aged children. Measurement: Number and description of grant funding pursued or secured. Decrease mortality rate of adults with diabetes to HP 2020 rate of 16.1 (revised down from 19.6). Heart Disease & Stroke Heart Disease is still the leading cause of death and thus represents our community s number one health challenge. As with diabetes, St. Mary Medical Center s service area saw significant improvement in age-adjusted death rates. However, they still remain higher compared to those of the state and the nation. Although closely related, St. Mary Medical Center s service area death rates for Stroke improved from 2013, and are favorable to the state rate. However, we remain above the death rates identified nationally and for the HP 2020 goals. 8
118 Heart Disease and Stroke are among the most preventable of all the leading causes of death and present some of our best opportunities for improving the health of our community. The risk of developing and dying from cardiovascular disease would be substantially reduced with improvements in diet and physical activity, control of high blood pressure and cholesterol and smoking cessation. To address Heart Disease and Stroke in our community, we will continue to involve a number of hospital clinics and departments that have been active with our cardiovascular patient population. Increased screening, education and support for making lifestyle changes will be key components of our health improvement activities. Health Challenge: Heart Disease and Stroke Death Rates Why: Causes include: high blood pressure & cholesterol rates; timely treatment; poor diet & physical activity. Long-Term Measurement: Heart Disease: Goal: HP 2020 Heart Disease Death Rate for Adults: Current: 2016 SMMC CHNA Heart Disease Death Rate: Stroke: Goal: HP 2020 Stroke Death Rate for Adults: Current: 2016 SMMC CHNA Stroke Death Rate: Change from 2013: Heart Disease Death Rate for Adults in SMMC Service area IMPROVED from (2013) to (2016). Stroke Death Rate for SMMC service area IMPROVED from 41.0 (2013) to 39.2 (2016). ACTIVITIES/HOSPIT AL PROGRAM: In order to address the identified community health need, we will accomplish the following activities: OUTPUTS: Once accomplished, these activities will produce the following evidence or service delivery: PROGRESS FROM 2013 SURVEY & MEASUREMENTS: Identify improvement or changes from 2013 and actions that will support achieving our HP 2020 goal: Provide measurement standards: IMPACT: If accomplished, we expect these activities will lead to the following changes in public health conditions in our service area by 2020: Offer Heart Screening Programs at a Discounted Rate Provide blood lipid panel, blood pressure checks and health assessments to detect heart disease at Discounted blood profile screenings are offered quarterly at our hospital locations. Free blood profiles are offered at our Stroke Symposium and several community health fairs throughout the year. Free blood pressure screenings are routinely offered at all appropriate community events, our hospital, our Decrease the mortality rate of adults due to heart disease in our service area to the HP 2020 rate of Decrease the 9
119 ACTIVITIES/HOSPIT AL PROGRAM: In order to address the identified community health need, we will accomplish the following activities: OUTPUTS: Once accomplished, these activities will produce the following evidence or service delivery: PROGRESS FROM 2013 SURVEY & MEASUREMENTS: Identify improvement or changes from 2013 and actions that will support achieving our HP 2020 goal: Provide measurement standards: IMPACT: If accomplished, we expect these activities will lead to the following changes in public health conditions in our service area by 2020: Public Blood Pressure Screenings earlier stages Refer patients into appropriate behavior modification programs Offer blood pressure screenings routinely at the Portage YMCA, Valpo YMCA and community health fairs to educate and manage risk of heart disease and heart failure partner YMCAs and participating physician offices throughout the community. Results are reported to individuals and, when appropriate, follow-up instructions are provided to those with abnormal results. Measurement: Number of profiles completed Number of patients with abnormal results contacted and provided followup instructions As mentioned above, blood pressure screenings are provided on regularly scheduled days by our Portage YMCA Health & Wellness Nurse. Since 2013, we ve expanded our Health & Wellness offerings through our partnership at the Valpo and Hobart YMCAs, where we provide routine screenings. Our wellness team provides screenings at various locations throughout the community including senior centers community and church health fairs. Measurement: Number of locations/events where blood pressure screenings are provided with approximate number of individuals who received screenings. mortality rate for Stroke to HP 2020 rate of 33.8 Decrease the mortality rate of adults due to heart disease in our service area to the HP 2020 rate of Decrease the mortality rate for Stroke to HP 2020 rate of 33.8 Educate community on risk factors of heart disease and stroke and ways to decrease these Offer public education symposiums and health fairs on heart/vascular Our Hearts of Hope campaign was expanded to include a Heart Health Fair component as well as a physician presentation relevant to cardiac issues for the public. Decrease the mortality rate of adults due to heart disease in our service area to the HP 2020 rate of
120 ACTIVITIES/HOSPIT AL PROGRAM: In order to address the identified community health need, we will accomplish the following activities: OUTPUTS: Once accomplished, these activities will produce the following evidence or service delivery: PROGRESS FROM 2013 SURVEY & MEASUREMENTS: Identify improvement or changes from 2013 and actions that will support achieving our HP 2020 goal: Provide measurement standards: IMPACT: If accomplished, we expect these activities will lead to the following changes in public health conditions in our service area by 2020: factors and what to do when symptoms develop disease related topics Explore partnerships with Heart Association and other outside organizations to offer heart health education and programs A broad range of Stroke education programs are held on a routine basis. Our annual Stroke Symposium continues to be a success since its inception in 2010; a Stroke Awareness Day at the Portage YMCA was added; and we will be replicating the program at the Valpo YMCA. We have also visited Town of Highland to present on the risks of heart disease; and will make this educational information available to other municipalities in our service area. We will continue to explore additional opportunities for stroke awareness and education through these partnerships We will also continue our well-attended physician presentations throughout the year focusing on cardiac health. We plan to continue to participate in the American Heart Association and American Stroke Association sponsored events/fundraisers, and explore additional opportunities with other community organizations. In 2015, we expanded our educational offerings to the public related to structural and congenital heart defects with the addition of a cardiologists specializing in this area. Our hospital has the capacity to perform many of these more complex procedures. Decrease the mortality rate for Stroke to HP 2020 rate of 33.8 Measurement: Number of SMMC sponsored heart and stroke fairs offered throughout the year; Number of attendees; 11
121 ACTIVITIES/HOSPIT AL PROGRAM: In order to address the identified community health need, we will accomplish the following activities: OUTPUTS: Once accomplished, these activities will produce the following evidence or service delivery: PROGRESS FROM 2013 SURVEY & MEASUREMENTS: Identify improvement or changes from 2013 and actions that will support achieving our HP 2020 goal: Provide measurement standards: IMPACT: If accomplished, we expect these activities will lead to the following changes in public health conditions in our service area by 2020: List of locations throughout our service area where symposiums, fairs and education sessions are held Measurement: Number of collaborative events SMMC participates in Number of participants at these events Peripheral Arterial Disease (PAD) Screenings Offer monthly PAD screenings for a minimal fee Offer free PAD screenings in accordance with Legs for Life campaign Offer access to free PAD screenings at community venues Since 2013, we have maintained the level of PAD screenings offered monthly at our Cardiopulmonary Rehabilitation location. As we expand our Phase III cardiac rehab services at the Valpo YMCA during 2016, we anticipate offering monthly, discounted PAD screenings at that location as well. We offer free PAD screenings at the Portage Senior Health Fair, the Shorewood Health Fair and at the Portage YMCA. We will expand these free opportunities as staff and resources allow. We continue to offer free PAD screenings annually in accordance with the Legs for Life campaign. Decrease the mortality rate of adults due to heart disease in our service area to the HP 2020 rate of Decrease the mortality rate for Stroke to HP 2020 rate of 33.8 Measurement: Number of PAD screenings completed Number of individuals identified for follow-up care Number of opportunities when PAD screens are offered Quality Care Coordination (QCC) Program Provide patientfocused support through QCC The QCC program continues to grow. We have identified that assisting staff in skilled nursing facilities, where many cardiac patients are referred after hospitalization, Decrease the mortality rate of adults due to heart disease in our service 12
122 ACTIVITIES/HOSPIT AL PROGRAM: In order to address the identified community health need, we will accomplish the following activities: OUTPUTS: Once accomplished, these activities will produce the following evidence or service delivery: PROGRESS FROM 2013 SURVEY & MEASUREMENTS: Identify improvement or changes from 2013 and actions that will support achieving our HP 2020 goal: Provide measurement standards: IMPACT: If accomplished, we expect these activities will lead to the following changes in public health conditions in our service area by 2020: program that efficiently, effectively, and proactively manages clinical and quality outcomes for patients across a continuum of care is vital to helping them effectively recognize early symptoms and proactive treatment of recurring or new heartrelated issues. This is particularly important for patients with Heart Failure. After implementing the discharge phone calls, and continuing necessary home visits for high-risk patients, we have been able to recognize potential health issues with patients, earlier than before, improving the likelihood of a positive patient outcome. area to the HP 2020 rate of Decrease the mortality rate for Stroke to HP 2020 rate of 33.8 Vascular Screening Program QCNs lead a team of clinical case managers and social workers to collaboratively help patients obtain the best possible outcomes in their care Offer routine, low-cost vascular screening program to the public to cover stroke/carotid; PAD; AAA, and heart rhythm Measurement: Number of SNF visits for staff training Number of follow-up calls to patients Percentage of readmission for cardiacrelated issues We have developed and successfully implemented a program for low-cost vascular screenings available at our outpatient locations in Hobart, Portage and Valparaiso. We will maintain or add dates of these low cost screenings each year as staff and resources allow. Measurement: Number of individuals receiving screenings Number of individuals identified with abnormal readings and referred for follow-up care Decrease the mortality rate of adults due to heart disease in our service area to the HP 2020 rate of Decrease the mortality rate for Stroke to HP 2020 rate of
123 ACTIVITIES/HOSPIT AL PROGRAM: In order to address the identified community health need, we will accomplish the following activities: OUTPUTS: Once accomplished, these activities will produce the following evidence or service delivery: PROGRESS FROM 2013 SURVEY & MEASUREMENTS: Identify improvement or changes from 2013 and actions that will support achieving our HP 2020 goal: Provide measurement standards: IMPACT: If accomplished, we expect these activities will lead to the following changes in public health conditions in our service area by 2020: Number of screening opportunities held Locations of screening opportunities in SMMC service area Cardiopulmonary Rehabilitation Exercise program for recovering heart disease patients that monitors vitals and includes education. The program conditions patients to a higher level of cardiac and pulmonary function Implement Mended Hearts support group for patients recovering from heart related procedures Since 2013, our cardiopulmonary rehabilitation program continues to see strong growth and participation among patients. Many patients continue with Phase III in our Hobart location. With our new Valpo Y partnership, we will expand Phase III opportunities before 2017 to include additional Porter County residents. The Mended Hearts support group was implemented and continues to grow, providing important motivation, hope and emotional support to patients recovering from heart related procedures. We look to continue growth in this program that supports more positive outcomes for cardiac surgery patients. Measurement: Number of patient served in Cardiopulmonary Rehabilitation; outcomes Number of patients who continue in Phase III Number of patients served in the Valpo Y program Number of patients participating in the Mended Hearts program Decrease the mortality rate of adults due to heart disease in our service area to the HP 2020 rate of Decrease the mortality rate for Stroke to HP 2020 rate of 33.8 Nutrition & Weight Status 14
124 In the 2016 Community Health Needs Assessment for Lake and Porter County, survey participants identified obesity as one of the top three health problems affecting their community. In Lake County, the obesity rate for adults was higher than those in Porter County, the state and the nation. The childhood obesity rate in our service area was not identified during the 2016 CHNA, however, we know that addressing obesity issues early in life will likely enhance the ability to combat adult obesity. Addressing Nutrition and Weight Status enables us to take a proactive role in helping to prevent conditions such as Heart Disease, Stroke and Diabetes. Reaching that patient population before they develop disease also represents a challenge that will require us to reach out and continue to forge new partnerships in the community. Diet and body weight are certainly related to health status and effective changes in these two areas may lead to the greatest impact we can make on the health of our community. Nearly 80 percent of respondents in our 2016 survey recognize that unhealthy diet and exercise habits contribute to the issue of obesity in their communities. Nearly 45 percent cite lack of knowledge about nutrition and inadequate access to nutritious foods such as fruits and vegetables as an issue. Individuals will need to have the knowledge and skills to make healthier choices and these healthier options need to be both available and affordable. Programs such as our successful New Healthy Me employee wellness program and other initiatives with school children may be expanded to reach more people with both education and support to address individual behaviors. We will also partner with schools, worksites and community health organizations to address policies and help create positive environments in these settings that support healthy behaviors. Educational opportunities and access to bariatric professionals through our Healthy 4 Life program provide opportunities for obese/overweight individuals to seek assistance in weight loss. Continued education and promotion of obesity as a complex condition may help destigmatize the disease, encouraging these individuals to explore weight loss options, who may not otherwise have done so. Health Challenge: Poor Nutrition & Weight Status Why: Causes of this health challenge include: not enough servings fruits & vegetables; high percentage of obese adults and children; lack of physical activity. Long-Term Measurement: HP 2020 Obesity Rate for Adults: 30.5 / Children: 14.5 St. Mary Medical Center s CHNA Obesity Rates for Adults: Lake Co. 35.5/Porter Co. 30.6; Children: N/A Change from 2013: On average, the Obesity Rate for Adults in for Lake & Porter County WORSENED from 33.1 (2013) to 35.5/Lake County; 30.6/Porter (2016). The Adult Obesity Rate in Porter County is only (30.6), nearly ACHIEVING the HP 2020 goal (30.5.) We will continue to address this issue in both counties as part of our service area. 15
125 ACTIVITIES/HOSPITAL PROGRAM: In order to address the identified community health need, we will accomplish the following activities: OUTPUTS: Once accomplished, these activities will produce the following evidence or service delivery: PROGRESS FROM 2013 SURVEY: Identify improvement or changes from 2013 and actions that will support achieving our HP 2020 goal: Provide measurement standards: IMPACT: If accomplished, we expect these activities will lead to the following changes in public health conditions in our service area by 2020: Free exercise consultation for obese children referred to nutritional counseling Target the child and family in discussions about increasing physical activity Secure routine BMI measurements of children through school and day care programs. Use lunchtimes to invite families to participate in healthy meals with their children The LAUNCH program, carried out by the Portage Y and our Health & Wellness Nurse, includes fitness and nutrition activities throughout the curriculum. We expect to continue the LAUNCH program and expand to offer a version at the Valpo Y child care program and at two additional elementary schools in Portage. We are also are in discussion to offer a form of the program at the Porter County Boys and Girls clubs. With the establishment of our Brickie Community Health Clinic, a nurse practitioner at the Hobart High School is available to families and school nurses throughout the School City of Hobart. Reduce the rate of obesity among adults to HP2020 rate of 30.6 / for children: 14.6 Our goal is to gather BMIs of children at least four times a year through collaboration with school nurses, day care centers, and summer camps, and encourage their participation in exercise and fitness opportunities. Measurements: Number of collaborations with schools and children s organizations Number of children screened 16
126 ACTIVITIES/HOSPITAL PROGRAM: In order to address the identified community health need, we will accomplish the following activities: OUTPUTS: Once accomplished, these activities will produce the following evidence or service delivery: PROGRESS FROM 2013 SURVEY: Identify improvement or changes from 2013 and actions that will support achieving our HP 2020 goal: Provide measurement standards: IMPACT: If accomplished, we expect these activities will lead to the following changes in public health conditions in our service area by 2020: for BMI Number of children receiving nutritional counseling/exercise sessions. Hold educational seminars Provide information about specific dietary and lifestyle challenges encountered by overweight individuals Provide a variety of educational opportunities to increase engagement and participation Our Healthy 4 Life program continues to offer weight loss seminars in both Hobart and Valparaiso. Staff routinely offers BMI screening at health fairs throughout the year. We have held educational sessions in partnership with the Portage and Valpo YMCAs as well as community organizations on such topics as grocery store navigations; managing appetite and healthy substitutions. We will continue to offer weight loss seminars in a variety of locations and will soon implement online webinars to help engage obese individuals who shy away from public events or who lack transportation. Reduce the rate of obesity among adults to HP2020 rate of 30.6 / for children: 14.6 Measurement: Number of seminars and educational presentations offered to the public both on site and through webinars Number of attendees Number of patients enrolling in our weight loss programs Expand Teaching Garden concept and healthy eating Partner with schools and support funding Since 2013, we have continued the concept of the promoting nutrition education and healthy 17
127 ACTIVITIES/HOSPITAL PROGRAM: In order to address the identified community health need, we will accomplish the following activities: OUTPUTS: Once accomplished, these activities will produce the following evidence or service delivery: PROGRESS FROM 2013 SURVEY: Identify improvement or changes from 2013 and actions that will support achieving our HP 2020 goal: Provide measurement standards: IMPACT: If accomplished, we expect these activities will lead to the following changes in public health conditions in our service area by 2020: opportunities of supplies and material to continue teaching gardens Work with schools to provide curriculum and volunteers to maintain gardens Provide healthy food options to hospitalsponsored events and locations eating opportunities through our partnerships with the YMCAs and the completion of the Healthy Roots program collaboration with Taltree Arboretum. The concept is being further developed through the day care and summer camp programs of our partner YMCAs. We will explore additional opportunities as we work with area school systems on a variety of health education and wellness programs as resources allow. Our hospital s Food & Nutrition department offers healthy food options such as hummus, infused water, Meatless Mondays, baked chips and veggie burgers on a regular basis. They also include these healthy options when providing refreshments for our hospitalsponsored health fairs, symposiums and education seminars for the public. Measurements: Number of programs implemented that feature gardening/growing fruits and vegetables Number of children attending 18
128 ACTIVITIES/HOSPITAL PROGRAM: In order to address the identified community health need, we will accomplish the following activities: OUTPUTS: Once accomplished, these activities will produce the following evidence or service delivery: PROGRESS FROM 2013 SURVEY: Identify improvement or changes from 2013 and actions that will support achieving our HP 2020 goal: Provide measurement standards: IMPACT: If accomplished, we expect these activities will lead to the following changes in public health conditions in our service area by 2020: New Healthy Me program Employee wellness program offered to all CHS employees Expand program availability to local businesses and industry Working in collaboration with our Occupational Health Department and Business Development, we have expanded New Healthy Me to several businesses and organizations throughout Lake and Porter Counties. Will continue to promote and implement New Healthy Me in the future. Reduce the rate of obesity among adults to HP2020 rate of 30.6 / for children: 14.6 Measurement: Number of CHS employees enrolled Number of businesses signing up for NHM Seek grant funding to support health and fitness and nutrition education initiatives Secure funding and complete implementation of additional educational programs in schools, work or public venues Not previously identified in 2013, we recognize that opportunities from various foundations and funding sources may be available to sponsor or support specific initiatives, such as the Fit Trip program, particularly for high-risk groups or school-aged children. Reduce the rate of obesity among adults to HP2020 rate of 30.6 / for children: 14.6 Measurement: Number and description of grant funding pursued or secured. 19
129 Maternal, Infant & Child Health For this initiative, all three of the hospitals intend to collaborate on a strategies to lower the Infant Mortality rate, a key measure of the health of our region. By leveraging resources and building upon new and existing partnerships, this initiative will support community-based programs to keep our children safe before their first birthday. Lake County continues to have one of the highest Infant Mortality rates in the state. Infant deaths and premature births create significant costs and care issues for our community, the healthcare system and our families. The high infant mortality rate continues to be a challenge for our community and thus merits ongoing interventions. This comes amid heightened focus on Safe-to-Sleep teaching practices for new moms in our Family Birthing Centers. The Birthing Centers at all of the three hospitals introduced the HALO SleepSack to newborn babies years ago, and all provide new mothers a HALO SleepSack to take home with them. This initiative, along with education and modeling of safe sleep practices will continue to address the issue of Sudden Unidentified Infant Deaths (SUIDS). St. Mary Medical Center was also selected to be among the first five hospitals in the state to serve as a pilot in achieving in Baby-Friendly Hospital designation which promotes breastfeeding exclusively while in the hospital and encouraging mothers to continue exclusive breast feeding for the baby s first six months of life. Since then, all three Community Healthcare System hospitals are working toward Baby Friendly designation. By coming together, the hospitals share information on their own interventions, clinical practices and examine evidencebased programs that affect maternal, infant and child health. Another initiative, the Nurse-Family Partnership for Lake County, is being implemented through our partner hospital, St. Catherine Hospital, in an effort improve health outcomes for new mothers in low-income areas. The Nurse-Family Partnership is being made possible by a $2 million state grant, and teaches motherhood skills and includes weekly visits until the baby is 2 years old. Health Challenge: Infant Mortality & Low Birth Weight Why: access to prenatal care, low-weight births, knowledge of SUIDS risk factors Long-Term Measurement: HP 2020 Infant Death Rate: 6.0 St. Mary Medical Center s CHNA Infant Death Rate: Lake County: 8.4/Porter County: 4.5. Change from 2013: The total average of Lake and Porter County Infant Death Rates in the SMMC Service area IMPROVED from 7.5 (2013) to 6.45 (2016). Like obesity, however, there is a significant disparity between the Infant Death Rate in Lake County vs. Porter County. Porter County s Infant Death Rate (4.5) is already below the HP 2020 goal (6.0). Lake County s rate (8.4) is significantly ABOVE the HP 2020 goal, as well as the state and national rates. 20
130 ACTIVITIES/HOSPITAL PROGRAM: In order to address the identified community health need, we will accomplish the following activities: OUTPUTS: Once accomplished, these activities will produce the following evidence or service delivery: PROGRESS FROM 2013 SURVEY: Identify improvement or changes from 2013 and actions that will support achieving our HP 2020 goal: Provide measurement standards: IMPACT: If accomplished, we expect these activities will lead to the following changes in public health conditions in our service area by 2020: Health fairs to increase awareness of support programs for pregnant women and of the Nurse- Family Partnership program in Lake County Improve participation in available support programs Offer new and low-income mothers the support they need to get prenatal care and foster skills that will promote a successful relationship with their new baby. Since 2013, St. Mary Medical Center staff has participated and offered information at the March of Dimes fundraising walks, attended our inaugural Extraordinary Women s Conference, and works collaboratively with FQHCs and our physician providers to help ensure women have access to resources for a healthy pregnancy, particularly in the first trimester and at birth. The Nurse-Family partnership provides new mothers the tools they need to improve outcomes and help them access proper pre-and postnatal care until baby is 2 years old. Reduce the infant mortality rate to correlate with HP 2020 rate of 6.0. Increase the percentage of women who receive prenatal care in the first trimester. Measurement: Number of events where healthy pregnancy information is distributed Number of women receiving care through FQHC partnership Number of women enrolled in Nurse-Family Partnership program Prevention of early elective C-sections Ensure mothers have St. Mary Medical Center and our partner hospitals of the Reduce the infant mortality rate to 21
131 ACTIVITIES/HOSPITAL PROGRAM: In order to address the identified community health need, we will accomplish the following activities: OUTPUTS: Once accomplished, these activities will produce the following evidence or service delivery: PROGRESS FROM 2013 SURVEY: Identify improvement or changes from 2013 and actions that will support achieving our HP 2020 goal: Provide measurement standards: IMPACT: If accomplished, we expect these activities will lead to the following changes in public health conditions in our service area by 2020: information and support they need to prevent elective C- sections prior to 39-weeks Community Healthcare System have adopted this goal to ensure unborn babies have optimal time to grow and develop in-utero prior to birth. Our hospital rate for women undergoing elective C- sections before 39 weeks has been zero since We will continue to communicate and provide support to our providers to maintain this standard of care in the coming years. correlate with HP 2020 rate of 6.0. Measurement: Number of deliveries per year Number of elective C- sections before 39-weeks Lactation Services Promote breastfeeding and provide oneon-one assistance for new moms Provide postdelivery support with discharge phone calls, and lactation support follow-up consultation as needed Distribute breastfeeding Since 2013, St. Mary Medical Center was selected as a pilot hospital to begin the Baby Friendly Initiative to promote exclusive breast feeding among new mothers while in the birthing center. The team provides the mother with information promoting the benefits of breastfeeding their infants and encourage exclusive breast feeding throughout the first sixmonths of the baby s life. To help achieve these initiatives our hospital has Reduce the infant mortality rate to correlate with HP 2020 rate of
132 ACTIVITIES/HOSPITAL PROGRAM: In order to address the identified community health need, we will accomplish the following activities: OUTPUTS: Once accomplished, these activities will produce the following evidence or service delivery: PROGRESS FROM 2013 SURVEY: Identify improvement or changes from 2013 and actions that will support achieving our HP 2020 goal: Provide measurement standards: IMPACT: If accomplished, we expect these activities will lead to the following changes in public health conditions in our service area by 2020: information to physician offices to be given out during 2 nd trimester Promote early breastfeeding within 30- minutes after delivery Ensure skin to skin contact for first hour of life Promote rooming-in Increased the hours of our certified lactation consultant from 4 days a week to 5. We also improved the educational materials and information that is distributed to all patients We have implemented additional staff training to ensure 100 percent of new moms delivering have professional advice on the benefits of lactation throughout their stay. We are in the process of initiating Baby Friendly standards to provide at least 3 hours of training in breastfeeding standards to doctors offices. Year-to-date, we have achieved a high rate (greater than 90 percent) for exclusive breastfeeding for women during their hospital stay. That rate is higher than the Joint Commission reported average of 70 percent. We will continue all of the efforts above and will continue to promote roomingin for every baby unless there is a medical necessity. 23
133 ACTIVITIES/HOSPITAL PROGRAM: In order to address the identified community health need, we will accomplish the following activities: OUTPUTS: Once accomplished, these activities will produce the following evidence or service delivery: PROGRESS FROM 2013 SURVEY: Identify improvement or changes from 2013 and actions that will support achieving our HP 2020 goal: Provide measurement standards: IMPACT: If accomplished, we expect these activities will lead to the following changes in public health conditions in our service area by 2020: Measurement: Number of women delivering at our hospital Percent of new moms participating in breastfeeding CLC Lactation Counselor Training & Certification Course Provide leadership and opportunities for training more professionals in lactation consultation certification. St. Mary Medical Center will host the Lactation Consultation Certification course at our hospital in the coming year to train more health professionals in lactation consultation so they can offer it to patients. Reduce the infant mortality rate to correlate with HP 2020 rate of 6.0. Measurement: Number of attendees Number of certifications achieved Behavioral Health Determine how expansion of behavioral health services within Community Healthcare System can be made available to more women at risk We continue to refer to partner hospitals both within our system and in the region to share information and opportunities to obtain services for these patients. Measurement: Number of referrals to Behavioral Health Services from our OB/GYN and Birthing Center Reduce the infant mortality rate to correlate with HP 2020 rate of 6.0. Increase the percentage of women who receive prenatal care in the first trimester. Safe-to-Sleep Program Collaborate with system hospitals on community outreach Our hospital continues to work with our partner hospitals on this initiative. We also always model safe Reduce the infant mortality rate to correlate with HP 2020 rate of
134 ACTIVITIES/HOSPITAL PROGRAM: In order to address the identified community health need, we will accomplish the following activities: OUTPUTS: Once accomplished, these activities will produce the following evidence or service delivery: PROGRESS FROM 2013 SURVEY: Identify improvement or changes from 2013 and actions that will support achieving our HP 2020 goal: Provide measurement standards: IMPACT: If accomplished, we expect these activities will lead to the following changes in public health conditions in our service area by 2020: program that includes retail stores to reach more families with education about proper sleep practices for baby Model safe practices with the use of the HALO Sleep Sack. sleeping techniques and provide instruction to all new mothers in our care. Measurement: Number of deliveries at out hospital Percent of new moms receiving instruction on safe sleeping techniques CANCER: The hospitals of Community Healthcare System have a robust array of services available for cancer patients and those at-risk for cancer. St. Mary Medical Center has invested significantly in improving treatments, addressing survivorship, and providing increased opportunities for free or low-cost screenings. The installation of Northwest Indiana s first TrueBeam radiotherapy system at our hospital in 2015 provided a leap forward in technology that provides faster, more powerful and precise treatment for patients undergoing radiation. As part of Community Healthcare System, our hospital offers discounted, low-dose CT screenings for qualified individuals at-risk for lung cancer. We also offer discounted 3D mammogram screenings during the months of May and October, and all three hospitals now offer a High-Risk Breast Clinic for patients who may be genetically pre-disposed to breast cancer. Our hospital also began offering free screenings for colon cancer, skin cancer, and cervical cancer during annual awareness campaigns. For St. Mary Medical Center communities, the rate of ageadjusted death from cancer reported in the 2013 CHNA was high at However, in the secondary source data used in our 2016 report, Lake County cancer deaths (186.5) and Porter County cancer deaths (174.4) are significantly lower than three years ago, but remain higher than the HP 2020 goal of
135 Cancer is among our leading causes of death and presents one of our greatest opportunities for improving the health of our community. We believe that with awareness, education and early detection and treatment, the risk dying from cancer would be greatly reduced. To address Cancer in our community, we will continue to involve a number of hospital departments, clinics, and partner organizations that are active with the cancer patient population. Increased screening, education and support for making lifestyle changes will be key components of our health improvement activities. Health Challenge: High death rates from Cancer Why: Reasons for health challenge: cancer is underdiagnosed; early detection is necessary; and there is poor disease management. Long-Term Measurement: Goal: HP 2020 Cancer Death Rate for Adults: Current: 2016 SMMC CHNA Cancer Death Rate: Lake County: 186.5/Porter County: Change from 2013: Cancer Death Rate for Adults in SMMC Service area IMPROVED from (2013) to rates in Lake County: and Porter County: in ACTIVITIES/HOSPITAL PROGRAM: In order to address the identified community health need, we will accomplish the following activities: OUTPUTS: Once accomplished, these activities will produce the following evidence or service delivery: PROGRESS FROM 2013 SURVEY: Identify improvement or changes from 2013 and actions that will support achieving our HP 2020 goal: Provide measurement standards: IMPACT: If accomplished, we expect these activities will lead to the following changes in public health conditions in our service area by 2020: Provide multiple screening opportunities to the public Increase the number of individuals receiving cancer screenings Free or discounted cancer screenings are routinely offered at all appropriate community events, our hospital, our partner YMCAs and participating physician offices throughout the community. We also distribute cancer related education and resources at several community health fairs throughout the year. Decrease the mortality rate for Cancer to HP 2020 rate of Results are reported to individuals and, when appropriate, follow-up instructions are provided to those with abnormal results. 26
136 ACTIVITIES/HOSPITAL PROGRAM: In order to address the identified community health need, we will accomplish the following activities: OUTPUTS: Once accomplished, these activities will produce the following evidence or service delivery: PROGRESS FROM 2013 SURVEY: Identify improvement or changes from 2013 and actions that will support achieving our HP 2020 goal: Provide measurement standards: IMPACT: If accomplished, we expect these activities will lead to the following changes in public health conditions in our service area by 2020: Educate the community on cancer awareness, and support services available Offer public education symposiums and health fairs on cancer related topics Explore partnerships with American Cancer Society and other outside organizations to offer cancer prevention education and programs Measurement: Number of events where screenings are provided Number of cancer screenings provided Number of abnormal results referred for follow-up care Our annual Cancer Survivorship Symposium continues to grow and has developed into a unique event focusing on survivorship and caregiver issues. We have also participated in several Cancer awareness and support activities across the healthcare system and through community organizations such as the American Cancer Society. We hold several physician presentations throughout the year on topics such as lung, breast, and colon cancer. Our cancer team continues to participate in community health fairs, and engages in educational presentations throughout Lake and Porter Counties. We will continue to pursue and offer these events as staff and resources allow. Decrease the mortality rate for Cancer to HP 2020 rate of Provide resources for prevention, early detection and Provide smoking cessation classes to the public Measurement: Number of events held Number of participants at events Our hospitals offer free and low-cost smoking cessation courses throughout the year led by a certified American Lung Association Decrease the mortality rate for Cancer to HP 2020 rate of
137 ACTIVITIES/HOSPITAL PROGRAM: In order to address the identified community health need, we will accomplish the following activities: OUTPUTS: Once accomplished, these activities will produce the following evidence or service delivery: PROGRESS FROM 2013 SURVEY: Identify improvement or changes from 2013 and actions that will support achieving our HP 2020 goal: Provide measurement standards: IMPACT: If accomplished, we expect these activities will lead to the following changes in public health conditions in our service area by 2020: treatment of cancer Provide lowdose CT scans of the lungs for high-risk individuals Promote High Risk Breast Clinic for patients at higher-risk for breast cancer instructor. We continue to promote these classes through marketing efforts and our health providers throughout the community. Our Lung Cancer Screening program is available to individuals with a high-risk of developing lung cancer. In 2015, our hospital opened its High Risk Breast Clinic in Hobart and Valparaiso. The clinic is bringing genetic counseling and resources for women who are high-risk for breast cancer. Measurement: Number of Smoking Cessation courses offered Number of individuals completing the Smoking Cessation course Measurement: Number lung cancer screening CT scans completed Number of visits to our High Risk Breast Clinics Quality Commitment: As part of our overall commitment to providing effective strategies that produce meaningful results in improving the health of our community, St. Mary Medical Center continues to strive for excellence in quality, outcomes and service delivery. Since 2013, the hospital, has achieved notable certifications and accolades related to the key focus areas outlined in our 28
138 Implementation Plan, such as: recognition in 2015 by Anthem Blue Cross/Blue Shield as a Blue Distinction Center for Cardiac Care, Maternity Care, and Bariatric Surgery; Healthgrades recognition in 2015 and 2016 for Outstanding Patient Experience; accreditation by the Society of Chest Pain Centers for Cardiovascular Patient Care with PCI; The Joint Commission accreditation as a Primary Stroke Center; Silver Plus Award for Stroke Care from the American Heart/American Stroke Association; accreditation by the American College of Surgeons Commission on Cancer (COC); accreditation by the National Accreditation Program for Breast Centers (NAPBC), designation as a Center of Excellence for Bariatric Surgery (MBSQIP); Women s Choice Award in 2015 for Maternity Care; and many others. The initiatives support the hospital s commitment to embrace best practices and improve the quality of care for our patients and the communities we serve. Attachment: Activities related to our community health initiatives 29
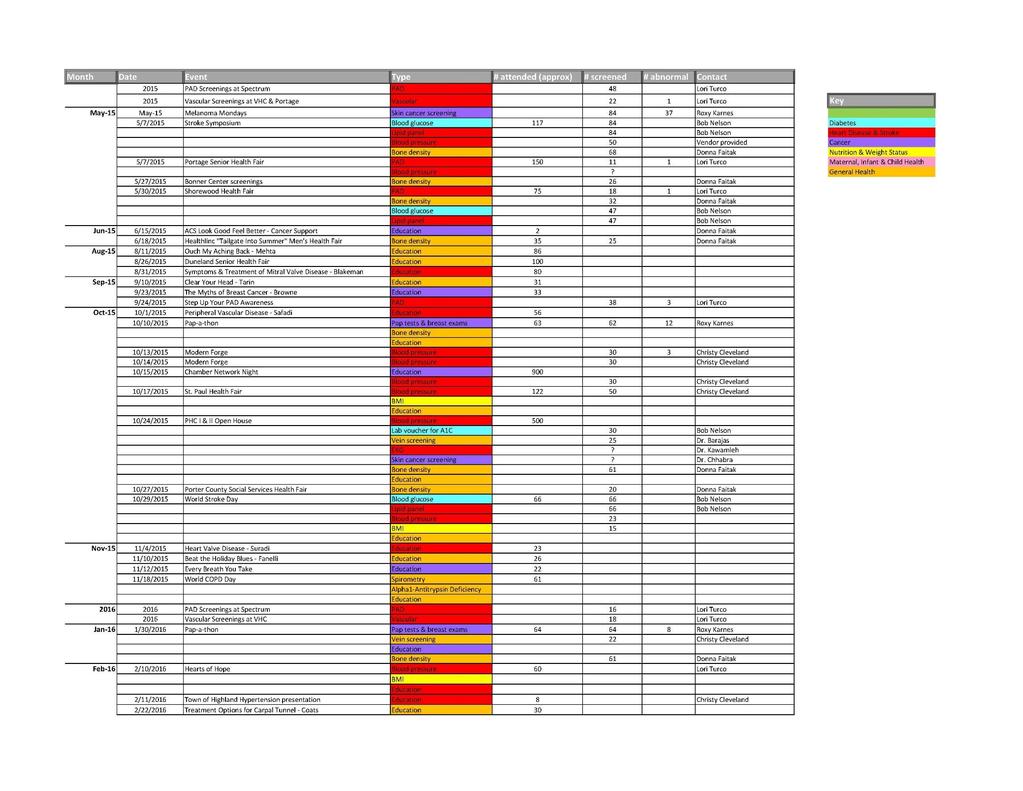
139 30
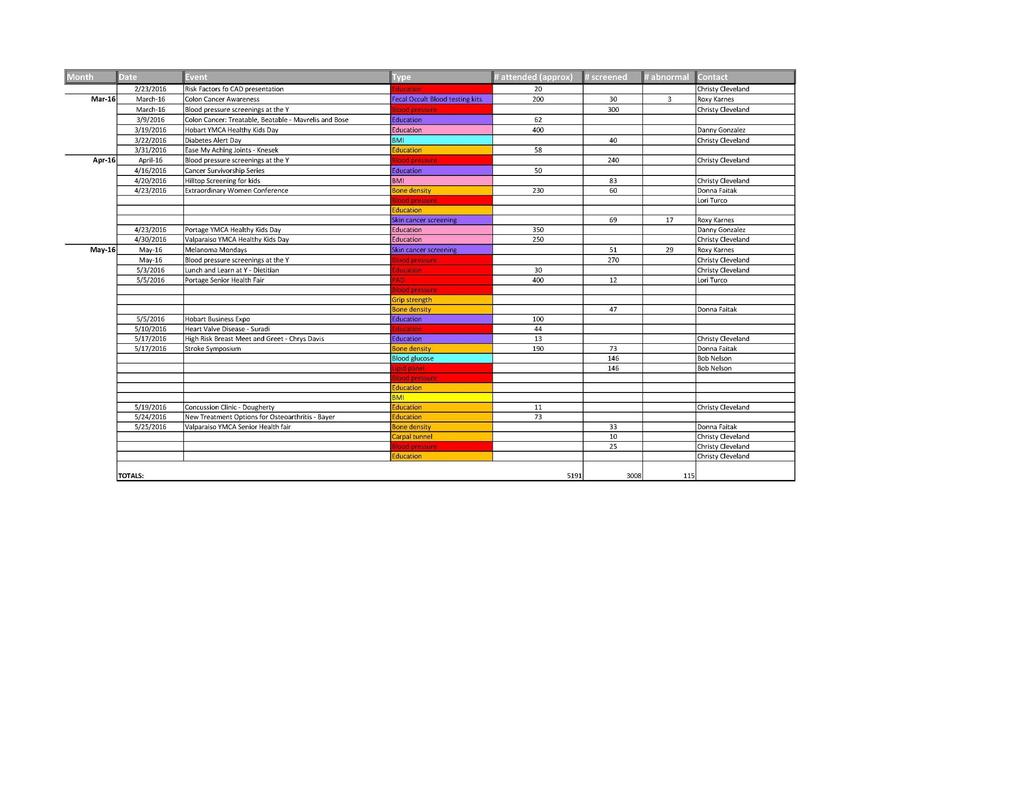
140 31
2012 Community Health Needs Assessment
 2012 Community Health Needs Assessment University Hospitals (UH) long-standing commitment to the community spans more than 145 years. This commitment has grown and evolved through significant thought and
Community Health Needs Assessment
 Community Health Needs Assessment Bollinger County, Missouri This assessment will identify the health needs of the residents of Bollinger County, Missouri, and those needs will be prioritized and recommendations
2015 DUPLIN COUNTY SOTCH REPORT
 2015 DUPLIN COUNTY SOTCH REPORT Reported March 2016 State of the County Health Report The State of the County Health Report provides a review of the current county health statistics and compares them to
Central Iowa Healthcare. Community Health Needs Assessment
 Central Iowa Healthcare Community Health Needs Assessment October 20, 2016 Table of Contents Executive Summary 1 Introduction 3 Summary Observations from Current CHNA 5 Information Sources and Data Collection
BARNES-JEWISH HOSPITAL 2016 COMMUNITY HEALTH NEEDS ASSESSMENT & IMPLEMENTATION PLAN
 BARNES-JEWISH HOSPITAL 2016 COMMUNITY HEALTH NEEDS ASSESSMENT & IMPLEMENTATION PLAN 1 TABLE OF CONTENTS Executive Summary... 3 Community Description... 4 Geography... 4 Population Trends... 5 Income...
King County City Health Profile Seattle
 King County City Health Profile Seattle Shoreline Kenmore/LFP Bothell/Woodinville NW Seattle North Seattle Kirkland North Ballard Fremont/Greenlake NE Seattle Kirkland Redmond QA/Magnolia Capitol Hill/E.lake
ONTARIO COUNTY HEALTH PROFILE. Finger Lakes Health Systems Agency, 2017
 ONTARIO COUNTY HEALTH PROFILE Finger Lakes Health Systems Agency, 2017 About the Report The purpose of this report is to provide a summary of health data specific to Ontario County. Where possible, benchmarks
Community Health Needs Assessment Implementation Strategy Adopted by St. Vincent Charity Medical Center Board of Directors on April 5, 2017
 St. Vincent Charity Medical Center Community Health Needs Assessment Implementation Strategy Adopted by St. Vincent Charity Medical Center Board of Directors on April 5, 2017 Introduction In 2016, St.
Norton Hospital Norton Audubon Hospital Norton Women s and Children s Hospital Norton Brownsboro Hospital Norton Children s Hospital
 Norton Hospital Norton Audubon Hospital Norton Women s and Children s Hospital Norton Brownsboro Hospital Norton Children s Hospital Community Health Needs Assessment 2016 Community Health Needs Assessment
LIVINGSTON COUNTY HEALTH PROFILE. Finger Lakes Health Systems Agency, 2017
 LIVINGSTON COUNTY HEALTH PROFILE Finger Lakes Health Systems Agency, 2017 About the Report The purpose of this report is to provide a summary of health data specific to Livingston County. Where possible,
MONROE COUNTY HEALTH PROFILE. Finger Lakes Health Systems Agency, 2017
 MONROE COUNTY HEALTH PROFILE Finger Lakes Health Systems Agency, 2017 About the Report The purpose of this report is to provide a summary of health data specific to Monroe County. Where possible, benchmarks
STEUBEN COUNTY HEALTH PROFILE
 STEUBEN COUNTY HEALTH PROFILE 2017 ABOUT THE REPORT The purpose of this report is to provide a summary of health data specific to Steuben County. Where possible, benchmarks have been given to compare county
STEUBEN COUNTY HEALTH PROFILE. Finger Lakes Health Systems Agency, 2017
 STEUBEN COUNTY HEALTH PROFILE Finger Lakes Health Systems Agency, 2017 About the Report The purpose of this report is to provide a summary of health data specific to Steuben County. Where possible, benchmarks
Southwest General Health Center
 Southwest General Health Center Community Health Needs Assessment Executive Summary July 2016 Southwest General Health Center CHNA Executive Summary Introduction Southwest General Health Center, a 358-bed
Community Health Needs Assessment for Corning Hospital: Schuyler, NY and Steuben, NY:
 Community Health Needs Assessment for Corning Hospital: Schuyler, NY and Steuben, NY: November 2012 Approved February 20, 2013 One Guthrie Square Sayre, PA 18840 www.guthrie.org Page 1 of 18 Table of Contents
Methodist McKinney Hospital Community Health Needs Assessment Overview:
 Methodist McKinney Hospital Community Health Needs Assessment Overview: 2017-2019 October 26, 2016 Prepared by MHS Planning CHNA Requirement: Overview In order to maintain tax exempt status, the Affordable
Wake Forest Baptist Health Lexington Medical Center. CHNA Implementation Strategy
 Wake Forest Baptist Health Lexington Medical Center CHNA Implementation Strategy Background Wake Forest Baptist Health - Lexington Medical Center (LMC) is committed to understanding, anticipating, assessing,
2015 Community Health Needs Assessment Saint Joseph Hospital Denver, Colorado
 2015 Community Health Needs Assessment Saint Joseph Hospital Denver, Colorado December 11, 2015 [Type text] Page 1 Contributors Denver County Public Health Dr. Bill Burman, Director, and the team from
Implementation Strategy For the 2016 Community Health Needs Assessment North Texas Zone 2
 For the 2016 Community Health Needs Assessment North Texas Zone 2 Baylor Emergency Medical Center at Murphy Baylor Emergency Medical Center at Aubrey Baylor Emergency Medical Center at Colleyville Baylor
COMMUNITY HEALTH NEEDS ASSESSMENT HINDS, RANKIN, MADISON COUNTIES STATE OF MISSISSIPPI
 COMMUNITY HEALTH NEEDS ASSESSMENT HINDS, RANKIN, MADISON COUNTIES STATE OF MISSISSIPPI Sample CHNA. This document is intended to be used as a reference only. Some information and data has been altered
Allegan General Hospital Community Health Needs Assessment
 Allegan General Hospital Community Health Needs Assessment July 15, 2013 Prepared with consulting assistance from: July 15, 2013 Dear Residents of the greater Allegan area, I am pleased to share with you
Community Health Needs Assessment for Billings Clinic and Yellowstone County. Jeanne H. Manske Community Benefit Coordinator November 8, 2012
 Community Health Needs Assessment for Billings Clinic and Yellowstone County Jeanne H. Manske Community Benefit Coordinator November 8, 2012 Our Mission: Health Care, Education, Research Our Vision: Billings
Community Health Needs Assessment 2016
 Community Health Needs Assessment 2016 OSF ST. FRANCIS HOSPITAL & MEDICAL GROUP DELTA COUNTY CHNA 2016 Delta County 2 TABLE OF CONTENTS Executive Summary... 3 Introduction... 5 Methods... 6 Chapter 1.
Community Health Needs Assessment & Implementation Plan. July 1, 2013 June 30, 2016
 Community Health Needs Assessment & Implementation Plan July 1, 2013 June 30, 2016 For Period FY - July 1, 2013 June 30, 2016 Page 1 Introduction and Purpose The Patient Protection and Affordable Care
CHEMUNG COUNTY HEALTH PROFILE. Finger Lakes Health Systems Agency, 2017
 CHEMUNG COUNTY HEALTH PROFILE Finger Lakes Health Systems Agency, 2017 About the Report The purpose of this report is to provide a summary of health data specific to Chemung County. Where possible, benchmarks
Community Health Needs Assessment July 2015
 Community Health Needs Assessment July 2015 1 Executive Summary UNM Hospitals is committed to meeting the healthcare needs of our community. As a part of this commitment, UNM Hospitals has attended forums
Community Health Needs Assessment 2016
 Community Health Needs Assessment 2016 Baylor Scott & White Medical Center Hillcrest The prioritized list of significant health needs has been presented and approved by the hospital facilities governing
Sanford Medical Center Mayville Community Health Needs Assessment Implementation Strategy
 Sanford Medical Center Mayville Community Health Needs Assessment Implementation Strategy 2017-2019 dba Sanford Mayville Medical Center EIN # 45-0228899 Dear Community Members, Sanford Mayville is pleased
Community Health Needs Assessment 2017 North Texas Zone 6 Baylor Scott & White Surgical Hospital at Sherman
 2017 North Texas Zone 6 Baylor Scott & White Surgical Hospital at Sherman The prioritized list of significant health needs has been presented and approved by the hospital facilities governing body, and
Community Health Needs Assessment: St. John Owasso
 Community Health Needs Assessment: St. John Owasso IRC Section 501(r) requires healthcare organizations to assess the health needs of their communities and adopt implementation strategies to address identified
COMMUNITY HEALTH NEEDS ASSESSMENT. TMC Hospital Hill
 COMMUNITY HEALTH NEEDS ASSESSMENT TMC Hospital Hill TABLE OF CONTENTS 1 2 Letter from CEO 3 Purpose of the Report 4 Mission and Vision of Organization 5 Service Area 7 Process to Determine Priority Needs
Community Needs Assessment. Swedish/Ballard September 2013
 Community Needs Assessment Swedish/Ballard September 2013 Why Do This? Health Care Reform Act requirement Support our mission to give back to community while targeting its specific health needs Strategically
DELAWARE FACTBOOK EXECUTIVE SUMMARY
 DELAWARE FACTBOOK EXECUTIVE SUMMARY DaimlerChrysler and the International Union, United Auto Workers (UAW) launched a Community Health Initiative in Delaware to encourage continued improvement in the state
2016 Community Health Needs Assessment
 2016 Community Health Needs Assessment Table of Contents Our Commitment to Community Health 2 2016 CHNA Overview: A Statewide Approach to Community Health Improvement 2016 CHNA Partners Research Methodology
2012 Community Health Needs Assessment
 Indiana University Health Goshen 2012 Community Health Needs Assessment A Report on Implementation Strategies to Address Community Health Needs Summary Report Our Commitment to You We are here for you,
Community Analysis Summary Report for Clinical Care
 Community Analysis Summary Report for Clinical Care BACKGROUND ABOUT THE HEALTHY COMMUNITY STUDY The Rockford Health Council (RHC) exists to build and improve community health in the region. To address
St. Mary Medical Center, Langhorne, PA Community Health Needs Assessment Implementation Strategy Fiscal Year 2018
 St. Mary Medical Center, Langhorne, PA Community Health Needs Assessment Implementation Strategy Fiscal Year 2018 St. Mary Medical Center (St. Mary) completed a comprehensive Community Health Needs Assessment
Hans P. Peterson Memorial Hospital
 Hans P. Peterson Memorial Hospital 2015-2017 Implementation Strategy For more than 60 years, Hans P. Peterson Memorial Hospital has demonstrated its commitment to meeting the health needs of the Haakon
Community Health Needs Assessment 2016
 Community Health Needs Assessment 2016 SAINT JAMES HOSPITAL known as OSF SAINT JAMES - JOHN W. ALBRECHT MEDICAL CENTER LIVINGSTON COUNTY CHNA 2016 Livingston County 2 TABLE OF CONTENTS Executive Summary...
Community Health Needs Assessment Supplement
 2016 Community Health Needs Assessment Supplement June 30, 2016 Mission Statement, Core Values, and Guiding Social Teachings We, St. Francis Medical Center and Trinity Health, serve together in the spirit
Hendry County & Glades County, Florida. Hendry and Glades Rural Health Planning Council Strategic Plan
 The Health Planning Council of Southwest Florida Hendry and Glades Rural Health Planning Council Strategic Plan 2016-2019 Hendry County & Glades County, Florida Table of Contents Introduction......3 Methodology...
SURVEY Being Patient. Accessibility, Primary Health and Emergency Rooms
 SURVEY 2017 Being Patient Accessibility, Primary Health and Emergency Rooms Being Patient: Accessibility, Primary Health and Emergency Rooms New Brunswick Health Council Who we are New Brunswickers have
Model Community Health Needs Assessment and Implementation Strategy Summaries
 The Catholic Health Association of the United States 1 Model Community Health Needs Assessment and Implementation Strategy Summaries These model summaries of a community health needs assessment and an
2016 Community Health Needs Assessment Implementation Plan
 2016 Community Health Needs Assessment Following the 2016 Community Health Needs Assessment, Saint Mary s Hospital developed an Implementation Strategy to illustrate the hospital s specific programs and
Implementation Strategy
 Implementation Strategy Community Health Improvement Plan Community Memorial Hospital Fiscal Year 2016-2018 Plan Approved by Community Outreach Steering Committee on 12/11/2015 Plan last reviewed on 12/8/2017
A Strategic Vision-based Publication of the Greater Flint Health Coalition
 A Strategic Vision-based Publication of the Greater Flint Health Coalition A community where all residents realize positive health outcomes through the practice of healthy lifestyles, while having access
Community Health Needs Assessment. Ballad Health- Norton Community Hospital
 Community Health Needs Assessment Ballad Health- Norton Community Hospital June 29, 2018 Table of Contents 1 Introduction... 2 2 Executive Summary... 5 3 Norton Community Hospital... 8 i. Facility Description...
Sutter Health Novato Community Hospital
 Sutter Health Novato Community Hospital 2016 2018 Implementation Strategy Responding to the 2016 Community Health Needs Assessment 180 Rowland Way, Novato CA 94945 FACILITY LICENSE #110000375 www.sutterhealth.org
Community Health Needs Assessment FY
 Community Health Needs Assessment FY 2017-19 Contents Introduction... 3 Forward... 3 Executive Summary... 3 Organization Description... 3 Community Served by the Hospital... 5 Defined Community... 5 Identification
EXECUTIVE SUMMARY... Page 3. I. Objectives of a Community Health Needs Assessment... Page 9. II. Definition of the UPMC Mercy Community...
 June 30, 2016 3 TABLE OF CONTENTS EXECUTIVE SUMMARY... Page 3 I. Objectives of a Community Health Needs Assessment... Page 9 II. Definition of the UPMC Mercy Community... Page 10 III. Methods Used to Conduct
North Shore Community Health Priority Assessment
 North Shore Community Health Priority Assessment 2017-2021 1 Letter from the Health Director/Officer In 2017, the North Shore Health Department began the process of creating a North Shore Community Health
2012 Community Health Needs Assessment
 2012 Community Health Needs Assessment Table of Contents Executive Summary... 3 Overview of Key Findings.4 Conclusion...6 Introduction...7 1a. A Definition of the Community Served by the Hospital Facility...8
How Wheaton Franciscan is meeting the NEEDS of our community. NSWERING HE CALL
 ANSWERING THE CALL MEETING OUR COMMUNITY NEEDS S July 1, 2013 June 30, 2016 S How Wheaton Franciscan is meeting the NEEDS of our community. NSWERING HE CALL COMMUNITY HEALTH NEEDS IMPLEMENTATION PLAN:
Bon Secours Richmond St. Mary s Hospital
 Bon Secours Richmond St. Mary s Hospital Table of Contents Executive Summary 3 Description and Vision 5 Section I: Service Area and Description of Community Served 6 Section II: Process and Methods Used
St. Lawrence County Community Health Improvement Plan
 St. Lawrence County Community Health Improvement Plan November 1, 2013 Contents Executive Summary... 3 What are the health priorities facing St. Lawrence County?... 3 Prevent Chronic Disease... 3 Promote
Kaleida Health 2010 One-Year Community Service Plan Update September 2010
 2010 One-Year Community Service Plan Update September 2010 1 2 Kaleida Health 2010 One-Year Community Service Plan Update September 2010 Kaleida Health hospital facilities include the Buffalo General Hospital,
Community Health Needs Assessment 2013 Oakwood Heritage Hospital Implementation Strategy
 Community Health Needs Assessment 2013 Oakwood Heritage Hospital Implementation Strategy Community Health Needs Assessment 2013 Oakwood Healthcare CHNA Implementation Strategy Community Health Needs Assessment
St. Jude Medical Center St. Jude Heritage Healthcare. FY 09 FY 11 Community Benefit Plan
 St. Jude Medical Center St. Jude Heritage Healthcare FY 09 FY 11 Community Benefit Plan 1 St. Jude Medical Center FY 09 - FY 11 Community Benefit Plan TABLE OF CONTENTS Executive Summary 3 A. Community
Methodist Hospital of Sacramento Community Health Needs Assessment 2013 Community Benefit Implementation Plan
 Methodist Hospital of Sacramento 2013 Community Health Needs Assessment 2013 Community Benefit Implementation Plan Table of Contents I. 2013 Methodist Hospital of Sacramento Community Health Needs Assessment
2016 Implementation Strategy Report
 2016 Implementation Strategy Report September 1, 2016 August 31, 2019 Table of Contents 1. Review of Community Health Needs Assessment Findings 4 Purpose of the Community Health Needs Assessment (CHNA)
Implementation Plan Community Health Needs Assessment ADOPTED BY THE MARKET PARENT BOARD OF TRUSTEES, OCTOBER 2016
 2017 2019 Community Health Needs Assessment Implementation Plan ADOPTED BY THE MARKET PARENT BOARD OF TRUSTEES, OCTOBER 2016 MERCY HEALTH LOURDES HOSPITAL 1530 Lone Oak Rd., Paducah, KY 42003 A Catholic
Thank you for your interest in the community health benefits our hospital and community partnerships can provide to the region.
 Marshfield Medical Center 611 N Saint Joseph Avenue Marshfield, WI 54449-1832 Dear patients, families and friends, Community health needs assessment and strategy implementation reports are completed every
Revised March Originally published June Assessment & Community Health. Improvement Plan. Mahoning County, Ohio
 Originally published June 2011- Revised March 2014 Community Health Assessment & Community Health Improvement Plan Mahoning County, Ohio This page is intentionally left blank 2 TABLE OF CONTENTS COMMUNITY
2013 Greene County, Arkansas Community Health Needs Assessment
 2013 Greene County, Arkansas Community Health Needs Assessment Creating a Call to Action in our Community This report is available at www.myammc.org or at Arkansas Methodist Medical Center 900 W. Kingshighway,
Community Health Needs Assessment Implementation Strategy Tallahassee Memorial HealthCare 1300 Miccosukee Road FY 2016
 Community Health Needs Assessment Implementation Strategy Tallahassee Memorial HealthCare 1300 Miccosukee Road FY 2016 I. General Information Contact Person : Warren Jones Date of Written Report: September
Region 1 Parish Community Health Assessment Profile: St. Bernard Parish
 Region 1 Parish Community Health Assessment Profile: Spring 2014 FOREWORD The Regional Meeting on Health Priorities was held in Harvey, LA in November 2013, and was co-convened by the Department of Health
Community Health Needs Assessment
 Community Health Needs Assessment 2017-2019 1 About Texas Health Institute: Texas Health Institute (THI) is a nonpartisan, nonprofit organization whose mission is to improve the health of Texans and their
Good Samaritan Medical Center Community Benefits Plan 2014
 Good Samaritan Medical Center Community Benefits Plan 2014 This Addendum to the Community Benefits Plan 2014 is an addendum to the Community Benefits Plan approved by the Community Benefits Council on
Implementation Plan for Needs Identified in Community Health Needs Assessment for
 Implementation Plan for Needs Identified in Community Health Needs Assessment for Spectrum Health Kelsey d/b/a Spectrum Health Kelsey Hospital FY 2013-2015 Covered Facilities: Spectrum Health Kelsey d/b/a
Community Health Needs Assessment 2016
 Community Health Needs Assessment 2016 Contents Introduction... 1 Summary of Community Health Needs Assessment... 2 Summary of Findings... 3 General Description of the Hospital... 4 Community Served by
Community Health Implementation Plan Swedish Health Services First Hill and Cherry Hill Seattle Campus
 Community Health Implementation Plan 2016-2018 Swedish Health Services First Hill and Cherry Hill Seattle Campus Table of contents Community Health Implementation Plan 2016-2018 Executive summary... page
Implementation Strategy Report For Community Health Needs
 Implementation Strategy Report 2015 For Community Health Needs Community Hospital Community Health Needs Assessment (CHNA) Implementation Strategy Report 2015 I. About Community Hospital Community Hospital
Union County Community Health Needs Assessment
 Community Health Needs Assessment November 2007 This page is intentionally left blank Community Health Needs Assessment November 2007 Health Department Needs Assessment Committee Winifred M. Holland, MPH,
2016 Community Health Needs Assessment & Implementation Strategy
 2016 Community Health Needs Assessment & Implementation Strategy 2 The Community Health Needs Assessment and Implementation Strategy for the CHI St. Luke s Health The Vintage Hospital were conducted and
Community Health Needs Assessment FY
 Community Health Needs Assessment FY 2016-2018 Community Health Needs Assessment FY 2016-2018 1 MERCY MEDICAL CENTER-CLINTON COMMUNITY HEALTH NEEDS ASSESSMENT FY 2016-2018 I. Introduction The Community
CALIFORNIA HEALTHCARE FOUNDATION. Medi-Cal Versus Employer- Based Coverage: Comparing Access to Care JULY 2015 (REVISED JANUARY 2016)
") CALIFORNIA HEALTHCARE FOUNDATION Medi-Cal Versus Employer- Based Coverage: Comparing Access to Care JULY 2015 (REVISED JANUARY 2016) Contents About the Authors Tara Becker, PhD, is a statistician at the
CALIFORNIA HEALTHCARE FOUNDATION Medi-Cal Versus Employer- Based Coverage: Comparing Access to Care JULY 2015 (REVISED JANUARY 2016) Contents About the Authors Tara Becker, PhD, is a statistician at the
Community Health Plan. (Implementation Strategies)
") -2019 Community Health Plan (Implementation Strategies) May 15, Community Health Needs Assessment Process Florida Hospital at Connerton Long Term Acute Care Facility (LTAC or the Hospital) is a long-term
-2019 Community Health Plan (Implementation Strategies) May 15, Community Health Needs Assessment Process Florida Hospital at Connerton Long Term Acute Care Facility (LTAC or the Hospital) is a long-term
Community Health Needs Assessment. Implementation Plan FISCA L Y E AR
 Community Health Needs Assessment Implementation Plan FISCA L Y E AR 2 0 1 5-2 0 1 8 Table of Contents: I. Background 1 II. Areas of Priority 2 a. Preventive Care and Chronic Conditions b. Community Health
School Health Program. Mecklenburg County Health Department
 School Health Program Mecklenburg County Health Department CHILD HEALTH 24 CHILDHOOD DEATHS BY CAUSE 2011 Mecklenburg County 25 OBESITY Obesity is a health concern, a social dilemma, a personal challenge,
Community Health Needs Assessment 2016
 Community Health Needs Assessment 2016 Baylor Scott & White Medical Center Brenham Baylor Scott & White Medical Center College Station The prioritized list of significant health needs has been presented
Critical Access Hospital-Relevant Measures for Health System Development and Population Health
 Flex Monitoring Team Policy Brief #42 December 2015 Critical Access Hospital-Relevant Measures for Health System Development and Population Health John Gale, MS; Andrew Coburn, PhD; Zach Croll, BA University
2004 BAKER COUNTY HEALTH NEEDS ASSESSMENT
 Taking the pulse of the community 2004 BAKER COUNTY HEALTH NEEDS ASSESSMENT Prepared by: Health Planning Council of Northeast Florida, Inc. 900 University Blvd North, Suite 110 Jacksonville, Florida 32211
Healthy Kids Connecticut. Insuring All The Children
 Healthy Kids Connecticut Insuring All The Children Goals & Objectives Provide affordable and accessible health care to the 71,000 uninsured children Eliminate waste in the system Develop better ways to
Transforming Health and Health Care Through Nurses in Tennessee
 Transforming Health and Health Care Through Nurses in Tennessee Nursing Leadership Workshop I: Building a Culture of Health in Tennessee Carole R. Myers, PhD, RN Nursing Lead-Tennessee Action Coalition
COMMUNITY HEALTH NEEDS ASSESSMENT
 COMMUNITY HEALTH NEEDS ASSESSMENT 2013 SUMMARY REPORT Report Prepared By: Community Health Needs Assessment SUMMARY REPORT TABLE OF CONTENTS I. Community Health Needs Assessment Background 2 Hospital &
Community Health Needs Assessment
 Community Health Needs Assessment Region 10 RHP s Community Health Needs Assessment (CHNA) offers Regional data and related county-specific health needs information to inform the selection of the delivery
Community Health Improvement Plan
 Community Health Improvement Plan Methodist Le Bonheur Germantown Hospital Methodist Le Bonheur Healthcare (MLH) is an integrated, not-for-profit healthcare delivery system based in Memphis, Tennessee,
Community Health Needs Assessment
 Community Health Needs Assessment 2016 3 Divine Providence Hospital Muncy Valley Hospital Williamsport Regional Medical Center Contents Introduction... 1 Summary of Community Health Needs Assessment...
Population Health: Physician Perspective. Kallanna Manjunath MD, FAAP, CPE Medical Director AMCH DSRIP September 24, 2015
 Population Health: Physician Perspective Kallanna Manjunath MD, FAAP, CPE Medical Director AMCH DSRIP September 24, 2015 Population Health: Physician Perspective Presentation objectives: Brief Bio Population
Community Health Needs Assessment 2016
 Community Health Needs Assessment 2016 Scott & White Memorial Hospital (including Baylor Scott & White McLane Children's Medical Center) Baylor Scott & White Continuing Care Hospital The prioritized list
GREATER VICTORIA Local Health Area Profile 2015
 GREATER VICTORIA Local Health Area Profile 215 Greater Victoria LHA is one of 14 LHAs in Island Health and is located in Island Health s South Island Health Service Delivery Area (HSDA). The LHA is at
Community Health Needs Assessment Implementation Strategies
 Community Health Needs Assessment Implementation Strategies Valley Medical Center participated in the King County Hospitals for a Healthier Community (HHC) collaborative of all 12 hospitals and health
Community Health Needs Assessment: 2015 Implementation Strategy Update
 Community Health Needs Assessment: 2015 Implementation Strategy Update Framework for Evaluating Potential Strategic Options 2 In developing JFK Medical Center s CHNA Implementation Strategy, the following
Kentucky Rural Health Summit June 8, 2018
 Kentucky Rural Health Summit June 8, 2018 Kentucky Health Program Overview Kentucky HEALTH is the Commonwealth s new program for certain low-income adults and their families. The program gets its name
St. Anthony Hospital. Community Health Needs Assessment
 St. Anthony Hospital Community Health Needs Assessment Prepared by Tacoma-Pierce County Health Department Office of Assessment, Planning, and Improvement 1 Table of contents Key Findings... 3 Qualitative
OHIO PREGNANCY ASSOCIATED MORTALITY REVIEW (PAMR) TEAM ASSOCIATED FACTORS FORM
 TEAM ASSOCIATED FACTORS FORM") OHIO PREGNANCY ASSOCIATED MORTALITY REVIEW (PAMR) TEAM ASSOCIATED FACTORS FORM Please Circle: OFFICIAL WORKING COPY Case # DEATH REVIEW PROCESS 1. Estimate the degree of relevant information (records)
OHIO PREGNANCY ASSOCIATED MORTALITY REVIEW (PAMR) TEAM ASSOCIATED FACTORS FORM Please Circle: OFFICIAL WORKING COPY Case # DEATH REVIEW PROCESS 1. Estimate the degree of relevant information (records)
1. What is your ethnic origin? (Check one) 2. What is your gender? 3. What is your age? Page 1. nmlkj. nmlkj. nmlkj. nmlkj. nmlkj. nmlkj. nmlkj.
 2. What is your gender? 3. What is your age? Page 1. nmlkj. nmlkj. nmlkj. nmlkj. nmlkj. nmlkj. nmlkj.") 1. What is your ethnic origin? (Check one) White Asian/Pacfic Island American Indian Black Hispanic 2. What is your gender? Female Male 3. What is your age? 18 to 24 55 to 64 25 to 34 65 to 74 35 to 44
1. What is your ethnic origin? (Check one) White Asian/Pacfic Island American Indian Black Hispanic 2. What is your gender? Female Male 3. What is your age? 18 to 24 55 to 64 25 to 34 65 to 74 35 to 44
Public Health and Managed Care. December 8 and 16, 2015
 Public Health and Managed Care December 8 and 16, 2015 Where We re Going Structure of Public Health in Illinois What Public Health Brings to Managed Care Some Similarities and Differences Some Public Health
Community Health Needs Assessment and Implementation Strategy
 Community Health Needs Assessment and Implementation Strategy St. Luke s Lakeside Hospital October 29, 2013 The for the St. Luke s Lakeside Hospital were conducted and developed between April 22 and October
COURTENAY Local Health Area Profile 2015
 COURTENAY Local Health Area Profile 215 Courtenay Local Health Area (LHA) is one of 14 LHAs in Island Health and is located in Island Health s North Island Health Service Delivery Area (HSDA). Courtenay