Core Service Review. Gastroenterology and Endoscopy. May Ref: XX00000
|
|
|
- Josephine Chapman
- 5 years ago
- Views:
Transcription


1 Core Service Review Gastroenterology and Endoscopy May 2013
2 Contents Page Section 1 Introduction 2 Section 2 Headline Themes 5 Section 2 Length of Stay 7 Section 3 Outpatients 12 Section 4 Endoscopy Utilisation 22 Section 5 Consultant Time 33 Section 6 Appendix 37 1
3 Section 1 Introduction


4 Overview of Deep Dive Approach Functional Productivity Medical Productivity Beds ALOS Operating Theatres + Financial Impact Out patients Diagnostics Market Testing/Outsourcing Capacity & Demand Modelling Waiting List Management - Overheads + - Strategic Services Assessment Core Core Service delivering positive contribution Non-Core Non-core service delivering positive contribution Negative Negative contribution contribution but core & non-core? Delivery of improvements in underlying financial position Disinvestment Commissioning Intent Investment Clarity of services gained through Functional Productivity Medical Staffing Service Prioritisation matrix Contribution to underlying financial position Rational decisions taken to optimise position Formal links into Business Planning Structures Working systematically through the approach opposite to: Understand current performance Identify opportunities to improve Plan and deliver schemes to make significant difference to financial position 3
5 Data quality Data limitations The data/information available from the Cardiff & Vale UHB does have limitations, and is not always accurate We have used the information and data available to us, applying sensible assumptions where necessary We have made every effort to check the accuracy of the information in this document, however it is only as good as the source data, which comes from the Information Services Department, TheatreMan, Finance and other UHB systems. As such it is important that: Data is not used in a pejorative way You agree to work with the data available and are committed to helping the UHB to improve data quality We keep an open mind and accept that it isn t always necessary to have 100% accuracy before action can be taken. Successful organisations in the public and private sectors work on the basis of it s good enough We engage in robust debate and welcome challenge as an essential part of the process We commit to working together 4
6 Section 2 Headline Themes
7 Headline Themes Context Gastroenterology and endoscopy services at C&V UHB currently have long waiting lists in both outpatient clinics and for endoscopy services which has resulted in breach of RTT targets The service review A clinical service review was conducted for Gastroenterology and Endoscopy in May 2013 to assess the current state of the service The review has found some significant issues with the Gastroenterology and Endoscopy services which need urgent attention Main headlines of the review The key headlines that have surfaced from the review are as follows: There is an indication of high LOS compared to peers although a part of this can be attributed to the case mix (there is also an issue of data quality and coding which might be skewing the outputs) High New to Follow-up ratio of 1:3.6 which means more follow-up patients seen when compared to new patients; it is acknowledged that in some cases a high New to Follow-up ratio is expected given the case mix There was a significant gap between the capacity and demand (for 13/14 and 14/15) for both new and follow-up clinics; while a part of the demand can be eradicated by reducing the New to Follow-up ratio and employing other measures, the capacity still lags demand Overall clinic utilisation is 91% which is good, but due to the high New:Follow-up ratio, the follow-up slots are well utilised (92% utilisation) while the new slots are slightly underutilised (85%) contributing to the significant waiting list The overall DNA rate is 17.5% which is high and can be improved; Please note that DNA rates are generally higher in Wales and Hepatology could be contributing to the high DNA rate Overall Endoscopy utilisation is 88% and both sites are utilised equally well although the DNA rate at UHW is higher than at UHL Main issues are that Endoscopy lists are not standardised across AM and PM sessions (e.g., 12 slots in AM and 10 in PM); Endoscopy unit is unutilised for 1 hr everyday; Points per list performed by consultants and Nurse Endoscopists can be increased; Nurse Endoscopists are underutilised can be used to do more non-complex procedures 6
8 Section 3 Length of stay


9 Average length of stay 12/13: Non-Elective Inpatients The following table and graph show the average length of stay by consultant and HRG group. The HRGs have been clubbed into their specific groups to provide a similar case mix for comparison and also to provide a large enough sample size. Please note that this data is for 10 months only. Site Consultant HRG Group D HRG Group F HRG Group G HRG Group L HRG Group S FCE ALOS FCE ALOS FCE ALOS FCE ALOS FCE ALOS Dr A Godkin Dr A Hawthorne UHW Dr D Durai Dr G Thomas Dr L Sunderraj UHW Total UHL Dr J Green Dr J Turner Dr K Keshk Dr S Dolwani UHL Total UHW + UHL Total The above data is for the top five HRG groups with the highest number of FCEs for UHW and UHL respectively As can be inferred from the above data, there is significant variation in the ALOS across the consultants Group F has the highest number of FCEs and the ALOS varies between 20.2 and 4.5 According to this data, 16 beds were needed to accommodate patients under the care of a Gastroenterologist with a Gastroenterology HRG. This figure does not include patients not under the care of a Gastroenterologist. A list of HRGs for each group can be found at the end of the presentation Source: Information Services Department 'Specialist Division Average Length of Stay information Apr 12 to Jan 13 8
10 Length of stay Non-Elective Inpatients The tables below shows the top 5 HRGs with the highest number of FCEs by bed days based on benchmarking analysis completed by C&V UHB on activity data Comparison to peer group HRG FCEs Average LOS Bed days HRG HRG Code FCEs Average LOS Bed days Non-Malignant Liver Disorders with Major CCs GC15C Non-Malignant Liver Disorders without Major CCs GC15D Cardiff & Vale Peer Group LQ Peer Number of beds Total Cost Mean LOS Bed days Number of beds Total Cost Number of beds Inflammatory Bowel Disease, with length of stay 2 days or more, without Interventions, without Major CC FZ37J Gastrointestinal Bleed with length of stay 1 day or more without Major CC FZ38E Inflammatory Bowel Disease, with length of stay 2 days or more, without Interventions, with Major CC FZ37H Total , The tables below shows that there is an opportunity to save upto 1 bed by reducing the length of stay to that of the peer for the top 5 HRGs discussed above Total Cost GC15C , ,739 55,475 GC15D , ,564 38,103 FZ37J , ,929 45,951 FZ38E , ,044 30,819 FZ37H , ,630 47,369 Total , , , , ,716 Opportunity to save beds through reduced length of stay , ,540 Source: _Bed opportunities National HES benchmark.xlsx No. Of Bed days = Length of stay/ 365 LQ = Lower Quartile 9
11 Peer group used The benchmarking work carried out by C&V UHB used the following peer group of English Trusts Trust Royal Liverpool & Broad Green University Hospitals NHS Trust Sheffield Teaching Hospitals NHS Trust Southampton University Hospital NHS Trust Organisation Code RQ6 RHQ RHM Source: _Bed opportunities National HES benchmark.xlsx 10
12 Points to consider Comparing the ALOS by a similar case mix shows that the there is an opportunity to reduce the length of stay to free up bed capacity Peer analysis suggests that these can be reduced significantly to release more capacity and reduce costs Questions What is driving the longer length of stays? Are longer lengths of stay and waiting lists times affecting the non-elective activity? What are the discharge procedures? Is there a standard set of measures that need to be followed? How are the beds managed in the general medicine ward? Do general medicine patients often occupy gastro beds? 11
13 Section 4 Outpatients
14 Outpatient Clinic Booking Rules The table below shows the current outpatient clinic booking rules across UHW and UHL. The number of clinics per week and the number of new and follow-up slots have been calculated from the provided clinic templates Clinic Booked Under Clinic Lead Type Clinic code Frequency New Slots F/U Slots Total Dolwani, Dr S Con and SpR GAST3 Weekly Dolwani, Dr S Sister H Ludlow CNS GAST14 Weekly Sister Kay Charles CNS GAST5 Weekly General gastro GAST13 3/month Durai, Dr D Durai, Dr D HPN GAST16 1/month IBD Con and SpR W85/W86 Weekly Gastro, Mr UHW -GT GAST11* 1/month Pool Consultant UHL -JS,JT,Locum GAST9** Weekly Godkin, Dr A Godkin, Dr A Liver Con and SpR GMED19 Weekly Nurse led Liver GMED19N Weekly SpR SpR GMED16 Weekly Green, Dr J Consultant GMED15 Weekly Green, Dr J Sister Kay Charles GMED53 Weekly CNS Sister H Ludlow GMED39 Weekly IBS GAST12 Weekly Nurse led IBD GAST15&GMED34 3/month Virtual Clinic anti-tnf VCIBD1 1/month/adhoc Hawthorne, Dr A SpR General gastro P89/P90 3/month IBD R44/R45 Weekly General gastro N82/N83 3/month Hawthorne, Dr A IBD N80/N81 Weekly HPN GMED22 1/month General gastro GMED18 Weekly Sunderraj, Dr L Sunderraj, Dr L Joint Transplant LT1 1/3months Liver W87/W88 Weekly Nurse led Liver W87/W88N Weekly Nurse led CNS GAST4 Weekly Swift, Dr G Sister A Green CNS GAST1 Weekly VCGAST1 Weekly Swift, Dr G Con and SpR GAST2 Weekly Thomas, Dr G Thomas, Dr G Gen gastro and SpR W83/W84 Weekly Turner, Dr Jeffrey SpR SpR E02/D28 Weekly Turner, Dr Jeffrey Consultant 233/234 Weekly Source: Clinic Templates *In 12/13 GAST11 ran weekly for 18 weeks with 4 consultants and there after once per month with one consultant (Dr. Thomas) ** in 12/13 GAST9 ran once per week with 2 full time consultants and 1 locum The clinics are equally divided so that 2 out of 3 consultants are always present. 13
15 Outpatient Utilisation Available Appointment Slots 1 Booked Appointments 2 Utilisation Consultant News Follow Ups Total News Follow Ups Total News Follow Ups Overall Durai, Dr D % 135% 128% Turner, Dr J % 117% 112% Thomas, Dr G % 99% 102% Swift, Dr G % 108% 100% Gastro, Mr Consultant % NA 98% Dolwani, Dr S % 98% 95% Sunderraj, Dr L % 83% 84% Hawthorne, Dr A % 81% 80% Green, Dr J % 70% 71% Godkin, Dr A % 59% 57% Total % 92% 91% The graph above shows the total number of appointments booked as a percentage of the total number of appointments available based on the OP clinic templates for 2012/13 Telephone and virtual clinics have been excluded The available appointment slots are a sum of all slots booked under the consultant s name which include nurse led clinics, DNAs and Cancellations It is assumed that registrars are available for 60% of the year only for the reminder 40% of the year when registrars are not available templated slots are reduced by 25% for SpR clinics only Dr G Thomas at UHW and Dr G Swift, Dr J Turner and locum at UHL do the Mr Gastro pool clinic and their contribution is recoded separately in this clinic i.e. this is additional activity than that recorded next to the names of these consultants. 1 Based on clinic templates from Clinical Boards 2 Source: Information Services Department, Apr 12 Mar 13 3 The booked appointments data for this clinic seems to be incorrect and this issue has been recognised 14


16 Outpatient Utilisation Excluding nurse led clinics Available Appointment Slots 1 Booked Appointments 2 Utilisation Consultant News Follow Ups Total News Follow Ups Total News Follow Ups Overall Gastro, Mr Consultant - UHW % 0% 252% Durai, Dr D % 135% 128% Dolwani, Dr S % 122% 113% Turner, Dr J % 117% 112% Swift, Dr G % 119% 105% Thomas, Dr G % 99% 102% Green, Dr J % 112% 102% Hawthorne, Dr A % 95% 91% Sunderraj, Dr L % 83% 84% Gastro, Mr Consultant - UHL % 0% 79% Godkin, Dr A % 59% 57% Nurse Led Clinics - UHW % 46% 50% Nurse Led Clinics - UHL % 63% 65% Total % 92% 91% Following on from the previous slide, the above table shows the number of available outpatient slots and booked appointments by consultant after removing the specialist nurse led clinics. The specialist nurse led clinics have been recorded separately for UHW and UHL The data includes DNAs and cancellations Removing the nurse led clinics shows some significant variation in the consultant clinic utilisation when compared to the previous slide which shows follow-up clinics in most cases are well utilised, where as for the new patient clinics there is an opportunity for better utilisation Overall, the nurse led clinics are underutilised and can be used to increase the throughput of follow-up patients Please note that with the given data, it is difficult to extract the exact number of nurse led clinics from consultant clinics due to coding issues The utilisation of Mr. Consultant Gastro clinic at UHW might be slightly misleading as for a part of the previous year the clinic had higher capacity and hence had more patient bookings 1 Based on clinic templates from divisions 2 Source: Information Services Department, Apr 12 Mar 13 3 The booked appointments data for this clinic seems to be incorrect and this issue has been recognised 15
17 Outpatients Utilisation contd. Outpatient utilisation varies between Gastroenterologists but on average they see 3.5 new outpatients per clinic based on clinic templates If utilisation levels for new booked appointments were at the level of the best performer (in this case, Dr S Dolwani at 94%) there is additional outpatient capacity of 271 new outpatients Based on an average clinic template with 3.5 new outpatients to be seen each week, the number of clinics could be reduced by up to 77. This purely focuses on the additional new outpatients that could be booked into an appointment slot Consultant Additional new patient capacity if 94% utilised Equivalent OP clinics Additional new patient capacity if 100% utilised Equivalent OP clinics Godkin, Dr A Hawthorne, Dr A Swift, Dr G Green, Dr J Sunderraj, Dr L Durai, Dr D Dolwani, Dr S Turner, Dr J Thomas, Dr G Total


18 Outpatients Metrics Consultant New Follow Ups DNA Rate Total N:F/U Ratio Attended DNA Attended DNA New Follow Ups Dr D Durai % 16.83% Dr G Swift % 15.61% Dr A Hawthorne % 12.96% Dr A Godkin % 8.36% Dr L Sunderraj % 20.20% Dr S Dolwani % 13.49% Dr J Green % 14.22% Dr J Turner % 15.67% Dr G Thomas % 10.94% Mr Consultant Gastro % 0.00% Total % 13.48% National Benchmark National Benchmark % There may be slight discrepancies between the figures on this slide and those in the previous slide for available and booked slots The appointments under each consultant include nurse led clinics As the Mr Consultant Gastro clinic sees routine, long waiting patients, it has an extremely low follow up rate. This means that Dr Turners & Dr Swifts overall new to follow up rate will be much lower than figures quoted above which relate just to their named clinics. Source: Information Services Department, Apr 12 Mar 13 National Benchmark source: NHS Institute for Innovation and Improvement The overall N:FU ratio of 1:3.6 is an average of the N:FU ratios of all consultants excluding any outliers and zeros 17
 (2,563) (2,830) Follow-Up 8,153 17,632 8,049 18,513 19,395 (9,479) (10,360) (11,242) Total 11,200 22,975 11,029 24,124 25,272 (11,775) (12,924)")

19 Outpatient Capacity & Demand Current Capacity Demand in 12/13 Activity in 12/13 Demand for 13/14 Variance in capacity and demand Increase by 5% Increase by 10% 12/13 13/14 inc. by 5% 13/14 inc. by 10% New 3,047 5,343 2,980 5,610 5,877 (2,296) (2,563) (2,830) Follow-Up 8,153 17,632 8,049 18,513 19,395 (9,479) (10,360) (11,242) Total 11,200 22,975 11,029 24,124 25,272 (11,775) (12,924) (14,072) Capacity Shortfalls Assumptions: The current capacity is based on clinic templates Outpatient demand for 12/13 is derived from the number of new OP appointments added in 12/13 and Follow-ups have been calculated based on a new to follow-up ratio of 1:3.6 Outpatient demand for 13/14 is based on the assumption that the number of new referrals will increase by 5% - 10% The analysis assumes that the waiting lists remain at current levels Source: Information Services, OP added tab 18

20 Outpatient Capacity & Demand contd.. With all other factors remaining constant, significant capacity can be gained by reducing the N:F/U ratio and DNA rates Excluding DNAs, by reducing the new to follow-up ratio to 1:1.89 (national average) overall about 3153 appointments can be saved which equates to 287 clinic sessions given an average of 11 appointments (new and follow-up) per clinic Further, reduction in the DNA rates to that of the national average of 11.56% can result in a saving of 570 appointments which equates to 52 clinic sessions given an average of 11 appointments (new and follow-up) per clinic The table and graph below show the change in capacity and demand just by reducing the new to follow-up ratio Current Capacity Demand in 12/13 Activity in 12/13 Demand for 13/14 Variance in capacity and demand Increase by 5% Increase by 10% 12/13 13/14 inc. by 5% 13/14 inc. by 10% New 3,047 5,343 2,980 5,610 5,877 (2,296) (2,563) (2,830) Follow-Up 8,153 10,098 8,049 10,603 11,108 (1,945) (2,450) (2,955) Total 11,200 15,441 11,029 16,213 16,985 (4,241) (5,013) (5,785) Capacity Shortfalls Reduced Source: Information Services, OP added tab 19


21 Waiting lists breaches The table below shows the number of patients on the Gastroenterology elective waiting list by pathway. At the end of March 2013 there were a total of 4,985 patients on the waiting list. Pathway Type No of Patients Endoscopy Waiting List 2021 Outpatient Waiting List 1505 Inpatient/Daycase Waiting List 676 In Follow-Up Cycle 741 On Multiple Components 40 Total 4985 The graph below shows the number of patients on the waiting for Outpatient and Inpatient list for 14 weeks or higher Patients waiting for 14 weeks or higher Source: Information Services Gastroenterology Waiting Lists
22 Points to consider There are capacity gains that can result from increasing the efficiency of clinic utilisation Significant capacity can also be gained by increasing the SpR time in clinics If utilisation levels for new booked appointments was at the level of the best performer (in this case, Dr S Dolwani at 94%) there is additional outpatient capacity of 271 new outpatients which is equivalent to 77 extra outpatient clinics There is also an opportunity to free-up capacity by reducing the first to follow-up ratio from 3.3 (current average) to 1.89 (National average for Gastro) and overall DNA rate from 17.5% (current average) to 11.5% (National average for Gastro) Questions What is the conversion rate from outpatient appointment to endoscopy? What are the booking processes for clinics? Can clinic templates be increased to meet current and future demand? Should all consultant clinic templates be the same? Can the frequency of clinics be increased? Can the number of nurse and registrar led clinics be increased to accommodate for more appointments? Has any benchmarking been done with similar trusts around clinic templates? Next steps: Align outpatient clinic capacity and demand Review the need for varying consultant clinic templates Identify ways to reduce first to follow-up ratio and DNA rates 21
23 Section 5 Endoscopy Utilisation Analysis
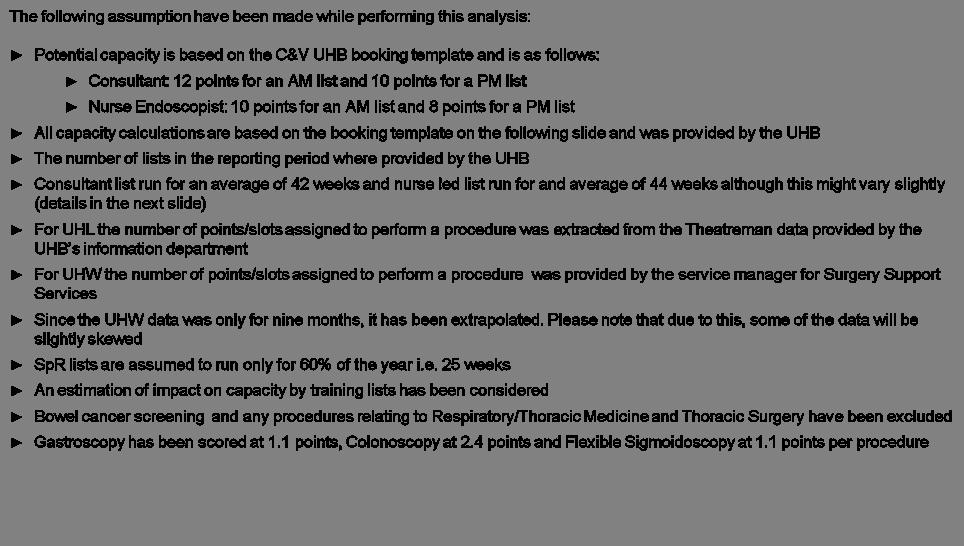
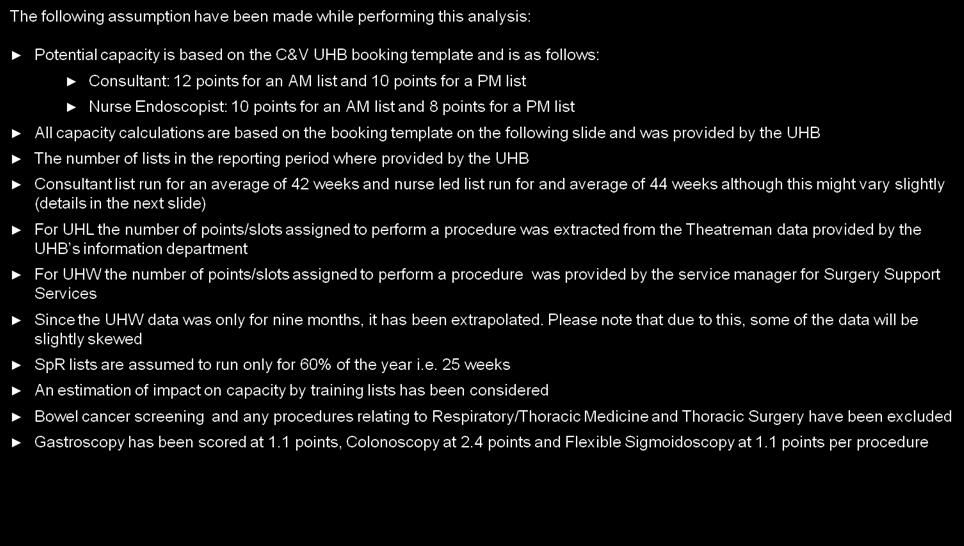
24 Data analysis methodology Data tools The Endoscopy activity data for UHL was extracted from the Theatreman system The Endoscopy activity data for UHW was extracted from the ADAM system while the number of slots/points equating to the number of procedures performed (Actual Activity) where provided by the service manager for Surgery Support Services Data analysis The data reporting period for UHL was for one year between April 12 to March 13 and where possible, the number of slots/points for procedures were extracted from the Theatreman data. The data also provided procedure cancellations. For procedures where number of slots/points were unavailable Gastroscopy has been scored at 1.1, Colonoscopy at 2.4 and Flexible Sigmoidoscopy at 1.1 For UHW, the data received was only nine months between April 12 and Dec 13. This is because the number of slots/points equating to the number of procedures performed (Actual Activity) are recorded manually and since Dec 13 have not been update. Please note that this data has been extrapolated to get a years worth of data to maintain uniformity in analysis. Procedure cancellations have been recorded from PMS Endoscopy utilisation Endoscopy utilisation and capacity is based on points assigned to procedures. One point equates to 20 minutes scheduled, therefore more complex procedures provide more points. Four hours per list and 12 points is the recommended medical benchmark by JAG (Joint Advisory Group for Gastroenterology). In addition, it is standard practice for Nurse Endoscopists to deliver 10 points per four hour list. At C&V UHB, 12 points and 10 points have been allocated for an AM and a PM list respectively for a consultant while 10 points and 8 points have been allocated for an AM and a PM list respectively for a Nurse Endoscopist. Points allocated to training lists vary between 8 and
25 Definition of key matrices used Endoscopy utilisation metrics The following metrics have been used in this report to highlight endoscopy utilisation opportunities: Number Metric Calculation 1. Potential capacity Lists that ran in reporting period X UHB templated point allocation (12 points AM and 10 points PM for a consultant and 10 points AM and 8 points PM Nurse Endoscopist) 2. Booked capacity Points that were scheduled onto the lists during the reporting periods 3. Actual activity Points that attended (procedure undertaken) during the reporting period 4. Booked versus potential utilisation Metric 2 / Metric 1 (%) 5. Actual versus booked utilisation Metric 3 / Metric 2 (%) 6. Actual versus potential utilisation Metric 3 / Metric 1 (%) 7. Mean points per list Metric 2 / Number lists that ran in the reporting period & Metric 3 / Number lists that ran in the reporting period 8. Patient Did Not attend (DNA) rate 100% - Metric 5 24
26 Assumptions 25
27 Endoscopy Booking Rules The table below shows the current Endoscopy booking rules across UHW and UHL. Lists per consultant have been divided up into AM and PM lists so that appropriate points can be allocated. These include training lists. It is assumed that registrars are available for only 60% of the year to scope Consultant Designation No. Of Weeks Site As per Procedure room templates No. of AM lists No. of PM lists Total Karen Wright CNS 44 UHW Guy Blackshaw Consultant 38 UHW Damesh Durai Consultant 42 UHW Gareth Thomas Consultant 42 UHW Jane Turner CNS 44 UHW Barney Hawthorne Consultant 42 UHW Geoff Clark Consultant 38 UHW Andy Godkin Consultant 42 UHW L Sunder Raj Consultant 42 UHW Sue Cunningham GP 44 UHW John Green Consultant 42 UHL Mike Davies Consultant 38 UHL Jill Swift Consultant 42 UHL Jeff Turner Consultant 42 UHL Sunil Dolwani Consultant 42 UHL Simon Phillips Consultant 38 UHL Kay Charles CNS 44 UHL Locum Consultant 44 UHL Chris Morris Consultant 38 UHL Leigh Davies Consultant 39 UHL Jane Turner CNS 44 UHL Source: Procedure room templates 26

 that has been used for up to 2 days a week in recently while UHW has two Endoscopy rooms The overall Endoscopy utilisation rate is 88.")
28 Clinical Productivity Site JAG recommended Capacity* UHB template Capacity Booked Capacity Actual Activity Booked versus potential utilisation Actual versus booked utilisation Actual versus potential utilisation DNA rate UHL 10,176 9,251 8,911 8, % 91.35% 87.99% 3.66% UHW 7,642 6,198 6,104 5, % 90.53% 89.16% 6.63% Total 17,818 15,449 15,015 13, % 91.02% 88.46% 5.04% The table above demonstrates the key findings for the reporting period The analysis highlights that UHL is the larger of the two sites and performs more endoscopy procedures; UHL has 3 rooms and a theatre in Day Surgery ( Grey theatre ) that has been used for up to 2 days a week in recently while UHW has two Endoscopy rooms The overall Endoscopy utilisation rate is 88.46% UHB patient attendance rate is 91.02% Overall, both sites are well utilised although there is an opportunity to improve the utilisation further, especially the actual v potential utilisation Operational Efficiency The chart alongside shows the current DNA rate by site in comparison with JAG suggested target of 5%. The analysis shows that the overall DNA rate is 4.91% and the DNA rate at UHW is significantly higher than UHL Although both sites have low DNA rates, there is an opportunity at UHW to reduce DNAs further to the JAG suggested targets * Calculated based on 12 points for consultants and 10 points for nurses 27


29 Endoscopy Utilisation UHW Consultant Designation As per clinic templates Template Actual Actual No. Of Total Points Total Points Template Actual Actual No. of AM No. of PM Lists/ Lists/ Points/ Weeks in AM list in PM list Capacity Activity Utilisation lists lists Year Year list Sunder Raj Dr. L Consultant % Thomas, Dr G Consultant % Blackshaw, Mr. G Consultant % Cunningham Dr, S GP % Hawthorne Dr. B Consultant % Godkin Dr. A Consultant % Durai, Dr D Consultant % Clark Dr G Consultant % Sister J Turner CNS % Sister K Wright CNS % Total % The table and graph above show the list utilisation rates and average points per list at UHW The analysis factors in the impact of training lists on capacity; At UHW there are 4 training lists and run for an average of 60% of the year at 8 points per list SpRs train under consultants, but when a trained SpR is available and is able to perform a list independently, the total capacity will increase There are variations in the number of points per list and overall, the consultants perform 10 points per list against an average of 11 points while Nurse Endoscopist perform only 8.75 points against and average of 9 which indicates that the list are slightly underutilised although a part of this could be attributed to the DNA rate List utilisation at UHW varies between 131.1% and 63.6% with the overall utilisation being 89.2% which indicates that there is potential to increase throughput by better utilising the lists 0.5 inpatient emergency lists run on Mon (Durai), Tues (Sunderraj), Thurs (Hawthorne) and Fri (Thomas) and only one of these 0.5 lists are included in agreed job plans is Dr Durai. The others are additional, non-agreed activity Dr Dolwani also does regular endoscopy lists in main theatres which include joint procedures with upper/colorectal surgeons. Many are scheduled as prolonged cases with multiple slots. It is uncertain if this activity is included in this data 28


30 Endoscopy Utilisation UHL Consultant Designation As per clinic templates Template Actual Actual No. Of Total Points Total Points Actual Actual No. of AM No. of PM Capacity Lists/ Lists/ Points/ Weeks in AM list in PM list Activity Utilisation lists lists Year Year list Turner Dr. J Consultant % Swift Dr. G Consultant % Green Dr. J Consultant % Locum Consultant % Sister K Charles CNS % Sister J Turner CNS % Morris Mr. C Consultant % Phillips Mr. S Consultant % Dolwani Dr. S Consultant % Davies Dr. L Consultant % Davies Mr. M Consultant % Total % The table and graph above show the list utilisation rates and average points per list at UHL The analysis factors in the impact of training lists on capacity. At UHL are 3 training lists and run for an average of 60% of the year with 10 points for an AM list and 8 points for a PM list SpRs train under consultants, but when a trained SpR is available and is able to perform a list independently, the total capacity will increase There are variations in the number of points per list and overall, the consultants perform 9 points per list against an average of 11 points while Nurse Endoscopist perform 8 points against and average of 9 which indicates that the list are underutilised although a part of this could be attributed to the DNA rate List utilisation at UHL varies between 111% and 61.6% with the overall utilisation being 86.8% which indicates that there is potential to increase throughput by better utilising the lists 29


31 Endoscopy Capacity & Demand Capacity 12/13 Demand in 12/13 Activity in 12/13 Capacity 13/14 Demand for 13/14 Demand for 14/15 C&V UHB 15,449 16,254 13,666 16,564 16,364 16,889 Assumptions: The current capacity is based on procedure room templates Endoscopy demand for 12/13 is derived from the number of Gastroscopy, Colonoscopy and Flexible Sigmoidoscopy patients added to the waiting list in 12/13 which is then multiplied by the respective weights of 1.1,2.4 and 1.1 The capacity and demand for 13/14 have been extracted from the capacity demand review conducted by the UHB Endoscopy demand for 14/15 is based on the assumption that the number of new referrals will increase 15% and assumes that the waiting lists from 13/14 were fully cleared Source: Information Services, OP added tab 30


32 Endoscopy productivity and Skill mix Consultant Number of Cancelled Number of procedures procedures sessions # late starts % late # early % early Average Total late Total early starts finishes finishes turnaround start time finish time Dead time Davies Dr. L % 13 46% 00:20:17 03:57:00 02:44:00 07:01:17 Davies Mr. M % 17 61% 00:13:52 01:47:00 00:26:00 02:26:52 Dolwani Dr. S % 36 63% 00:14:42 04:38:00 08:55:00 13:47:42 Locum % 45 42% 00:15:49 04:23:00 04:59:00 09:37:49 Green Dr. J % 54 66% 00:17:34 16:06:00 04:44:00 21:07:34 Keshk Dr. K % 52 46% 00:18:18 21:43:00 08:11:00 06:12:18 Morris Mr. C % 10 28% 00:15:00 08:43:00 00:10:00 09:08:00 Nurse Endoscopist % % 00:18:15 16:39:00 05:29:00 22:26:15 Phillips Mr. S % 11 35% 00:17:11 04:28:00 01:21:00 06:06:11 Swift Dr. G % 32 24% 00:14:52 17:05:00 06:03:00 23:22:52 Turner Dr. J % 54 68% 00:17:08 10:38:00 08:17:00 19:12:08 Total % % 00:16:38 158:07:00 51:19:00 212:28:57 The table above shows the endoscopy procedure room productivity at UHL The analysis shows that 43% of the procedures started late while 45% of the procedures finished early and the average turnaround time was 16 mins Assuming 3.75 hrs per session, upto the equivalent of 55 sessions could be added per year just by reducing the late starts and early finishes Dead time is the total time the procedure room is idle and is the sum of turnaround time and late start and early finish time Skill Mix Review The chart alongside demonstrates the proportion of activity delivered by Nurse Endoscopists compared with Consultant /Medical Endoscopists across C&V UHB The Royal College of Nursing suggests that Nurse Endoscopists should be able to perform up to 20% of non complex endoscopy procedures Overall, the number of Endoscopic procedures being performed by Nurse Endoscopists is at par with the guidelines although there are some discrepancies in the data that need to be investigated further 31
33 Points to consider This analysis suggest that currently, the endoscopy utilisation is good but there are opportunities to improve it further by increasing bookings and reducing DNAs and cancellations Capacity can also be increased by increasing the number of procedures performed by nurse endoscopists Questions How is procedure room availability managed? How long does it take to prep a room before a procedure takes place? What is the current turnaround time? What is the Endoscopy waiting list looking like at the moment? Are there stringent vetting procedures in place to identify the right patients? Can the number of junior staff be increased to provide more capacity? How many list do nurse endoscopists manage? Can the number of lists be increased? Are nurse endoscopists being trained to perform Colonoscopies? Can the number of training lists be decreased? How many lists do registrars manage? Are registrars allowed to manage lists autonomously? Can the number of sessions performed by surgeons be increase from 38 to 42 per year? Can variation between consultant with regards to number of list be reduced? Are extended days, three session days and weekend working an option to increase capacity? How many sessions are consultants allocated for endoscopy lists in their jobplans? Has overbooking been considered as an option to reduce DNA? Next steps: Align endoscopy capacity and demand Consider standardising consultant lists and increasing nurse led lists 32
34 Section 6 Consultant time


35 Consultant time breakdown in Gastroenterology The pie chart below displays the split of programmed activities across Direct Clinical Care and Supporting Professional Activities according to informal job plans* Breakdown of PA s Number of PA s % of total Direct Clinical Care 70 68% Supporting Professional Activities 25 24% Other externally funded activities 8 8% Total % * Job plans as at 12 th May 13 sent by Richard Evans. Please note that the job plans are under consideration and still being updated. Numbers on this slide are for conversation purposes only as there is a likelihood that they might change 34


36 Consultant time breakdown The graph below displays the split of programmed activities by Consultant across Direct Clinical Care and Supporting Professional Activities according to informal job plans* Of a total of 103 PA s across the consultants, 24% are allocated to Supporting Professional Activities The graph on the right displays the time allocated to Supporting Professional Activities as a percentage of Direct Clinical Care by consultant *Job plans as at 12 th May 13 sent by Richard Evans. Please note that the job plans are under consideration and still being updated. Numbers on this slide are for conversation purposes only as there is a likelihood that they might change 35
 5.33 MDT Meeting 4.")

37 Detail of Direct Clinical Care The graph below displays the split of direct clinical care according to informal job plans*. The graph below displays the split of DCC Category Number of PA's Endoscopy Outpatients Ward Rounds PR Admin 9.40 Emergency (on call) 5.33 MDT Meeting 4.54 Emergency (endoscopy) 0.90 Other 4.8 Total The other DCCs include 2 sessions of ERCP sessions of Manometry for Dr Thomas and 2.5 for Bowel cancer screening sessions - 1 each for Dr Dolwani and Dr Green and 0.5 for Dr. Hawthorne *Job plans as at 12 th May 13 sent by Richard Evans. Please note that the job plans are under consideration and still being updated. Numbers on this slide are for conversation purposes only as there is a likelihood that they might change 36
38 Section 7 Appendix
39 HRG description HRG Group D Bronchiectasis Bronchopneumonia w cc Bronchopneumonia w/o cc Chronic Obstructive Pulmonary Disease or Bronchitis w cc Chronic Obstructive Pulmonary Disease or Bronchitis w/o cc Pulmonary Embolis w/o cc Pulmonary Oedema Respiratory Failure w cc Respiratory Neoplasms Sleep Disordered Breathing Unspecified Acute Lower Respiratory Infection HRG Group G Acute Liver Disorders Biliary Tract Disorders <70 w/o cc Biliary Tract Disorders >69 or w cc Chronic Liver Disorders <70 w/o cc Chronic Liver Disorders >69 or w cc Chronic Pancreatic Disease <70 Chronic Pancreatic Disease >69 Complex Elderly with a Hepato-Biliary or Pancreatic System Primary Diagnosis Liver - Major Procedures <70 w/o cc Liver - Major Procedures >69 or w cc Liver - Very Major Procedures Therapeutic Pancreatic or Biliary Procedures Therapeutic Pancreatic or Billary Procedures with Neoplasms HRG Group F Anal Disorders Diagnostic Procedures, Oesophagus and Stomach Disorders of the Oesophagus <70 w/o cc Disorders of the Oesophagus >69 or w cc Gastrointestinal Bleed - Diagnostic Endoscopic or Intermediate Procedures Gastrointestinal Bleed - Major or Therapeutic Endoscopic Procedures Gastrointestinal Bleed - Very Major Procedures Gastrointestinal Bleed <70 w/o cc Gastrointestinal Bleed >69 or w cc General Abdominal - Diagnostic Procedures General Abdominal - Endoscopic or Intermediate Procedures >69 or w cc General Abdominal - Very Major or Major Procedures <70 w/o cc General Abdominal Disorders <70 w/o cc General Abdominal Disorders >69 or w cc Inflammatory Bowel Disease - Endoscopic or Intermediate Procedures <70 w/o cc Inflammatory Bowel Disease - Endoscopic or Intermediate Procedures >69 or w cc Inflammatory Bowel Disease <70 w/o cc Inflammatory Bowel Disease >69 or w cc Intestinal Infectious Disorders <70 w/o cc Intestinal Infectious Disorders >69 or w cc Large Intestinal Disorders <70 w/o cc Large Intestinal Disorders >69 or w cc Large Intestine - Very Major Procedures Oesophagus - Major Procedures or Prostheses Oesophagus - Very Major Procedures Stomach or Duodenum - Major Procedures >69 or w cc Stomach or Duodenum - Therapeutic Endoscopic or Intermediate Procedures Stomach or Duodenum Disorders <70 w/o cc Stomach or Duodenum Disorders >69 or w cc Stomach or Duodenum Disorders >69 or w cc HRG Group L Acute Renal Failure >69 or w cc Complex Elderly with a Urinary Tract or Male Reproductive System Primary Diagnosis Kidney or Urinary Tract Infections <70 w/o cc Kidney or Urinary Tract Infections >69 or w cc Non OR Admission for Kidney or Urinary Tract Neoplasms >69 or w cc Renal General Disorders <70 w/o cc Renal General Disorders >69 or w cc Renal Replacement Therapy w/o cc Ureter Major Endoscopic Procedure Urinary Tract Findings <70 w/o cc Urinary Tract Findings >69 or w cc HRG Group S Complex Elderly with a Haematology, Infectious Disease, Poisoning, or Non-specific Primary Diagnosis Malignant Disorder of the Lymphatic/ Haematological Systems with los <2 days Malignant Disorder of the Lymphatic/ Haematological Systems with los >1 day Poisoning, Toxic, Environmental and Unspecified Effects 38
40 Ernst & Young LLP Assurance Tax Transactions Advisory The UK firm Ernst & Young LLP is a limited liability partnership registered in England and Wales with registered number OC and is a member firm of Ernst & Young Global Limited. Ernst & Young LLP, 1 More London Place, London SE1 2AF. Ernst & Young LLP Published in the UK. All rights reserved.
05/04/2016. Joint Advisory Group on GI Endoscopy 2015 GRS Census Analysis of Responses
 05/04/2016 Joint Advisory Group on GI Endoscopy 2015 GRS Census Analysis of Responses Background Annual Census of Endoscopy Units Conducted during April and May 2015 477 units invited to participate. Note
London CCG Neurology Profile
 CCG Neurology Profile November 214 Summary NHS Hammersmith And Fulham CCG Difference from Details Comments Admissions Neurology admissions per 1, 2,13 1,94 227 p.1 Emergency admissions per 1, 1,661 1,258
NHS performance statistics
 NHS performance statistics Published: 8 th February 218 Geography: England Official Statistics This monthly release aims to provide users with an overview of NHS performance statistics in key areas. Official
NHS performance statistics
 NHS performance statistics Published: 14 th December 217 Geography: England Official Statistics This monthly release aims to provide users with an overview of NHS performance statistics in key areas. Official
NHS Performance Statistics
 NHS Performance Statistics Published: 8 th March 218 Geography: England Official Statistics This monthly release aims to provide users with an overview of NHS performance statistics in key areas. Official
Quality and Safety Committee
 Betsi Cadwaladr University Health Board Committee Paper 13.6.13 Item QS13/112.1 Name of Committee: Subject: Summary or Issues of Significance Quality and Safety Committee Endoscopy action plan Situation:.This
Mental Health Crisis Pathway Analysis
 Mental Health Crisis Pathway Analysis Contents Data sources Executive summary Mental health benchmarking project (Provider) Access Referrals Caseload Activity Workforce Finance Quality Urgent care benchmarking
Lean service redesign in GI: with productive outpatients
 Dramatic Results Dramatic Results Dramatic Results Dramatic Dramatic Results Dramatic Lean service redesign in GI: with productive outpatients Project sponsor - Richard Cohen Project Lead - Esther Rainbow
DELIVERING THE LONDON QUALITY STANDARDS AND 7 DAY SERVICES
 Enclosure I DELIVERING THE LONDON QUALITY STANDARDS AND 7 DAY SERVICES Trust Board Meeting Item: 13 Date: 25 th May 2016 Purpose of the Report: Enclosure: I To update the Board on the Trust s current performance
Results of censuses of Independent Hospices & NHS Palliative Care Providers
 Results of censuses of Independent Hospices & NHS Palliative Care Providers 2008 END OF LIFE CARE HELPING THE NATION SPEND WISELY The National Audit Office scrutinises public spending on behalf of Parliament.
The PCT Guide to Applying the 10 High Impact Changes
 The PCT Guide to Applying the 10 High Impact Changes This Guide has been produced by the NHS Modernisation Agency. For further information on the Agency or the 10 High Impact Changes please visit www.modern.nhs.uk
SHEFFIELD TEACHING HOSPITALS NHS FOUNDATION TRUST EXECUTIVE SUMMARY REPORT TO THE TRUST BOARD HELD ON 18 NOVEMBER 2015
 SHEFFIELD TEACHING HOSPITALS NHS FOUNDATION TRUST EXECUTIVE SUMMARY REPORT TO THE TRUST BOARD HELD ON 18 NOVEMBER 2015 Subject: Supporting TEG Member: Authors: Status 1 Data Quality Baseline Assessment
Commissioning for Value insight pack
 Commissioning for Value insight pack NHS England Gateway ref: 00525 Contents Introduction: the call to action The approach Where to look using indicative data Phase 2 & 3 Why act what benefits do the population
Colorectal Straight To Test Pathway for 2 week wait referrals. Harriet Watson, Colorectal Consultant Nurse
 Colorectal Straight To Test Pathway for 2 week wait referrals Harriet Watson, Colorectal Consultant Nurse 1 Background Traditional 2WW model Outpatient clinic within day 14 20 minute appointment but usually
RTT Recovery Planning and Trajectory Development: A Cambridge Tale
 RTT Recovery Planning and Trajectory Development: A Cambridge Tale Linda Clarke Head of Operational Performance Addenbrooke s Hospital I Rosie Hospital Apr 2014 May 2014 Jun 2014 Jul 2014 Aug 2014 Sep
Trust Board DECISION NOTE. Recommendation
 Recommendation DECISION NOTE Reporting to: The Trust Board is asked to APPROVE the recommendation made by the Sustainability Committee to implement Option 3 of the Endoscopy Business Case. Trust Board
Physiotherapy outpatient services survey 2012
 14 Bedford Row, London WC1R 4ED Tel +44 (0)20 7306 6666 Web www.csp.org.uk Physiotherapy outpatient services survey 2012 reference PD103 issuing function Practice and Development date of issue March 2013
Salisbury NHS Foundation Trust Individual Placement (Job) Descriptions for Foundation Year 1
 Descriptions for Foundation Year 1") Salisbury NHS Foundation Trust Individual Placement (Job) Descriptions for Foundation Year 1 Placement The department The type of work to expect and learning opportunities F1 Cardiology The Department
Salisbury NHS Foundation Trust Individual Placement (Job) Descriptions for Foundation Year 1 Placement The department The type of work to expect and learning opportunities F1 Cardiology The Department
Reference costs 2016/17: highlights, analysis and introduction to the data
 Reference s 2016/17: highlights, analysis and introduction to the data November 2017 We support providers to give patients safe, high quality, compassionate care within local health systems that are financially
ew methods for forecasting bed requirements, admissions, GP referrals and associated growth
 Page 1 of 8 ew methods for forecasting bed requirements, admissions, GP referrals and associated growth Dr Rod Jones (ACMA) Statistical Advisor Healthcare Analysis & Forecasting Camberley For further articles
Operational Focus: Performance
 Operational Focus: Performance Sandra Iskander Changes for 2015/16 Change of focus of 18-weeks and A&E 4-hour wait targets as recommended by Sir Bruce Keogh, Medical Director, NHS England. 18-weeks to
Therapeutic Apheresis Services. User Satisfaction Survey. April 2017
 Therapeutic Apheresis Services User Satisfaction Survey 2017 Claire Gillson Service Development Manager Therapeutic Apheresis Services Olivia Pirret National Administrator Therapeutic Apheresis Services
Ayrshire and Arran NHS Board
 Paper 12 Ayrshire and Arran NHS Board Monday 9 October 2017 Planned Care Performance Report Author: Fraser Doris, Performance Information Analyst Sponsoring Director: Liz Moore, Director for Acute Services
GASTROENTEROLOGY. Department of Medicine
 GASTROENTEROLOGY Department of Medicine Overview The Division of Gastroenterology at Queen s University offers a nationally recognized two-year residency program that prepares graduates for stimulating
Ambulatory emergency care Reimbursement under the national tariff
 HFMA briefing Ambulatory emergency care Reimbursement under the national tariff Introduction Ambulatory emergency care is defined as a service that allows a patient to be seen, diagnosed and treated and
Review of Follow-up Outpatient Appointments Hywel Dda University Health Board. Audit year: Issued: October 2015 Document reference: 491A2015
 Review of Follow-up Outpatient Appointments Hywel Dda University Health Board Audit year: 2014-15 Issued: October 2015 Document reference: 491A2015 Status of report This document has been prepared as part
Inpatient, Day case and Outpatient Stage of Treatment Waiting Times
 Publication Report Inpatient, Day case and Outpatient Stage of Treatment Waiting Times Monthly and quarterly data to 31 December 2016 Publication date 28 February 2017 A National Statistics Publication
Performance and Quality Report Sean Morgan Director of Performance and Delivery Mary Hopper Director of Quality Dino Pardhanani, Clinical Director
 Sutton CCG Clinical Commissioning Group Governing Body Date Thursday, 06 September 2018 Document Title Lead Director (Name and Role) Clinical Sponsor (Name and Role) Performance and Quality Report Sean
Inpatient, Day case and Outpatient Stage of Treatment Waiting Times
 Publication Report Inpatient, Day case and Outpatient Stage of Treatment Waiting Times Monthly and quarterly data to 30 June 2017 Publication date 29 August 2017 A National Statistics Publication for Scotland
NHS Diagnostic Waiting Times and Activity Data
 NHS Diagnostic Waiting Times and Activity Data 1 NHS Diagnostic Waiting Times and Activity Data March 2017 Monthly Report Version number: 1 First published: 11 th May 2017 Prepared by: Operational Information
Committee is requested to action as follows: Richard Walker. Dylan Williams
 BetsiCadwaladrUniversityHealthBoard Committee Paper 17.11.14 Item IG14_60 NameofCommittee: Subject: Summary or IssuesofSignificance StrategicTheme/Priority / Valuesaddressedbythispaper Information Governance
RTT Assurance Paper. 1. Introduction. 2. Background. 3. Waiting List Management for Elective Care. a. Planning
 RTT Assurance Paper 1. Introduction The purpose of this paper is to provide assurance to Trust Board in relation to the robust management of waiting lists and timely delivery of elective patient care within
NHS Diagnostic Waiting Times and Activity Data
 NHS Diagnostic Waiting Times and Activity Data 1 NHS Diagnostic Waiting Times and Activity Data February 2018 Monthly Report Version number: 1 First published: 12 th April 2018 Prepared by: Operational
Page 1 of 26. Clinical Governance report prepared for NHS Lanarkshire Board Report title Clinical Governance Corporate Report - November 2014
 Clinical Governance report prepared for NHS Lanarkshire Board Report title Clinical Governance Corporate Report - November 2014 Clinical Quality Service Page 1 of 26 Print Date:18/11/2014 Clinical Governance
Urology Clinical Forum. 11 th March 2015
 Urology Clinical Forum 11 th March 2015 Welcome and Introductions Justin Vale, Chair of the LCA Urology Pathway Group Progress of the Urology Pathway Group Justin Vale, Chair of the LCA Urology Pathway
Monthly and Quarterly Activity Returns Statistics Consultation
 Monthly and Quarterly Activity Returns Statistics Consultation Monthly and Quarterly Activity Returns Statistics Consultation Version number: 1 First published: 08/02/2018 Prepared by: Classification:
NHS Diagnostic Waiting Times and Activity Data
 NHS Diagnostic Waiting Times and Activity Data 1 NHS Diagnostic Waiting Times and Activity Data January 2017 Monthly Report Version number: 1 First published: 9 th March 2017 Prepared by: Operational Information
The PCT Guide to Applying the 10 High Impact Changes. A guide from NatPaCT
 The PCT Guide to Applying the 10 High Impact Changes A guide from NatPaCT DH INFORMATION READER BOX Policy HR/Workforce Management Planning Clinical Estates Performance IM&T Finance Partnership Working
Interactive Urological Outpatient Workshop
 Interactive Urological Outpatient Workshop One Stop Urology Clinic design Norfolk and Norwich University Hospitals 25 th September 2014 Is this your service? Multiple entry points into the service new
WAITING TIMES AND ACCESS TARGETS
 NHS Board Meeting Tuesday 21 April 2015 Chief Officer (Acute Services) Board Paper No.15/17 WAITING TIMES AND ACCESS TARGETS Recommendation: The NHS Board is asked to note progress against the national
PATIENT ACCESS POLICY (ELECTIVE CARE) UHB 033 Version No: 1 Previous Trust / LHB Ref No: Senior Manager, Performance and Compliance.
 UHB 033 Version No: 1 Previous Trust / LHB Ref No: Senior Manager, Performance and Compliance.") Reference No: PATIENT ACCESS POLICY (ELECTIVE CARE) UHB 033 Version No: 1 Previous Trust / LHB Ref No: Trust 364 Documents to read alongside this Policy. Ministerial Letter EH/ML/004/09 WAG Rules for Managing
Reference No: PATIENT ACCESS POLICY (ELECTIVE CARE) UHB 033 Version No: 1 Previous Trust / LHB Ref No: Trust 364 Documents to read alongside this Policy. Ministerial Letter EH/ML/004/09 WAG Rules for Managing
Performance. Improvement in Scheduled Care Waiting List Management TOOLKIT. An Roinn Sláinte DEPARTMENT OF HEALTH. January 2013
 Performance TOOLKIT in Scheduled Care January 2013 Patient Toolkit Pathways Performance in Scheduled Care Setting the context and initiating whole systems change for the delivery of scheduled care and
WAITING TIMES 1. PURPOSE
 Agenda Item Meeting of Lanarkshire NHS Board 28 April 2010 Lanarkshire NHS board 14 Beckford Street Hamilton ML3 0TA Telephone 01698 281313 Fax 01698 423134 www.nhslanarkshire.org.uk WAITING TIMES 1. PURPOSE
Unscheduled care Urgent and Emergency Care
 Unscheduled care Urgent and Emergency Care Professor Derek Bell Acute Medicine Director NIHR CLAHRC for NW London Imperial College London Chelsea and Westminster Hospital Value as the overarching, unifying
Respiratory Clinical Review of Patients with Community Acquired Pneumonia
 Respiratory Clinical Review of Patients with Community Acquired Pneumonia DrPeter Wu Staff Specialist Department of Respiratory & Sleep Medicine Westmead Hospital Western Sydney Local Health District How
WAITING TIMES AND ACCESS TARGETS
 NHS Board Meeting Tuesday 17 February 2015 Chief Officer (Acute Services) Board Paper No.15/08 WAITING TIMES AND ACCESS TARGETS Recommendation: The NHS Board is asked to note progress against the national
A Step-by-Step Guide to Tackling your Challenges
 Institute for Innovation and Improvement A Step-by-Step to Tackling your Challenges Click to continue Introduction This book is your step-by-step to tackling your challenges using the appropriate service
NHS Diagnostic Waiting Times and Activity Data
 NHS Diagnostic Waiting Times and Activity Data 1 NHS Diagnostic Waiting Times and Activity Data May 2015 Monthly Report Version number: 1 First published: 8 th July 2015 Prepared by: NHS England Analytical
Redesign of Front Door
 Redesign of Front Door Transforming Acute and Urgent Care Strategic Background and Context Our Change and Improvement Programme What have we achieved and how? What did we learn? Ian Aitken, General Manager
Sheffield Teaching Hospitals NHS Foundation Trust
 Sheffield Teaching Hospitals NHS Foundation Trust @seamlesssurgery Seamless Surgery Team Sheffield Teaching Hospitals NHS Foundation Trust July 2017 PROUD TO MAKE A DIFFERENCE PROUD TO MAKE A DIFFERENCE
SELF ASSESSMENT REPORT (MULTI-DISCIPLINARY TEAM)
") SELF ASSESSMENT REPORT (MULTI-DISCIPLINARY TEAM) Network Trust MDT MDT Lead Clinician 3CCN WORCESTERSHIRE ACUTE HOSPITALS Worcestershire Acute Hospitals NHS Trust Local Upper GI MDT (11-2F-1) - 2011/12
SELF ASSESSMENT REPORT (MULTI-DISCIPLINARY TEAM) Network Trust MDT MDT Lead Clinician 3CCN WORCESTERSHIRE ACUTE HOSPITALS Worcestershire Acute Hospitals NHS Trust Local Upper GI MDT (11-2F-1) - 2011/12
NHS Diagnostic Waiting Times and Activity Data
 NHS Diagnostic Waiting Times and Activity Data 1 NHS Diagnostic Waiting Times and Activity Data March 2018 Monthly Report Version number: 1 First published: 10 th May 2018 Prepared by: Operational Information
Inpatient, Day case and Outpatient Stage of Treatment Waiting Times
 Publication Report Inpatient, Day case and Outpatient Stage of Treatment Waiting Times Monthly and quarterly data to 30 June 2016 Publication date 30 August 2016 A National Statistics Publication for Scotland
NHS Diagnostic Waiting Times and Activity Data
 NHS Diagnostic Waiting Times and Activity Data 1 NHS Diagnostic Waiting Times and Activity Data January 2016 Monthly Report Version number: 1 First published: 10 th March 2016 Prepared by: Operational
Nottingham University Hospitals Emergency Department Quality Issues Related to Performance
 RCCG/GB/14/123 Nottingham University Hospitals Emergency Department Quality Issues Related to Performance Introduction NUH have failed to meet the 95% 4 hour wait standard for a number of consecutive months.
Experience of inpatients with ulcerative colitis throughout
 Experience of inpatients with ulcerative colitis throughout the UK UK inflammatory bowel disease (IBD) audit Executive summary report June 2014 Prepared by the Clinical Effectiveness and Evaluation Unit
Cardiff & Vale of Glamorgan CHC Members Monitoring Visit Cardiff North Renal Unit 7 th November 2012
 Cardiff & Vale of Glamorgan CHC Members Monitoring Visit Cardiff North Renal Unit 7 th November 2012 Cyngor Iechyd Cymuned Caerdydd a Bro Morgannwg Tydydd Llawr Tŷ r Parc, Heol Y Brodyr Llwydion CAERDYDD
Seven Day Working: in Practice Clinicians Perspective. Jonathan Vickers Consultant surgeon Dec 2015
 Seven Day Working: in Practice Clinicians Perspective Jonathan Vickers Consultant surgeon Dec 2015 Why me? Mr. Hunt argued that hospitals like Salford Royal and Northumbria have instituted seven-day working
NHS Diagnostic Waiting Times and Activity Data
 NHS Diagnostic Waiting Times and Activity Data 1 NHS Diagnostic Waiting Times and Activity Data July 2018 Monthly Report Version number: 1 First published: 13 th September 2018 Prepared by: Operational
CHAPTER TWO: WAITING LISTS AND BOOKING
 TWO: INTRODUCTION Managing waiting lists 2.1 Sometimes it seems that the NHS is primarily about waiting lists. Public perception focuses on waiting lists. Waiting lists provide media headlines. For those
NHS Diagnostic Waiting Times and Activity Data
 NHS Diagnostic Waiting Times and Activity Data 1 NHS Diagnostic Waiting Times and Activity Data November 2017 Monthly Report Version number: 1 First published: 11 th January 2018 Prepared by: Operational
Allied Health Review Background Paper 19 June 2014
 Allied Health Review Background Paper 19 June 2014 Background Mater Health Services (Mater) is experiencing significant change with the move of publicly funded paediatric services from Mater Children s
Internal Medicine Residency Program Rotation Curriculum
 University of California, Irvine Department of Medicine Internal Medicine Residency Program Rotation Curriculum I. Rotation Sites and Supervision Rotation Name: GASTROENTEROLOGY CONSULT Site Faculty Supervisor
Scottish Hospital Standardised Mortality Ratio (HSMR)
") ` 2016 Scottish Hospital Standardised Mortality Ratio (HSMR) Methodology & Specification Document Page 1 of 14 Document Control Version 0.1 Date Issued July 2016 Author(s) Quality Indicators Team Comments
` 2016 Scottish Hospital Standardised Mortality Ratio (HSMR) Methodology & Specification Document Page 1 of 14 Document Control Version 0.1 Date Issued July 2016 Author(s) Quality Indicators Team Comments
National clinical audit of inpatient care for adults with ulcerative colitis
 National clinical audit of inpatient care for adults with ulcerative colitis UK inflammatory bowel disease (IBD) audit Executive summary report June 2014 Prepared by the Clinical Effectiveness and Evaluation
SPECIALTY DOCTOR IN GASTROENTEROLOGY BASED AT GLASGOW ROYAL INFIRMARY INFORMATION PACK REF: 23258D CLOSING DATE: 1 ST JULY 2011
 SPECIALTY DOCTOR IN GASTROENTEROLOGY BASED AT GLASGOW ROYAL INFIRMARY INFORMATION CK REF: 23258D CLOSING DATE: 1 ST JULY 2011 BB004DEC2008 SUMMARY INFORMATION NHS GREATER GLASGOW AND CLYDE EMERGENCY CARE
Lorenzo for clinical outcomes transformation? Ben Bridgewater
 Lorenzo for clinical outcomes transformation? Ben Bridgewater Global Trends - Outcomes and Transformation: The Landscape The problems The obstacles The solutions Ageing population and consumerism Increasing
Mental Health: What The Data Tells Us. Stephen Watkins and Zoë Page
 1 Mental Health: What The Data Tells Us Stephen Watkins and Zoë Page Overview NHS Benchmarking Network Acute pathway Community based care Workforce Economics Discussion points NHS Benchmarking Network
Executive Summary 10 th September Dr. Richard Wagland. Dr. Mike Bracher. Dr. Ana Ibanez Esqueda. Professor Penny Schofield
 Experiences of Care of Patients with Cancer of Unknown Primary (CUP): Analysis of the 2010, 2011-12 & 2013 Cancer Patient Experience Survey (CPES) England. Executive Summary 10 th September 2015 Dr. Richard
21 March NHS Providers ON THE DAY BRIEFING Page 1
 21 March 2018 NHS Providers ON THE DAY BRIEFING Page 1 2016-17 (Revised) 2017-18 (Revised) 2018-19 2019-20 (Indicative budget) 2020-21 (Indicative budget) Total revenue budget ( m) 106,528 110,002 114,269
102/14(ii) Bridgewater Board Date. Thursday 5 June Agenda item. Safe Staffing April 2014 Review
 Bridgewater Board Date. Thursday 5 June Agenda item. Safe Staffing April 2014 Review") Bridgewater Board Date Thursday 5 June 2014 Agenda item 102/14(ii) Title Safe Staffing April 2014 Review Sponsoring Director Authors Presented by Purpose Dorian Williams, Executive Nurse/Director of Governance
Bridgewater Board Date Thursday 5 June 2014 Agenda item 102/14(ii) Title Safe Staffing April 2014 Review Sponsoring Director Authors Presented by Purpose Dorian Williams, Executive Nurse/Director of Governance
The 18-week wait programme
 Large scale workforce change briefing The 18-week wait programme Findings, successes and learning from NHS Employers large scale workforce change 18-week programme This Briefing summarises some of the
Factors associated with variation in hospital use at the End of Life in England
 Factors associated with variation in hospital use at the End of Life in England Martin Bardsley,Theo Georghiou, John Billings Nuffield Trust Aims Explore recent work undertaken by the Nuffield Trust 1.
Same day emergency care: clinical definition, patient selection and metrics
 Ambulatory emergency care guide Same day emergency care: clinical definition, patient selection and metrics Published by NHS Improvement and the Ambulatory Emergency Care Network June 2018 Contents 1.
Paediatric Critical Care and Specialised Surgery in Children Review. Paediatric critical care and ECMO: interim update
 Gateway Reference: 06662 Paediatric Critical Care and Specialised Surgery in Children Review Paediatric critical care and ECMO: interim update June 2017 Contents Executive summary 1. Introduction 2. Context
NHS WALES INFORMATICS SERVICE DATA QUALITY STATUS REPORT ADMITTED PATIENT CARE DATA SET
 NHS WALES INFORMATICS SERVICE DATA QUALITY STATUS REPORT ADMITTED PATIENT CARE DATA SET Version: 1.0 Date: 1 st September 2016 Data Set Title Admitted Patient Care data set (APC ds) Sponsor Welsh Government
PATIENT RIGHTS ACT (SCOTLAND) 2011 ACCESS POLICY FOR TREATMENT TIME GUARANTEE
 2011 ACCESS POLICY FOR TREATMENT TIME GUARANTEE") NHS Board Meeting Tuesday 16 October 2012 Chief Operating Officer (Acute Services Division) Board Paper No. 12/45 PATIENT RIGHTS ACT (SCOTLAND) 2011 ACCESS POLICY FOR TREATMENT TIME GUARANTEE Recommendation:
NHS Board Meeting Tuesday 16 October 2012 Chief Operating Officer (Acute Services Division) Board Paper No. 12/45 PATIENT RIGHTS ACT (SCOTLAND) 2011 ACCESS POLICY FOR TREATMENT TIME GUARANTEE Recommendation:
Clinical NURSE. Specialist SURVEY
 Clinical NURSE Specialist SURVEY RESULTS SUMMARY MAY 2 rk? o w ou y o ed r ew e i h v e W r ou y do nts? e r e e Wh r pati tle? i t you job u o is y t ase a e h s i W of d th? s a re k wi a t r a Wh ou
Homelessness and hospital discharge in Wirral: an investigation into the Hospital Discharge Project. Jonathan White
 Homelessness and hospital discharge in Wirral: an investigation into the Hospital Discharge Project Jonathan White NHS Brief No. 2, October 2011 Homelessness and hospital discharge in Wirral: an investigation
WEST HAMPSHIRE PERFORMANCE REPORT. Based on performance data available as at 11 th January 2018
 WEST HAMPSHIRE PERFORMANCE REPORT Based on performance data available as at 11 th January 2018 1 CCG Quality and Performance Executive Summary Introduction: The purpose of this report is to provide an
Clinical Commissioning Group Governing Body Paper Summary Sheet Date of Meeting: 26 September 2017
 Clinical Commissioning Group Governing Body Paper Summary Sheet Date of Meeting: 26 September 2017 For: PUBLIC session PRIVATE Session For: Decision Discussion Noting Agenda Item and title: Author: GOV/17/09/15
Summarise the Impact of the Health Board Report Equality and diversity
 AGENDA ITEM 4.1 Health Board Report INTEGRATED PERFORMANCE DASHBOARD Executive Lead: Director of Planning and Performance Author: Assistant Director of Performance and Information Contact Details for further
Inflammatory bowel disease service. Information for patients
 Inflammatory bowel disease service Information for patients We ve written this leaflet to explain about our inflammatory bowel disease (IBD) service. If you have ulcerative colitis, Crohn s disease or
Clinical Use of Blood The AIM II Trial. Challenges of Near-Live Organisational Blood Use Monitoring
 Clinical Use of Blood The AIM II Trial Challenges of Near-Live Organisational Blood Use Monitoring Goals for AIM Assist hospitals in complying with timely metric driven standards Create an inclusive approach
End of Life Care Commissioning Strategy. NHS North Lincolnshire - Adding Life to Years and Years to Life
 End of Life Care Commissioning Strategy NHS North Lincolnshire - Adding Life to Years and Years to Life END OF LIFE CARE 1. Background NHS North Lincolnshire End of Life Care Commissioning Strategy The
Lanarkshire NHS board 14 Beckford Street Hamilton ML3 0TA Telephone Fax
 Agenda Item Meeting of Lanarkshire NHS Board 25 February 2009 Lanarkshire NHS board 14 Beckford Street Hamilton ML3 0TA Telephone 01698 281313 Fax 01698 423134 www.nhslanarkshire.co.uk WAITING TIMES 1.
April Clinical Governance Corporate Report Narrative
 April 14 - Clinical Governance Corporate Report Narrative ITEM 7B Narrative has been provided where there is something of note in relation to a specific metric; this could be positive improvement, decline
SOUTHAMPTON UNIVERSITY HOSPITALS NHS TRUST Trust Key Performance Indicators May Regular report to Trust Board
 SOUTHAMPTON UNIVERSITY HOSPITALS NHS TRUST Trust Key Performance Indicators May 20 Report to: Trust Board July 20 Report from: Sponsoring Executive: Aim of Report/Principle Topic: Review History to date:
Care Quality Commission (CQC) Technical details patient survey information 2011 Inpatient survey March 2012
 Technical details patient survey information 2011 Inpatient survey March 2012") Care Quality Commission (CQC) Technical details patient survey information 2011 Inpatient survey March 2012 Contents 1. Introduction... 1 2. Selecting data for the reporting... 1 3. The CQC organisation
Care Quality Commission (CQC) Technical details patient survey information 2011 Inpatient survey March 2012 Contents 1. Introduction... 1 2. Selecting data for the reporting... 1 3. The CQC organisation
A census of cancer, palliative and chemotherapy speciality nurses and support workers in England in 2017
 A census of cancer, palliative and chemotherapy speciality nurses and support workers in England in 2017 2 Contents Contents Foreword 2 Executive Summary 4 Background and Methodology 6 Headline findings
NHS WALES INFORMATICS SERVICE DATA QUALITY STATUS REPORT ADMITTED PATIENT CARE DATA SET
 NHS WALES INFORMATICS SERVICE DATA QUALITY STATUS REPORT ADMITTED PATIENT CARE DATA SET Version: 1.0 Date: 17 th August 2017 Data Set Title Admitted Patient Care data set (APC ds) Sponsor Welsh Government
West Middlesex Junior Doctors Handbook in Colorectal Surgery
 West Middlesex Junior Doctors Handbook in Colorectal Surgery Page 1 of 10 INTRODUCTION Welcome to surgery and to the colorectal team! This guide is meant to be just that, a guide and has been principally
General Practice Extended Access: March 2018
 General Practice Extended Access: March 2018 General Practice Extended Access March 2018 Version number: 1.0 First published: 3 May 2017 Prepared by: Hassan Ismail, Data Analysis and Insight Group, NHS
The Royal Infirmary of Edinburgh. Endoscopy Operational Policy
 The Royal Infirmary of Edinburgh Endoscopy Operational Policy Date issued 1 st November 2009 Reviewed Next Review August 2012 Responsible H Chisholm K Trimble/N Church/H Chisholm 9/2011 1 INTRODUCTION
Section 1 - Key Performance Indicators
 Clinical Quality Report Month 6 2016/17 period ending 30th September 2016 Section 1 - Key Performance Indicators 1.1 NHS Improvement; Risk Assessment Framework Clostridium difficile Indicator M6 2 YTD
Diagnostics FAQs. Frequently Asked Questions on completing the Diagnostic Waiting Times & Activity monthly data collection
 Diagnostics FAQs Frequently Asked Questions on completing the Diagnostic Waiting Times & Activity monthly data collection First published: October 2006 Updated: 02 February 2015 Prepared by Analytical
Portsmouth Hospitals NHS Trust Individual Placement (Job) Descriptions for Foundation Year 1
 Descriptions for Foundation Year 1") Portsmouth Hospitals NHS Trust Individual Placement (Job) Descriptions for Foundation Year 1 Placement The department Where the is for the in this F1 Acute Placement Acute Medicine Unit/Surgical Assessment
Portsmouth Hospitals NHS Trust Individual Placement (Job) Descriptions for Foundation Year 1 Placement The department Where the is for the in this F1 Acute Placement Acute Medicine Unit/Surgical Assessment
Medicare Spending and Rehospitalization for Chronically Ill Medicare Beneficiaries: Home Health Use Compared to Other Post-Acute Care Settings
 Medicare Spending and Rehospitalization for Chronically Ill Medicare Beneficiaries: Home Health Use Compared to Other Post-Acute Care Settings May 11, 2009 Avalere Health LLC Avalere Health LLC The intersection
Policy Summary. Policy Title: Policy and Procedure for Clinical Coding
 Policy Title: Policy and Procedure for Clinical Coding Reference and Version No: IG7 Version 6 Author and Job Title: Caroline Griffin Clinical Coding Manager Executive Lead - Chief Information and Technology
NHS Diagnostic Waiting Times and Activity Data
 NHS Diagnostic Waiting Times and Activity Data 1 NHS Diagnostic Waiting Times and Activity Data February 2016 Monthly Report Version number: 1 First published: 14 th April 2016 Prepared by: Operational