4160 Patterson Avenue, Baltimore, Maryland Phone: Fax: Toll Free: hscrc.maryland.
|
|
|
- Miranda Webb
- 5 years ago
- Views:
Transcription
1 4160 Patterson Avenue, Baltimore, Maryland Phone: Fax: Toll Free: hscrc.maryland.gov 536th MEETING OF THE HEALTH SERVICES COST REVIEW COMMISSION December 14, 2016 EXECUTIVE SESSION 12:00 p.m. (The Commission will begin in public session at 12:00 p.m. for the purpose of, upon motion and approval, adjourning into closed session. The open session will resume at 1:30 p.m.) 1. Update on Contract and Modeling of the All-payer Model vis-a-vis the All-Payer Model Contract Administration of Model Moving into Phase II - Authority General Provisions Article, and Discussion on Planning for Model Progression Authority General Provisions Article, and PUBLIC SESSION 1:30 p.m. 1. Review of the Minutes from the Public Meeting and Executive Session on November 9, Executive Director s Report 3. New Model Monitoring 4. Docket Status Cases Closed 2353A Priority Partners 2356A - Maryland Physician Care 2358A - MedStar Family Choice 2359A - MedStar Family Choice 2360A - University of Maryland Health Advantage, Inc. 2361A Maryland Health Partners 2362A Johns Hopkins Health 2363A - Johns Hopkins Health System 2364A - University of Maryland Medical Center 2365A - University of Maryland Medical Center 5. Docket Status Cases Open 2357A - Hopkins Health Advantage 2366A - Johns Hopkins Health System 2368A - Johns Hopkins Health System 2365A - University of Maryland Medical Center 2367A - Johns Hopkins Health System 6. Recommendations for Updating the Quality-Based Reimbursement Program for Rate Years 2017 (Final), 2018 (Draft), and 2019 (Draft) 7. Extension of Medicaid Current Financing Policy 8. CRISP Update
2 9. Legal Update 10. Hearing and Meeting Schedule
3 Minutes to be included into the post-meeting packet upon approval by the Commissioners
4 Executive Director s Report The Executive Director s Report will be presented during the Commission Meeting
5 New Model Monitoring Report The Report will be presented during the Commission Meeting
6 Cases Closed The closed cases from last month are listed in the agenda
7 H.S.C.R.C's CURRENT LEGAL DOCKET STATUS (OPEN) AS OF DECEMBER 7, 2016 A: PENDING LEGAL ACTION : NONE B: AWAITING FURTHER COMMISSION ACTION: NONE C: CURRENT CASES: Rate Order Docket Hospital Date Decision Must be Analyst's File Number Name Docketed Required by: Issued by: Purpose Initials Status 2357A Hopkins Health Advantage 10/4/2016 N/A N/A N/A DNP OPEN 2365A University of Maryland Medical Center 10/31/2016 N/A N/A N/A DNP OPEN 2366A Johns Hopkins Health System 11/7/2016 N/A N/A N/A DNP OPEN 2367A Johns Hopkins Health System 11/30/2016 N/A N/A N/A DNP OPEN 2368A Johns Hopkins Health System 12/5/2016 N/A N/A N/A DNP OPEN PROCEEDINGS REQUIRING COMMISSION ACTION - NOT ON OPEN DOCKET
8 IN RE: THE ALTERNATIVE * BEFORE THE HEALTH RATE APPLICATION OF * SERVICES COST REVIEW JOHNS HOPKINS HEALTH * COMMISSION SYSTEM * DOCKET: 2016 * FOLIO: 2167 BALTIMORE, MARYLAND * PROCEEDING: 2357A Final Recommendation December 14, 2016
9 I. Introduction On October 4, 2016, the Johns Hopkins Health System (JHHS) filed an application for an Alternative Method of Rate Determination pursuant to COMAR on behalf of its constituent hospitals (the Hospitals ). JHHS seeks approval for Hopkins Health Advantage. Inc. ( HHA ) to continue to participate in a Centers for Medicare and Medicaid Services (CMS) approved Medicare Advantage Plan. HHA is the JHHS entity that assumes the risk under this contract. JHHS is requesting an approval for one year beginning January 1, II. Background On September 1, 2015, CMS granted HHA approval to operate a Medicare Advantage Plan to provide coverage to Maryland eligible residents in Anne Arundel, Baltimore, Calvert, Carroll, Howard, Montgomery, Somerset, Washington, Wicomico, Worcester counties and Baltimore City. The application requests approval for HHA to provide inpatient and outpatient hospital services, as well as certain non-hospital services, in return for a CMS-determined capitation payment. HHA will pay the Hospitals HSCRC-approved rates for hospital services used by its enrollees. HHA supplied a copy of its contract with CMS and financial projections for its operations. III. Staff Review Staff reviewed the reviewed the financial projections for CY 2017, as well as HHA s experience and projections for CY The information reflected the anticipated negative financial results associated with start-up of a Medicare Advantage Plan. 1
10 IV. Recommendation Based on the financial projections, staff believes that the proposed arrangement for HHA is acceptable under Commission policy.therefore, staff recommends that the Commission approve the Hospitals request to participate in CMS Medicare Part C Medicare Advantage Program for a period of one year beginning January 1, The Hospitals must file a renewal application annually for continued participation. In addition, HHA must meet with HSCRC staff prior to August 31, 2017 to review its financial projections for CY In addition, HHA must submit a copy of its quarterly and annual National Association of Insurance Commissioner s (NAIC s) reports within 30 days of submission to the NAIC. Consistent with its policy paper regarding applications for alternative methods of rate determination, the staff recommends that this approval be contingent upon the execution of the standard Memorandum of Understanding ("MOU") with the Hospitals for the approved contract. This document would formalize the understanding between the Commission and the Hospitals, and would include provisions for such things as payments of HSCRC-approved rates, treatment of losses that may be attributed to the contract, quarterly and annual reporting, confidentiality of data submitted, penalties for noncompliance, project termination and/or alteration, on-going monitoring, and other issues specific to the proposed contract. The MOU will also stipulate that operating losses under the contract cannot be used to justify future requests for rate increases. 2
11 IN RE: THE APPLICATION FOR * BEFORE THE MARYLAND HEALTH ALTERNATIVE METHOD OF RATE * SERVICES COST REVIEW DETERMINATION * COMMISSION UNIVERSITY OF MARYLAND * DOCKET: 2016 MEDICAL CENTER * FOLIO: 2175 BALTIMORE, MARYLAND * PROCEEDING: 2365A Amended Staff Recommendation December 14, 2016
12 I. INTRODUCTION The University of Maryland Medical Center ( the Hospital ) filed an application with the HSCRC on October 31, 2016 for an alternative method of rate determination, pursuant to COMAR The Hospital requests approval from the HSCRC to continue to participate in a global rate arrangement for solid organ and blood and bone marrow transplant services with INTERLINK for a period of one year, effective December 1, II. OVERVIEW OF APPLICATION The contract will continue to be held and administered by University Physicians, Inc. (UPI). UPI will manage all financial transactions related to the global price contract including payments to the Hospital and bear all risk relating to regulated services associated with the contract. III. FEE DEVELOPMENT The hospital component of the global rates was developed by calculating mean historical charges for patients receiving like procedures. The remainder of the global rate is comprised of physician service costs. Additional per diem payments were calculated for cases that exceed a specific length of stay outlier threshold. IV. IDENTIFICATION AND ASSESSMENT OF RISK The Hospital will continue to submit bills to UPI for all contracted and covered services. UPI is responsible for billing the payer, collecting payments, disbursing payments to the Hospital at its full HSCRC approved rates, and reimbursing the physicians. The Hospital contends that the arrangement among UPI, the Hospital, and the physicians holds the Hospital harmless from any shortfalls in payment from the global price contract. UPI maintains it has been active in similar types of fixed fee contracts for several years, and that UPI is adequately capitalized to the bear the risk of potential losses. V. STAFF EVALUATION Staff reviewed the experience under this arrangement for the last year and found it to be unfavorable. According to the Hospital, the unfavorable performance was due to clinical
13 complications associated with transplant case. The case was subsequently pulled from the contract and was paid fee for service. In addition, the contract has been modified to mitigate the effect of such cases in the future. V I. STAFF RECOMMENDATION Staff recommends that the Commission approve the Hospital s application to continue to participate in an alternative method of rate determination for solid organ and blood and bone marrow transplant services with INTERLINK for a one year period commencing December 1, Consistent with its policy paper regarding applications for alternative methods of rate determination, the staff recommends that this approval be contingent upon the execution of the standard Memorandum of Understanding ("MOU") with the Hospital for the approved contract. This document would formalize the understanding between the Commission and the Hospital, and would include provisions for such things as payments of HSCRC-approved rates, treatment of losses that may be attributed to the contract, quarterly and annual reporting, confidentiality of data submitted, penalties for noncompliance, project termination and/or alteration, on-going monitoring, and other issues specific to the proposed contract. The MOU will also stipulate that operating losses under the contract cannot be used to justify future requests for rate increases.
14 IN RE: THE APPLICATION FOR * BEFORE THE MARYLAND HEALTH ALTERNATIVE METHOD OF RATE * SERVICES COST REVIEW DETERMINATION * COMMISSION JOHNS HOPKINS HEALTH * DOCKET: 2016 SYSTEM * FOLIO: 2176 BALTIMORE, MARYLAND * PROCEEDING: 2366A Staff Recommendation December 14, 2016
15 I. INTRODUCTION Johns Hopkins Health System ( System ) filed a renewal application with the HSCRC on November 9, 2016 on behalf of the Johns Hopkins Bayview Medical Center (the Hospital ) requesting approval from the HSCRC for continued participation in a capitation arrangement among the System, the Maryland Department of Health and Mental Hygiene (DHMH), and the Centers for Medicare and Medicaid Services (CMS). The Hospital, doing business as Hopkins Elder Plus ( HEP ), serves as a provider in the federal Program of All-inclusive Care for the Elderly ( PACE ). Under this program, HEP provides services for a Medicare and Medicaid dually eligible population of frail elderly. The requested approval is for a period of one year effective January 1, II. OVE RVIEW OF APPLICATION The parties to the contract include the System, DHMH, and CMS. The contract covers medical services provided to the PACE population. The assumptions for enrollment, utilization, and unit costs were developed on the basis of historical HEP experience for the PACE population as previously reviewed by an actuarial consultant. Johns Hopkins HealthCare, LLC assumes the risks under the agreement, and all Maryland hospital services are paid based on HSCRC rates. III. STAFF EVALUATION Staff found that the experience under this arrangement for FY 2016 to be favorable. The Program is projecting a breakeven year in FY III. STAFF RECOMMENDATION Staff recommends that the Commission approve the Hospital s renewal application for an alternative method of rate determination for one year beginning January 1, The Hospital will need to file a renewal application for review to be considered for continued participation. Consistent with its policy paper regarding applications for alternative methods of rate determination, the staff recommends that this approval be contingent upon the execution of the
16 standard Memorandum of Understanding ("MOU") with the Hospital for the approved contract. This document formalizes the understanding between the Commission and the Hospital, and includes provisions for such things as payments of HSCRC-approved rates, treatment of losses that may be attributed to the contract, quarterly and annual reporting, confidentiality of data submitted, penalties for noncompliance, project termination and/or alteration, on-going monitoring, and other issues specific to the proposed contract. The MOU also stipulates that operating losses under the contract cannot be used to justify future requests for rate increases.
17 IN RE: THE APPLICATION FOR * BEFORE THE MARYLAND HEALTH ALTERNATIVE METHOD OF RATE * SERVICES COST REVIEW DETERMINATION * COMMISSION JOHNS HOPKINS HEALTH * DOCKET: 2016 SYSTEM * FOLIO: 2177 BALTIMORE, MARYLAND * PROCEEDING: 2367A Staff Recommendation December 14, 2016
18 I. INTRODUCTION Johns Hopkins Health System (the System ) filed an application with the HSCRC on November 30, 2016 on behalf of Johns Hopkins Hospital and Johns Hopkins Bayview Medical Center (the Hospitals ) and on behalf of Johns Hopkins HealthCare, LLC (JHHC) and Johns Hopkins Employer Health Programs, Inc. for an alternative method of rate determination, pursuant to COMAR The System requests approval from the HSCRC to participate in a global rate arrangement for executive health services, joint replacement, and pancreatic cancer services with Crawford Advisors, LLC for a period of one year beginning January 1, II. OVE RVIEW OF APPLICATION The contract will be held and administered by JHHC, which is a subsidiary of the System. JHHC will manage all financial transactions related to the global price contract including payments to the Hospitals and bear all risk relating to regulated services associated with the contract. III. FEE DEVELOPMENT The hospital portion of the updated global rates was developed by calculating mean historical charges for patients receiving similar joint replacement and cardiovascular procedures at the Hospitals. The remainder of the global rate is comprised of physician service costs. Additional per diem payments were calculated for cases that exceed a specific length of stay outlier threshold. IV. IDENTIFICATION AND ASSESSMENT OF RISK The Hospitals will submit bills to JHHC for all contracted and covered services. JHHC is responsible for billing the payer, collecting payments, disbursing payments to the Hospitals at their full HSCRC approved rates, and reimbursing the physicians. The System contends that the arrangement among JHHC, the Hospitals, and the physicians holds the Hospitals harmless from any shortfalls in payment from the global price contract. JHHC maintains it has been active in similar types of fixed fee contracts for several years, and that JHHC is adequately capitalized to
19 bear the risk of potential losses. V. STAFF EVALUATION After reviewing the Hospital experience data, staff believes that the Hospitals can achieve a favorable experience under this arrangement. VI. STAFF RECOMMENDATION The staff recommends that the Commission approve the Hospitals application for an alternative method of rate determination for executive health services, joint replacement and pancreatic cancer services for a one year period commencing January 1, The Hospitals will need to file a renewal application for review to be considered for continued participation. Consistent with its policy paper regarding applications for alternative methods of rate determination, the staff recommends that this approval be contingent upon the execution of the standard Memorandum of Understanding ("MOU") with the Hospitals for the approved contract. This document would formalize the understanding between the Commission and the Hospitals, and would include provisions for such things as payments of HSCRC-approved rates, treatment of losses that may be attributed to the contract, quarterly and annual reporting, confidentiality of data submitted, penalties for noncompliance, project termination and/or alteration, on-going monitoring, and other issues specific to the proposed contract. The MOU will also stipulate that operating losses under the contract cannot be used to justify future requests for rate increases.
20 IN RE: THE APPLICATION FOR * BEFORE THE MARYLAND HEALTH ALTERNATIVE METHOD OF RATE * SERVICES COST REVIEW DETERMINATION * COMMISSION JOHNS HOPKINS HEALTH * DOCKET: 2016 SYSTEM * FOLIO: 2178 BALTIMORE, MARYLAND * PROCEEDING: 2368A Staff Recommendation December 14, 2016
21 I. INTRODUCTION Johns Hopkins Health System ( System ) filed an application with the HSCRC on December 5, 2016 on behalf of its member hospitals, Johns Hopkins Hospital, Johns Hopkins Bayview Medical Center, and Howard County General Hospital ( the Hospitals ) and on behalf of Johns Hopkins HealthCare, LLC (JHHC) and Johns Hopkins Employer Health Programs, Inc. for an alternative method of rate determination, pursuant to COMAR The System and JHHC request approval from the HSCRC to participate in a global rate arrangement for Executive Health Services with Under Armor, Inc. for a period of one year beginning February 1, II. OVERVIEW OF APPLICATION The contract will be held and administered by Johns Hopkins HealthCare, LLC ("JHHC"), which is a subsidiary of the System. JHHC will manage all financial transactions related to the global price contract including payments to the System hospitals and bear all risk relating to regulated services associated with the contract. III. FEE DEVELOPMENT The hospital portion of the global rates was developed by calculating mean historical charges for patients receiving the procedures for which global rates are to be paid. The remainder of the global rate is comprised of physician service costs. IV. IDENTIFICATION ANDASSESSMENT OF RISK The Hospitals will submit bills to JHHC for all contracted and covered services. JHHC is responsible for billing the payer, collecting payments, disbursing payments to the Hospitals at their full HSCRC approved rates, and reimbursing the physicians. The System contends that the arrangement among JHHC, the Hospitals, and the physicians holds the Hospitals harmless from any shortfalls in payment from the global price contract. JHHC maintains it has been active in
22 similar types of fixed fee contracts for several years, and that JHHC is adequately capitalized to bear risk of potential losses. V. STAFF EVALUATION After reviewing the Hospital experience data, staff believes that the Hospitals can achieve a favorable experience under this arrangement. VI. STAFF RECOMMENDATION The staff recommends that the Commission approve the Hospitals' application for an alternative method of rate determination for Executive Health Services for a one year period commencing February 1, The Hospitals will need to file a renewal application for review to be considered for continued participation. Consistent with its policy paper regarding applications for alternative methods of rate determination, the staff recommends that this approval be contingent upon the execution of the standard Memorandum of Understanding ("MOU") with the Hospitals for the approved contract. This document would formalize the understanding between the Commission and the Hospitals, and would include provisions for such things as payments of HSCRC-approved rates, treatment of losses that may be attributed to the contract, quarterly and annual reporting, confidentiality of data submitted, penalties for noncompliance, project termination and/or alteration, on-going monitoring, and other issues specific to the proposed contract. The MOU will also stipulate that operating losses under the contract cannot be used to justify future requests for rate increases.
23 Recommendations for Updating the Quality-Based Reimbursement Program for Rate Years 2017 (Final), 2018 (Draft), and 2019 (Draft) December 14, 2016 Health Services Cost Review Commission 4160 Patterson Avenue Baltimore, Maryland (410) FAX: (410) This document contains the staff recommendations for updating the Quality-Based Reimbursement (QBR) Program for RY 2017 for consideration at the December 14, 2016 Commission meeting. This document also contains the draft staff recommendations for updating the QBR Program for RYs 2018 and Please submit comments on the draft recommendations to the Commission by Tuesday, January 3, 2017 via hard copy mail or to
24 Table of Contents List of Abbreviations... 2 Introduction... 3 Background... 3 Federal VBP Program... 3 Maryland s Current QBR Program (RY 2018 Performance Period)... 4 Assessment... 5 Performance Results on QBR and VBP Measures with Most Recent Data Available... 5 Safety Measures... 7 Experience of Care Measures... 7 Mortality Measures... 8 Additional Measure Results... 9 QBR RY 2017 Final Scores and Reward and Penalty Preset Scale... 9 QBR RY 2019 Payment Adjustment Scaling QBR RY 2018 Payment Adjustment Scaling Options Recommendations Final Recommendations for RY Draft Recommendations for RY Draft Recommendations for RY Appendix I. CMS FFY 2018 VBP Measures and Performance Periods Appendix II. HSCRC QBR Program Details: Domain Weights, Revenue at Risk, Points Calculation, Measurement Timeline and Exemption from CMS VBP Program Appendix III. RY 2017 QBR Performance Scores Appendix IV. QBR Measures Performance Trends Appendix V. Modeling of QBR Scaling Options Appendix VI. Comment Letters
25 LIST OF ABBREVIATIONS ACA CDC CY CAUTI CLABSI CMS DRG ED FY FFY HAI Affordable Care Act Centers for Disease Control & Prevention Calendar year Catheter-associated urinary tract infection Central line-associated blood stream infections Centers for Medicare & Medicaid Services Diagnosis-related group Emergency department Fiscal year Federal fiscal year Healthcare Associated Infections HCAHPS Hospital Consumer Assessment of Healthcare Providers and Systems HSCRC MRSA NHSN PQI QBR RY SIR SSI Health Services Cost Review Commission Methicillin-resistant staphylococcus aureus National Health Safety Network Prevention quality indicators Quality-Based Reimbursement Maryland HSCRC Rate Year Standardized infection ratio Surgical site infection THA/TKA Total hip and knee arthroplasty VBP Value-Based Purchasing 2
26 INTRODUCTION The Maryland Health Services Cost Review Commission s (HSCRC s or Commission s) quality-based measurement and payment initiatives are important policy tools for providing strong incentives for hospitals to improve their quality performance over time. These initiatives hold amounts of hospital revenue at risk directly related to specified performance benchmarks. Maryland s Quality-Based Reimbursement (QBR) program, in place since July 2009, employs measures that are similar to those in the federal Medicare Value-Based Purchasing (VBP) program, in place since October Because of its long-standing Medicare waiver for its allpayer hospital rate-setting system and the implementation of the QBR program, the Centers for Medicare & Medicaid Services (CMS) has given Maryland various special considerations, including exemption from the federal Medicare VBP program. Similar to the VBP program, the QBR program currently measures performance in clinical care, patient safety, and experience of care domains. Despite higher weighting of financial incentives on the experience of care domain (50%) which employs the national Hospital Consumer Assessment of Healthcare Providers and Systems (HCAHPS) survey instrument, Maryland has continued to perform below the national average over the last several years with little or no improvement, including for the Rate Year (RY) 2017 completed performance year. The patient safety domain was weighted second highest, and scores on average for this domain were next lowest. The purpose of this report is to make draft recommendations for the QBR program for fiscal year (FY) The report also recommends updates to the approach for scaling rewards and penalties retrospectively for RY 2017 and 2018 in order to assign rewards and penalties consistent with hospital performance levels based on data now finalized for RY BACKGROUND Federal VBP Program The Affordable Care Act (ACA) established the hospital VBP program, 1 which requires CMS to reward hospitals with incentive payments for the quality of care provided to Medicare beneficiaries. The program assesses hospital performance on a set of measures in clinical care, experience of care, safety, and efficiency (i.e., Medicare spending per beneficiary) domains. The incentive payments are funded by reducing the base operating diagnosis-related group (DRG) amounts that determine the Medicare payment for each hospital inpatient discharge. 2 The ACA 1 For more information on the VBP program, see Assessment-Instruments/hospital-value-based-purchasing/index.html?redirect=/Hospital-Value-Based-Purchasing/ 2 42 USC 1395ww(o)(7). 3
27 set the reduction at 1 percent in federal fiscal year (FFY) 2013 and required that it increase incrementally to 2 percent by FFY CMS will calculate FFY 2018 hospital final scores based on measures in the four equally weighted domains (Appendix I). Although not final, CMS has proposed no changes to the domain weights for the FFY 2019 program from those used for FFY Maryland s Current QBR Program (RY 2018 Performance Period) For the RY 2018 performance period, Maryland s QBR program like the federal VBP program, assesses hospital performance on similar (or the same where feasible) measures, and holds 2% of hospital revenue at risk based on performance. (See Appendix II for more detail, including the timeline for base and performance years impacting RYs ). For RY 2018, the QBR domains are weighted differently than those of the VBP program as illustrated in Figure 1 below. Main changes for this performance year are that the three-item Care Transition Measure (CTM-3) 4 dimension was added to the HCAHPS survey, and the PC01- Early Elective Delivery measure was added to the Safety domain. The QBR program does not include an efficiency domain within the QBR program; however, Maryland has implemented an efficiency measure in relation to global budgets based on potentially avoidable utilization as measured by the Agency for Healthcare Research and Quality Prevention Quality Indicators (PQI) and readmissions. HSCRC staff will continue to work with key stakeholders to complete development of an efficiency measure that incorporates population-based cost outcomes. Figure 1. RY 2018 Measures and Domain Weights for CMS VBP 5 and Maryland QBR Programs Maryland QBR Domains and Measures CMS VBP Domain Weights and Measure Differences Clinical Care 15% (1 measure: all cause inpatient mortality) 25% (3 measures: condition-specific mortality) Experience of Care 6 50% (9 measures: HCAHPS 8 dimensions + CTM 3 dimension) 25% Same 3 42 USC 1395ww(o)(7)(C). 4 The Care-Transitions Measure is a composite of three questions related to patients and caregivers understanding of necessary follow-up care post-discharge, detailed in questions of the HCAHPS survey. For specifics on the measure, including question language, please see: 5 Details of CMS VBP measures may be found at: Patient-Assessment-Instruments/HospitalQualityInits/Measure-Methodology.html 6 For the FFY 2018 VBP program, CMS changed the name of this domain from Patient experience of care to Patient and Caregiver-Centered Experience of Care/Care Coordination, and for the 2019 VBP program, CMS changed the name to Patient and Community Engagement. For purposes of this report, this domain will be referred to as experience of care across the program years. 4
28 Maryland QBR Domains and Measures CMS VBP Domain Weights and Measure Differences Safety 35% (8 measures: CDC NHSN, all-payer PSI 90, PC01) 25% PSI 90 Medicare only; others same Efficiency N/A 25% (Medicare spending per beneficiary measure) ASSESSMENT This section summarizes Maryland hospital performance including scores for RY 2017 (completed), and the most updated performance data on a select subset of measures currently in use for the RY 2018 QBR or VBP program. Performance Results on QBR and VBP Measures with Most Recent Data Available For a subset of the measures across the domains used for the RY 2018 QBR and/or VBP programs based on the most current data available from CMS, Figure 2 below provides Maryland s performance levels (Most Recent Rate), the change from the previous 12-month period (Improvement from Previous Year), and the difference between the most recent national VBP program performance and the most recent Maryland rates (Difference from National Rates). The colors of the cells illustrate comparisons to national or previous year s rates (see color key). Figure 2 is designed to provide a concise snapshot on performance, but detailed data for this Figure and additional comparison calculations are available in the series of tables found in Appendix III. Additional highlights regarding Maryland s performance on the measures by domain are provided in the text just following Figure 2. 5
29 Figure 2. Selected QBR/VBP Measures: Maryland Current Rates, Improvement from Previous Year, and Change in Difference from National Performance Worse than the National Rate Worse than MD Previous Year MD-National gap worse than previous yr. gap Color Codes Better than the Improved from MD MD National gap better National Rate Previous Year than Previous year gap At National Average No Change No Change Not Available Domain (RY 2018) Measure Improvement From Difference from Most Recent Rate Previous Year National Rate Experience of Care Domain (HCAHPS Percent top box or most positive response reported) Responsiveness 59% -1% -9% Overall Rating 65% 0% -7% Clean/Quiet 62% 0% -7% Explained Medications 60% 0% -5% Nurse Communication 76% 0% -4% Pain Management 68% 1% -3% Doctor Communication 79% 1% -3% Discharge Info 86% 0% -1% Three-Part Care Transitions Measure 48% 0% -4% Clinical Care- Outcome Domain (Mortality Risk Adjusted Rates) 30-day AMI 14.06% -0.44% -0.14% 30-day Heart Failure 10.86% -0.04% -0.74% 30-day Pneumonia 10.64% -0.21% -0.86% Safety Domain PC-01 Early Elective Delivery (% Deliveries) 5% 2% 2% NHSN SIR: Standardized Infection Ratios CLABSI % -0.50% CAUTI % -0.14% SSI Colon % 0.19% SSI - Abdominal Hysterectomy % -0.08% MRSA % 0.20% C.diff % 0.15% Measurement time periods for HCAHPS and Safety measures: Q to Q and Q to Q (most recent rate); for 30-day mortality Q to Q and Q to Q (most recent rate). For measures reported as a percentage, the improvement and National gap are reported as percentage points; for SIRs, the improvement and National gap are reported are percent differences. 6
30 Safety Measures For the early elective induction or Cesarean section delivery measure (PC-01), staff notes that Maryland performed better than the nation in the earlier time period but worse with a sharp increase in the later period. By contrast, the nation improved from the earlier to the latter period. For Centers for Disease Control National Health Safety Network (CDC NHSN) Standardized Infection Ratio (SIR) measures compared to a national reference period ( ) where the SIR was established at the value of 1 (See Appendix III, Table 4 for detailed data), Maryland statewide performance appears better on average than the national average for some of the measures and worse for others in both the earlier and later time periods. Staff was unable to compare changes in the national rate from a previous time period (indicated in Figure 2 above as grey not available ). Experience of Care Measures As noted previously, the experience of care domain is weighted most heavily in the Maryland QBR Program (45 percent in RY2017 and 50 percent in RY 2018). Staff compared the most recently available two years of data for experience of care with that of the nation (Figure 2; see Appendix III, Table 1 for detailed data) and notes that compared to the nation, Maryland s most recent rates are worse for all nine of the experience of care HCAHPS dimensions (indicated in Figure 2 as all red). Maryland s performance has not changed significantly overall, and the nation has had modest improvement year over year from 2012 to In their letters exempting Maryland from the VBP program in 2015 and 2016 (see Appendix II), CMS also notes Maryland s ongoing significant lag behind national medium performance levels and has been strongly in favor of increasing weight for this domain in the QBR program. Additional analysis of experience of care scores (an aggregate of eight dimensions available since 2012) comparing Maryland to the nation shows that, as illustrated in Figure 3 below, Maryland s performance declined in 2013 and improved in 2014 to 2012 levels. Given that 2013 was the base period for RY 2017, some of the improvement seen in the RY 2017 QBR scores is due to declines in performance in the base year. Staff notes that, consistent with the VBP program determination in the FY 2017 Outpatient Prospective Payment System (PPS) Final Rule, 7 the pain management question will be prospectively removed from the QBR program for RY FY 2017 OPPS Final Rule found at: Payment/HospitalOutpatientPPS/Hospital-Outpatient-Regulations-and-Notices-Items/CMS-1656-P.html, last accessed December 1,
31 Figure 3. Maryland vs. National Experience of care Aggregate Scores over Time Maryland Nation Clinical Care Mortality Measures Calendar Year On the three CMS condition-specific mortality measures used in the VBP program 30 day heart attack (AMI), heart failure (CHF), and pneumonia Maryland performs better than the nation with the gap narrowing over time (Figure 2 above; See Appendix III, Table 2 for detailed data). For the Maryland inpatient, all-payer, all-cause mortality measure used for the QBR program, Maryland s mortality rate declined from 2.87 percent to 2.15 percent between RY 2014 and calendar year (CY) 2015 (see Appendix III, Table 3). Staff analyzed the trend in mortality rates and concluded that the palliative care exclusion has contributed to the decline in the all-payer, all-cause mortality rates. As illustrated in Figure 4 below, the percentage of deaths with palliative codes increased from percent to percent over the last two years. To prevent further impact of changes in palliative care trends on mortality measurement, the palliative care case exclusion will be eliminated for RY 2019, and these cases will now be included in calculating benchmarks, thresholds, and risk-adjusted hospital mortality rates. Figure 4. Maryland Statewide Hospital Total and Palliative Care Cases, CY Total Discharges Discharges w/ Palliative Care (PC) Diagnosis (Dx) Total Deaths Total Deaths w/ PC Dx % of Total Discharges w/pc Dx % of Deaths w/pc Dx % Live Discharges w/pc Dx ,849 14,038 13,105 5, % 42.92% 1.29% ,139 17,464 12,670 6, % 53.69% 1.69% ,202 19,447 12,114 7, % 61.09% 1.97% 8
32 Additional Measure Results For the newly published Total Hip and Knee Arthroplasty THA/TKA complication measure, performance results were only available for the latter time period. Hospital Compare 8 reports that all Maryland hospitals perform as expected on this measure (with the exception of one hospital that is better and one that is worse than expected) compared with the nation; staff supports adopting the measure for the RY 2019 QBR program, consistent with the national VBP program. As part of the strategic plan to expand the performance measures, staff started to examine other measures available in public reporting. Staff notes that Maryland performs poorly on the ED wait time measures compared to the nation. In addition, Maryland and national performance is declining over time. Therefore, staff strongly advocates active monitoring of the ED wait times measures with consideration as to the feasibility of adding these measures to the QBR program in future years (See Appendix III, Table 5). QBR RY 2017 Final Scores and Reward and Penalty Preset Scale Similar to other quality-based programs, the Commission voted to modify fundamentally the QBR program methodology for calculating rewards and penalties for RY 2017, such that the level of rewards or penalties is determined based on performance points achieved relative to a preset scale, rather than a relative ranking and scaling of the hospitals determined after the performance period. This transition coincided with major changes in the measures used for the QBR program, which entailed removing the process measures (which had higher scores), increasing the weight of experience of care (which had lower scores), and tying the benchmarks to the national distribution. At the time, staff did not have sufficient data to model the implications of these changes on the performance points thoroughly and, therefore, set the payment adjustment scale based on the base year attainment-only performance results relying on input from the Performance Measurement Workgroup. Hospital pay-for-performance programs implemented nationally and in Maryland generally score hospitals on both attainment (level of rates compared to benchmarks) and on improvement (rate of change from the baseline). Hospitals may earn two scores on the measure specified within each domain one for attainment (0-10) and one for improvement (0-9). The final score awarded to a hospital for each measure is the higher of these two scores. For experience of care measures, there are also consistency points. All measure scores, with exception of the HSCRC-derived measures using Maryland all-payer case mix data (e.g., PSI 90, all-cause inpatient mortality), include assignment of points between 0 and 10 based on the national average rate for 0 points and the top 25 percent national performance for 10 points. Details regarding the scoring calculations are found in Appendix II. 8 See for more information. 9
33 Figure 5 below provides descriptive statistics on the final statewide total QBR scores and scores by each domain for RY These aggregate level domain scores reflects the proportion of total available points received by the hospital. A 0 score represents none of the measures in that domain were better than the national average or did not improve. A score of 1 represents all measures are at or better than the top 25 percent performance. Experience of care is the most heavily weighted domain, and Maryland scores are lowest for this domain, with an average score of 0.24 and maximum score of The domain with the next lowest distribution of scores is safety, with an average score of 0.40; this domain is also weighted second highest in calculating hospitals total QBR scores. Appendix IV presents RY 2017 final QBR score results by hospital and domain. Figure 5. RY 2017 Final QBR Scores Distribution Overall and by Domain Domains Experience of Care Clinical Care- (Process Sub-domain retired after RY 2017) Clinical Care- (Outcome Subdomain) Measure Description HCAHPS AMI 7a-Fibrinolytic Therapy IMM 2- Influenza Immunization Inpatient All DRG Mortality Safety CDC NHSN Infection (3 measures), PSI 90 Total QBR Score RY 2017 Weights 45% 5% 15% 35% 100% Minimum Score th percentile Median Average th Percentile Maximum Score Coefficient of Variation 46% 59% 48% 54% 30% While the figure 5 provides information for the FY 2017 Final QBR scores, Figure 6 below shows the difference between the base period attainment-only scores for RYs 2016 and 2017 versus the final scores for each period, illustrating a significant increase in the final scores when improvement is taken into account. Absent data, staff was unable to model the final scale for RY 2017 and agreed to set the points for the attainment-only scale given the major changes in the program described above. 10
34 Figure 6. QBR RY Attainment-Only and Final Scores (Reflecting the better of Attainment or Improvement) Staff calculated hospital RY 2017 QBR scores and analyzed the scores relative to the QBR preset scale determined last year and notes that almost all hospitals receive a reward for RY 2017 despite relatively poor performance (Appendix V). With the recommendation to make retrospective adjustments to the readmission policy, staff had noted the issue with the QBR scaling at the June 2016 Commission meeting and has been working since then to understand the implications. Expecting changes to the results, July RY 2017 rate orders and global budgets were sent without QBR program adjustments. Based on the analysis comparing attainment and improvement points, staff asserts that the RY 2017 preset scale was too low, because it was developed using base period data to calculate attainment-only scores and, again, did not account for improvement trends. The intention to use a preset scale was to improve predictability of the payment adjustments, not to lower the scale as Maryland has been progressively raising the bar for performance. Staff is proposing the following for RY 2017 scaling adjustment to correct the issue of the current preset scale being too low: Revise preset scale to use final RY 2017 QBR scores. This would result in a relative ranking within the State that penalizes hospitals with QBR scores below the statewide average and reward hospitals with scores above the statewide average (i.e., RY 2017 State average score is 0.37). Staff has provided modeling of the RY 2017 scores using the final scores for FY 2017 in Appendix V. HSCRC has received input from stakeholders regarding the draft recommendation updating the QBR program presented in the October Commission meeting. As mentioned earlier, HSCRC has also received VBP exemption approval letters from CMS directly addressing the experience of care domain performance lag in Maryland (Appendix II). Highlights of the issues raised 11
35 during the meeting and in the letters submitted to the Commission by CMS, the Maryland Hospital Association (MHA) and Consumer Health First (CHF), along with staff responses, is provided below, and the MHA and CHF comment letters are provided in Appendix VI. Consistency with the CMS VBP approval letters (CMS)- Staff asserts that Maryland has committed to adjusting incentives to support improvement in experience of care as part of the conditions for seeking the Maryland exemptions from year to year from the VBP program. In their responses, CMS has voiced strong support for increasing the weight of the experience of care domain to improve Maryland s poor performance. Staff asserts that using a scale that rewards poor performance is not consistent with Maryland s commitments to, and recommendations from, CMS. Need for predictability (MHA, hospital stakeholders)- Staff supports the principle of predictability and asserts this must be balanced with the principle of fairness. Staff, for example, made retrospective changes to the Readmission policy in June 2016 to reduce penalties for hospitals with low readmission rates and low improvement. Staff also voiced the concern regarding the low bar for the QBR program scaling in the same June 2016 meeting. Approach must maintain trust between stakeholders and Commission (MHA, hospitals, CHF)- Staff asserts that justified corrections, just as they have been made historically, will continue to strengthen trust, and providing rewards not aligned with performance has potential to erode public trust. QBR must support patient-centered care and the goals emphasized by the All-Payer Model (CMS, CHF)- Staff is in strong agreement that improved performance on experience of care is of high importance and priority as part of Maryland s patient centered care model as it strives to achieve better care, better outcomes, and lower costs. No error in policy was made in determining RY 2017 scaling approach (MHA, hospitals)- The distribution of the scores used to set the payment scale (Figure 6 above) using base year attainment only scores was done with the assumptions that changes in the measures and benchmarks would precipitate lower scores for RY Preliminary performance score calculations in May 2016 showed a $30M net positive impact despite low performance scores. Staff again believes there was an error and supports a technical correction to the point intervals used for scaling. Burdensome to make mid-year GBR adjustment (MHA, hospitals)- Although not preferable, if the retroactive scaling adjustment is approved for RY 2017, MHA will support it without a retroactive budget change in the current fiscal year. Staff proposes to limit negative revenue adjustments during the current RY with partial penalties up to the amount indicated in the preset scale in the January RY 2017 rate adjustments, and the remaining penalties July RY 2018 rate adjustment. Staff supports hospitals receiving their full rewards under the revised scaling for RY 2017 in the January rate update. Figure 7 below shows the partial rate adjustment implementation scenarios 12
36 Figure 7. Examples of Implementation of Revenue Adjustments for RY2017 Revised Original Preset January July Revenue Scale Adjustment Adjustment Adjustment Hospital A -100, , ,000-20,000 Hospital B 10,000-30, ,000 Hospital C 100,000 60,000 60,000 0 QBR RY 2019 Payment Adjustment Scaling In order to finalize the recommendation for RY 2019, staff is continuing to vet with stakeholders a scaling approach that would move away from a relative ranking based on final scores, to one that uses a national scale to assess Maryland hospital performance. As the benchmarks and thresholds are determined by national rates, moving to a national scale in the payment adjustments will align the financial results with quality performance. Specifically, the staff is proposing the following for the RY 2019 scaling adjustment: Use a national scale that ranges from 0 to 1 and establish reward/penalty cutoffs such that a hospital scoring greater than 0.50 is rewarded. With the exception of the HSCRCderived measures using Maryland all-payer case mix data (e.g., PSI 90, all-cause inpatient mortality), the thresholds and benchmarks for the scoring methodology are based on the national average (threshold) and the top performance (benchmark) values. A score of 0 means all measures are below the national average or not improved, while a score of 1 would mean all measures are at or better than top 25 percent best performing rates. Although hospital scores reflect performance relative to the national thresholds and benchmarks, the use of a statewide distribution to set the scale to allocate financial adjustments creates a disconnect between Maryland s performance and the national trends. Adjusting the scale to reflect a national distribution will ensure that QBR revenue adjustments are also linked with Maryland hospital performance relative to the nation. As Maryland raises the bar for obtaining rewards with this approach, the potential rewards should be commensurate and should be increased from 1 percent to 2 percent. The benefits of using a national scale are that it can be set prospectively, and hospitals are not relatively ranked after the performance period. Most importantly, the use of a national scale ensures that hospitals that perform better than the national average will be rewarded, and hospitals that are worse than the national average will be penalized. QBR RY 2018 Payment Adjustment Scaling Options For RY 2018, a retrospective change is also needed to the preset payment scale as the payment scale was set with the same points last year given a lack of timely data. Staff is recommending using the same approach proposed for RY 2017, where final scores will be used to create a scale that penalizes those hospitals with below average performance. However, staff will continue to vet with stakeholders whether it is preferable instead to make the shift to a national scale for RY 2018 (i.e., the proposed RY 2019 scaling). Furthermore, for RY 2018 (and beyond) staff needs 13
37 to finalize timing of the revenue adjustments given the delay in the RY 2017 adjustments. Staff is vetting implementing the full adjustment for QBR routinely in January or delaying until July (i.e., the subsequent rate year), lengthening the time interval between the performance period and the payment adjustment impact by 6 months to one year. RECOMMENDATIONS Staff notes the State s improvement trends in the Maryland inpatient, all-cause, all-payer mortality rate used for the QBR program as well as the CMS condition-specific mortality measures used for the VBP program but cautions these observations should be tempered with the knowledge that the previous palliative care exemption will not be applied going forward. Staff also recognizes the gap that remains between Maryland and national performance on the experience of care measures in particular, the domain that constitutes 45 percent for RY 2017 and 50 percent for RY 2018 of the hospitals QBR total scores. In this section of the report, staff presents final recommendations for changes to the QBR program for RY 2017 and draft recommendations for RYs 2018 and Final Recommendations for RY 2017 Based on the analysis and observations presented above, staff recommends the following retrospective adjustments to the RY 2017 QBR program: Adjust retrospectively the RY 2017 QBR preset scale for determining rewards and penalties such that the scale accounts for both attainment and improvement trends. Use a relative scale to linearly distribute rewards and penalties based on the final QBR scores, without revenue neutrality adjustment. Adjust rates in the updated rate orders to reflect the proposed updated QBR scaling approach. Limit negative revenue adjustments during the current RY by partially implementing penalties (up to the amount indicated in preset scale) in the January RY 2017 rate adjustments, and implementing the remaining penalties in the July RY 2018 rate adjustments. Draft Recommendations for RY 2018 Staff recommends that the following be considered for RY 2018: Calculate the scaling points based on RY 2018 performance periods and provide rewards to hospitals that are above the average score in accordance with the above RY 2017 scaling recommendation, with a maximum penalty of 2 percent and maximum reward of 1 percent of inpatient revenue distributed linearly in proportion to calculated scores. Draft Recommendations for RY 2019 Staff recommends that the following be considered for RY 2019: 14
38 Move to a national distribution and determine the score at which rewards should start and the amount of maximum/minimum penalties to be applied. (HSCRC staff modeled a national scale from with a reward/penalty threshold of 0.40 based on the Maryland Hospital Association s distributional analysis of national scores). Increase the maximum reward to 2 percent as the achieving rewards will be based on national distribution. 15

39 APPENDIX I. CMS FFY 2018 VBP MEASURES AND PERFORMANCE PERIODS 16
40 APPENDIX II. HSCRC QBR PROGRAM DETAILS: DOMAIN WEIGHTS, REVENUE AT RISK, POINTS CALCULATION, MEASUREMENT TIMELINE AND EXEMPTION FROM CMS VBP PROGRAM Domain Weights and Revenue at Risk As illustrated in the body of the report, for the RY 2018 QBR program, the HSCRC will weight the clinical care domain at 15 percent of the final score, the safety domain at 35 percent, and the experience of care domain at 50 percent. The HSCRC sets aside a percentage of hospital inpatient revenue to be held at risk based on each hospital s QBR program performance. Hospital performance scores are translated into rewards and penalties in a process that is referred to as scaling. 9 Rewards (referred to as positive scaled amounts) or penalties (referred to as negative scaled amounts) are then applied to each hospital s update factor for the rate year. The rewards or penalties are applied on a one-time basis and are not considered permanent revenue. The Commission previously approved scaling a maximum reward of one percent and a penalty of two percent of total approved base inpatient revenue across all hospitals for RY HSCRC staff has worked with stakeholders over the last several years to align the QBR measures, thresholds, benchmark values, time lag periods, and amount of revenue at risk with those used by the CMS VBP program where feasible, 10 allowing the HSCRC to use data submitted directly to CMS. As alluded to in the body of the report, Maryland implemented efficiency measure in relation to global budgets based on potentially avoidable utilization outside of QBR program. The HSCRC does apply a potentially avoidable utilization savings adjustment to hospital rates based on costs related to potentially avoidable admissions, as measured by the Agency for Healthcare Research and Quality Prevention Quality Indicators (PQIs) and avoidable readmissions. HSCRC staff will continue to work with key stakeholders to complete development of an efficiency measure that incorporates population-based cost outcomes. QBR Score Calculation Attainment Points: During the performance period, attainment points are awarded by comparing an individual hospital s rates with the threshold, which is the median, or 50 th percentile of all hospitals performance during the baseline period, and the benchmark, which is the mean of the top decile, or approximately the 95 th percentile during the baseline period. With the exception of the mortality and AHRQ PSI 90 measure applied to all payers, the benchmarks and thresholds are the same as those used by CMS for the VBP program measures. For each measure, a hospital 9 Scaling refers to the differential allocation of a pre-determined portion of base-regulated hospital inpatient revenue based on assessment of the quality of hospital performance. 10 HSCRC has used data for some of the QBR measures (e.g., CMS core measures, CDC NHSN CLABSI, CAUTI) submitted to the Maryland Health Care Commission (MHCC) and applied state-based benchmarks and thresholds for these measures to calculate hospitals QBR scores up to the period used for RY
41 that has a rate at or above benchmark receives 10 attainment points. A hospital that has a rate below the attainment threshold receives 0 attainment points. A hospital that has a rate at or above the attainment threshold and below the benchmark receives 1-9 attainment points Improvement Points: The improvement points are awarded by comparing a hospital s rates during the performance period to the hospital s rates from the baseline period. A hospital that has a rate at or above benchmark receives 9 improvement points. A hospital that has a rate at or below baseline period rate receives 0 improvement points. A hospital that has a rate between the baseline period rate and the benchmark receives 0-9 improvement points Consistency Points: The consistency points relate only to the experience of care domain. The purpose of these points is to reward hospitals that have scores above the national 50 th percentile in all of the eight HCAHPS dimensions. If they do, they receive the full 20 points. If they do not, the dimension for which the hospital received the lowest score is compared to the range between the national 0 percentile (floor) and the 50 th percentile (threshold) and is awarded points proportionately. Domain Scores: Composite scores are then calculated for each domain by adding up all of the measure scores in a given domain divided by the total possible points x 100. The better of attainment and improvement for experience of care scores is also added together to arrive at the experience of care base points. Base points and the consistency score are added together to determine the experience of care domain score. Total Performance Score: The total Performance Score is computed by multiplying the domain scores by their specified weights, then adding those totals and dividing them by the highest total possible score. The Total Performance Score is then translated into a reward/ penalty that is applied to hospital revenue. 18

42 QBR Base and Performance Periods Impacting RYs
43 Maryland VBP Exemption Under Maryland s previous Medicare waiver, VBP exemptions were requested and granted for FYs 2013 through The CMS FY 2015 Inpatient Prospective Payment rule stated that, although exemption from the hospital VBP program no longer applies, Maryland hospitals will not be participating in the VBP program because 1886(o) of the ACA 11 and its implementing regulations are waived under Maryland s New All-Payer Model, subject to the terms of the Model agreement as excerpted below: 4. Medicare Payment Waivers. Under the Model, CMS will waive the requirements of the following provisions of the Act as applied solely to Regulated Maryland Hospitals: e. Medicare Hospital Value Based Purchasing. Section 1886(o) of the Act, and implementing regulations at 42 CFR , only insofar as the State submits an annual report to the Secretary that provides satisfactory evidence that a similar program in the State for Regulated Maryland Hospitals achieves or surpasses the measured results in terms of patient health outcomes and cost savings established under 1886(o) of the Act. Under the New All-Payer Model, HSCRC staff submitted exemption requests for FYs 2016 and 2017 and received approvals from CMS on August 27, 2015, and April 22, 2016, included below. 11 Codified at 42 USC 1395ww(o). 20
44 21
45 22
46 23
47 24
48 APPENDIX III. RY 2017 QBR PERFORMANCE SCORES Measure Maryland (Q413- Q314) National (Q413- Q314) Table 1. HCAHPS Analysis Percent difference MD-US Maryland (Q414- Q315) Change from Base National (Q414- Q315) Change from Base Percent difference MD-US Responsiveness Overall Rating Clean/Quiet Explained Medications Nurse Communication Pain Management Doctor Communication Discharge Info Item Aggregate TOTAL Three-Part Care Transitions Measure Table 2. CMS Condition-Specific Mortality Measures Maryland National Percent Maryland Change National Change Percent Mortality (Q310- (Q310- difference (Q311- from (Q311- from difference Measures Q213) Q213) MD-US Q214) Base Q214) Base MD-US 30-day AMI 14.50% 14.90% -0.40% 14.06% -0.44% 14.20% -0.70% -0.14% 30-day Heart Failure 10.90% 11.90% -1.00% 10.86% -0.04% 11.60% -0.30% -0.74% 30-day Pneumonia 10.85% 11.90% -1.05% 10.64% -0.21% 11.50% -0.40% -0.86% Table 3. Maryland All-Payer Inpatient Mortality Measure Mortality Measures Maryland RY2014 Maryland CY2015 Change from Base 25
49 Safety Measures Maryland (Q413- Q314) MD Mortality Measure 2.87% 2.15% -0.72% Table 4. Safety Measures National (Q413- Q314) Percent difference MD-US Maryland (Q414- Q315) Change from Base National (Q414- Q315) Change from Base Percent difference MD-US Change from Base Period CLABSI % 0.5 NOTE: 1 NOTE: % Change Change CAUTI % from base 1 from base % SSI - Colon % is not 1 is not 18.50% 0.13 calculated calculated SSI - because because Abdominal % MD SIR is 1 MD SIR is -8.40% Hysterectomy in in MRSA % 1.2 relation 1 relation 20.00% C.diff % to national 1 to national 14.70% SIR of 1 SIR of 1 PC-01 Elective Delivery Other Measures - Monitoring Status IMM-2 Influenza Immunization ED1b - Arrive to admit ED2b - Admit decision to admit OP20 - Door to diagnostic eval Maryland (Q413- Q314) National (Q413- Q314) Table 5. Measures for Monitoring Percent difference MD-US Maryland (Q414- Q315) Change from Base National (Q414- Q315) Change from Base Percent difference MD-US % % % % % % % % 26
50 APPENDIX IV. QBR MEASURES PERFORMANCE TRENDS Hospital ID Hospital Name HCAHPS Score QBR Performance Scores Clinical/ Process Score Clinical/ Mortality Score Safety Score QBR Score MERITUS UNIVERSITY OF MARYLAND PRINCE GEORGE HOLY CROSS FREDERICK MEMORIAL HARFORD MERCY JOHNS HOPKINS DORCHESTER ST. AGNES SINAI BON SECOURS FRANKLIN SQUARE WASHINGTON ADVENTIST GARRETT COUNTY MONTGOMERY GENERAL PENINSULA REGIONAL SUBURBAN ANNE ARUNDEL UNION MEMORIAL WESTERN MARYLAND ST. MARY HOPKINS BAYVIEW MED CTR CHESTERTOWN UNION OF CECIL COUNT CARROLL COUNTY HARBOR CHARLES REGIONAL EASTON UMMC MIDTOWN CALVERT NORTHWEST BWMC G.B.M.C HOWARD COUNTY UPPER CHESAPEAKE DOCTORS COMMUNITY LAUREL REGIONAL GOOD SAMARITAN SHADY GROVE FT. WASHINGTON ATLANTIC GENERAL SOUTHERN MARYLAND UM ST. JOSEPH
51 APPENDIX V. MODELING OF QBR SCALING OPTIONS 1.RY 2017 Current Scale 2a.Proposed RY 2017 Scale Jan 2017 Rate HOSPITAL NAME RY 16 Permanent Inpatient Revenue RY 2017 QBR FINAL POINTS % Impact $ Impact % Impact $ Impact Order Adjustment effective July 2016 Rate Order FY18 GBR (July 2017) Use Relative Scale or National % Impact $ Impact Bon Secours Hospital $74,789, % -$1,495, % -$1,495,794 -$1,495,794 $0 TBD -1.65% -$1,234, b. January 2017 and July 2017 Implementations 3. RY National Scale (Draft Recommendation for RY 2019) Laurel Regional Hospital $60,431, % -$670, % -$846,035 -$670,785 -$175,250 TBD -1.20% -$725,173 Maryland General Hospital $126,399, % -$846, % -$1,432,526 -$846,875 -$585,650 TBD -1.05% -$1,327,193 Northwest Hospital Center $114,214, % -$502, % -$1,142,144 -$502,543 -$639,600 TBD -0.95% -$1,085,037 Holy Cross Hospital $316,970, % -$1,046, % -$2,958,394 -$1,046,004 -$1,912,391 TBD -0.90% -$2,852,737 Prince Georges Hospital Center $220,306, % -$484, % -$1,909,322 -$484,674 -$1,424,648 TBD -0.85% -$1,872,605 Southern Maryland Hospital Center $156,564, % -$172, % -$1,252,518 -$172,221 -$1,080,297 TBD -0.80% -$1,252,518 Washington Adventist Hospital $155,199, % -$170, % -$1,241,593 -$170,719 -$1,070,874 TBD -0.80% -$1,241,593 Sinai Hospital $415,350, % $747, % -$1,661,403 $0 -$1,661,403 TBD -0.50% -$2,076,754 Memorial Hospital at Easton $101,975, % $183, % -$407,902 $0 -$407,902 TBD -0.50% -$509,878 Anne Arundel Medical Center $291,882, % $525, % -$1,167,531 $0 -$1,167,531 TBD -0.50% -$1,459,413 Franklin Square Hospital Center $274,203, % $493, % -$1,096,812 $0 -$1,096,812 TBD -0.50% -$1,371,015 Union Memorial Hospital $238,195, % $428, % -$952,781 $0 -$952,781 TBD -0.50% -$1,190,977 St. Agnes Hospital $232,266, % $487, % -$774,221 $0 -$774,221 TBD -0.45% -$1,045,198 Baltimore Washington Medical Center $237,934, % $594, % -$634,493 $0 -$634,493 TBD -0.40% -$951,740 Western MD Regional Medical Center $167,618, % $486, % -$335,238 $0 -$335,238 TBD -0.35% -$586,666 Harford Memorial Hospital $45,713, % $146, % -$60,952 $0 -$60,952 TBD -0.30% -$137,142 Doctors Community Hospital $132,614, % $424, % -$176,820 $0 -$176,820 TBD -0.30% -$397,844 Meritus Hospital $190,659, % $686, % -$127,106 $0 -$127,106 TBD -0.25% -$476,649
52 1.RY 2017 Current Scale 2a.Proposed RY 2017 Scale Jan 2017 Rate HOSPITAL NAME RY 16 Permanent Inpatient Revenue RY 2017 QBR FINAL POINTS % Impact $ Impact % Impact $ Impact Order Adjustment effective July 2016 Rate Order FY18 GBR (July 2017) Use Relative Scale or National % Impact $ Impact Johns Hopkins Hospital $1,244,297, % $4,479, % -$829,532 $0 -$829,532 TBD -0.25% -$3,110, b. January 2017 and July 2017 Implementations 3. RY National Scale (Draft Recommendation for RY 2019) Union of Cecil $69,389, % $270, % $0 $0 $0 TBD -0.20% -$138,780 Johns Hopkins Bayview Medical Center $343,229, % $1,475, % $171,615 $171,615 $0 TBD -0.15% -$514,845 Shady Grove Adventist Hospital $220,608, % $948, % $110,304 $110,304 $0 TBD -0.15% -$330,913 Peninsula Regional Medical Center $242,318, % $1,041, % $121,159 $121,159 $0 TBD -0.15% -$363,477 Upper Chesapeake Medical Center $135,939, % $584, % $67,970 $67,970 $0 TBD -0.15% -$203,909 Chester River Hospital Center $21,575, % $92, % $10,788 $10,788 $0 TBD -0.15% -$32,363 University of Maryland Hospital $906,034, % $4,167, % $906,034 $906,034 $0 TBD -0.10% -$906,034 Atlantic General Hospital $37,750, % $173, % $37,750 $37,750 $0 TBD -0.10% -$37,750 Garrett County Memorial Hospital $19,149, % $95, % $28,724 $28,724 $0 TBD -0.05% -$9,575 Fort Washington Medical Center $19,674, % $106, % $39,350 $39,350 $0 TBD 0.00% $0 Mercy Medical Center $214,208, % $1,156, % $428,417 $428,417 $0 TBD 0.00% $0 Civista Medical Center $67,052, % $382, % $167,632 $167,632 $0 TBD 0.05% $33,526 Carroll Hospital Center $136,267, % $831, % $408,802 $408,802 $0 TBD 0.10% $136,267 Calvert Memorial Hospital $62,336, % $380, % $187,008 $187,008 $0 TBD 0.10% $62,336 UM ST. JOSEPH $234,223, % $1,428, % $702,670 $702,670 $0 TBD 0.10% $234,223 Dorchester General Hospital $26,999, % $172, % $94,497 $94,497 $0 TBD 0.15% $40,499 Montgomery General Hospital $75,687, % $514, % $302,751 $302,751 $0 TBD 0.20% $151,375 Harbor Hospital Center $113,244, % $770, % $452,978 $452,978 $0 TBD 0.20% $226,489 Frederick Memorial Hospital $190,413, % $1,351, % $856,862 $856,862 $0 TBD 0.25% $476,034 Suburban Hospital $193,176, % $1,448, % $965,880 $965,880 $0 TBD 0.30% $579,528 Greater Baltimore $207,515, % $1,701, % $1,245,095 $1,245,095 $0 TBD 0.40% $830,063
53 HOSPITAL NAME Medical Center RY 16 Permanent Inpatient Revenue RY 2017 QBR FINAL POINTS 1.RY 2017 Current Scale % Impact $ Impact 2a.Proposed RY 2017 Scale % Impact $ Impact 2b. January 2017 and July 2017 Implementations Jan 2017 Rate Order Adjustment Rate Order effective July FY18 GBR 2016 (July 2017) 3. RY 2018 Use Relative Scale or National 4. National Scale (Draft Recommendation for RY 2019) Good Samaritan Hospital $160,795, % $1,318, % $964,774 $964,774 $0 TBD 0.40% $643,182 Howard County General Hospital $165,683, % $1,656, % $1,656,837 $1,656,837 $0 TBD 0.85% $1,408,312 St. Mary's Hospital % Impact $ Impact $69,169, % $691, % $691,692 $691,692 $0 TBD 1.60% $1,106,708 Statewide Total $8,730,031,841 $27,058,414 -$9,883,530 $5,229,972 -$15,113,502 -$21,514,008 Total Penalties -5,389,617-20,503,119-5,389,617-15,113,502-27,442,552 % Inpatient Revenue -0.06% -0.23% -0.06% -0.17% -0.31% Total Rewards 32,448,031 10,619,589 10,619, ,928,544 % Inpatient Revenue 0.37% 0.12% 0.12% 0.00% 0.07% 30
54 APPENDIX VI. COMMENT LETTERS 31
55 1 November 2016 Nelson J. Sabatini, Chairman Health Services Cost Review Commission 4160 Patterson Avenue Baltimore, MD Dear Chairman Sabatini: I am writing on behalf of the Board and members of Consumer Health First (CHF) to express our strong support for the HSCRC staff recommendation for a retroactive change to the RY 2017 Quality Based Reimbursement program. CHF is a nonprofit organization dedicated to the advancement of health equity through access to high-quality, comprehensive and affordable health care. Since 2013 we have dedicated much of our time and resources to ensuring that the All-Payer Model (APM), in both its design and implementation does indeed put consumers first. To do that we have been pleased to serve on many of the workgroups and the Advisory Council. It was also an honor to serve as Chair of the Consumer Engagement Task Force and we look forward to the implementation of its recommendations going forward. Most immediately, of course, we are pleased that the Standing Advisory Committee is to be formed shortly. For us, one of the most important aspects of the APM, and the new Progression Model, is HSCRC's emphasis on a patientcentered approached focused on addressing the Triple Aim. As you know, one aim is to improve both quality and patient satisfaction. The fact that Maryland is near the bottom of the national rankings on patient experience of care and, rather than improving, actually regressed in this area, is extremely disappointing. Therefore, we believe it would be wholly inappropriate to reward hospitals for their inadequate performance in this area. In this regard, too, we believe it is important that Maryland hospitals be measured against a national and not a state level. That would appear to us to be consistent both with CMS' granting of an exemption from the Value Based Purchasing Program and Marylanders own expectations that the care they receive within our borders is equal to, or better than, that found in other states.
56 I also feel called upon to express my profound disappointment in the reasons put forward by the hospitals for rejection of the staff recommendation. Not one of the speakers expressed a concern for the individuals under their care. In fact, there appeared to be a complete lack of understanding of the implications of the HCAHPS findings on their patients, or a commitment to make improvements going forward. The reality was that those speaking for Maryland's hospitals seemed solely concerned about a negative impact on the morale of their clinicians and other staff. Others clung to some arcane principle that the Commission should continue to do business as always, i.e., reward substandard performance. Both as a consumer advocate and, as a recent consumer of health care at a Maryland hospital, I can say that I was offended by their lack of acknowledgement that these findings signal problems with the health, safety, well-being and satisfaction of hospitalized Marylanders. Therefore, we again want to express our support for the staff QBR proposal. We also wish to offer our assistance and support in identifying additional outcome measures that can serve as effective guideposts to improve the patient experience of care and advance the Triple Aim. We commend the work in this regard being undertaken by the Performance Measures Workgroup. We would also note the recommendation made by Stan Dorn of the Urban Institute at last week's Advisory Council meeting. He stressed the need for greater examination of outcome-based measures related to the Progression Model. That we believe could have positive implications for the QBR measures as well. Lastly we would note that we have specifically proposed to the Maryland Hospital Association that we work with them, and individual hospitals, to analyze current patient surveys and other tools as the basis for making future improvements. For your consideration we would suggest that a greater emphasis on incentives or other efforts to encourage hospitals to "engage" with consumer groups on efforts such as this would be helpful. To date we have seen little interest in this regard and we believe there are very positive outcomes that could be achieved. As always, we look forward to working with the Commission and staff as we continue this exciting, and challenging, endeavor. Sincerely, Leni Preston, President leni@mdchcr.org Cell: cc: Donna Kinzer
, we appreciate the opportunity to comment on the October Draft Recommendation for Updating")
57 December 2, 2016 Dianne Feeney Associate Director, Quality Initiatives Health Services Cost Review Commission 4160 Patterson Avenue Baltimore, Maryland Dear Ms. Feeney: On behalf of the 64 hospital and health system members of the Maryland Hospital Association (MHA), we appreciate the opportunity to comment on the October Draft Recommendation for Updating the Quality Based Reimbursement Program for Rate Year Since the draft recommendations address the payment scale for fiscal years 2017 and 2018, our comments will address the 2017, 2018 and 2019 policies. We appreciate the work that the Health Services Cost Review Commission (HSCRC) staff has put into the development of the new methodology for Quality-Based Reimbursement (QBR) and understand some of the challenges discussed at the October meeting that the commission would like to address. We also appreciate commissioners willingness to listen to the issues raised by hospitals that we believe need to be addressed. In an effort to work together to address multiple views, we offer two possible resolutions for fiscal year 2017 and views on 2018 and 2019 policy. Background The QBR methodology for fiscal year 2017, when set by the commission in 2014, reflected a fundamental change, supported by the hospital field, from the previous way of translating quality scores into payment adjustments. Because the policy was new and the data unavailable at the time, the ultimate outcome of the policy could not be known in advance. In addition, the movement of metrics into and out of the Maryland and national programs creates uncertainty from year to year, as well as difficulty in modeling the outcome. The payment scale was set in a way that took into account performance attainment, but not improvement, as has been done with other HSCRC pay-for-performance policies. While no errors were made in the data or calculations, the ultimate outcome was not anticipated. HSCRC staff analyzed current Maryland statewide performance trends and concluded that 2017 hospital performance does not merit the reward that the previously-set methodology would have yielded. We offer two suggestions to better align QBR policy and methodology with commission expectations moving ahead:
58 Dianne Feeney December 2, 2016 Page 2 1. The QBR payment scale is set in advance so clinicians can understand the goals toward which they are working. However, while HSCRC approves the weights to be applied to each measure and the maximum amount of rewards and penalties, it has not set explicit performance targets and does not approve how hospitals performance will be arrayed within those reward and penalty boundaries. For example, the break point the point chosen within the distribution of Maryland s hospitals that defines where rewards end and penalties begin is a critically important decision and more strongly influences the outcome than does the decision about where the maximum rewards and penalties are set. We suggest that HSCRC expand its discussion and explicit commission approval of additional elements of the QBR policy, to include setting a break point that determines the penalty and reward zones in advance. This should foster a better understanding of the potential range of results and align them with expectations. 2. Of greater importance, as noted at the October commission meeting, is the big picture question: what are we trying to achieve? Performing at the highest levels is desirable, but, as in all incentive-based programs, the objective is to apply an incentive that yields a specific change and result. What are the specific goals for each measure? What level of improvement in each of the metrics do HSCRC and the Centers for Medicare & Medicaid Services (CMS) consider meaningful? What do the evidence and research show about how quickly any particular measure can be improved, about the mix of providers and interventions needed to achieve that change, or about the time needed to achieve the desired change? These questions are critical for commission discussion and consideration, both in setting targets for improvement and in informing the staff s development of current and future goals and methods. We suggest that HSCRC expand its discussion of QBR policy to include these broader questions and discuss performance expectations. Fiscal Year 2017 Recommendation With Maryland on the leading edge of innovation, it is likely that there will be other policies, like the QBR policy, that, while developed in good faith, may yield unintended or unexpected results. Maryland's hospital payment system, like the national Medicare hospital payment system, is a prospective payment system, with policies set in advance to create stability and predictability for hospitals and clinicians. The prospective nature of payment and policymaking is critically important to the system's success. That's why the proposed fiscal year 2017 retroactive policy elicits such a strong response. To be clear, there are circumstances or criteria under which looking back and adjusting policies is appropriate. For example, adjusting backwards for material data errors or for data updates is appropriate. Adjusting backwards pursuant to a corrective action plan to avoid imminent danger of losing the Maryland demonstration may also be appropriate. Adjusting backward to
59 Dianne Feeney December 2, 2016 Page 3 address unintended consequences or gross inequities prior to the start of the fiscal year may be appropriate. Making adjustments to individual hospital global budgets backwards should be a decision left to individual discussions between the HSCRC and a hospital. Changing a policy after the start of a performance period (i.e. after the time period of change to be measured is already over) is undesirable as it allocates rewards and penalties based on performance that has already occurred and cannot be changed, making it difficult to engage clinicians. Changing a payment policy after the start of a fiscal year is inappropriate. This is especially true for policies yielding payment reductions, as it negatively affects hospital budgets that are already approved and set. This type of change runs contrary to the principles of the Maryland system. Some have commented that the HSCRC made a previous retroactive adjustment to the readmissions policy to which hospitals did not object. It is important to clarify that the readmissions policy change was not in violation of these principles the change was discussed before the start of the performance period, and was made before the start of the fiscal year. As a reminder, the QBR policy provides one-time revenue, added one year then fully backed out of hospital revenue at the beginning of the following year before the next year's QBR adjustment is made. Hospitals preferred approach is to make any needed policy changes prospectively. However, in an effort to find a resolution that addresses multiple issues and views, we offer the following: Approve the revised staff-proposed QBR payment scale in fiscal year 2017, even though it is retroactive to the performance period, while otherwise ensuring that hospitals do not experience a retroactive budget change in the current fiscal year. This could be achieved through additional revenue made available to hospitals in fiscal year 2017 in a substantially similar amount and distribution. While not preferred, this also could be achieved by leaving current funds (+ $27 million) in fiscal year 2017 and recouping all of the proposed reductions (- $37 million) at the beginning of fiscal year Fiscal Year 2018 Recommendation We support HSCRC s proposed QBR payment scale change for fiscal year This would mean a change after the performance period, but before hospitals fiscal 2018 budgets are set. The fiscal 2018 performance period ended September 30 for some metrics and ends December 31 for others.
60 Dianne Feeney December 2, 2016 Page 4 Fiscal Year 2019 Recommendation HSCRC staff have proposed three options for the fiscal 2019 payment scale: 1. Returning to a relative scale This option is undesirable because the payment adjustments are not known until all hospitals final performance scores are calculated. The lag in publicly available data means that the payment adjustment is not usually known until a few months after the start of the fiscal year in which the adjustment applies, making it difficult for hospitals to budget for the payment adjustment. 2. Pre-set scale based on fiscal 2017 actual Maryland performance While we support this approach for fiscal 2018 only, improvements are needed for 2019 and future years. Simply setting the payment scale on the most recent year s performance does not account for potential movement up and down in overall scores as measures are moved into the program. This approach risks another misalignment of actual payment adjustments and performance expectations. 3. National scale based on possible points (range from 0-1, with a break point set at 0.5.) This option is also undesirable. Under CMS Value-Based Payment program, hospitals can score anywhere between 0 and 1.0 total points. However, the program adjusts for relative ranking, effectively grading on a curve. Using the 0-1 range and 0.5 as the break point will create a significantly higher performance standard in Maryland than the nation. MHA proposes an alternative approach. Maryland s performance scores are a little more tightly clustered around the median, and overall a few points lower than the median. This suggests that moving the Maryland payment scale closer to national performance would move the Maryland performance curve to the right. The challenge in simply setting the Maryland scale with the break point a few points higher than the most recent Maryland median, or at the most recent year s national median score, is that the national scores also move up or down by a few basis points, depending on which metrics are included. To address this uncertainty, we propose creating a zone in the midrange where no payment adjustment is made. This creates a buffer zone to protect against volatility that results from changing metrics and is therefore beyond HSCRC s ability to predict. The no-adjustment zone would be set at a quarter of the standard deviation, centered on either side of a median score. As mentioned earlier, we recommend that HSCRC commissioners discuss where to set the break point of the scale, informed by expectations of improvement and median performance. We modeled this alternative using Maryland fiscal 2017 scores with a break point set at 0.38 (two basis points higher than the Maryland median and one point lower than the national median for 2017.) The results are shown on the next page, along with HSCRC options 2 and 3, all of which are based on 2017 data.
61 Dianne Feeney December 2, 2016 Page 5 We appreciate the commission s consideration of our comments and the opportunity to continue working with HSCRC staff as we implement multi-faceted and groundbreaking policies. Sincerely, Traci La Valle Vice President Enclosure cc: Nelson J. Sabatini, Chairman Herbert S. Wong, Ph.D., Vice Chairman Joseph Antos, Ph.D. Victoria W. Bayless George H. Bone, M.D. John M. Colmers Jack C. Keane Donna Kinzer, Executive Director
62 FY 2019 Options HOSPITAL NAME FY 16 Permanent Inpatient Revenue QBR FINAL POINTS % Revenue Impact HSCRC Option 2 HSCRC Option 3 $ Revenue Impact % Revenue Impact $ Revenue Impact % Revenue Impact MHA Option $ Revenue Impact Bon Secours Hospital $ 74,789, % -$1,495, % -$1,286, % -$1,495,794 Laurel Regional Hospital $ 60,431, % -$846, % -$821, % -$805,748 Maryland General Hospital $ 126,399, % -$1,432, % -$1,516, % -$1,310,808 Northwest Hospital Center $ 114,214, % -$1,142, % -$1,279, % -$1,015,239 Holy Cross Hospital $ 316,970, % -$2,958, % -$3,423, % -$2,582,725 Prince Georges Hospital Center $ 220,306, % -$1,909, % -$2,291, % -$1,631,899 Southern Maryland Hospital Center 156,564,761 $ % -$1,252, % -$1,565, % -$1,043,765 Washington Adventist Hospital $ 155,199, % -$1,241, % -$1,551, % -$1,034,661 Sinai Hospital $ 415,350, % -$1,661, % -$3,156, % -$923,002 Memorial Hospital at Easton $ 101,975, % -$407, % -$775, % -$226,612 Anne Arundel Medical Center $ 291,882, % -$1,167, % -$2,218, % -$648,628 Franklin Square Hospital Center $ 274,203, % -$1,096, % -$2,083, % -$609,340 Union Memorial Hospital $ 238,195, % -$952, % -$1,810, % -$529,323 St. Agnes Hospital $ 232,266, % -$774, % -$1,672, % -$344,098 Baltimore Washington Medical Center $ 237,934, % -$634, % -$1,617, % -$176,248 Western MD Regional Medical Center $ 167,618, % -$335, % -$1,072, % $0 Harford Memorial Hospital $ 45,713, % -$60, % -$274, % $0 Doctors Community Hospital $ 132,614, % -$176, % -$795, % $0 Meritus Hospital $ 190,659, % -$127, % -$1,067, % $0 Johns Hopkins Hospital 1,244,297,900 $ % -$829, % -$6,968, % $0 Union of Cecil $ 69,389, % $0-0.52% -$360, % $0 Johns Hopkins Bayview Medical Center $ 343,229, % $171, % -$1,647, % $0 Shady Grove Adventist Hospital 220,608,397 $ % $110, % -$1,058, % $0 Peninsula Regional Medical Center $ 242,318, % $121, % -$1,163, % $0 Upper Chesapeake Medical Center $ 135,939, % $67, % -$652, % $0 Chester River Hospital Center $ 21,575, % $10, % -$103, % $0 University of Maryland Hospital 906,034,034 $ % $906, % -$3,986, % $476,860 Atlantic General Hospital $ 37,750, % $37, % -$166, % $19,869 Garrett County Memorial Hospital $ 19,149, % $28, % -$76, % $20,157 Fort Washington Medical Center $ 19,674, % $39, % -$70, % $31,065 Mercy Medical Center $ 214,208, % $428, % -$771, % $338,224 Civista Medical Center $ 67,052, % $167, % -$214, % $141,164 Carroll Hospital Center $ 136,267, % $408, % -$381, % $358,599 Calvert Memorial Hospital $ 62,336, % $187, % -$174, % $164,042 UM ST. JOSEPH $ 234,223, % $702, % -$655, % $616,377 Dorchester General Hospital $ 26,999, % $94, % -$64, % $85,260 Montgomery General Hospital $ 75,687, % $302, % -$151, % $278,849 Harbor Hospital Center $ 113,244, % $452, % -$226, % $417,217 Frederick Memorial Hospital $ 190,413, % $856, % -$304, % $801,742 Suburban Hospital $ 193,176, % $965, % -$231, % $915,044 Greater Baltimore Medical Center $ 207,515, % $1,245, % -$83, % $1,201,407 Good Samaritan Hospital $ 160,795, % $964, % -$64, % $930,922 Howard County General Hospital $ 165,683, % $1,656, % $463, % $1,656,837 St. Mary's Hospital $ 69,169, % $691, % $608, % $691,692 FY17 Statewide Total $8,730,031,841 -$9,883,530 -$48,787,350 -$5,232,563 Total Penalties -20,503,119-49,859,954-14,377,891 % Inpatient Revenue -0.23% -0.57% -0.16% Total rewards 10,619,589 1,072,604 9,145,329 % Inpatient revenue 0.12% 0.01% 0.10%
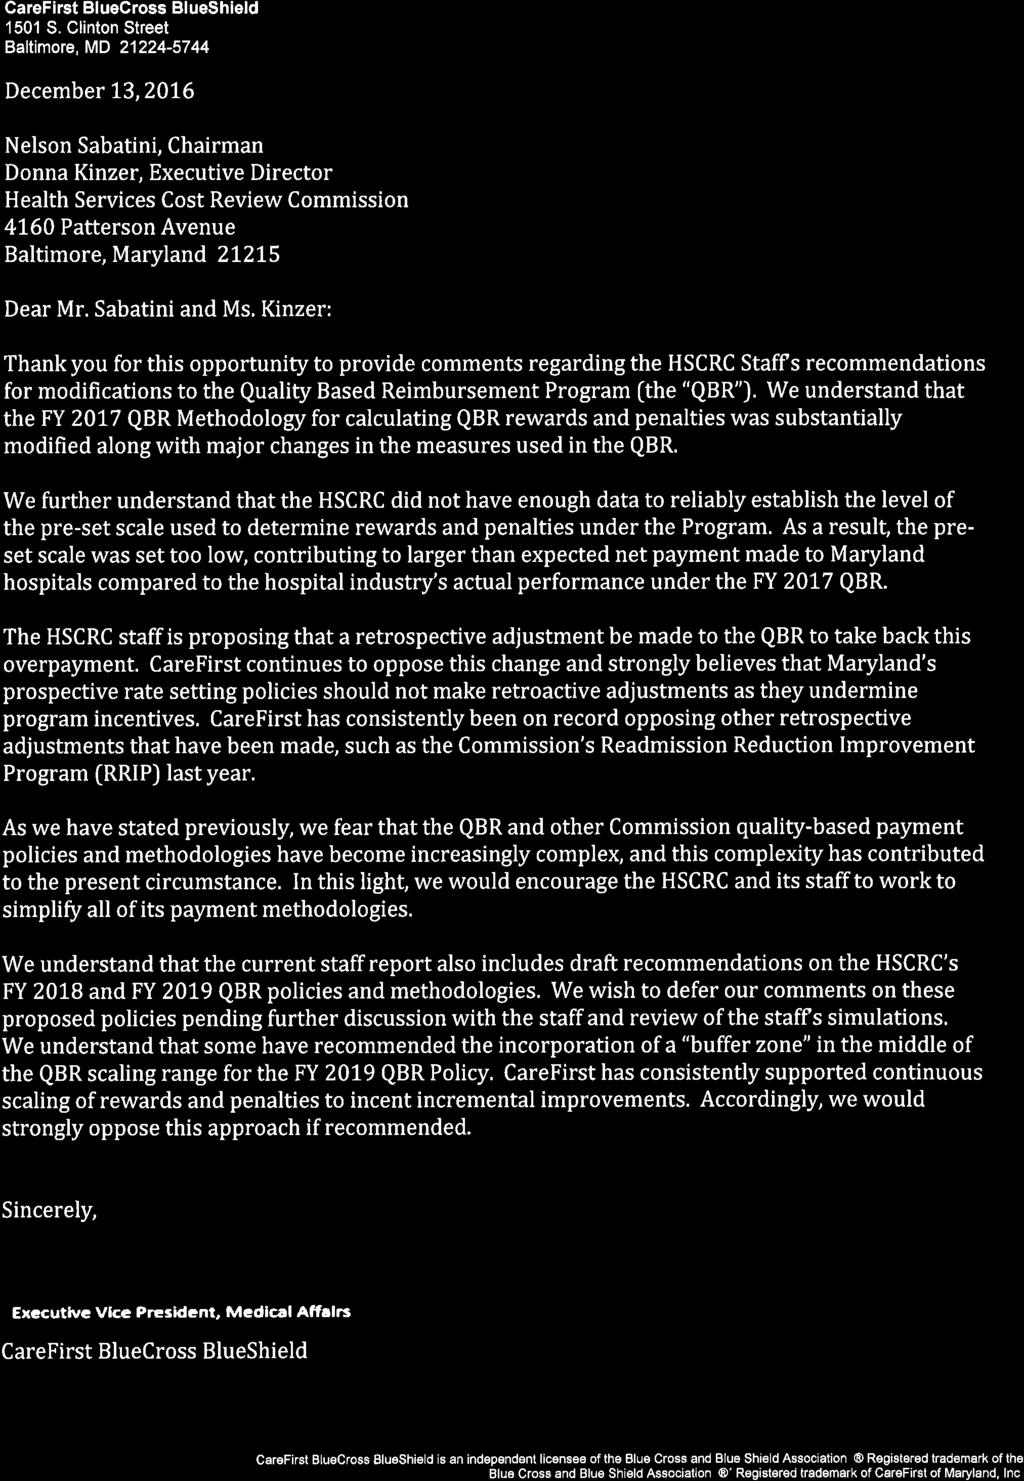

63
64 Staff Recommendation Medicaid Current Financing December 14, 2016
65 Background The Medical Assistance Program (MAP) requested at the Commission s April 13, 2016 public meeting to continue a modified current financing formula, i.e., increasing its CY 2015 current financing deposits by the HSCRC s final update factor with the caveat that they would develop a revised methodology for CY The Commission approved MAP s request, but directed MAP to return in six months with a revised current financing methodology and that If MAP did not develop a revised methodology by then, that it would be required to use the standard current financing methodology. Staff Recommendation Although, MAP has been working with staff to develop a revised methodology. However, because of the pressure of the State s continuing budget crisis and the efforts of both staff and MAP on the New Model Progression to Phase II, staff recommends that the time for MAP to develop a revised current financing methodology be extended to the April 2017 Commission public meeting.
66 Update from CRISP Representatives from CRISP will present during the Commission meeting

67 Nelson J. Sabatini Chairman Herbert S. Wong, PhD Vice-Chairman Joseph Antos, PhD Victoria W. Bayless George H. Bone, M.D. John M. Colmers Jack C. Keane State of Maryland Department of Health and Mental Hygiene Health Services Cost Review Commission 4160 Patterson Avenue, Baltimore, Maryland Phone: Fax: Toll Free: hscrc.maryland.gov Donna Kinzer Executive Director Stephen Ports, Director Engagement and Alignment Sule Gerovich, PhD, Director Population Based Methodologies Chris L. Peterson, Director Clinical and Financial Information Gerard J. Schmith, Director Revenue and Regulation Compliance TO: FROM: Commissioners HSCRC Staff DATE: December 14, 2016 RE: Hearing and Meeting Schedule January 11, 2017 February 8, 2017 To be determined Patterson Avenue HSCRC/MHCC Conference Room To be determined Patterson Avenue HSCRC/MHCC Conference Room Please note that Commissioner s binders will be available in the Commission s office at 11:45 a.m. The Agenda for the Executive and Public Sessions will be available for your review on the Thursday before the Commission meeting on the Commission s website at Post-meeting documents will be available on the Commission s website following the Commission meeting.
Staff Draft Recommendations for Updating the Quality-Based Reimbursement Program for Rate Year 2020
 RY 2020 Draft Recommendation for QBR Policy Staff Draft Recommendations for Updating the Quality-Based Reimbursement Program for Rate Year 2020 November 13, 2017 Health Services Cost Review Commission
Facility State National
 Percentage Summary Report Page 1 of 5 Data As Of: 07/27/2016 Total Performance Facility State National 35.250000000000 37.325750561167 35.561361414483 Unweighted Domain Weighting Weighted Domain Clinical
Medicare Quality Based Payment Reform (QBPR) Program Reference Guide Fiscal Years
 Program Reference Guide Fiscal Years") julian.coomes@flhosp.orgjulian.coomes@flhosp.org Medicare Quality Based Payment Reform (QBPR) Program Reference Guide Fiscal Years 2018-2020 October 2017 Table of Contents Value Based Purchasing (VBP)
julian.coomes@flhosp.orgjulian.coomes@flhosp.org Medicare Quality Based Payment Reform (QBPR) Program Reference Guide Fiscal Years 2018-2020 October 2017 Table of Contents Value Based Purchasing (VBP)
Understanding HSCRC Quality Programs and Methodology Updates
 Understanding HSCRC Quality Programs and Methodology Updates Kristen Geissler, MS, PT, CPHQ, MBA Managing Director Beth Greskovich - Director Berkeley Research Group August 19, 2016 Maryland Waiver and
Quality Based Impacts to Medicare Inpatient Payments
 Quality Based Impacts to Medicare Inpatient Payments Overview New Developments in Quality Based Reimbursement Recap of programs Hospital acquired conditions Readmission reduction program Value based purchasing
Medicare Value Based Purchasing Overview
 Medicare Value Based Purchasing Overview Washington State Hospital Association Apprise Health Insights / Oregon Association of Hospitals and Health Systems DataGen Susan McDonough Lauren Davis Bill Shyne
Program Summary. Understanding the Fiscal Year 2019 Hospital Value-Based Purchasing Program. Page 1 of 8 July Overview
 Overview This program summary highlights the major elements of the fiscal year (FY) 2019 Hospital Value-Based Purchasing (VBP) Program administered by the Centers for Medicare & Medicaid Services (CMS).
Understanding Hospital Value-Based Purchasing
 VBP Understanding Hospital Value-Based Purchasing Updated 12/2017 Starting in October 2012, Medicare began rewarding hospitals that provide high-quality care for their patients through the new Hospital
Performance Measurement Work Group Meeting 10/18/2017
 Performance Measurement Work Group Meeting 10/18/2017 Welcome to New Members QBR RY 2020 DRAFT QBR Policy Components QBR Program RY 2020 Snapshot QBR Consists of 3 Domains: Person and Community Engagement
Medicare Value Based Purchasing Overview
 Medicare Value Based Purchasing Overview South Carolina Hospital Association DataGen Susan McDonough Bill Shyne October 29, 2015 Today s Objectives Overview of Medicare Value Based Purchasing Program Review
(202) or CMS Proposals to Improve Quality of Care during Hospital Inpatient Stays
 or CMS Proposals to Improve Quality of Care during Hospital Inpatient Stays") DEPARTMENT OF HEALTH & HUMAN SERVICES Centers for Medicare & Medicaid Services Room 352-G 200 Independence Avenue, SW Washington, DC 20201 FACT SHEET FOR IMMEDIATE RELEASE April 30, 2014 Contact: CMS Media
DEPARTMENT OF HEALTH & HUMAN SERVICES Centers for Medicare & Medicaid Services Room 352-G 200 Independence Avenue, SW Washington, DC 20201 FACT SHEET FOR IMMEDIATE RELEASE April 30, 2014 Contact: CMS Media
HOSPITAL QUALITY MEASURES. Overview of QM s
 HOSPITAL QUALITY MEASURES Overview of QM s QUALITY MEASURES FOR HOSPITALS The overall rating defined by Hospital Compare summarizes up to 57 quality measures reflecting common conditions that hospitals
Medicare P4P -- Medicare Quality Reporting, Incentive and Penalty Programs
 Medicare P4P -- Medicare Quality Reporting, Incentive and Penalty Programs Presenter: Daniel J. Hettich King & Spalding; Washington, DC dhettich@kslaw.com 1 I. Introduction Evolution of Medicare as a Purchaser
Hospital Value-Based Purchasing Program
 Hospital Value-Based Purchasing (VBP) Program Fiscal Year (FY) 2017 Percentage Payment Summary Report (PPSR) Overview Presentation Transcript Moderator/Speaker: Bethany Wheeler-Bunch, MSHA Project Lead,
Scoring Methodology SPRING 2018
 Scoring Methodology SPRING 2018 CONTENTS What is the Hospital Safety Grade?... 4 Eligible Hospitals... 4 Measures... 6 Measure Descriptions... 9 Process/Structural Measures... 9 Computerized Physician
Inpatient Quality Reporting Program
 Hospital Value-Based Purchasing Program: Overview of FY 2017 Questions & Answers Moderator: Deb Price, PhD, MEd Educational Coordinator, Inpatient Program SC, HSAG Speaker(s): Bethany Wheeler, BS HVBP
State of Maryland Department of Health and Mental Hygiene
 John M. Colmers Chairman Herbert S. Wong, Ph.D. Vice-Chairman George H. Bone, M.D. Stephen F. Jencks, M.D., M.P.H. Jack C. Keane Bernadette C. Loftus, M.D. Thomas R. Mullen State of Maryland Department
FINAL RECOMMENDATION REGARDING MODIFYING THE QUALITY- BASED REIMBURSEMENT INITIATIVE AFTER STATE FY 2010
 FINAL RECOMMENDATION REGARDING MODIFYING THE QUALITY- BASED REIMBURSEMENT INITIATIVE AFTER STATE FY 2010 Health Services Cost Review Commission 4160 Patterson Avenue Baltimore, MD 21215 (410) 764-2605
Quality Based Impacts to Medicare Inpatient Payments
 Quality Based Impacts to Medicare Inpatient Payments Brian Herdman Operations Manager, CBIZ KA Consulting Services, LLC July 30, 2015 Overview How did we get here? Summary of IPPS Quality Programs Hospital
Scoring Methodology FALL 2017
 Scoring Methodology FALL 2017 CONTENTS What is the Hospital Safety Grade?... 4 Eligible Hospitals... 4 Measures... 5 Measure Descriptions... 9 Process/Structural Measures... 9 Computerized Physician Order
Future of Quality Reporting and the CMS Quality Incentive Programs
 Future of Quality Reporting and the CMS Quality Incentive Programs Current Quality Environment Continued expansion of quality evaluation Increasing Reporting Requirements Increased Public Surveillance/Scrutiny
Hospital Value-Based Purchasing (VBP) Program
 Program") Hospital Value-Based Purchasing (VBP) Program: Overview of the Fiscal Year 2020 Baseline Measures Report Presentation Transcript Moderator Gugliuzza, MBA Project Manager, Hospital VBP Program Hospital
Hospital Value-Based Purchasing (VBP) Program: Overview of the Fiscal Year 2020 Baseline Measures Report Presentation Transcript Moderator Gugliuzza, MBA Project Manager, Hospital VBP Program Hospital
Report to the Governor
 Report to the Governor Health Services Cost Review Commission 4160 Patterson Avenue Baltimore, Maryland 21215 (410) 764-2605 October 2016 Table of Contents Introduction... 1 The New All-Payer Model with
Hospital-Acquired Condition Reduction Program. Hospital-Specific Report User Guide Fiscal Year 2017
 Hospital-Acquired Condition Reduction Program Hospital-Specific Report User Guide Fiscal Year 2017 Contents Overview... 4 September 2016 Error Notice... 4 Background and Resources... 6 Updates for FY 2017...
Scoring Methodology FALL 2016
 Scoring Methodology FALL 2016 CONTENTS What is the Hospital Safety Grade?... 4 Eligible Hospitals... 4 Measures... 5 Measure Descriptions... 7 Process/Structural Measures... 7 Computerized Physician Order
Hospital Value-Based Purchasing (VBP) Program
 Program") Fiscal Year (FY) 2018 Percentage Payment Summary Report (PPSR) Overview Questions & Answers Moderator Maria Gugliuzza, MBA Project Manager, Hospital VBP Program Hospital Inpatient Value, Incentives, and
Fiscal Year (FY) 2018 Percentage Payment Summary Report (PPSR) Overview Questions & Answers Moderator Maria Gugliuzza, MBA Project Manager, Hospital VBP Program Hospital Inpatient Value, Incentives, and
Medicare Value Based Purchasing August 14, 2012
 Medicare Value Based Purchasing August 14, 2012 Wes Champion Senior Vice President Premier Performance Partners Copyright 2012 PREMIER INC, ALL RIGHTS RESERVED Premier is the nation s largest healthcare
FY 2014 Inpatient PPS Proposed Rule Quality Provisions Webinar
 FY 2014 Inpatient PPS Proposed Rule Quality Provisions Webinar May 23, 2013 AAMC Staff: Scott Wetzel, swetzel@aamc.org Mary Wheatley, mwheatley@aamc.org Important Info on Proposed Rule In Federal Register
STATE OF MARYLAND DEPARTMENT OF HEALTH AND MENTAL HYGIENE
 STATE OF MARYLAND DEPARTMENT OF HEALTH AND MENTAL HYGIENE John M. Colmers Chairman Herbert S. Wong, Ph.D. Vice-Chairman George H. Bone, M.D. Stephen F. Jencks, M. D., M.P.H. Jack C. Keane Bernadette C.
National Provider Call: Hospital Value-Based Purchasing
 National Provider Call: Hospital Value-Based Purchasing Fiscal Year 2015 Overview for Beneficiaries, Providers, and Stakeholders Centers for Medicare & Medicaid Services 1 March 14, 2013 Medicare Learning
Incentives and Penalties
 Incentives and Penalties CAUTI & Value Based Purchasing and Hospital Associated Conditions Penalties: How Your Hospital s CAUTI Rate Affects Payment Linda R. Greene, RN, MPS,CIC UR Highland Hospital Rochester,
OVERVIEW OF THE FALL 2017 LEAPFROG HOSPITAL SAFETY GRADE
 OVERVIEW OF THE FALL 2017 LEAPFROG HOSPITAL SAFETY GRADE September 20, 2017 Missy Danforth Vice President of Health Care Ratings, The Leapfrog Group Presentation Overview 2 About the Leapfrog Hospital
Managing Healthcare Payment Opportunity Fundamentals CENTER FOR INDUSTRY TRANSFORMATION
 Managing Healthcare Payment Opportunity Fundamentals dhgllp.com/healthcare 4510 Cox Road, Suite 200 Glen Allen, VA 23060 Melinda Hancock PARTNER Melinda.Hancock@dhgllp.com 804.474.1249 Michael Strilesky
Medicare Value-Based Purchasing for Hospitals: A New Era in Payment
 Medicare Value-Based Purchasing for Hospitals: A New Era in Payment Daniel J. Hettich March, 2012 I. Introduction: Evolution of Medicare as a Purchaser Cost reimbursement rewards furnishing more services
Competitive Benchmarking Report
 Competitive Benchmarking Report Sample Hospital A comparative assessment of patient safety, quality, and resource use, derived from measures on the Leapfrog Hospital Survey. POWERED BY www.leapfroggroup.org
NOTICE OF WRITTEN COMMENT PERIOD
 NOTICE OF WRITTEN COMMENT PERIOD Notice is hereby given that the public and interested parties are invited to submit written comments to the Commission on any or all of the following staff draft recommendations
P4P Programs 9/13/2013. Medicare P4P Programs. Medicaid P4P Programs
 P4P Programs Medicare P4P Programs Hospital Quality Reporting Programs (IQR and OQR) Hospital Value-Based Purchasing (VBP) Program Hospital Readmissions Reduction Program (HRRP) Hospital-Acquired Conditions
Centers for Medicare & Medicaid Services (CMS) Quality Improvement Program Measures for Acute Care Hospitals - Fiscal Year (FY) 2020 Payment Update
 Quality Improvement Program Measures for Acute Care Hospitals - Fiscal Year (FY) 2020 Payment Update") ID Me asure Name NQF # Value- (VBP) - (HACRP) (HRRP) ID Me asure Name NQF # Value- (VBP) - (HACRP) (HRRP) CMS s - Fiscal Year 2020 Centers for Medicare & Medicaid Services (CMS) Improvement s for Acute
ID Me asure Name NQF # Value- (VBP) - (HACRP) (HRRP) ID Me asure Name NQF # Value- (VBP) - (HACRP) (HRRP) CMS s - Fiscal Year 2020 Centers for Medicare & Medicaid Services (CMS) Improvement s for Acute
FY 2014 Inpatient Prospective Payment System Proposed Rule
 FY 2014 Inpatient Prospective Payment System Proposed Rule Summary of Provisions Potentially Impacting EPs On April 26, 2013, the Centers for Medicare and Medicaid Services (CMS) released its Fiscal Year
Value based Purchasing Legislation, Methodology, and Challenges
 Value based Purchasing Legislation, Methodology, and Challenges Maryland Association for Healthcare Quality Fall Education Conference 29 October 2009 Nikolas Matthes, MD, PhD, MPH, MSc Vice President for
Star Rating Method for Single and Composite Measures
 Star Rating Method for Single and Composite Measures CheckPoint uses three-star ratings to enable consumers to more quickly and easily interpret information about hospital quality measures. Composite ratings
Mastering the Mandatory Elements of the Affordable Care Act. Melinda Hancock Walter Coleman
 Mastering the Mandatory Elements of the Affordable Care Act Melinda Hancock Walter Coleman 1 ACA Gains through 2019 Amounts in Billions Source:CBO and Joint Committee on Taxation, 2010 Projection 2 Current
Draft for the Medicare Performance Adjustment (MPA) Policy for Rate Year 2021
 Policy for Rate Year 2021") Draft for the Medicare Performance Adjustment (MPA) Policy for Rate Year 2021 October 2018 Health Services Cost Review Commission 4160 Patterson Avenue Baltimore, Maryland 21215 (410) 764-2605 FAX: (410)
Draft for the Medicare Performance Adjustment (MPA) Policy for Rate Year 2021 October 2018 Health Services Cost Review Commission 4160 Patterson Avenue Baltimore, Maryland 21215 (410) 764-2605 FAX: (410)
CMS in the 21 st Century
 CMS in the 21 st Century ICE 2013 ANNUAL CONFERENCE David Saÿen, MBA Regional Administrator Centers for Medicare & Medicaid Services San Francisco November 15, 2013 The strategy is to concurrently pursue
Medicare Payment Strategy
 Data and Analytics Medicare Payment Strategy CMS Inpatient Pay For Performance Program Update Eric Fontana, Practice Manager, Data and Analytics Group analytics@advisory.com 2011 THE ADVISORY BOARD COMPANY
Minnesota Statewide Quality Reporting and Measurement System: APPENDICES TO MINNESOTA ADMINISTRATIVE RULES, CHAPTER 4654
 Minnesota Statewide Quality Reporting and Measurement System: APPENDICES TO MINNESOTA ADMINISTRATIVE RULES, CHAPTER 4654 DECEMBER 2017 APPENDICES TO MINNESOTA ADMINISTRATIVE RULES, CHAPTER 4654 Minnesota
Value Based Purchasing
 Value Based Purchasing Baylor Health Care System Leadership Summit October 26, 2011 Sheri Winsper, RN, MSN, MSHA Vice President for Performance Measurement & Reporting Institute for Health Care Research
Troubleshooting Audio
 Welcome! Audio for this event is available via ReadyTalk Internet Streaming. No telephone line is required. Computer speakers or headphones are necessary to listen to streaming audio. Limited dial-in lines
June 24, Dear Ms. Tavenner:
 1275 K Street, NW, Suite 1000 Washington, DC 20005-4006 Phone: 202/789-1890 Fax: 202/789-1899 apicinfo@apic.org www.apic.org June 24, 2013 Ms. Marilyn Tavenner Administrator Centers for Medicare & Medicaid
Final Recommendation for the Medicare Performance Adjustment (MPA) for Rate Year 2020
 for Rate Year 2020") Final Recommendation for the Medicare Performance Adjustment (MPA) for Rate Year 2020 November 13, 2017 Health Services Cost Review Commission 4160 Patterson Avenue Baltimore, Maryland 21215 (410) 764-2605
Final Recommendation for the Medicare Performance Adjustment (MPA) for Rate Year 2020 November 13, 2017 Health Services Cost Review Commission 4160 Patterson Avenue Baltimore, Maryland 21215 (410) 764-2605
Financial Policy & Financial Reporting. Jay Andrews VP of Financial Policy
 Financial Policy & Financial Reporting Jay Andrews VP of Financial Policy 1 Members & Groups Supported Center for Healthcare Excellence Hospital Leadership & Quality Departments Hospital Finance Departments
Hospital Quality Program
 2017 Hospital Quality Program 04HQ1351 R05/16 Blue Cross and Blue Shield of Louisiana is an independent licensee of the Blue Cross and Blue Shield Association and incorporated as Louisiana Health Service
Hospital Inpatient Quality Reporting (IQR) Program
 Program") FY 2019 IPPS Proposed Rule Acute Care Hospital Quality Reporting Programs Overview Questions and Answers Speakers Grace H. Snyder, JD, MPH Program Lead, Hospital IQR Program and Hospital Value-Based Purchasing
FY 2019 IPPS Proposed Rule Acute Care Hospital Quality Reporting Programs Overview Questions and Answers Speakers Grace H. Snyder, JD, MPH Program Lead, Hospital IQR Program and Hospital Value-Based Purchasing
Healthcare- Associated Infections in North Carolina
 2018 Healthcare- Associated Infections in North Carolina Reference Document Revised June 2018 NC Surveillance for Healthcare-Associated and Resistant Pathogens Patient Safety Program NC Department of Health
Hospital Value-Based Purchasing (VBP) Program
 Program") Healthcare-Associated Infection (HAI) Measures Reminders and Updates Questions & Answers Moderator Maria Gugliuzza, MBA Project Manager, Hospital Value-Based Purchasing (VBP) Program Hospital Inpatient
Healthcare-Associated Infection (HAI) Measures Reminders and Updates Questions & Answers Moderator Maria Gugliuzza, MBA Project Manager, Hospital Value-Based Purchasing (VBP) Program Hospital Inpatient
Additional Considerations for SQRMS 2018 Measure Recommendations
 Additional Considerations for SQRMS 2018 Measure Recommendations HCAHPS The Hospital Consumer Assessments of Healthcare Providers and Systems (HCAHPS) is a requirement of MBQIP for CAHs and therefore a
State FY2013 Hospital Pay-for-Performance (P4P) Guide
 Guide") State FY2013 Hospital Pay-for-Performance (P4P) Guide Table of Contents 1. Overview...2 2. Measures...2 3. SFY 2013 Timeline...2 4. Methodology...2 5. Data submission and validation...2 6. Communication,
State FY2013 Hospital Pay-for-Performance (P4P) Guide Table of Contents 1. Overview...2 2. Measures...2 3. SFY 2013 Timeline...2 4. Methodology...2 5. Data submission and validation...2 6. Communication,
2015 Executive Overview
 An Independent Licensee of the Blue Cross and Blue Shield Association 2015 Executive Overview Criteria for the Blue Cross and Blue Shield of Alabama Hospital Tiered Network will be updated effective January
National Patient Safety Goals & Quality Measures CY 2017
 National Patient Safety Goals & Quality Measures CY 2017 General Clinical Orientation 2017 January National Patient Safety Goals 1. Identify Patients Correctly 2. Improve Staff Communication 3. Use Medications
Connecting the Revenue and Reimbursement Cycles
 Connecting the Revenue and Reimbursement Cycles Tuesday, August 19 th, 2014 Toni G. Cesta, Ph.D., RN, FAAN Consultant and Partner Case Management Concepts New York Office And Bev Cunningham, MS, RN Vice
Figure 1. Massachusetts Statewide Aggregate Hospital Acquired Infection Data Summary. Infection Rate* Denominator Count*
 Massachusetts Hospitals Statewide Performance Improvement Agenda Final Report MHA Board-approved Quality & Safety Goal January 2013 Reduce preventable CAUTI, CLABSI and SSI by 40% by 2015 Figure 1. Massachusetts
Step-by-Step Calculations for Value-Based Purchasing
 Overview Hospitals participating in the Hospital VBP Program have the opportunity to review their FY 2019 PPSR. This quick reference guide offers an overview of how CMS calculates scores and awards points
Learning Objectives. Medicare P4P Programs. How to Interpret Medicare s Hospital Pay for Performance Reports
 1 How to Interpret Medicare s Hospital Pay for Performance Reports Richard D. Pinson, MD, FACP, CCS Principal Pinson & Tang, LLC Houston, TX Learning Objectives At the completion of this educational activity,
Medi-Cal APR-DRG Updates. Medi-Cal Updates. Agenda. Medi-Cal APR-DRG Updates Quality Assurance Fee (QAF) Program
 Program") Medi-Cal Updates Amber Ott California Hospital Association Agenda Medi-Cal APR-DRG Updates Quality Assurance Fee (QAF) Program Current QAF Law (SB239) Prop 52 Medicaid Managed Care Final Rules QAF 5 Development
Medi-Cal Updates Amber Ott California Hospital Association Agenda Medi-Cal APR-DRG Updates Quality Assurance Fee (QAF) Program Current QAF Law (SB239) Prop 52 Medicaid Managed Care Final Rules QAF 5 Development
August 1, 2012 (202) CMS makes changes to improve quality of care during hospital inpatient stays
 CMS makes changes to improve quality of care during hospital inpatient stays") DEPARTMENT OF HEALTH & HUMAN SERVICES Centers for Medicare & Medicaid Services Room 352-G 200 Independence Avenue, SW Washington, DC 20201 FACT SHEET FOR IMMEDIATE RELEASE Contact: CMS Media Relations
DEPARTMENT OF HEALTH & HUMAN SERVICES Centers for Medicare & Medicaid Services Room 352-G 200 Independence Avenue, SW Washington, DC 20201 FACT SHEET FOR IMMEDIATE RELEASE Contact: CMS Media Relations
Value-Based Purchasing & Payment Reform How Will It Affect You?
 Value-Based Purchasing & Payment Reform How Will It Affect You? HFAP Webinar September 21, 2012 Nell Buhlman, MBA VP, Product Strategy Click to view recording. Agenda Payment Reform Landscape Current &
Final Recommendation for the Potentially Avoidable Utilization Savings Policy for Rate Year 2018
 Final Recommendations for the Potentially Avoidable Utilization Policy Final Recommendation for the Potentially Avoidable Utilization Policy for Rate Year 2018 June 14, 2017 Health Services Cost Review
State of Rural Healthcare In US
 State of Rural Healthcare In US According to the American Hospital Association (AHA): There are 5564 registered hospital in US 4862 are considered community hospitals 1829 are rural hospitals Aging Population
June 27, Dear Ms. Tavenner:
 1275 K Street, NW, Suite 1000 Washington, DC 20005-4006 Phone: 202/789-1890 Fax: 202/789-1899 apicinfo@apic.org www.apic.org June 27, 2014 Ms. Marilyn Tavenner Administrator Centers for Medicare & Medicaid
The Role of Analytics in the Development of a Successful Readmissions Program
 The Role of Analytics in the Development of a Successful Readmissions Program Pierre Yong, MD, MPH Director, Quality Measurement & Value-Based Incentives Group Centers for Medicare & Medicaid Services
Hospital Value-Based Purchasing (VBP) Program
 Program") Fiscal Year (FY) 2017 HAC Reduction Program, Hospital VBP Program, and HRRP: Hospital Compare Data Update Presentation Transcript Moderator/Speaker Bethany Wheeler-Bunch, MSHA Hospital Value-Based Purchasing
Fiscal Year (FY) 2017 HAC Reduction Program, Hospital VBP Program, and HRRP: Hospital Compare Data Update Presentation Transcript Moderator/Speaker Bethany Wheeler-Bunch, MSHA Hospital Value-Based Purchasing
Home Health Value-Based Purchasing Series: HHVBP Model 101. Wednesday, February 3, 2016
 Home Health Value-Based Purchasing Series: HHVBP Model 101 Wednesday, February 3, 2016 About the Alliance 501(c)(3) non-profit research foundation Mission: To support research and education on the value
MEDICARE FFY 2017 PPS PROPOSED RULES OVERVIEW OHA Finance/PFS Webinar Series. May 10, 2016
 MEDICARE FFY 2017 PPS PROPOSED RULES OVERVIEW 2016 OHA Finance/PFS Webinar Series May 10, 2016 Spring is Medicare PPS Proposed Rules Season Inpatient Hospital Long-Term Acute Care Hospital Inpatient Rehabilitation
Final Recommendations on the Update Factors for FY 2017
 Final Recommendations on the Update Factors for FY 2017 June 8, 2016 Health Services Cost Review Commission 4160 Patterson Avenue Baltimore, Maryland 21215 (410) 764-2605 FAX: (410) 358-6217 This document
PAY FOR PERFORMANCE AND VALUE BASED PURCHASING: Leigh Humphrey, MBA, LMSW, CPHQ
 PAY FOR PERFORMANCE AND VALUE BASED PURCHASING: Leigh Humphrey, MBA, LMSW, CPHQ Objectives Define what Pay for Performance is and why CMS wants us to move in this direction Describe the process of how
The Nexus of Quality and Finance
 The Nexus of Quality and Finance Kristen Geissler Pat Ercolano March 4, 2014 Transition from Volume to Value: IHI Triple Aim IHI Triple Aim Improve patient experience of care (quality & satisfaction) Improve
The Current State of CMS Payfor-Performance. HFMA FL Annual Spring Conference May 22, 2017
 The Current State of CMS Payfor-Performance Programs HFMA FL Annual Spring Conference May 22, 2017 1 AGENDA CMS Hospital P4P Programs Hospital Acquired Conditions (HAC) Hospital Readmissions Reduction
MEDICARE BENEFICIARY QUALITY IMPROVEMENT PROJECT (MBQIP)
") MEDICARE BENEFICIARY QUALITY IMPROVEMENT PROJECT (MBQIP) Began in September 2011 Key quality improvement activity within the Medicare Rural Hospital Flexibility grant program Goal of MBQIP: to improve
MEDICARE BENEFICIARY QUALITY IMPROVEMENT PROJECT (MBQIP) Began in September 2011 Key quality improvement activity within the Medicare Rural Hospital Flexibility grant program Goal of MBQIP: to improve
Clinical Quality Payment Policies Impact to Finance and Operations
 Clinical Quality Payment Policies Impact to Finance and Operations Kristen Geissler, MS, PT, MBA, CPHQ Director Berkeley Research Group December 4, 2014 What s the Buzz? Cost Efficient VALUE Effective
Ohio Hospital Association Finance Committee 2018 Hospital Inpatient Reimbursement Recommendations
 Ohio Hospital Association Finance Committee 2018 Hospital Inpatient Reimbursement Recommendations Freddie L. Johnson, JD, MPA Chief Medical Services & Compliance Officer August 10, 2017 2018 Inpatient
Hospital Quality Reporting Program Updates: An Overview of the CMS Final IPPS Rule for 2017
 Hospital Quality Reporting Program Updates: An Overview of the CMS Final IPPS Rule for 2017 Presented by Vicky Mahn-DiNicola RN, MS, CPHQ VP Clinical Analytics & Research, Midas+, A Xerox Company Accessing
OVERVIEW OF THE SPRING 2018 LEAPFROG HOSPITAL SAFETY GRADE
 OVERVIEW OF THE SPRING 2018 LEAPFROG HOSPITAL SAFETY GRADE February 26, 2018 Missy Danforth Vice President of Health Care Ratings, The Leapfrog Group Presentation Overview 2 About the Leapfrog Hospital
Regulatory Advisor Volume Eight
 Regulatory Advisor Volume Eight 2018 Final Inpatient Prospective Payment System (IPPS) Rule Focused on Quality by Steve Kowske WEALTH ADVISORY OUTSOURCING AUDIT, TAX, AND CONSULTING 2017 CliftonLarsonAllen
Value-Based Purchasing: A Rural Hospital Perspective
 Value-Based Purchasing: A Rural Hospital Perspective Stratis Health & MHA Quality & Patient Safety PPS Hospital Learning Action Network Day Glen Kegley, Hutchinson Health Tuesday, May 3, 2016 Mall of America-
2013 Health Care Regulatory Update. January 8, 2013
 2013 Health Care Regulatory Update January 8, 2013 Quality-Based Payment Reform, ACOs and Clinical Integration Bruce Johnson and Tom Donohoe Overview Quality-based payment reform programs Major programs
Contributions of the three domains to total HACRP score were examined for each hospital. Several hospital characteristics were also examined to
 Is the CMS hospital acquired condition reduction program a valid measure of hospital performance? Authors: Fuller, RL; Goldfield, NI; Averill, RF; Hughes, JS. Correspondence can be directed to Richard
Policies for Controlling Volume January 9, 2014
 Policies for Controlling Volume January 9, 2014 The Maryland Hospital Association Policies for controlling volume Introduction Under the proposed demonstration model, the HSCRC will move from a regulatory
Quality Care Amongst Clinical Commotion: Daily Challenges in the Care Environment
 Quality Care Amongst Clinical Commotion: Daily Challenges in the Care Environment presented by Sherry Kwater, MSM,BSN,RN Chief Nursing Officer Penn State Hershey Medical Center Objectives 1. Understand
Special Open Door Forum Participation Instructions: Dial: Reference Conference ID#:
 Page 1 Centers for Medicare & Medicaid Services Hospital Value-Based Purchasing Program Special Open Door Forum: FY 2013 Program Wednesday, July 27, 2011 1:00 p.m.-3:00 p.m. ET The Centers for Medicare
Recommendation to Adopt a Severity-Adjusted Grouper
 Recommendation to Adopt a Severity-Adjusted Grouper Health Services Cost Review Commission 4160 Patterson Avenue Baltimore, MD 21215 (410) 764-2605 Fax (410) 358-6217 June 2, 2004 This recommendation is
SCORING METHODOLOGY APRIL 2014
 SCORING METHODOLOGY APRIL 2014 HOSPITAL SAFETY SCORE Contents What is the Hospital Safety Score?... 4 Who is The Leapfrog Group?... 4 Eligible and Excluded Hospitals... 4 Scoring Methodology... 5 Measures...
Inpatient Quality Reporting Program for Hospitals
 Inpatient Quality Reporting Program for Hospitals Candace Jackson, RN Project Lead, Hospital Inpatient Quality Reporting (IQR) Program Hospital Inpatient Value, Incentives, and Quality Reporting (VIQR)
Hospital Inpatient Quality Reporting (IQR) Program
 Program") FY 2019 IPPS Proposed Rule Acute Care Hospital Quality Reporting Programs Overview Presentation Transcript Speakers Grace H. Snyder, JD, MPH Program Lead, Hospital IQR Program and Hospital Value-Based
FY 2019 IPPS Proposed Rule Acute Care Hospital Quality Reporting Programs Overview Presentation Transcript Speakers Grace H. Snyder, JD, MPH Program Lead, Hospital IQR Program and Hospital Value-Based
Hospital Inpatient Quality Reporting (IQR) Program
 Program") Fiscal Year 2018 Hospital VBP Program, HAC Reduction Program, and HRRP: Hospital Compare Data Update Presentation Transcript Moderator Maria Gugliuzza, MBA Project Manager, Hospital Value-Based Purchasing
Fiscal Year 2018 Hospital VBP Program, HAC Reduction Program, and HRRP: Hospital Compare Data Update Presentation Transcript Moderator Maria Gugliuzza, MBA Project Manager, Hospital Value-Based Purchasing
UNIVERSITY OF ILLINOIS HOSPITAL & HEALTH SCIENCES SYSTEM HOSPITAL DASHBOARD
 UNIVERSITY OF ILLINOIS HOSPITAL & HEALTH SCIENCES SYSTEM HOSPITAL DASHBOARD January 19, 2017 UI Health Metrics FY17 Q1 Actual FY17 Q1 Target FY Q1 Actual Ist Quarter % change FY17 vs FY Discharges 4,836
Final Rule Summary. Medicare Skilled Nursing Facility Prospective Payment System Fiscal Year 2017
 Final Rule Summary Medicare Skilled Nursing Facility Prospective Payment System Fiscal Year 2017 August 2016 Table of Contents Overview and Resources... 2 Skilled Nursing Facility (SNF) Payment Rates...
Fiscal Year 2014 Final Rule: Updates for LTCHs
 Fiscal Year 2014 Final Rule: Updates for LTCHs Kristen Smith, MHA, PT Senior Consultant, Fleming-AOD Mary Dalrymple Managing Director, LTRAX FY14 Final Rule & Impact Objectives Review updates to the FY14
Quality Outcomes and Data Collection
 Quality Outcomes and Data Collection Presented By: Joanne Jones Director, Clinical Consulting Services August 30, 2016 Quality Measurement in LTC CMS Nursing Home Compare 5 Star Rating System New measures
 Report to Congressional Defense Committees on Pilot Program on Incentive Programs to Improve Health Care Provided Under the TRICARE Program In Response to: Section 726 of the National Defense Authorization
NHSN: An Update on the Risk Adjustment of HAI Data
 National Center for Emerging and Zoonotic Infectious Diseases NHSN: An Update on the Risk Adjustment of HAI Data Maggie Dudeck, MPH Zuleika Aponte, MPH Rashad Arcement, MSPH Prachi Patel, MPH Wednesday,