NEW WARDS FOR TORONTO TORONTO WARD BOUNDARY REVIEW
|
|
|
- Meghan Gregory
- 5 years ago
- Views:
Transcription
1 FINAL REPORT NEW WARDS FOR TORONTO TORONTO WARD BOUNDARY REVIEW MAY 2016 DRAWTHELINES.CA T O R O N T O W A R D B O U N D A R Y THE DRAW LINES R E V I E W
2 CONTENTS 1. EXECUTIVE SUMMARY 1.1. Recommended Ward Structure The Toronto Ward Boundary Review How to Read this Report About Ward Boundary Reviews Why A Ward Boundary Review Effective Representation The Role of the OMB The TWBR Steps Provincial & Federal Riding Boundaries Where are the Changes WHY A TORONTO WARD BOUNDARY REVIEW 2.1. Purpose of the TWBR Components of Effective Representation The Status Quo is Not an Option The Role of the OMB THE TWBR STEP-BY-STEP 3.1. Overview Comparative Research Two Stage Process for Civic Engagement & Public Consultation Round One Civic Engagement & Public Consultation Creating the Options Round Two Civic Engagement & Public Consultation PREFERRED OPTION & REFINEMENTS 4.1. Ranking the Options Preferred Option Refinements RECOMMENDATION FOR NEW WARDS FOR TORONTO 5.1. A New Ward Structure Effective Representation Where are the Changes CONCLUSION & NEXT STEPS 57. Acknowledgements 58. APPENDIX A Map of Current Wards APPENDIX B Maps of the 5 Options APPENDIX C Ward-Specific Refinements APPENDIX D Out of Scope Comments APPENDIX E Map of Recommended Wards - Large Version (11x17 )
3 SECTION ONE EXECUTIVE SUMMARY TORONTO WARD BOUNDARY REVIEW / NEW WARDS FOR TORONTO / FINAL REPORT T O R O N T O W A R D B O U N D A R Y THE DRAW LINES R E V I E W

4 A ward boundary review seeks to achieve effective representation throughout the municipality. Factors such as the number of people in each ward, geographic communities of interest, future growth, coherent boundaries, the capacity of councillors to represent their constituents and ward history need to be balanced. Any new ward structure can be implemented in the next municipal election. This report presents a recommendation for new wards for Toronto that achieves the principle of effective representation, can be implemented for the 2018 municipal election and will last until the 2030 municipal election. Toronto s current ward structure, developed approximately 15 years ago, has become unbalanced. This impacts voter parity (similar but not identical population numbers among wards) not just at election time, but every time City Council votes. All reports prior to this Final Report can be found online: 1.
5 RECOMMENDED WARD STRUCTURE The map Recommended Wards on the following page presents the recommended ward structure. The larger version (11x17 ) can be found in APPENDIX E. The recommended ward structure is based on Option 1: Minimal Change 1. This option emerged as the preferred option based on feedback received from Members of Council and the public during the project s civic engagement and public consultation process. Many of the responses also suggested refinements to the Option 1 ward boundaries. The TWBR has examined these refinements, as well as suggested refinements to other options and to existing wards, if they were relevant to Option 1. The recommended ward structure has attempted to incorporate as many of those refinements as possible. Refinements that upset voter parity or negatively affect any other component of effective representation were not incorporated. All of the suggested refinements together with the Action on each refinement are included in APPENDIX C to this report. The recommended ward structure: Minimally increases the number of wards given the need to accommodate the projected rapid growth of the city to 3.2 million people in The recommended ward structure results in 47 wards - an increase of 3 wards from the current 44 (see APPENDIX A for a map of the current City of Toronto wards). Retains the current average ward size of 61,000 people. Achieves effective representation in all wards by The population variance is limited to plus or minus 15% of the average ward population of 61,000 for 44 of the 47 wards. Two wards are minimally above 15% (RW15 & RW41) and one ward is slightly below 15% (RW20). To review the detailed projected populations and variances of the 47 recommended wards from 2018 (the first election the new wards will be used), to 2030, please see TABLE 1: Recommended Wards - Projected Population and Variance Is designed to last for four municipal elections. The recommended ward structure can be implemented for the 2018 election and can be used for the elections of 2022, 2026 and Maps of the five options can be found in Appendix B and the full Options Report can be found at 2.
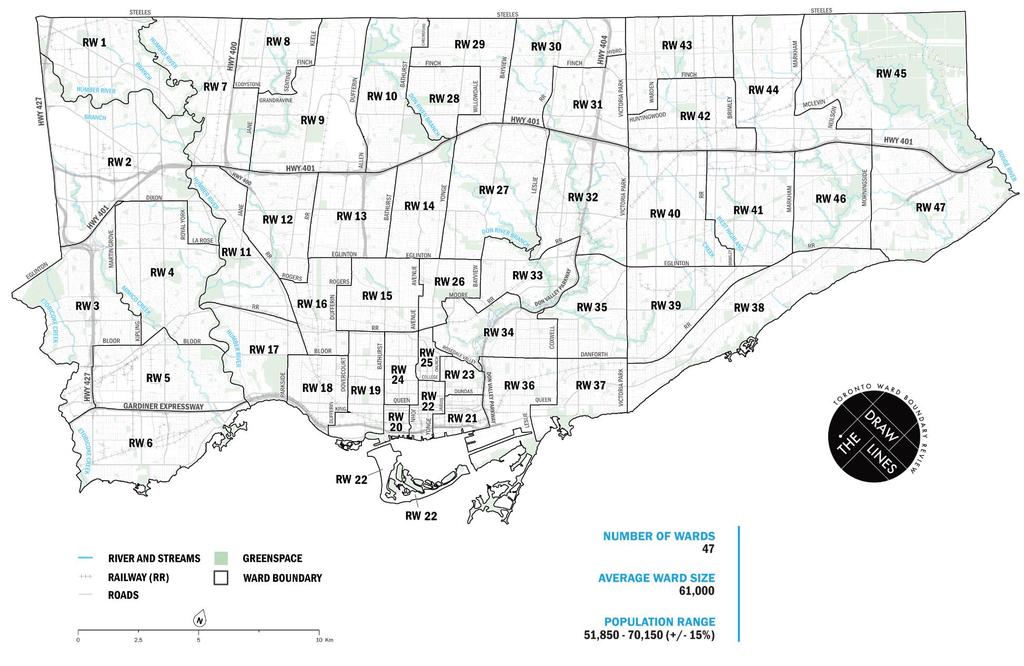
6 RECOMMENDED WARDS 3.
7 1.1 THE TORONTO WARD BOUNDARY REVIEW In 2014 Toronto City Council formally recognized that Toronto s existing ward structure was out of balance and launched the Toronto Ward Boundary Review (TWBR). Between July 2014 and February 2015, the TWBR conducted Round One of its civic engagement and public consultation process to collect opinions on Toronto's current ward alignment. The results informed the development of five options for re-aligning Toronto s wards. Round Two of the TWBR s civic engagement and public consultation process solicited feedback on these options between August and November This report summarizes the entire Toronto Ward Boundary Review process and outlines the methodology used for arriving at the recommended ward structure. 1.2 HOW TO READ THIS REPORT This Report contains six sections and several appendices: Section 2 summarizes the reasons the TWBR was conducted; Section 3 details all major steps completed during the TWBR project; Section 4 describes how the preferred option was determined and how the ward boundary refinements suggested by TWBR participants were analyzed; Section 5 provides the detailed recommendation for new wards for Toronto; Section 6 outlines the conclusion and next steps; APPENDIX A contains the current ward boundary map; APPENDIX B presents the maps of the 5 options, which were the focus of discussion during Round Two of the TWBR s civic engagement and public consultation process; APPENDIX C contains the numerous suggestions for ward-specific refinements; APPENDIX D lists comments gathered during Rounds One and Two of the TWBR s public process, which are outside of the project s purview; and APPENDIX E is a large version of the recommended new wards for Toronto. 1.3 ABOUT WARD BOUNDARY REVIEWS Designing a ward structure for any municipality is not solely an academic or technical exercise. The population size of a ward affects how residents are represented at City Council not just at election time, but every time Council votes. It also influences how well Councillors can represent the number of people in a ward. Ward boundaries shape the relationship of residents and the business community with their local government and Councillors link with their electorate. Any changes to ward boundaries can be disruptive. It is therefore important to find the right fit for the City of Toronto. 1.4 WHY A WARD BOUNDARY REVIEW? Since Toronto s existing ward structure was created in 2000, growth in the City has been significant. Toronto s population today is approximately 2.9 million. This is some 400,000 more than when the current wards were put in place. 4.
8 Between 2011 (a Census year) and 2030, Toronto s population is projected to grow by 500,000 people to a total of 3.2 million. In addition, there are large variations in ward population sizes. For the 2014 election the smallest ward was 45,440 (Ward 18) and the largest ward was 94,600 (Ward 27). The variance around the average ward population size ranged from minus 25.03% to plus 56.07%. Therefore, the current Council finds itself in a situation where the range in ward populations, from smallest to largest, is over 75%. This range has most likely increased since EFFECTIVE REPRESENTATION Effective representation is an inclusive phrase used to consider how well residents are represented in our form of government, which we call representative democracy. At a general level it means that one person s vote should be of similar weight to another person s. Applied to wards, it suggests that wards should be of similar population size. In some jurisdictions this is referred to as rep-by-pop, or representation by population. In the TWBR it is referred to as voter parity. interest have to be respected, natural/physical boundaries should be used as ward boundaries and ward history, population growth, the capacity to represent, and the geographic shape and size of a ward have to be taken into consideration. Toronto s population today is approximately 2.9 million. This is some 400,000 more than when the current wards were put in place. 1.6 THE ROLE OF THE OMB Changing an existing ward structure is a challenging and difficult task. The TWBR makes a specific recommendation for new wards for Toronto but it is up to City Council to make a final decision. Council s decision, or lack of decision, which effectively leaves the current ward alignment in place, can be appealed to the Ontario Municipal Board (OMB). The recommended new ward structure meets the tests of effective representation and any amendments that City Council may wish to make have to maintain these tests to be defensible at the OMB. In addition to voter parity, effective representation includes several other components, which have to be balanced when designing a ward structure. Geographic communities of 5.

9 1.7 THE TWBR STEPS The TWBR process included 6 steps: 6.
10 1.8 PROVINCIAL & FEDERAL RIDING BOUNDARIES During Round One of the TWBR civic engagement and public consultation process, there was little support for reducing the number of wards to 25 to mirror the new federal ridings. However, there was some interest in aligning new ward boundaries with the boundaries of provincial or federal ridings and then dividing them in two resulting in 50 wards. The TWBR did not pursue this, since such a ward structure would not achieve voter parity, an essential component of effective representation, nor would it address the current discrepancies in ward population sizes. Option 1: Minimal Change comes closest to such a configuration, since Toronto s existing ward structure is based on provincial riding boundaries. 1.9 WHERE ARE THE CHANGES The recommended new ward structure for Toronto increases the total number of wards to 47 from 44. This increase rebalances the existing ward population discrepancies by enlarging small wards and decreasing large wards. It also accommodates the projected population growth to Where are the new wards? This seems like a straightforward question but the answer is more complex. Of the 44 existing wards, 38 experience some changes in their boundaries and are, therefore, new wards. Only 6 existing wards (Wards 1,2, 6, 10, 11 and 35) retain their exact current boundaries. To demonstrate where the additional wards are located, it is helpful to examine the major natural and physical boundaries of the recommended ward structure and the seven geographic areas of the city they delineate. The major boundaries are: the Humber River, Victoria Park Avenue, the Downtown, as defined by the Official Plan, Hwy. 401, and, in general, Eglinton Avenue. In four of the areas there are no changes in the number of wards. These are: the area west of the Humber River (6 wards); the area east of Victoria Park Avenue (10 wards); the area south of Hwy. 401, generally to Eglinton Avenue, between the Humber River and Victoria Park Avenue (6 wards); and, the area east of Downtown to Victoria Park and generally south of Eglinton Avenue (5 wards). In two areas wards are added. The first is the area north of Hwy. 401 between the Humber River and Victoria Park Avenue. This area goes from 7 to 8 wards. The one ward is added between Bathurst Street and Victoria Park Avenue. The second area is the Downtown. Three wards are added and the Downtown goes from 3 to 6 wards. Finally, in the area west of the Downtown, generally south of Eglinton Avenue to the Humber River, there is one less ward. This area goes from 7 to 6 wards. 7.
11 WHERE ARE THE CHANGES This map illustrates the 7 areas and the changes between the current number of wards and the recommended number of wards. 8.
12 In summary the additional wards can be attributed to three areas of the city. 1. One additional ward north of Hwy. 401 between Bathurst St. and Victoria Park Ave. 2. Three additional wards in the Downtown area. 3. One less ward in the area west of the Downtown and south of Eglinton Ave. All other areas retain the same number of wards they currently have, although most of their ward boundaries have been adjusted. As noted, 6 of the recommended wards are the same as the current wards. This is a reflection of the cascading effect as ward populations are balanced, suggested refinements are incorporated and as many geographic communities of interest as possible are respected. 9.
13 SECTION TWO WHY A TORONTO WARD BOUNDARY REVIEW TORONTO WARD BOUNDARY REVIEW / NEW WARDS FOR TORONTO / FINAL REPORT T O R O N T O W A R D B O U N D A R Y THE DRAW LINES R E V I E W
14 Designing a ward structure for any municipality is not solely an academic or technical exercise. The population size of a ward affects how residents are represented at City Council not just at election time, but every time Council votes. The number of people in a ward also influences how well Councillors can represent their constituents. Ward boundaries shape the relationship of residents and the business community with their local government and Councillors link with their electorate. Any changes to ward boundaries can be disruptive. It is therefore important to find the right fit for the City of Toronto. 2.1 PURPOSE OF THE TWBR The purpose of the TWBR is articulated in the Toronto Ward Boundary Review Project Work Plan, Civic Engagement and Public Consultation Strategy approved by City Council in June 2014: To bring a recommendation to Toronto City Council on a ward boundary configuration that respects the principle of effective representation, as defined by the courts and the Ontario Municipal Board To achieve this goal, the TWBR process must: be able to withstand a challenge most likely at the OMB, but possibly in court; include civic engagement and public consultation approaches that educate, inform and involve residents of Toronto, stakeholders and Council members; be based on a current understanding of ward boundary determination principles and practices; consider in detail the growth that Toronto has experienced and will experience over the coming years; develop a series of ward boundary options for effective representation for consideration and comment by the public, stakeholders and Council members; respect Toronto s equity policies; be conducted in an objective, neutral and independent fashion; and, provide City Council with a specific recommendation for a new ward structure. During the almost two years of the project, the TWBR has operated at arms-length from City of Toronto staff and Members of Council. Council members were interviewed for their opinions on the current ward alignment and on the five options proposed, but they did not comment on the final recommendation prior to its presentation to the City of Toronto Executive Committee and City Council. 10.
15 Since the existing ward structure was created in 2000, growth in the city has been significant. Currently, Toronto s population is approximately 2.9 million. This is some 400,000 more than when the existing wards were put in place. Between 2011 (a Census year) and 2030, Toronto s population is projected to grow by 500,000 people to a total of some 3.2 million. This rapid growth has focused on certain areas, primarily the Downtown and designated growth centres. The growth has followed the policies of the Official Plan. The Official Plan directs growth to specific areas and stipulates that 75% of Toronto s neighbourhoods will remain stable. Most new residents live, and will continue to live, in the Downtown and in the city s growth centres. The concentration of growth has altered the population size of Toronto s wards. While wards are supposed to be similar in population size, currently the largest wards are twice the size of smaller wards. This imbalance, resulting from the city s continuing growth, drives the need for a review of Toronto s ward boundaries. The TWBR faces two challenges; first to correct the current imbalance in ward populations and secondly to accommodate anticipated growth over the next decade. The TWBR is recommending a new ward structure for Toronto that can be implemented in time for the 2018 municipal election and last until COMPONENTS OF EFFECTIVE REPRESENTATION Effective representation is an inclusive phrase used to consider how well residents are represented in our form of government, which we call representative democracy. At a general level it means that one person s vote should be of similar weight to another person s. Applied to wards, it suggests that wards should be of similar population size. In some jurisdictions this is referred to as rep-by-pop, or representation by population. In the TWBR it is referred to as voter parity. In the Canadian context, the Supreme Court of Canada has employed the term effective representation to set the standard for creating municipal ward boundaries and provincial and federal riding boundaries. Effective representation has evolved to include several components, all of which need to be considered in designing a ward structure. These components are: 11.
16 Voter Parity Voter parity speaks to the relationship between a ward s population and the average ward population of all municipal wards. To achieve parity, ward populations need to be similar but not identical. Voter parity is a criterion that has special prominence in weighing the attainment of effective representation. It is assessed in terms of incremental percentage ranges around the average ward population. A range of plus or minus 10% is considered ideal. Population variances can be greater, in limited instances, in order to satisfy other criteria. However, if the range gets too large, effective representation is lost. Natural/Physical Boundaries Natural boundaries such as rivers, ravines and green areas are often used as boundaries to separate wards. In Toronto the Humber River is an excellent example. Similarly, major infrastructure such as expressways, railways, hydro corridors and arterial roads create barriers and are used as ward boundaries. Highway 401 is a ward boundary throughout much of the city and major arterial streets, such as Yonge Street and Victoria Park, also serve as ward boundaries. Natural/physical boundaries are highly recognizable and often separate communities of interest. Geographic Communities of Interest Communities of Interest is a frequently used term in ward boundary reviews but is difficult to define precisely. Sometimes it refers to ethno-cultural commercial areas such as Chinatown, Little Italy or Little India. The term is also used to define neighbourhoods such as The Annex, Rexdale, Malvern, Mimico, Mount Dennis or St. Lawrence. To form a basis for determining ward boundaries, communities of interest must be geographically contiguous. There is no comprehensive list or map of Toronto s communities of interest or neighbourhoods with precise boundaries. Some areas of the city have strong neighbourhood groups and residents associations with well-defined boundaries, while other areas do not. It is important to avoid dividing geographic communities of interest and/or neighbourhoods when creating wards. However, this objective cannot always be achieved. Sometimes a community is so large that to respect voter parity it must be split among more than one ward. The Jane- Finch community and Don Mills fall into this category. Also, some communities may already be split by natural boundaries, such as Malvern in Scarborough. Given the diversity and number of Toronto s various communities, wards will often contain many different communities and/or neighbourhoods. 12.
17 Ward History The history of some wards extends to well before amalgamation and those wards have developed a strong identity. Ward design should, where possible, attempt to consider the history of the ward. For example, Victoria Park Avenue has historically been the western boundary of five of the Scarborough wards. However, ward history, in and of itself, cannot override other major criteria such as voter parity, strong natural/physical boundaries and communities of interest. Capacity to Represent Capacity to represent is often equated with Councillors' workload. It encompasses ward size, types and breadth of concerns, ongoing growth and development, complexity of issues, etc. For example, wards with high employment, major infrastructure facilities, tourism attractions, or special areas such as the Entertainment District, generate a host of issues a Councillor has to deal with, in addition to the concerns of local residents. The courts have noted that Councillors perform two functions. The first is legislative and refers to passing by-laws and considering city-wide issues. All Councillors have this role in common. The courts have referred to the second function as the ombudsman role, which is interpreted as a constituency role. It speaks to a Councillor's responsibility to represent the interests of a ward s residents to the city government and its administrative structure. This latter function, the constituency role, is captured by the concept of the capacity to represent. This role can vary greatly depending on the issues prevalent in any given ward. There is no specific information or data set to quantify this criterion. Some data on development pressures can be gleaned from development pipeline reports and areas that play a special role in the city's economic life are known. Wards with these types of issues can remain in the lower reaches of the voter parity range. Homogeneous, stable wards can rise to the upper end of the voter parity range. Geographic Size and Shape of the Ward All wards cannot be the same geographic size. Some areas of the city are more densely populated than others and some wards have more open space. Comments during Round One of the TWBR s civic engagement and public consultation process noted that many suburban wards are physically larger and take longer to get around in. However, in a built-up city like Toronto equalizing the geographic size of wards is not a relevant consideration. 13.
18 Population Growth Any changes that City Council makes to the current ward alignment will be used for the 2018 municipal election. However, the wards created should also work for future elections. The TWBR looks at the next four elections in 2018, 2022, 2026 and The target election for an evaluation of effective representation has been set for This allows for Toronto s expected growth to be factored into ward boundary calculations. If the new ward structure works in 2026, it should hold until the 2030 municipal election. After that another review of Toronto's ward boundaries will likely be required. Wards that will grow dramatically over the next decade can start out smaller, as they will achieve acceptable voter parity ranges by the municipal elections of 2022 or Similarly, more stable wards, from a population growth perspective, may start larger than average or at the top of the voter parity range, but come closer to average by 2022 or Balancing the Components of Effective Representation Designing a new ward structure requires balancing all the components of effective representation. While all of the components have to be taken into consideration, they are not all equal. Some need to be weighted more heavily than others in determining a new ward configuration. Voter parity is pivotal and is a key determinant of effective representation. Respecting communities of interest is another high priority consideration, along with well-defined, coherent ward boundaries. The Supreme Court of Canada has ruled that voter parity is required based on the Canadian Charter of Rights and Freedoms provision of the right to vote. Besides just voting, the right to vote asserts that one person s vote must be similar in weight to any other person's vote. Voting weights do not need to be identical but they must be 'similar' and within a reasonable range. Within this range other factors such as geographic communities of interest or capacity to represent are considered. Ward boundary reviews need to look into the future. Toronto is growing at a rapid rate. In its pursuit of effective representation, the TWBR looks ahead to 2030 when Toronto s population will have grown to approximately 3.2 million. The TWBR uses total population numbers in a ward and not electors. Councillors, once elected, represent all people in a ward, not just those eligible to vote. Also, as a ward alignment lasts for several elections, some people not eligible to vote currently will become voters in future elections. 14.
19 2.3 THE STATUS QUO IS NOT AN OPTION In November 2014 the TWBR produced a report entitled Why Is Toronto Drawing New Ward Boundaries that explored the city s current ward structure in depth to determine what would happen to the principle of effective representation if no changes were made. The report concluded that the status quo is not an option (all TWBR reports prior to this Final Report can be found online: City staff had pointed out the large variation in ward population sizes, when the TWBR was launched. For the 2010 municipal election, based on 2011 Census data, ward populations in Toronto ranged from 44,935 (Ward 29) to 88,440 (Ward 23). This represented a variation from 24.4% below to 48.8% above the average ward population of 59,433. By the 2014 election the smallest ward was 45,440 (Ward 18) and the largest ward was now 94,600 (Ward 27). The variation around the average ward population size ranged from minus 25.03% to plus 56.07%. Therefore, the current Council finds itself in a situation where the range in ward populations, from smallest to largest, is over 75%. This unsustainable range has most likely increased since the election of The TWBR team set out to track the variations in ward populations, if no changes were made to the existing ward structure, for the four future elections of 2018, 2022, 2026 and For analytical purposes ward populations were grouped into 9 population ranges from 25% below the average ward population size to 25% above the average. These ranges are key indicators of whether or not the voter parity component of effective representation is being achieved. Maps showing the ward population ranges around the averages for all of the next four elections can be found in the Options Report. To reveal the general trend, only the maps for the elections of 2018 (Map 1) and 2026 (Map 2) have been included in this report. The 2018 election is the election that will first implement any new ward structure for Toronto and the 2026 election represents the target election year used throughout the TWBR project to determine voter parity. The maps show voter parity ranges in 5% increments both above and below a 10% range around the average ward population. As noted previously, wards within a 10% range of the average are ideal. As the variances increase above 10%, concerns about voter parity increase and above 15% it becomes problematic, unless convincing extenuating circumstances are involved. 15.

20 MAP 1 VARIANCE BY CURRENT WARD

21 MAP 2 VARIANCE BY CURRENT WARD
22 The emerging pattern is clear. With each election the number of wards outside of the 10% variation range of the average ward population size increases. By 2018, 19 wards are outside plus or minus 10%, the variance range deemed desirable for voter parity. By 2026, 27 wards are outside the 10% range, with 19 of them larger than 10% of the average. Toronto s population growth has been and will be concentrated in the downtown wards and the city s designated growth centres. As noted, Toronto will grow by approximately 500,000 people between 2011 and The current ward structure can simply not accommodate this amount of growth. The ward structure was already starting to tip out of balance in the 2014 election and by 2026 over half of the wards will fall outside a reasonable range in terms of voter parity. As pointed out in the TWRB analysis of the existing ward structure, the status quo is not an option. 2.4 THE ROLE OF THE ONTARIO MUNICIPAL BOARD (OMB) The current Toronto ward structure is out of balance and the situation will worsen with every election. The TWBR recommends a new ward structure that will achieve effective representation starting with the 2018 election and continuing until the election of This recommendation addresses the two key issues facing the existing ward structure: its current population imbalance and the rapid and concentrated growth projected for Toronto. Changing an existing ward structure is a challenging and difficult task. Ward boundaries are imbued with considerable history, and residents and Councillors have worked together in many communities for a long time. While the TWBR team makes a specific recommendation for a new ward structure for Toronto, there are a multitude of competing interests involved in making the final decision. In such a situation a stalemate can be the result. Such a stalemate, or lack of a decision, would by default leave the current ward structure in place. TWBR CHALLENGES 1. Overcome the current imbalance in ward populations 2. Accommodate 3.2 million people by 2030 The decision on the new ward structure is up to Toronto City Council. However, that decision, or lack of a decision, can be appealed to the Ontario Municipal Board (OMB). The TWBR has crafted a recommendation that achieves effective representation and is defensible at the OMB. To remain defensible any amendments City Council may wish to make will have to maintain the tests of effective representation. 18.


23 If Council does not enact a new ward structure, a group of citizens, an NGO or any other interested party can refer the matter to the OMB. Prior to the TWBR process, there were two referrals regarding the City s ward boundaries to the OMB. These were withdrawn on the understanding that the City planned to undertake a comprehensive ward boundary review. Non-action by Council could see these parties come forward again. It is preferable for City Council, an elected, representative body, to make the decision on a new ward structure than having an appointed quasi-judicial body impose a ward structure. A ward boundary review must make sure that boundaries among wards make sense based on: the number of people in each ward, geographic communities of interest and neighbourhoods, future growth, physical and natural boundaries (e.g. ravines, roads and railway tracks), the ward s history and other relevant considerations. Changes will come into effect for the municipal election in
24 SECTION THREE THE TWBR STEP-BY-STEP TORONTO WARD BOUNDARY REVIEW / NEW WARDS FOR TORONTO / FINAL REPORT T O R O N T O W A R D B O U N D A R Y THE DRAW LINES R E V I E W
25 3.1 OVERVIEW Comparative Research Round One Civic Engagement & Public Consultation (input on current ward structure) Ward Boundary Options Round Two Civic Engagement & Public Consultation (feedback on options) Preferred Option and Refinement Analysis Recommendation for New Ward Structure 3.2 COMPARATIVE RESEARCH The TWBR project began with research into the ward structures of other municipalities. The background report, titled Toronto Ward Boundary Review: Background Research Report, December 2014, includes an assessment of Toronto s ward structure within the context of other municipalities in Ontario, Canada and a few international examples. Direct comparisons between Toronto s ward structure and those of other cities in Canada, or internationally cannot be made. Various provincial laws and local practices limit how comparable other jurisdictions can be. For example, Vancouver has 10 councillors but they are all elected at large. At the other end of the council size spectrum, Montreal has 65 elected officials, but the city uses a party-based system within its municipal government. Average ward population sizes amongst Canada s largest cities were examined to determine how Toronto s average ward population size of approximately 61,000 compares 2. Average ward populations range considerably across the country. In Montreal, wards (termed electoral districts) have an average population of 28,439. At the larger end of the scale, Calgary s average ward population size is 78,345. Edmonton and Mississauga are in the 60,000 range. Overall Toronto s average ward population is slightly higher than that of other large Canadian cities. Overall, Toronto s average ward population is slightly higher than that of other large Canadian cities. The research report also examined 13 Ontario cities where ward boundary reviews have occurred since This helped to confirm the context for the guiding principles used in ward boundary reviews, along with the overriding principle of effective representation established by the Supreme Court of Canada. 2 All figures are from the 2011 Census. 20.
26 Ward boundary reviews in Ontario have been appealed in several instances. Of the 13 municipalities assessed, 6 were appealed and the City of Ottawa was appealed twice. A review of the OMB decisions is informative and assists in an understanding of what Toronto might encounter should the TWBR be appealed. Comparative information on the situation in other cities helps provide some context for the TWBR. However, Toronto is the largest and fastest growing city in Canada and this raises unique challenges for the determination of ward boundaries. The TWBR has made a distinction between civic engagement and public consultation. The former focused on all web-based activities and communication with the public, Members of Council and other stakeholders via , print, social media and a user-friendly interactive project web site The latter included face-to-face discussions with Members of Council and stakeholder groups, 24 public meetings and a webinar. 3.3 TWO STAGE PROCESS FOR CIVIC ENGAGEMENT & PUBLIC CONSULTATION The TWBR s civic engagement and public consultation process has been extensive and thorough and will be able to withstand an OMB challenge, should this occur. The process was designed at the beginning of the project and approved by City Council in Spring 2014 (see The Toronto Ward Boundary Review Project Work Plan, Civic Engagement and Public Consultation Strategy). 21.

 55 advertisements (mix of online and print)")

27 TWBR by the Numbers 2811 contacts on TWBR distribution list 1803 direct participants 474 social media contacts 337 posts on the TWBR social media twitter 331 average monthly visits to the drawthelines.ca website 198 posters in public library branches 103 face-to-face meetings (inc. Members of Council, School Boards other stakeholder groups) 55 advertisements (mix of online and print) 24 of public meetings and information sessions 18 maps posted to the drawthelines.ca website 12 e-news issued to the TWBR distribution list 11 media releases 7 reports available on the drawthelines.ca website 1 webinar 22.
28 The TWBR s civic engagement and public consultation process has been delivered in two rounds. Round One (July 2014 to February 2015) solicited opinions about Toronto s current ward structure through individual meetings with Members of Council and a number of stakeholder groups. The general public provided their input via an online survey, and 12 public meetings (3 in each Community Council area). The schedule of the public meetings was constrained by the 2014 municipal election. Community meetings could not begin until after the new City Council took office in early December. Round Two of the process (August 2015 November 2015) collected feedback on five options for a new ward structure from the public and Members of Council, again through individual interviews, another online survey, , a webinar and a second set of 12 public meetings. Both sets of public meetings were held on weekday evenings and Saturday mornings to invite the broadest possible participation. Meeting locations ranged from community centres and church halls to public library branches and seniors centres, all of them accessible to people with limited mobility. American Sign Language interpreters were present at every public meeting, and interpretation in 11 languages as well as attendant care services were available on request. Project print materials, such as the online surveys, advertisements in community newspapers and the public library posters publicizing the 24 public meetings, all communicated the availability of translation services, if required. The public process produced many comments that are outside of the scope of the TWBR. They are largely related to the way City Council currently governs itself. The project team had agreed at the outset to report these comments and suggestions separately. A list of the out-of-scope comments and suggestions can be found in APPENDIX D to this report. More detailed summaries are included as Appendix C of the Round One Report on Civic Engagement + Public Consultation, March 2015 and Appendix B of the Round Two Report on Civic Engagement + Public Consultation: Feedback on the Options for New Ward Boundaries for the City of Toronto, February Throughout the TWBR, the project has benefitted from the ideas and observations of an outside Advisory Panel with expertise in municipal law, business, academe, civil society research and the OMB. The Panel met three times during the course of the project. 23.
29 3.4 ROUND ONE CIVIC ENGAGEMENT & PUBLIC CONSULTATION Round One of the TWBR s civic engagement and public consultation process was the input phase of the project. It collected opinions about the current alignment of Toronto s 44 wards from the general public, Members of Council and stakeholder groups, such as the various school boards, Civic Action (Emerging Leaders Network), Ontario Council of Agencies Serving Immigrants (OCASI), Social Planning Toronto, Toronto Association of Business Improvement Areas and United Way. The project established a website, and a database of community associations and stakeholder groups, including 59 different Toronto-based ethno-cultural organizations. These groups were encouraged to share information about the TWBR with their networks. Five TWBR news releases and a number of City of Toronto releases were sent out to highlight the Round One public process. In all 919 individuals participated as follows: Public Meetings 192 Online Survey 608 /Twitter/website 9 Members of Council ( ) 44 New Members of Council 7 Stakeholder groups 59 During Round One interviews, surveys and public meetings focused on issues with current ward boundaries, communities of interest, ward size, total number of wards and congruity of City ward boundaries with those of federal/provincial ridings. Key Findings Ward Size Generally, there seemed to be commonality across all participant groups regarding ward size. Responses from all groups were comfortable with a ward size close to the current average of 61,000. Many comments suggested 'up to 60,000 people per ward' and 'current size or slightly smaller or larger'. A small minority favoured large wards in the 90,000 to 105,000 plus range, accompanied by additional resources to be allocated to Members of Council. Total Number of Wards A large majority of Council members and responses from public meetings agreed that there should be 44 wards or more (44 50 wards). Survey responses favoured even more wards, i.e wards. 24.
30 A small minority of survey and Council members responses suggested wards to mirror provincial or federal ridings. Follow Provincial or Federal Riding Boundaries Opinions on this issue were divided among survey and public meeting responses. Members of Council suggested that this should not be the major criterion for re-aligning Toronto's wards boundaries. Stakeholder group responses were in favour of following provincial or federal riding boundaries. In addition to comments on specific issues such as ward size, total number of wards and whether Toronto s ward boundaries should follow those of the federal/provincial ridings, Round One participants also made suggestions on how current ward boundaries could be improved to become more logical and/or better reflect existing communities of interest. These ward-specific comments from all participants can be found in Appendix D of the Round One report. Account for Toronto s population growth Ensure validity for four municipal elections Balance ward population sizes Offer a set of diverse and distinct options Achieve effective new ward boundaries The background research and the input from Round One of the civic engagement and public consultation process informed the development of five options for a new ward structure for Toronto. All five options respect the principles of effective representation. From this perspective, any of the options developed could be approved by Council and, in the opinion of the TWBR team, withstand an appeal at the OMB. Two critical factors had to apply to all options. Toronto s projected growth of approximately 500,000 over the time frame of the TWBR (2011 to 2030) needs to be accommodated in the areas where the Official Plan indicates that the bulk of the growth will occur. Secondly, to balance ward population size, the large wards must get smaller and the small wards larger. The parameters for the five options are as follows: 3.5 CREATING THE OPTIONS In designing the options, a methodology was developed to: Option 1 reflects the goal of making minimal changes. This refers to both average ward population size (61,000) and retaining current ward boundaries where possible. 25.
31 Option 2 focuses on keeping the current number of wards and Councillors at 44. Given the anticipated growth, the average ward population increases to 70,000. Options 3 and 4 are based on setting average ward population sizes and creating options that reflect these ward populations. Option 3 (Small Wards) targets an average ward population of 50,000. Option 4 (Large Wards) uses an average ward population of 75,000. Option 5 starts with major natural and physical boundaries, such as rivers and expressways, and designs a ward structure based on these boundaries. Unlike the other options, this option is not based on the existing ward structure. Within these general parameters, the TWBR has used small area population data projections, natural and physical boundaries, community of interest information, and ward history to design the five options and determine exact, possible boundaries. The population projections were provided to the TWBR by the City Planning Division. Those projections were based on 2011 Census data and projected out to 2041 for each Census year. From this data, the TWBR has developed its own projections for the municipal election years of 2018, 2022, 2026 and The TWBR has used the projection scenario that coincides with the growth targets for the City of Toronto in the provincial Growth Plan for the Greater Golden Horseshoe. In designing the five options, population ranges around the average ward population size have been developed. The ideal range is plus or minus 10% of the desired average ward population size. 3 TABLE 1 provides overview information on each option. The TWBR has applied these small area population projections to determine the ward population size for each of the wards in the five options. 3 A complete discussion of the methodology for determining the five options can be found in the Options Report. 26.
32 TABLE 1 SUMMARY OF OPTIONS OPTION 1 NAME Minimal Change AVG. WARD POPULATION 61, Wards 70,000 3 Small Wards 50,000 4 Large Wards 75,000 5 Natural/Physical Boundaries 70,000 WARD POPULATION RANGE 51,850-70,150 63,000 77,000 45,000 55,000 67,500 82,500 63,000 77,000 NO. OF WARDS APPENDIX B to this report contains a map for each of the five options showing specific boundaries for each of the possible wards. The Options Report has provided a number of options. Each has its strengths and weaknesses. For example, the Small Ward option is stronger with respect to capacity to represent than the Large Ward option; the Large Ward option has tighter voter parity numbers than the Minimal Change option; and, the Minimal Change option represents existing ward history better than the other options In the final analysis effective representation is about the balance amongst its various components. All five options have a different balance. However, they all achieve effective representation. Federal and Provincial Ridings During the consultation process the idea of using the federal/provincial riding boundaries as ward boundaries was suggested, although opinion on this issue was divided. There were two variations on this theme. The first was to use the new 25 federal ridings as Toronto s wards. This would result in 25 wards and 25 Councillors with an average ward size of 123,000 people. Only a very small number of Councillors and the public supported this scenario. The second variation was to use the new federal riding boundaries but split them in half. This approach would lead to 50 wards with an average ward population of approximately 60,500 people. This population average is close to Toronto s current average ward population size. It is worth noting that the federal riding boundaries mostly do not align with the current ward boundaries. The TWBR team assessed these two suggestions to see if either could lead to a viable option. 27.
33 Neither variation of the federal riding approach meets the tests of effective representation going forward. Specifically, the ward population size spread is too large from a voter parity perspective. For 2026, the range is 96, ,298 in the 25 ward version and 48,307 67,649 in the 50 ward version. There seems to be little appetite for wards as large as the 25 ward version and adjusting boundaries to make the 50 ward version respect voter parity will end up resembling Option 1 but with three additional wards. In addition, federal riding boundaries are reviewed and adjusted every 10 years, which does not deliver a long term solution. 3.6 ROUND TWO CIVIC ENGAGEMENT & PUBLIC CONSULTATION Round Two of the TWBR s civic engagement and public consultation process was the feedback phase of the project. It sought comments on the five options outlined in the Options Report released on the project website on August 11, 2015 from the same groups as those consulted during Round One. Current Members of Council ( ), stakeholders and the general public were asked to rank the options, suggest possible refinements and provide whatever other comments they thought appropriate via individual interviews, by , during a webinar and by completing an online survey. During the public meetings the five options were outlined, suggestions for refinements to the options were collected and meeting participants were encouraged to complete the survey individually in hard copy or online. In order to promote public discussion and feedback, direct e- mails with a link to the Options Report were sent to the project s distribution list of over 2,800 contacts, which includes community organizations, NGOs, specific ethnocultural organizations and individuals who subscribe to the TWBR mailing list. Separate s were also sent to all Members of Council, the various Boards of Education and other stakeholder groups. In addition, the TWBR as well as the City of Toronto issued news releases drawing attention to the report s availability online. In all 884 individuals participated in Round Two as follows: Public Meetings 112 Online Survey 717 General submissions 15 (5 included a completed survey) Lunch-time webinar - 3 Members of Council 42 Mayor s office staff 3 Visits to TWBR website during feedback period approximately 10,
34 There were no individual meetings with stakeholder groups. Instead, members of these groups were encouraged to complete surveys online and/or attend one of the 12 public meetings. The TWBR was active on social media through Twitter and Facebook to spread the news of the release of the Options Report and to reach out to community members to promote local public meetings. The project was supported in this endeavour by the City of Toronto s social media accounts, but more particularly by the engagement of many Councillors who shared e-news and tweets/posts about the public meetings with their constituents. process. These comments have been captured thematically in the Round Two Report. A detailed analysis of the rankings of the five options from Round Two of the TWBR s civic engagement and public consultation process as well as an analysis of the proposed refinements can be found in the next section of this report and in APPENDIX C. The Round Two Report on Civic Engagement + Public Consultation: Feedback on the Options for New Ward Boundaries for the City of Toronto contains the rankings of the five options from all participants as well as overall comments received on each option. Ward-specific suggestions for refinements from all Round Two participants are consolidated by option and ward in Appendix C of the Round Two Report and additional comments on specific communities of interest and suggestions for refining existing wards can be found in Appendix D of that report. In addition to providing feedback on specific options, Round Two participants also provided other comments about the proposed ward boundaries and the ward boundary review 29.
35 SECTION FOUR PREFERRED OPTION & REFINEMENTS TORONTO WARD BOUNDARY REVIEW / NEW WARDS FOR TORONTO / FINAL REPORT T O R O N T O W A R D B O U N D A R Y THE DRAW LINES R E V I E W
36 Round Two of the TWBR s civic engagement and public consultation process helped establish preferences and acceptability of the five options presented in the Options Report. It also gathered a multitude of suggestions for refining the various options, some of them contradictory. This section of the report provides a summary of the feedback received, discusses the preferred option and describes the TWBR s approach to the proposed refinements. This section of the report provides a summary of the feedback received, discusses the preferred option and describes the TWBR s approach to the proposed refinements. indicated that they do not like some option at all, a no-way comment. In those cases, the option was ranked as a No. Members of the public did not use the No approach. In addition to the first choice analysis, the TWBR team also applied a ranked score, which is able to weigh selections beyond the first choice. A ranked score assigns a numerical value to each choice, and the sum of those values determines the overall result. The following is the way the choices were scored to determine a ranked score for each option: FIRST CHOICE 5 PTS 4.1 RANKING THE OPTIONS The interviews and the Round Two public survey allowed current Members of Council and the public to rank the five options by selecting their first, second, third, fourth and fifth choices. The data and analysis from the Round Two report are provided in this section. Not all survey participants ranked all the options. For example, some only provided their first two or three choices or, perhaps, no choices at all. In these cases the blank options were listed as not ranked. Some Councillors SECOND CHOICE THIRD CHOICE FOURTH CHOICE FIFTH CHOICE NOT RANKED NO 4 PTS 3 PTS 2 PTS 1 PT 0 PTS 0 PTS 30.
37 The total rankings, both from the public and Members of Council, are presented separately to maintain their statistical significance and have been analyzed in four different ways. First, the number of times an option received a first place vote is shown. This indicates which option has the most support. Second, a ranked score is presented. This reveals the total score received by each option. The ranked score approach and first-place analysis do not always yield the same results. Since determining a preferred ward option is a matter of building consensus, options that are viewed as strongly negative can sway the ultimate outcome. Therefore, information is presented on the fifth placed option, the least preferred, and, in the case of the Councillor interviews, options that were rated as No. Fourth, a comparison Chart contrasts the number of first and last, or No, choices. This information indicates how contentious an option may be along with its level of support. Public Survey Results In total, 717 people participated in the public survey. The number of surveys received by ward is presented in TABLE 2. TABLE 2 PUBLIC SURVEY RESPONSES BY WARD WARD # OF RESPONSES WARD # OF RESPONSES Ward not identified in response: 8 Total Surveys:
38 TABLE 3 RANKING BY OPTION PLACEMENT PUBLIC SURVEY OPTION 1 OPTION 5 OPTION 2 OPTION 3 OPTION 4 MINIMAL NATURAL/PHYSICAL 44 WARDS SMALL WARDS LARGE WARDS CHANGE BOUNDARIES First ranked Second ranked Third ranked Fourth ranked Fifth ranked Not ranked TOTAL TABLE 3 represents the results of the public survey, the base data, and indicates how each option was ranked in the public survey. It is from this table that the relevant data for the public s preferred option has been derived. TABLE 4 FIRST PLACE CHOICE PUBLIC SURVEY OPTION 1 OPTION 5 OPTION 2 OPTION 3 OPTION 4 MINIMAL NATURAL/PHYSICAL 44 WARDS SMALL WARDS LARGE WARDS CHANGE BOUNDARIES Times first ranked Option 3 (Small Wards 50,000) received the most first place votes with 186, followed by Option 4 (162), Option 5 (139), Option 1 (126) and finally Option 2 (81). TABLE 5 TOTAL RANKED SCORE PUBLIC SURVEY OPTION 1 OPTION 5 OPTION 2 OPTION 3 OPTION 4 MINIMAL NATURAL/PHYSICAL 44 WARDS SMALL WARDS LARGE WARDS CHANGE BOUNDARIES Total Score The second way the data has been analyzed is by looking at how an option faired across all ranks first to fifth. This gives credit to second to fifth place choices, as well as first. This produces a ranked score, which is shown in TABLE
39 CHART 1 TOTAL RANKED SCORE PUBLIC SURVEY OPTION 1 OPTION 2 OPTION 3 TABLE 6 FIFTH PLACE CHOICE PUBLIC SURVEY OPTION 4 OPTION 5 CHART 1 shows TABLE 5 in graphic form, for ease of comparison. Based on a ranked score approach, Option 1 is preferred while Option 3, which received the most first place choices, falls to fourth place. Option 2 which received the fewest first place votes rises to second place when a ranked score is used. When consideration is given to how an option does overall a different picture emerges from solely a first place choice consideration. Implementation of a new ward structure is not just about which option places first but just as much about which option a consensus can be built around. That is why it is important to know which option placed last and can be considered a no way option. Also, a comparison between first and last can assist in revealing options around which a consensus may be difficult to achieve. OPTION 5 OPTION 1 OPTION 2 OPTION 3 OPTION 4 NATURAL/ MINIMAL 44 WARDS SMALL WARDS LARGE WARDS PHYSICAL CHANGE BOUNDARIES Times ranked fifth TABLE 6 provides information on how the options distributed themselves in fifth or last place in the public survey. 33.
40 Here Option 2 is ranked fifth the fewest times (35). It is the least-worst option; followed by Option 1 (71), Option 5 (105), Option 3 (224) and Option 4 (229). This perspective indicates significant opposition to Options 3 and 4, an important consideration for acceptance and implementation. CHART 2 COMPARISON FIRST & FIFTH CHOICE PUBLIC SURVEY Finally, Chart 2, Comparison First and Option 1 Option 2 Option 3 Option 4 Option 5 First Ranked ranked First option Last Ranked ranked Last option Fifth Choice, graphically illustrates first and fifth choice options from the public survey. This chart, to some extent, reveals how strongly respondents feel about the options in both a positive and negative sense. Both Options 3 and 4 rank high on both first and fifth choices. Respondents seem to love them or hate them. Options 1 and 2, on the other hand, have fewer first place votes but even fewer fifth place votes. Option 5 is somewhere in the middle, but with fewer fifth place votes than first place ones. 34.
 is the favoured option.")
41 Depending on one s perspective, different, often conflicting, observations can be drawn from the public survey responses. From a first place perspective Option 3 (Small Wards 50,000) is the favoured option. However, when second to fifth choices are considered in a ranked score approach, then Option 1 (Minimal Change) is the respondents favoured option. Option 2 (44 Wards) is the least disliked, as measured by fifth place choices, while Option 4 is the most disliked. Members of Council - Results The results from interviews with Members of Council are analyzed in the same fashion as the results from the public survey. In all, 42 Members of Council participated. The questions posed to Councillors were similar to those in the public survey and the approach to the ranking of the options was identical. Most Councillors tied their rankings to refinements to the ward boundaries of various options. That is, a first place choice would have to include certain refinements to be acceptable. The impact of these suggestions is described later in this report. 35.
42 TABLE 7 RANKING BY OPTION MEMBERS OF COUNCIL OPTION 5 OPTION 3 OPTION 1 OPTION 2 OPTION 4 NATURAL/ SMALL MINIMAL CHANGE 44 WARDS LARGE WARDS PHYSICAL WARDS BOUNDARIES First ranked Second ranked Third ranked Fourth ranked Fifth ranked Ranked No Not ranked TOTAL TABLE 7 provides the base data for analyzing how Members of Council ranked the five options. The presentation of the data follows the same approach as that used in the analysis of the public survey. The option with the most first place choices is presented in TABLE 8, First Place Choice. TABLE 8 FIRST PLACE CHOICE MEMBERS OF COUNCIL OPTION 5 OPTION 3 OPTION 1 OPTION 2 OPTION 4 NATURAL/ SMALL MINIMAL CHANGE 44 WARDS LARGE WARDS PHYSICAL WARDS BOUNDARIES Times ranked first Option 1 is the favoured choice amongst Members of Council, followed by Options 3 and 2. Options 4 and 5 have minimal support for first place. TABLE 9 TOTAL RANKED SCORE MEMBERS OF COUNCIL OPTION 5 OPTION 3 OPTION 1 OPTION 2 OPTION 4 NATURAL/ SMALL MINIMAL CHANGE 44 WARDS LARGE WARDS PHYSICAL WARDS BOUNDARIES Total score TABLE 9 presents the ranked score for each option and CHART 3 shows this information graphically. 36.
43 CHART 3 TOTAL RANKED SCORE MEMBERS OF COUNCIL When the ranked score is examined there are a few changes in preference. Option 1 is still the favoured option amongst Members of Council. However, Options 2 and 3 have switched positions and Option 2 is now in second place. Options 4 and 5 remain at the rear of the group. The next issue is how many times an option has been ranked in last place. This is shown in TABLE Option 1 Option 2 Option 3 Option 4 Option 5 37.
44 TABLE 10 FIFTH PLACE CHOICE MEMBERS OF COUNCIL OPTION 5 OPTION 3 OPTION 1 OPTION 2 OPTION 4 NATURAL/ SMALL MINIMAL CHANGE 44 WARDS LARGE WARDS PHYSICAL WARDS BOUNDARIES Times ranked fifth Ranked No Not ranked TABLE 11 FIRST & LAST CHOICE MEMBERS OF COUNCIL OPTION 5 OPTION 3 OPTION 4 OPTION 1 OPTION 2 NATURAL/ SMALL LARGE MINIMAL CHANGE 44 WARDS PHYSICAL WARDS WARDS BOUNDARIES Times ranked first Times ranked fifth or No A fifth place ranking was rare. However, if the No rankings are included, then a picture of those options least favoured or discounted all together appears. Options 3, 4 and 5 are the least favoured by an almost similar number of Councillors. Option 2 has only 2 No s and Option 1 only 4. The not ranked responses are difficult to interpret. Options 2, 3, 4 and 5 have a high number of incidents of not being ranked. Only Option 1, not ranked 8 times, is low in this regard. A comparison of first and fifth choices of Councillors is presented in TABLE 11 and shown graphically in CHART 4. The comparison of first and fifth choice that was employed in the public survey analysis cannot be directly replicated for the Councillor interviews. The reason is that very few Councillors ranked all options from first to fifth. Rather, they either left various options unranked or indicated a No to the option. If one takes the fifth ranked option and the No s as indicating a last place standing, then a rudimentary comparison between first and last choice can be constructed. 38.
45 CHART 4 FIRST & LAST CHOICE MEMBERS OF COUNCIL What can be observed from the first and last choice data is that Options 1 and 2 are viewed more positively than negatively. Option 3 draws very mixed reactions, almost an equal amount of Councillors rank it first and last. Options 4 and 5 are viewed very negatively. 8 6 Ranked First Ranked Last Option 1 Option 2 Option 3 Option 4 Option 5 39.
46 4.2 PREFERRED OPTION To determine the preferred option the two data sets derived from the public survey and Members of Council interviews have to be examined and compared. Initially, these data sets are dealt with separately to reflect the statistical nature of how they were generated. The information from the public was generated randomly based on who chose to respond to the public survey. The information from Members of Council is based on responses from 42 of the 45 Members of Council. The basic data was presented in the section above. This section analyzes and compares that information to determine which of the five options is preferred. The analysis considers two dimensions of the data, positive and negative preferences. The reasons for taking into account the positive references are obvious. It is important to know which of the five Options people prefer. The need to pay attention to negative preferences is not as apparent. However, negative preferences are critical for determining where consensus may be difficult. This analysis considers four dimensions of each data set and then compares them. The four dimensions are: First place choices Ranked scores Last place choices Comparison of first and last place choices First Place Choices An obvious starting point, as it indicates the option that was preferred by most respondents. Public survey results place the options as follows: 1. Option 3 - Small Wards Option 4 - Large Wards Option 5 - Natural/Physical Boundaries Option 1 - Minimal Change Option 2-44 Wards 81 Members of Council provide a much different ranking when expressing their first place choice. They place the options as follows: 1. Option 1 - Minimal Change Option 3 - Small Wards Option 2-44 Wards 9 4. Option 5 - Natural/Physical Boundaries 3 5. Option 4 - Large Wards 3 40.
47 There is a considerable difference between how the public judge the options and how Members of Council view the options. Generally, the public is more open to large changes in the ward structure and places the three options that reflect the most change at the top of their list. On the other hand, Members of Council gravitate towards maintaining the existing situation through either minimal change or retaining 44 wards. The area of most convergence is around Option 3 (Small Wards), which tops the public list and comes second with Members of Council. Ranked Scores The public and Members of Council were asked to rank the options in order of first to fifth choice. By assigning a numerical value to each of these choices, a ranked score was produced that allows choices other than the first to be considered and evaluated. The public surveys result in the following total ranked scores for the options: 1. Option 1 - Minimal Change Option 2-44 Wards Option 5 - Natural/Physical Boundaries Option 3 - Small Wards Option 4 - Large Wards 1865 Interviews with Members of Council result in the following total ranked scores for the options: 1. Option 1 - Minimal Change Option 2-44 Wards Option 3 - Small Wards Option 5 - Natural/Physical Boundaries Option 4 (Large Wards) 25 Based on the ranked score there is considerable concurrence between the public and Members of Council. Both rank Option 1 and Option 2 as the top two options. Both rank Option 4 in last place. There is a slight difference in how Options 3 and 5 are ranked, trading 3 rd and 4 th place between the two data sets. Last Place Choices The public ranking for last place is: 1. Option 4 - Large Wards Option 3 - Small Wards Option 5 - Natural/Physical Boundaries Option 1 - Minimal Change) Option 2-44 Wards
48 The last place ranking for Members of Council is: 1. Option 4 - Large Wards Option 5 - Natural/Physical Boundaries Option 3 - Small Wards Option 2-44 Wards Option 1- Minimal Change 12 This data set indicates which options are the least preferred. As with the ranked scores, there is considerable convergence between the views of the public and Members of Council. Options 3, 4, and 5 are the least favoured options by both groups. Options 1 and 2 have the fewest last place choices in both groups. Comparison of First and Last Place Choices This comparative data set is best shown as a chart, both for the public survey results and for the results from interviews with Members of Council. 42.
49 CHART 5 COMPARISON FIRST & LAST PLACE CHOICES PUBLIC SURVEY First Ranked ranked First option Last Ranked ranked Last option 50 0 Option 1 Option 2 Option 3 Option 4 Option 5 CHART 6 COMPARISON FIRST & LAST PLACE CHOICES MEMBERS OF COUNCIL A key observation from comparing these two Charts revolves around Option 3 (Small Wards). In both the responses from the public survey and Members of Council interviews, there is a high degree of first and last choices for this option. In some respects, Option 3 is the love it or hate it option. It would be the option that would be the most difficult to form a consensus around, because of the strong positive and negative reactions to it Ranked First Ranked Last 2 0 Option 1 Option 2 Option 3 Option 4 Option 5 43.
50 Conclusions Preferred Option The results of the public survey and Members of Council interviews give clear preference to Option 1 in three of the four ways the data has been examined. The only divergence from this perspective is in the first place choices, with the public preferring Option 3 (Small Wards) and Members of Council preferring Option 1 (Minimal Change). However, when ranked scores are applied, Option 1 is the favoured option by both groups. Also, as the comparison of first and last place choices indicates, Option 3 would be the most difficult option to form a consensus around. Based on an assessment of all these factors, Option 1 (Minimal Change) is the preferred option and the option that provides the starting point for the recommended new ward structure for the City of Toronto. Based on an assessment of all these factors, Option 1 (Minimal Change) is the preferred option and the option that provides the starting point for the recommended new ward structure for the City of Toronto. 4.3 REFINEMENTS The Minimal Change option, Option 1, is the preferred option and forms the basis for the new ward structure for Toronto recommended in this report. However, it is only the basis and not the final recommended ward structure. During the Round Two civic engagement and public consultation process both the public and Members of Council were asked for refinements to the options. The purpose of these refinements was to improve the options with regard to communities of interest, ward history and more coherent ward boundaries. The refinements suggested by Members of Council and the general public through the online survey, submissions and at public meetings have been integrated by option, ward and community of interest (see Appendices C & D of the Round Two report). Some of the refinements have been put forward more than once, which indicates a particular interest in an issue, and, as can be expected, some contradict each other. Since Option 1 was the preferred option, all the refinements suggested for that option have been explored. Refinements suggested for other options have also been examined, if they are relevant to Option
51 In addition, numerous suggested refinements relate to the boundaries of existing wards and communities of interest. Again, those refinements relevant to Option 1 have been analyzed. It has not been possible to accommodate refinements, which have recommended no change to the existing ward boundaries in areas where the 2026 ward populations will be well below the average ward population of 61,000. As well, it has not been possible to keep most Business Improvement Areas in one ward, since BIAs almost always include both sides of arterial roads, which are recognizable ward boundaries. Within these groupings suggested refinements to Option 1 wards have been assessed to determine whether they maintain effective representation, that is improve or upset voter parity, achieve more coherent ward boundaries and/or keep communities of interest together. There are over 125 relevant refinements. These refinements as well as the action by the TWBR team are included as APPENDIX C to this report. By definition, the suggested refinements alter the Minimal Change option. Incorporating certain suggested refinements changes more of the current ward boundaries than occurs in Option 1, as boundary changes in one area cascade into adjacent wards. To determine whether suggested refinements are feasible, Option 1 wards were grouped based on natural/physical boundaries, e.g. west of the Humber River, north and south of the 401, downtown and east of Victoria Park. In particular, the boundaries of the downtown wards have been adjusted to coincide with the Official Plan boundaries for the Downtown. Both members of the general public and Members of Council strongly suggested that downtown wards should be inside the Downtown. 45.
52 SECTION FIVE RECOMMENDATION FOR NEW WARDS FOR TORONTO TORONTO WARD BOUNDARY REVIEW / NEW WARDS FOR TORONTO / FINAL REPORT T O R O N T O W A R D B O U N D A R Y THE DRAW LINES R E V I E W
53 5.1 A NEW WARD STRUCTURE The recommended new ward structure is centered on three components. The first bases the new wards on Option 1, the preferred ward option from the Round Two Civic Engagement and Public Consultation process. The second incorporates the suggested refinements to Option 1 that are feasible and relevant to that option. And finally, the recommended ward structure meets the tests of effective representation. The following map shows the recommended new ward structure for Toronto. The wards in the recommended new ward structure are labeled RW for Recommended Ward. The ward numbering system follows the current numbering system that starts in the northwest corner of the city. 46.
54 RECOMMENDED WARDS 47.
55 Although the base for the recommended ward structure is Option 1, the relevant refinements are quite numerous with the result that the boundaries of 6 of the recommended wards are the same as those of the current wards. (In Option 1, 18 wards have the same boundaries as the current wards). The recommended new ward structure results in 47 wards, the same as in Option 1. Option 1 meets the criteria for effective representation. Therefore, the changes brought about by the suggested refinements have been analyzed in terms of how they affect effective representation. The recommended ward structure maintains the following principles underlying Option 1: The following Table demonstrates how the recommended ward structure achieves voter parity, an essential component of effective representation. The Table Recommended Wards Projected Population and Variance, presents this information for the four election years from 2018 to The variance figures are based on the target ward population size of 61,000. The year 2026 is highlighted, as that is the year that is used to determine voter parity. The Table covers the period 2018, the year of implementation, to 2030, the end of the time frame of the TWBR. After 2030 it may be time for another review of Toronto s ward boundaries. Average ward population - 61,000 Ward population range 51,850 70,150 (plus or minus 15% of the average) 47 wards Target year Most of the suggested refinements focus on two issues, keeping communities of interests or neighbourhoods together in the same ward and/or suggesting more appropriate ward boundaries. 48.
56 RECOMMENDED WARDS - PROJECTED POPULATION AND VARIANCE RECOMMENDED WARD 2018 VARIANCE 2022 VARIANCE 2026 VARIANCE 2030 VARIANCE RW 1 60, % 59, % 60, % 60, % RW 2 59, % 59, % 59, % 60, % RW 3 62, % 63, % 65, % 66, % RW 4 63, % 64, % 65, % 66, % RW 5 58, % 62, % 70, % 77, % RW 6 65, % 67, % 69, % 71, % RW 7 55, % 55, % 57, % 58, % RW 8 48, % 49, % 54, % 57, % RW 9 54, % 55, % 56, % 58, % RW 10 64, % 64, % 66, % 67, % RW 11 61, % 61, % 64, % 66, % RW 12 52, % 53, % 54, % 55, % RW 13 58, % 59, % 62, % 65, % RW 14 58, % 59, % 60, % 60, % RW 15 69, % 69, % 70, % 70, % RW 16 65, % 65, % 66, % 66, % RW 17 64, % 66, % 66, % 67, % RW 18 65, % 66, % 67, % 68, % RW 19 64, % 65, % 66, % 67, % RW 20 38, % 45, % 51, % 53, % RW 21 47, % 58, % 63, % 68, % RW 22 47, % 54, % 60, % 65, % RW 23 55, % 60, % 61, % 64, % RW 24 47, % 50, % 55, % 60, % RW 25 47, % 54, % 60, % 63, % RW 26 53, % 57, % 58, % 59, % 49.
57 RECOMMENDED WARD 2018 VARIANCE 2022 VARIANCE 2026 VARIANCE 2030 VARIANCE RW 27 64, % 66, % 66, % 67, % RW 28 57, % 58, % 59, % 61, % RW 29 59, % 60, % 62, % 65, % RW 30 53, % 54, % 55, % 56, % RW 31 60, % 61, % 62, % 63, % RW 32 68, % 69, % 69, % 69, % RW 33 55, % 56, % 56, % 57, % RW 34 55, % 55, % 55, % 55, % RW 35 66, % 67, % 67, % 68, % RW 36 57, % 58, % 58, % 58, % RW 37 53, % 53, % 54, % 54, % RW 38 63, % 64, % 67, % 70, % RW 39 61, % 62, % 64, % 66, % RW 40 65, % 66, % 68, % 71, % RW 41 67, % 68, % 70, % 73, % RW 42 63, % 65, % 66, % 68, % RW 43 68, % 67, % 67, % 67, % RW 44 66, % 66, % 66, % 66, % RW 45 64, % 64, % 64, % 64, % RW 46 58, % 59, % 60, % 62, % RW 47 50, % 51, % 51, % 52, % 50.
58 5.2 EFFECTIVE REPRESENTATION Voter Parity The range established for voter parity in Option 1 was 15% above or below the target average ward population of 61,000. As noted, this allows for ward population sizes to range from 51,850 to 70,150, which becomes the acceptable voter parity range. Forty-four of the 47 wards in the recommended new ward structure fall within this range. Two wards have a variance above 15% and one ward has a variance of below 15%. Looking at voter parity in more detail the following pattern emerges. VARIANCES NUMBER OF WARDS RECOMMENDED WARDS INCLUDED +/- 15% of average 44 1, 2, 3, 4, 5, 6, 7, 8, 9, 10, 11, 12, 13, 14, 16, 17, 18, 19, 21, 22, 23, 24, 25, 26, 27, 28, 29, 30, 31, 32, 33, 34, 35, 36, 37, 38, 39, 40, 42, 43, 44, 45, 46 and 47 Below 15% of average 1 20 Recommended Ward 20 is 15.82% below the targeted ward population of 61,000. This is one of the fastest growing recommended wards. In total, 6 wards grow by more than 10,000 during the period 2018 to These are wards: RW5 (18,968), RW20 (14,977), RW21 (21,760), RW22 (18,480), RW24 (13,336) and RW25 (15,896). RW20 has the fastest growth rate and by 2030 is within the 15% variance range. Except for RW5 all these high growth wards are in the Downtown where the Official Plan s policies allocate much of Toronto s growth. The range established for voter parity in Option 1 was 15% above or below the target average ward population of 61,000. Recommended Wards 15 and 41 are slightly above the 15% threshold at 15.27% and 15.26% respectively. RW15 is a relatively stable ward and is expected to grow by slightly over 1,000 people between 2018 and RW41 is just over 15% in 2026 (15.26%), but is a growing ward and will be over 21% above average in It is one of the wards, along with Recommended Wards 5, 6 and 40 that may lead to a ward boundary review following the 2030 election. Over 15% of average 2 15 &
59 Attempts were made to reduce RW41 s population, but RW40 s population is also high and RW41 s boundaries on its other three sides are quite distinctive. Reducing RW41 s population would have required moving ward boundaries onto residential side streets. Ward History Option 1 s goal is Minimal Change, which respects, to some extent, ward history. There are two components to Minimal Change. The first is retaining the current average ward population size of 61,000. The other is minimizing the change in ward boundaries. The recommended ward boundaries maintain the 61,000 average ward population as the base for calculating voter parity. Option 1 retains the existing boundaries of 18 wards. The recommended ward structure retains only 6. These are: Existing Ward 1 = RW 1 Existing Ward 2 = RW 2 Existing Ward 6 = RW 6 Existing Ward 10 = RW 10 Existing Ward 11 = RW 11 Existing Ward 35 = RW 39 The change of so many of the current ward boundaries from Option 1 is due to refinements suggested by the public and Members of Council during the Round Two consultation process. Many of the suggested refinements aim to improve existing ward boundaries, often to include various communities of interest. Population Growth Toronto is growing at a rapid rate. The TWBR anticipates an additional 500,000 people over the project s time frame of This projected growth has been incorporated into the recommended ward configuration. As noted previously, the year 2026 has been used as the target year. This allows City Council to consider a recommended ward structure that will last for 4 elections, up to The projected growth of the recommended wards is shown in the Table Recommended Wards - Projected Population and Variance , above. Geographic Communities of Interest A great effort has been made to keep geographic communities of interest together. It has not always been possible. Some communities of interest are too large to fit into a single ward and in some cases keeping communities of interest in one area splits communities in other areas or disrupts voter parity significantly. 52.
60 One example that has been tested repeatedly is the Regent Park community. The recommended ward structure uses Dundas Street as a boundary between RW21 and RW23. This separates Regent Park North and Regent Park South. A boundary configuration that keeps them together has a significant impact on voter parity. Keeping all of Regent Park in RW23 produces a variance in that ward of % and a variance in RW21 of %. Boundary adjustments in other parts of RW23 have been considered but result in dividing other communities. This part of Toronto is very dense and boundary changes of even a few blocks can have a significant impact on voter parity. Natural/Physical Boundaries The recommended ward structure attempts to use recognizable major natural and physical boundaries. Often this supports ward history. Some of the major boundaries used in the recommended ward structure are: 5.3 WHERE ARE THE CHANGES As outlined above, the recommended ward structure for Toronto increases the total number of wards to 47 from 44. This increase re-balances the existing ward population discrepancies by enlarging the populations of small wards and decreasing the populations of large wards. It also accommodates the projected population growth to This is accomplished by adding three wards, while maintaining the current average ward population size of approximately 61,000. Where are the new wards? This seems like a straightforward question but the answer is more complex. Of the 44 existing wards, 38 experience some changes in their boundaries. Only 6 existing wards retain their exact current boundaries. These are the current wards 1, 2, 6, 10, 11 and 35. Therefore, the recommended ward structure for Toronto creates, in fact, 38 new wards. The Downtown as defined by the Official Plan Highway 401, a major physical boundary The Humber River, a major natural boundary and the current ward boundary for the Etobicoke wards Eglinton Avenue across much of mid-town Victoria Park Avenue, a major artery and the current ward boundary for the Scarborough wards To demonstrate where the additional wards are located, it is helpful to examine seven major geographic areas of the city and compare the number of current wards with the number of recommended wards. The map on the following page illustrates this comparison. Comments describe the changes in more detail. 53.

61 WHERE ARE THE CHANGES 54.
62 DESCRIPTION CURRENT WARDS RECOMMENDED WARDS COMMENTS Area 1: West of the Humber River 1, 2, 3, 4, 5 & 6 RW1, RW2, RW3, RW4, RW5 & RW6 This area has the same number of wards at 6. Current Wards 1, 2, & 6 do not change. Wards 3, 4 & 5 are changed to accommodate current and projected growth in Ward 5. Area 2: East of Victoria Park Ave. 35, 36, 37, 38, 39, 40, 41, 42, 43 & 44 RW38, RW39, RW40, RW41, RW42, RW43, RW44, RW45, RW46 & RW47 This area has the same number of wards at 10. Current Ward 35 remains the same and becomes RW 39. All other wards are adjusted to balance populations, use Hwy. 401 as a natural boundary and reflect suggested refinements. Area 3: North of Hwy. 401 from the Humber River east to Victoria Park Ave. 7, 8, 9, 10, 23, 24 & 33 RW7, RW8, RW9, RW10, RW28, RW29, RW30 & RW31 This area has one additional ward at 8. Current Ward 10 remains the same. Current Wards 7, 8 & 9 are adjusted to balance populations and reflect suggested refinements. One ward is added between Bathurst St. and the Don Valley Parkway to accommodate both current and projected growth. Area 4: Downtown, as defined in the Official Plan, generally, Bathurst St. to the Don Valley Parkway, south to Lake Ontario and north to Rosedale Valley Road and the railroad tracks All of 28, most of 20 & 27. RW20, RW21, RW22, RW23, RW24 & RW25 The Downtown has three additional wards at 6. The 3 wards are added to accommodate both current and projected growth. 55.
63 DESCRIPTION CURRENT WARDS RECOMMENDED WARDS COMMENTS Area 5: South of Hwy. 401, generally to Eglinton Ave. and from Victoria Park Ave. west to the Humber River 11, most of 12, 15, 16, most of 25 & 34 RW11, RW12, RW13, RW14, RW27 & RW32 This area has the same number of wards at 6. Current Ward 11 stays the same. Other wards are adjusted to balance populations, generally use Eglinton Ave. as a boundary and incorporate suggested refinements. Area 6: East of Downtown to Victoria Park Ave. and generally south of Eglinton Ave. 29, 30, 31, 32, most of 26 RW33, RW34, RW35, RW36 & RW37 This area has the same number of wards at 5. All current ward boundaries experience some change to balance populations and incorporate suggested refinements. Area 7: West of Downtown to the Humber River and generally south of Eglinton Ave. 13, 14, 18, parts of 17, 19, 21 & 22 RW15, RW16, RW17, RW18, RW19 & RW26 This area has one less ward at 6. All current ward boundaries are adjusted to reflect the use of Eglinton Ave. as a general boundary, balance populations given the three current small wards (Wards 13, 14 & 21) and incorporate suggested refinements. In summary the additional wards can be attributed to three areas of the city. 1. One addition ward north of Hwy. 401 between Bathurst St. and Victoria Park Ave. 2. Three additional wards in the Downtown area. 3. One less ward in the area west of the Downtown and south of Eglinton Ave. All other areas retain the same number of wards they currently have, although most of their ward boundaries have been adjusted in some way to balance ward populations, reflect a set of coherent boundaries and incorporate suggested refinements. As noted, only 6 of the recommended wards are the same as the current wards. This is a reflection of the cascading effect as ward populations are balanced and as many geographic communities of interest as possible are respected. 56.
64 SECTION SIX CONCLUSION & NEXT STEPS TORONTO WARD BOUNDARY REVIEW / NEW WARDS FOR TORONTO / FINAL REPORT T O R O N T O W A R D B O U N D A R Y THE DRAW LINES R E V I E W

65 The recommended new wards for the City of Toronto are shown on the map entitled Recommended Wards contained within the report and attached in a larger format as APPENDIX E to this report. Creating a new ward structure that achieves effective representation for a city as complex as the City of Toronto, and with Toronto s growth rate, requires an appropriate balance among the components of effective representation and the input received during the TWBR s two rounds of civic engagement and public consultation. Different points-of-view often exert a pull in conflicting directions. The TWBR has accomplished an appropriate balance by recommending a ward structure that achieves effective representation while incorporating many of the suggestions from the public, stakeholders and Members of Council. To implement the new ward structure in time for the 2018 municipal election, the following timeline is anticipated: Discussion of TWBR Final Report by the City of Toronto Executive Committee (May 2016) Discussion of the TWBR Final Report by Toronto City Council (Summer/Fall 2016) City Council decision on New Wards for Toronto (by the end of 2016) Potential OMB Hearing (January June 2017) Implementation of a new ward structure for Toronto (by the end of 2017) Adherence to this timeline is critical. Based on experience from other ward boundary reviews, and the fact that Toronto s ward system has been appealed in the past, an OMB hearing on a new ward structure is probable. There needs to be sufficient time in 2017 to resolve such a hearing, should it occur. 57.
66 TORONTO WARD BOUNDARY REVIEW NEW WARDS FOR TORONTO FINAL REPORT ACKNOWLEDGEMENTS The Toronto Ward Boundary Review (TWBR) began in June 2014 and will end with the presentation of this report to the City of Toronto Executive Committee in May 2016 and City Council thereafter. Funding for this project was provided by the City of Toronto. The TWBR team appreciates the many individuals and organizations who participated in and provided input to this project. This includes: Members of Council, School Board representatives, neighbourhood associations, other stakeholder groups and members of the public. All of your contributions have helped make our final recommendation for new wards for Toronto possible. Thank you. We would also like to give recognition to the TWBR Advisory Panel for contributing their time and collective expertise: Fred Dean, Municipal Lawyer; Beverley Don, Vice President and Director, Toronto Association of Business Improvement Areas (TABIA) and Proprietor, Ardith One Canadian Pottery and Crafts; Don Granger, former member and vice chair of the Ontario Municipal Board ( ), Regional Councillor, Hamilton-Wentworth ( ), Mayor, Flamborough, Ontario ( ); Dr. Patricia O Campo, Director, Centre for Research on Inner City Health and Professor, Dalla Lana School of Public Health Sciences, University of Toronto; and Dr. Myer Siemiatycki, Professor, Department of Politics and Public Administration, Ryerson University. The TWBR Team is a partnership among: Beate Bowron Etcetera: Beate Bowron FCIP, RPP; Canadian Urban Institute: Ariana Cancelli, Lisa Cavicchia, Shannon Clark, Jonathan Critchley, Jeff Evenson, Glenn Miller, Robyn Visheau; The Davidson Group: Gary Davidson FCIP, RPP; and Thomas Ostler MCIP, RPP. 58.
67 TORONTO WARD BOUNDARY REVIEW DRAWTHELINES.CA T O R O N T O W A R D B O U N D A R Y THE DRAW LINES R E V I E W
68 APPENDIX A MAP OF CURRENT WARDS TORONTO WARD BOUNDARY REVIEW / NEW WARDS FOR TORONTO / FINAL REPORT T O R O N T O W A R D B O U N D A R Y THE DRAW LINES R E V I E W

69 Appendix A Map of Current Wards
70 APPENDIX B MAPS OF THE 5 OPTIONS TORONTO WARD BOUNDARY REVIEW / NEW WARDS FOR TORONTO / FINAL REPORT T O R O N T O W A R D B O U N D A R Y THE DRAW LINES R E V I E W

71 Appendix B Maps of the 5 Options
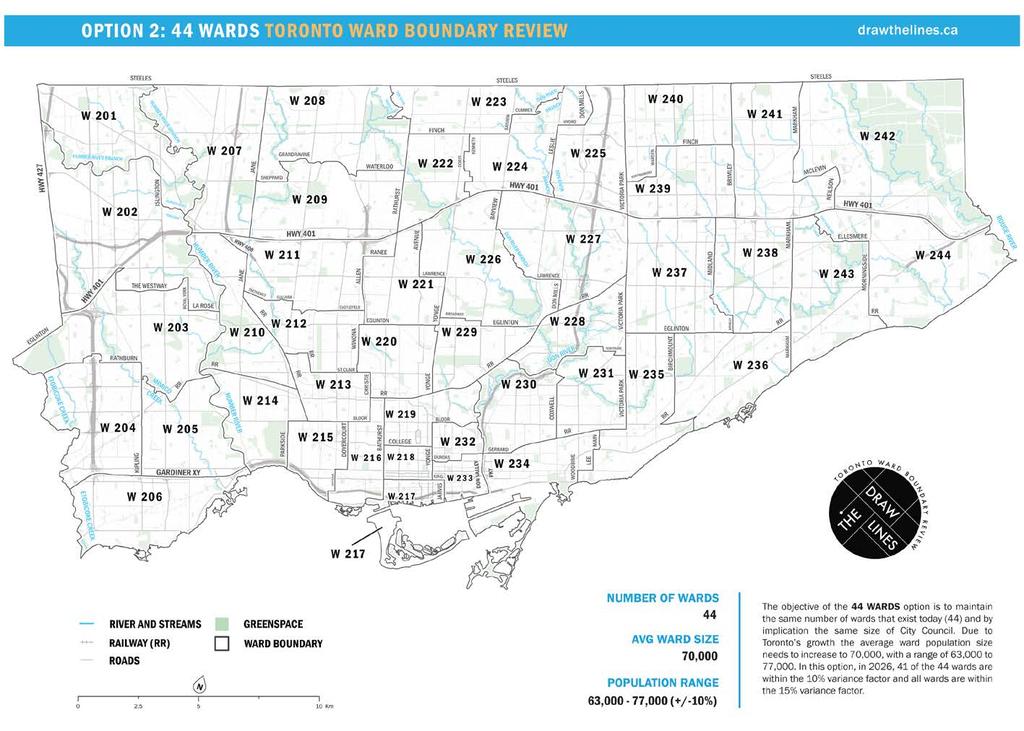
72
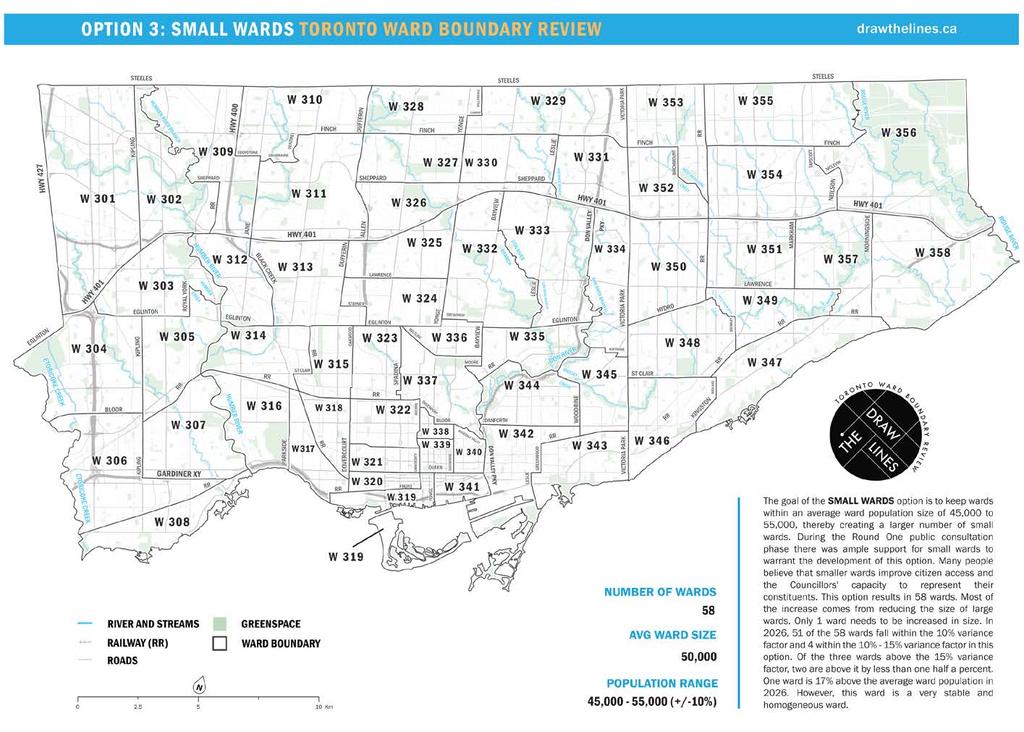
73
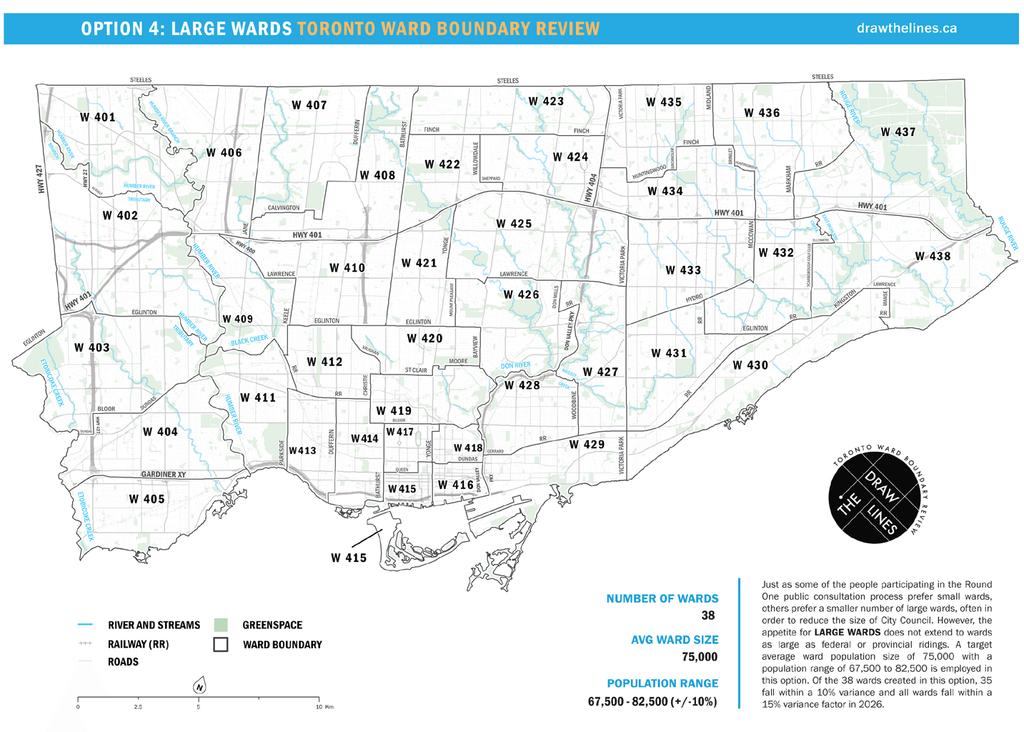
74
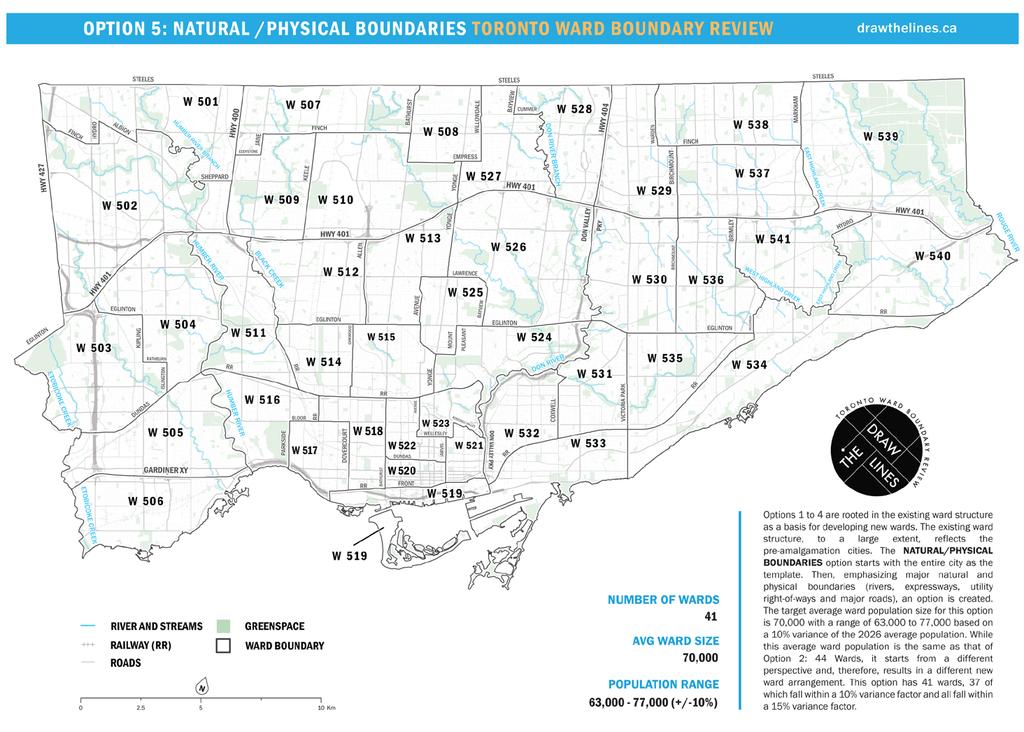
75
76 APPENDIX C WARD-SPECIFIC REFINEMENTS TORONTO WARD BOUNDARY REVIEW / NEW WARDS FOR TORONTO / FINAL REPORT T O R O N T O W A R D B O U N D A R Y THE DRAW LINES R E V I E W
77 Appendix C Ward-Specific Refinements Note: W followed by a number refers to the relevant Ward in Option 1 Minimal Change. RW followed by a number refers to the relevant Recommended Ward (See APPENDIX E). WARD SUGGESTED REFINEMENT ACTION/COMMENT W101 Add Humberwood area to Rexdale (don't use river). Not incorporated, upsets voter parity in RW2. W102 No suggested refinements. W103 Kipling should be eastern boundary (not Martin Grove). Add area between Kipling and Martin Grove. Incorporated, partially at south end. W103/W105 Move area north of Dundas along Bloor to 427 into W105. Incorporated. W104 Use Mimico Creek as western boundary; add area west of Martin Grove. W104/105 W105 should be amalgamated with the south end of W104 due to all the development issues occurring within the Dundas/Royal York area. Not incorporated, upsets voter parity in RW3. Not incorporated, should keep Etobicoke Centre development together. To keep growth area around Dundas together, move area north of Bloor to Mimico Creek east of Kipling into W105. W105 Move area south of Bloor north of Dundas between #427 and Kipling to W105. W106 The current Ward 6 should be divided north to south, not east to west as proposed. W107/W108 Firgrove industrial area is split at Eddystone; use Finch instead [shift area north of Eddystone Jane/Finch/400] to W107 from W108]. (2) Incorporated. Incorporated. Not incorporated, upsets voter parity. Resulting wards too small. Not incorporated, upsets voter parity between RW7 and RW8.
78 WARD SUGGESTED REFINEMENT ACTION/COMMENT W107/W109 Area just north of the 401 east of Jane is the same as west of Jane; add area to W107. W108/W109 Divides Dufferin/Finch BIA in half (now Duke Heights BIA). Not incorporated, upsets voter parity between RW7 and RW8. Not a coherent boundary. Incorporated. BIA all in RW9. Make Grandravine Drive the southern boundary between W108 and W109 and extend east to Dufferin. Not incorporated. Affects voter parity in RW9. Sentinel is not a good boundary, use Keele Street south to Grandravine. Not incorporated. University Heights community is too big. Don t use Grandravine, instead go up Jane to Finch and then east to include complete Jane-Finch community. Not incorporated, upsets voter parity. Instead of a horizontal boundary between W108 and W109 along Sheppard/ Grandravine/Waterloo, use the rail line that is between Keele St. and Allen Road. The communities to the east vs. west of this boundary are different. Not incorporated, makes RW9 too small. W109 Can RR track be the eastern boundary of W109 instead of Allen? Not incorporated, upsets voter parity. Makes RW9 too small. Keep Yorkwoods community together. Incorporated. In RW8.
79 WARD SUGGESTED REFINEMENT ACTION/COMMENT Use De Boer s as boundary in north-east corner of re-arranged W109. W110 No suggested refinements. W111 Add area east of Jane to Black Creek. Not incorporated, not a coherent boundary. Not incorporated, upsets voter parity between RW11 and RW12. The old Junction main street along Dundas West should be kept intact, so keep the tip up to Dupont in Ward 111. Incorporated, now in RW17. Keep the West Toronto Junction whole, it is currently split between Wards 13 and 14. W112/W113 Use Rogers Road as southern boundary of W112 and W113, Eglinton is a community between Rogers and the Beltline. W113 Add the area north of Eglinton (currently in W115) to W113. Incorporated, now in RW17. Incorporated for RW12. Not incorporated for RW13, upsets voter parity between RW13 and RW16. Incorporated. New ward alignment for W113 should be 401/Allen Road/Ravine/Rogers Road; area east of the Allen should go to W114. Not incorporated, upsets voter parity between RW13 and RW14. Winona as boundary for W113 splits a community; use Rogers Road and ravine instead. Not incorporated, upsets voter parity between RW13 and RW15. Oakwood should be eastern boundary of W113 instead of Winona; community east of Oakwood is different. (3) Incorporated.
80 WARD SUGGESTED REFINEMENT ACTION/COMMENT W113/W114/ W115 Boundary between W113, W115 and W114 should be the Allen Road; there are two distinct neighbourhoods on either side; Census takers do not cross the Allen (Lawrence Height community does, but better represented by two Councillors). W113/115 Keep boundary of W113/115 east at Winona to keep Oakwood Village community and Friends of Roseneath in the same ward. W113/W115/ W116 W114/W115/ W126 Change the boundary between W113, W115 and W116 to Eglinton. Keep W113 s and W115 s traditional boundary - both cross Eglinton. The Beltline is not a very good divider for W114, W115 and W126; instead go to Bathurst and down to Eglinton, s/w corner does not have that many people. W115/W116 Keep the Davenport neighbourhood (north of the Dupont rail corridor) as a single ward it s a distinct community of interest. Make Eglinton the northern boundary. W116 Use Rogers Road at north end instead of Lavender. Use western RR track (UPE tracks) as western boundary instead of Parkside; community west of the tracks relates more to High Park; also there is only one connection across those tracks - Wallace Avenue bridge. Run eastern boundary south on Dufferin, if populations numbers work. Not incorporated, upsets voter parity between RW13 and RW14. Allen Road all in RW13. Not incorporated, Winona is a small residential street, not a coherent boundary. Incorporated. Not incorporated, Eglinton is a coherent boundary. Incorporated (Oriole Parkway/Avenue Road). Incorporated. Incorporated. Incorporated. Incorporated. Not incorporated, upsets voter parity for RW16. W116/W118 Junction Triangle community split between W116 and W118. Not incorporated, Bloor Street is a more coherent boundary between RW16 and RW18.
81 WARD SUGGESTED REFINEMENT ACTION/COMMENT W117/W118 Area west of the UPE RR tracks north of Bloor should be in either W117 or W118; does not have anything in common with Junction Triangle; no east west connections except Wallace footbridge. W119 Change the north boundary of W119 to Bloor Street West. Liberty Village should fall in one ward. (2) [Dufferin/King/Strachan/RR tracks]. Liberty Village and Exhibition Place should be contained within one ward. W119/120 Harbourfront east of Bathurst and west of Bathurst are two completely different neighbourhoods and should not be combined into a single ward. Incorporated. In RW17. Not incorporated, upsets voter parity in RW19. Incorporated. All in RW19. Incorporated. In RW19. Boundary between RW19 and RW20 is Bathurst except for Bathurst Quay. W119/W125 Could W119 boundary with W125 run north on Bathurst? (2) Incorporated. W120 Keep CityPlace, Fort York and South Core together with the condos Boundary between RW19 south of King. and RW20 is Bathurst except for Bathurst Quay. W120/W121 Keep all the following boundaries: King Street west to the Islands north- south and Yonge Street to Bathurst east-west. There are many commonalities within that neighborhood. If need be, split the ward from Front Street going south. W121 Make Yonge Street the western boundary of W121. The community west of Yonge belongs more appropriately with W120. The boundary for St. Lawrence should be Yonge to Parliament, Queen and Railway. W121/W122/ W123 Queen Street is an undesirable dividing line; it separates a connected and resilient business community. Shuter Street might make a better boundary. Not incorporated, recommended wards now run north-south. Incorporated. All in RW 21. Both sides of Queen in RW22 and RW21. Queen
82 WARD SUGGESTED REFINEMENT ACTION/COMMENT W122/W123 4 Moss Park Apartment towers get orphaned in W122, should be in W123 together with Regent Park. W122/W124 Split W122 and W124 north-south, rather than east-west (split along University or Bay). Queens Park should be a dividing line as it is both a physical and social regime boundary. Harbord Village and Kensington have distinct issues and should not be contained within the same ward. (2) W123 Castle Frank Crescent very cut off by DVP; feel like they are part of South Rosedale; don't connect with Parliament. Church-Wellesley village s northern boundary is Charles Street, not Wellesley. W123/W124 Jarvis St. (between W123 and W124) splits a community of LGBT residents from the Church-Wellesley Village. Sherbourne or Yonge St. would be a better boundary. W123/125 The boundary between W123 and W125 should be Rosedale Valley Road/the ravine instead of Bloor St. You could take Rosedale Valley Road east of Sherbourne. Rosedale and Summerhill similar communities. W124 Should include area up Yonge Street to the tracks (ABC Residents Association; Yorkville). Don t split the U of T campus - there are 2 colleges (St. Michael s and Victoria College) east of Queens Park, which are cohesive communities. W124/W125 The boundaries of the downtown wards are not good - there is an issue with W124 and W125 at Bloor Street. Street divides RW20 and RW24. Moss Park now together with Regent Park South in RW21. Incorporated. Incorporated. Both in RW24, together with many other communities. Incorporated. Now in RW34. Incorporated. All in RW25 now. Church is now the boundary between RW25 and RW23. Incorporated. Incorporated. Incorporated. Boundary between RW24 and RW25 is Queens Park. Incorporated. Downtown wards re-aligned.
83 WARD SUGGESTED REFINEMENT ACTION/COMMENT Yorkville BIA should not be split at Bloor Street, its southern boundary is Charles. Keep Bloor East intact - Move 278, 300, 360 & 388 Bloor Street East away from University-Rosedale into Toronto-Centre. W125 W125 has a long east-west shape it doesn t accomplish minimum change. (3) The Castle Frank enclave south of Bloor should be in W125. Any new boundary for the current Ward 27 should include Wellesley from Yonge to Sherbourne, even Parliament as well as north-south streets Church and Jarvis down to at least Dundas. W125 should include Governor's Bridge, which is part of North Rosedale's community of interest. (2) W126 Extend W126 south so that Redway Road and the big Loblaws is the southern border. Put the whole of Yonge-Eglinton into W126. Boundary goes through Upper Canada College; use Oriole Parkway all the way up, then along Oxton to the Beltline; Beltline makes sense; should stop at Oriole Parkway. W126/127 Broadway boundary now cuts through houses. Broadway boundary should be at Eglinton. North and south of Erskine Avenue are two different types of neighbourhoods would be a good boundary line. W128 Should go east to Willowdale; Willowdale is a very good boundary; very different community east and west of Willowdale; Doris is not good; Parkview Gardens and Lee's Life and Art Park cannot be separated from Yonge; when walking, you do not cross Willowdale. Incorporated. Now in RW25. Incorporated. In RW25. Downtown wards now run north-south. Now in RW34. Downtown wards now run north-south. Incorporated. Now in RW34. Incorporated. Not incorporated, boundaries not coherent. Incorporated. Boundary follows Avenue Road in order not to upset voter parity in RW26. Incorporated. Eglinton is now the boundary between RW27 and RW26. Not incorporated. Not a coherent boundary. Incorporated.
84 WARD SUGGESTED REFINEMENT ACTION/COMMENT Suggested boundaries: Bathurst/West Don River/401/Yonge to Incorporated. Sheppard/north on Willowdale/Finch. W128/W129 The boundary should be a straight line, instead of a jagged line. (4) o Using Willowdale or Kenneth would keep the condo neighbourhood together. o Consider using Yonge Street. o The hydro corridor is a great natural/physical boundary. o The jagged line separates the condos from single family homes. Change the boundary between W128 and W129 to Doris or Willowdale. W129 Could gain the n/e corner of Yonge and 401 (Avondale community); this is the best way to split W128 and W129. Suggested boundaries: Finch/Victoria Park/Steeles/ boundary of current Ward 10. [includes northern part of W130]. W130 Suggested boundaries: 401/Yonge to Sheppard/north on Willowdale/Finch/East Don River. [includes part of W131]. W131 Use RR track as western boundary of W131. Suggested boundaries: 401/East Don River/Finch/Victoria Park. W132 Move Wynford Park area into W132 (Don Mills Residents Association includes it). Make the continuation of Eglinton west of Victoria Park the southern boundary of W132, i.e. move area south of it into W135. W132/W133/ W135 Incorporated. Willowdale is the boundary between RW28 and RW29 to Sheppard. Incorporated. Willowdale is the boundary between RW28 and RW29 to Sheppard. Incorporated. Not incorporated, upsets voter parity. Large geographic area. Not incorporated, upsets voter parity. Incorporated. Almost the same as RW31. Incorporated. Incorporated. Use DVP as a boundary among W132, W133 and part of W135. Incorporated.
85 WARD SUGGESTED REFINEMENT ACTION/COMMENT W133/134 The Leaside neighbourhood is divided by Eglinton, which is not a natural boundary. Leaside should remain intact. (11) Leaside is bounded on 3 sides by the Don River and on the 4th by Bayview Avenue. Decrease W134 by making RR track the northern boundary; move area north of RR tracks into W133 -this keeps north and south Leaside together. Change the W133 and W134 boundary to original boundary or to another option that doesn't affect the Laird community. All of Leaside is included in RW33. Keep Bennington Heights and Leaside neighbourhoods together they are similar. Incorporated. Leaside and Thorncliffe Park need to stay together. Leaside, Flemington Park, Thorncliffe Park neighbourhoods should be kept together. Incorporated. Both in RW33. Incorporated. All in RW33. Consider splitting Leaside and Thorncliffe Park communities they have very different interests, which splits a Councillor's focus. Join Flemington Park and Thorncliffe; these two areas have many issues that would benefit from a smaller ward and personalized treatment. Not incorporated, both in RW33. Incorporated. Both in RW33, but together with Leaside. The Don Valley would be a more reasonable northern boundary of W134. Not incorporated, upsets voter parity. W134 Increase W134 by extending eastern boundary to Woodbine. Not incorporated, upsets voter parity between RW34 and RW35.
86 WARD SUGGESTED REFINEMENT ACTION/COMMENT W134/W135 Parking lot in Taylor Creek Park is cut in half, should be in W135, not in W134; boundary also cuts the park in two. Include Barbara Crescent (from W134) in W135. W134/W136 Don t combine north of Danforth with areas south of Danforth - at least east of Pape. We're just south of Danforth east of Coxwell and much, much more oriented to Gerrard, Queen and the lake than northward to the Don Valley and Eglinton. The current Danforth boundary cuts the Danforth community in half (4) -The Danforth is the community hub for Greektown, for the Mosaic, and others. W135 Use DVP as boundary rather than the river; W135 should have south side of the Don Valley (from W133). W134/W135/ W136/W137 The railroad track is a good physical barrier and would put Danforth in 2 wards not 4 wards. Include north and south side of Danforth Ave in one ward to encourage rational development. Do not split Danforth Avenue between Greenwood and Main (more or less). This area has a similar architectural feel as well as a need/desire by the BIA and neighbourhood associations to study, renovate and re-invigorate. W136/W137 Leslieville should not be split - Coxwell should be the boundary. Move the western boundary of W137 to Coxwell, so that Leslieville and the Beaches are not in the same ward. W137 Don t include Beach community as part of Danforth; they have different needs. Incorporated. Incorporated. Incorporated. Danforth is boundary between RW34 and RW36. Not incorporated. Danforth is a coherent boundary. Incorporated. Not incorporated, upsets voter parity. Not incorporated. Danforth is a coherent boundary. Not incorporated, upsets voter parity. Mostly incorporated. Leslieville in RW36, except a portion of the south side of Queen Street. Not incorporated, upsets voter parity between RW35 and RW37.
87 WARD SUGGESTED REFINEMENT ACTION/COMMENT Do not include anything north of Kingston Road in the Beach area. Kingston Road is a clear physical boundary. Not incorporated, upsets voter parity between RW35 and RW37. The Beach ward should end at Kingston Road and Queen Street to the west, and at Fallingbrook to the east. The eastern boundary of W137 should be moved from Victoria Park over to Hunt Club Drive more natural boundary (6) o Victoria Park Avenue is not a natural boundary, especially the southern portion by the lake. The eastern boundary should be the Toronto Hunt Club Drive, thereby incorporating Fallingbrook as a part of the beaches. o Vic Park over to Fallingbrook should be included in the Beaches Ward. o I live on Courcelette, which is technically in Ward 36, but due to the natural splitting that occurs because of the Hunt Club Ravine we are much more a part of Ward 32. Don't use Victoria Park as a dividing line. (2) The community west of Victoria Park to Fallingbrook Road to Danforth in the north should be part of Toronto and not Scarborough. Blantyre, Courcelette and Fallingbrook are Beach communities not Scarborough communities. Eastern boundary of W137 should remain Victoria Park between Bracken and Queen. Maintain the "Beach" business district within the same ward all the way to RC Harris plant. Draw the boundaries at Gerrard Street to the Lakeshore from Coxwell to Victoria Park rather than all the way to the Danforth. Not incorporated. Victoria Park remains the boundary between RW37 and RW38 to respect minimal change principle. Not incorporated. Victoria Park remains the eastern boundary of RW37. Incorporated. Incorporated. Not incorporated, upsets voter parity.
88 WARD SUGGESTED REFINEMENT ACTION/COMMENT South-east end of the city (Riverside, Leslieville, the Beaches, and Partially incorporated. the Upper Beach) should be grouped together. W138 No suggested refinements. W139 Is there room for W139 to grow? Incorporated. W140/W141 Brimley Road is the natural boundary (Midland Ratepayers Association is between Midland and Brimley; focus west); Brimley is also a school catchment area boundary; "but world would not end if we use Midland". Move eastern boundary to where Ward 38 s is now (to Scarborough Golf Club Road); i.e. keep Ward 38 as is; but this tweak is not as important as Brimley. W141 No suggested refinements. W142/W143 Cut W142 and 143 along the creek - come down Birchmount and the creek [like current Ward 39]. Even out current populations between W143 and W142 [make W143 bigger]. Huntingwood splits two communities; Corinthian community (Victoria Park to Pharmacy north and south of Huntingwood); Bridlewood community (north and south of Huntingwood); should use Finch as a divider. W142/W144 C.D Farquharson Community Association is split between W142 and W144. W143 Add area Warden/Sheppard/Victoria Park south of Huntingwood (could add whole area or use Pharmacy). W144 The eastern boundary of W144 should be the creek that runs through Neilson and McLevin. The creek does meet with Markham Road and the eastern boundary can continue northward via Markham Road. Not incorporated, upsets voter parity in RW40. Not incorporated, upsets voter parity in RW46. Not incorporated, would make RW42 too small. Incorporated populations almost equal. Not incorporated, upsets voter parity between RW42 and RW43. Incorporated. Now in RW42. Not incorporated, upsets voter parity between RW42 and RW43. Not incorporated, upsets voter parity between RW44 and RW45.
89 WARD SUGGESTED REFINEMENT ACTION/COMMENT W144/W145 Malvern is split between W144 and W145 [definition either Malvern Town Centre or larger area which has 50,000 people]. W145 The western boundary of W145 should be moved to Markham Road. You could use Sheppard as the southern boundary or move the south-eastern boundary (i.e. where the 401 is). (Markham to Sheppard). People who identify the least with Malvern live south of Sheppard i.e. those who live in Burroughs Hall. (Note: All the options split Malvern in some way). W146 Kingston Road splits the Kingston Galloway community. Instead use Morningside and Eglinton as boundaries so W146 would be square to Morningside. W147 W147 should look more like W244. Keep West Hill/Manse Valley/Coronation in one ward. Not incorporated. Upsets voter parity between RW45 and RW44. Not incorporated. Upsets voter parity between RW45 and RW44. Incorporated. Burroughs Hall shifted from RW45 to RW44. Incorporated. Now in RW46. Incorporated. Almost the same. Incorporated. All in RW47.
90 APPENDIX D OUT OF SCOPE COMMENTS TORONTO WARD BOUNDARY REVIEW / NEW WARDS FOR TORONTO / FINAL REPORT T O R O N T O W A R D B O U N D A R Y THE DRAW LINES R E V I E W
91 Appendix D Out of Scope Comments All of the issues outside the scope of the TWBR raised by survey respondents, submissions, public meeting participants and Members of Council are summarized in this Appendix and organized by theme. Comments received from the various participants have been integrated within the themes. More detailed comments can be found in Appendix C of the TWBR Round One report and Appendix B of the TWBR Round Two report. Governance This topic is the most often discussed outside of scope subject. Comments relate to the following: Structure and operation of City Council Two-tier governance system De-amalgamation with local and Metro Councils Expanded role for Community Councils Community Council Chair with veto Balance of parochial and city-wide approach to issues Creation of Midtown Community Council Community Council boundaries (TEYCC/EYCC) Four Community Councils (Eglinton/Humber River/Victoria Park) Smaller Council plus Board of Control Board of Control plus Councillors elected-at-large plus local Councillors Smaller Council plus New York-style Community Boards 25 Councillors plus 5 senior Councillors (elected in 5 wards each) Proportional representation/ranked ballots Multi-member districts Councillors elected at-large Term limits for Members of Council Strong Mayor system with veto Staff/Resources Comments on how to handle larger wards/increased workload focus on the following: Hire additional staff Councillors rely too much on staff Councillors pay to be competitive with private sector Referendum on Council members pay/resources at each municipal election Difference in levels of service among various Councillors offices
92 Naming of Wards There is no unanimity on how to name any new wards in Toronto. Comments include the following: Use neighbourhood names Eliminate pre-amalgamation labels Maintain branding of local cycling groups Create unique ward names Maintain some connection with names of federal/provincial ridings Create names independent of federal/provincial ridings TWBR Process Out of scope comments on the TWBR process are limited and include the following: Potential conflict of interest, if Councillors vote for a new ward structure Stop the TWBR until the Province has completed Municipal Act review Don t use pre-amalgamation terms like Scarborough/Etobicoke during TWBR process School Boards, Trustees, Catchment Areas School zone boundaries are important to participants in the TWBR. Comments are far-ranging: Concern re how new ward boundaries will influence Trustee wards TWBR should consider school zone boundaries Trustee ward boundaries should not have to match ward boundaries Problems re identifying various school supporters (default registration to TDSB) Position of School Board Trustee should be full-time
93 APPENDIX E MAP OF RECOMMENDED WARDS LARGE VERSION 11X17 TORONTO WARD BOUNDARY REVIEW / NEW WARDS FOR TORONTO / FINAL REPORT T O R O N T O W A R D B O U N D A R Y THE DRAW LINES R E V I E W

94 TORONTO WARD BOUNDARY REVIEW NEW WARDS FOR TORONTO FINAL REPORT MAY 2016 Appendix E Recommended Wards
TORONTO WARD BOUNDARY REVIEW OPTIONS REPORT AUGUST 11,
 AUGUST 11, 2015 www.drawthelines.ca 3. CONTENTS EXECUTIVE SUMMARY... 1 1. INTRODUCTION... 12 2. CONTEXT... 13 2.1 Effective Representation... 13 2.2 Why a Review is Necessary... 16 3. METHODOLOGY FOR DEVELOPING
ROUND TWO CONSULTATION GUIDE & SURVEY
 ROUND TWO CONSULTATION GUIDE & SURVEY AUGUST 2015 www.drawthelines.ca 3. HOW TO USE THIS GUIDE: The purpose of this Consultation Guide is to provide you (residents, stakeholders and Members of Council)
Family and Community Support Services (FCSS) Program Review
 Program Review") Family and Community Support Services (FCSS) Program Review Judy Smith, Director Community Investment Community Services Department City of Edmonton 1100, CN Tower, 10004 104 Avenue Edmonton, Alberta,
Family and Community Support Services (FCSS) Program Review Judy Smith, Director Community Investment Community Services Department City of Edmonton 1100, CN Tower, 10004 104 Avenue Edmonton, Alberta,
Minister's Expert Panel Report on Public Health in an Integrated Health System
 HL22.2 REPORT FOR ACTION Minister's Expert Panel Report on Public Health in an Integrated Health System Date: October 13, 2017 To: Board of Health From: Medical Officer of Health Wards: All SUMMARY As
MINISTRY OF HEALTH AND LONG-TERM CARE. Summary of Transfer Payments for the Operation of Public Hospitals. Type of Funding
 MINISTRY OF HEALTH AND LONG-TERM CARE 3.09 Institutional Health Program Transfer Payments to Public Hospitals The Public Hospitals Act provides the legislative authority to regulate and fund the operations
Strategic Plan
 STO R E F RO N T H U M B E R I N C. Strategic Plan 2017-2021 A Recognized Provider in West Toronto and East Mississauga of Supportive Care Services to Seniors and Adults with Disabilities in Their Homes
MLA Advisory Committee to Review Eligible Organizations Access to and Distribution of Proceeds from Licensed Casino Events
 MLA Advisory Committee to Review Eligible Organizations Access to and Distribution of Proceeds from Licensed Casino Events MLA Doug Griffiths, Chair MLA Dave Rodney MLA Doug Elniski - Advice to Minister
Establishment of Municipal Ward Boundaries
 Establishment of Municipal Ward Boundaries Effective October 26, 2016 Municipal Wards Commission Presented to Saskatoon City Council February 29, 2016 1 February 29, 2016 Your Worship and Members of City
NSERC Management Response: Evaluation of NSERC s Discovery Program
 NSERC Response: Evaluation of NSERC s Discovery Program Discovery Grants are NSERC s leading source of funding for thousands of researchers each year. These grants account for more than one-third of NSERC
Agenda Item 6.7. Future PROGRAM. Proposed QA Program Models
 Agenda Item 6.7 Proposed Program Models Background...3 Summary of Council s feedback - June 2017 meeting:... 3 Objectives and overview of this report... 5 Methodology... 5 Questions for Council... 6 Model
BACKGROUND, PURPOSE & SCOPE 1.0 BACKGROUND 1.1
 MATURE NEIGHBOURHOOD OVERLAY PROJECT CHARTER JULY 2016 1.0 BACKGROUND, PURPOSE & SCOPE 1.1 BACKGROUND The review of the Mature Neighbourhood Overlay (MNO) is identified as an action in Edmonton s Infill
E m e rgency Health S e r v i c e s Syste m M o d e r n i zation
 E m e rgency Health S e r v i c e s Syste m M o d e r n i zation Briefing Paper on Legislative Amendments to the Ambulance Act July 2017 Enhancing Emergency Services in Ontario (EESO) Ministry of Health
Regina Community Grants Program
 Regina Community Grants Program DATE: April 25, 2012 SUBMITTED TO: Community Services Department City of Regina 2476 Victoria Avenue Regina, SK S4P 3C8 www.regina.ca PREPARED BY: Stratos Inc. 1404-1 Nicholas
Shifting Public Perceptions of Doctors and Health Care
 Shifting Public Perceptions of Doctors and Health Care FINAL REPORT Submitted to: The Association of Faculties of Medicine of Canada EKOS RESEARCH ASSOCIATES INC. February 2011 EKOS RESEARCH ASSOCIATES
Introduction and Executive Summary
 Introduction and Executive Summary 1. Introduction and Executive Summary. Hospital length of stay (LOS) varies markedly and persistently across geographic areas in the United States. This phenomenon is
Coordinated Transit Consultation Meetings SmartTrack, GO RER, Relief Line, Scarborough Subway Extension June 20, 2015 Highlights Report
 Coordinated Transit Consultation Meetings SmartTrack, GO RER, Relief Line, Scarborough Subway Extension June 20, 2015 Highlights Report This concise Highlights Report has been prepared to provide the City
Creation of a New Property Tax Class for Creative Co- Location Facilities
 EX29.17 REPORT FOR ACTION Creation of a New Property Tax Class for Creative Co- Location Facilities Date: November 20, 2017 To: Executive Committee From: Acting Chief Financial Officer and Deputy City
Terms and Conditions
 Terms and Conditions Program Name: Settlement Program Category: Contribution Department: Citizenship and Immigration Canada Last Updated: May 11, 2018 Note: These Terms and Conditions apply to all agreements/arrangements
RECOMMENDATION STATUS OVERVIEW
 Chapter 2 Section 2.01 Community Care Access Centres Financial Operations and Service Delivery Follow-Up on September 2015 Special Report RECOMMENDATION STATUS OVERVIEW # of Status of Actions Recommended
Business Plan: Corporate Investments & Partnerships
 Business Plan: Corporate Investments & Partnerships How does this service contribute to the results identified in the City of London Strategic Plan? A Strong Economy Corporate Investments and Partnerships
Charitable Bingo and Gaming Revitalization Initiative
 STAFF REPORT ACTION REQUIRED Charitable Bingo and Gaming Revitalization Initiative Date: May 2, 2012 To: From: Wards: Government Management Committee City Clerk All Reference Number: SUMMARY The purpose
CHAIR AND MEMBERS COMMUNITY AND PROTECTIVE SERVICES COMMITTEE MEETING ON JUNE 20, 2017
 TO: FROM: SUBJECT: CHAIR AND MEMBERS COMMUNITY AND PROTECTIVE SERVICES COMMITTEE MEETING ON JUNE 20, 2017 LYNNE LIVINGSTONE MANAGING DIRECTOR NEIGHBOURHOOD, CHILDREN AND FIRE SERVICES LONDON STRENGTHENING
Planning: a Short Guide
 Planning: a Short Guide Planning: a Short Guide www.doi.vic.gov.au/planning Introduction This booklet outlines the planning permit process and planning scheme amendment process, and the course to be followed
CONSOLIDATED PLAN AMENDMENT COMMUNITY DEVELOPMENT BLOCK GRANT PROGRAM CITY OF LEE S SUMMIT MISSOURI
 2006-07 CONSOLIDATED PLAN AMENDMENT COMMUNITY DEVELOPMENT BLOCK GRANT PROGRAM CITY OF LEE S SUMMIT MISSOURI May 11, 2006 1 PROGRAM OVERVIEW CDBG Entitlement Program Summary The Entitlement Status is a
CANADA. Current situation: Facts and figures from the 2010 CF-GSR survey
 CANADA Community foundations Current situation: Facts and figures from the 2010 CF-GSR survey Number of community foundations at the end of 2009. 171 Number of community foundations established in 2008-2009.
REQUEST FOR PROPOSALS
 REQUEST FOR PROPOSALS Downtown Triangle Redevelopment 1 st Street North, East Jackson Street, and Market Street City of Wisconsin Rapids 444 West Grand Avenue, Wisconsin Rapids, WI 54495 February 2017
August 25, Dear Ms. Verma:
 Seema Verma Administrator Centers for Medicare & Medicaid Services Hubert H. Humphrey Building 200 Independence Avenue, S.W. Room 445-G Washington, DC 20201 CMS 1686 ANPRM, Medicare Program; Prospective
REPORT Meeting Date: Regional Council
 6.5-1 REPORT Meeting Date: 2017-02-23 Regional Council DATE: February 15, 2017 REPORT TITLE: PEEL 2041 REGIONAL OFFICIAL PLAN REVIEW ROPA 27 ADOPTION - HEALTH AND THE BUILT ENVIRONMENT, AGE- FRIENDLY PLANNING,
FEDERAL SPENDING AND REVENUES IN ALASKA
 FEDERAL SPENDING AND REVENUES IN ALASKA Prepared by Scott Goldsmith and Eric Larson November 20, 2003 Institute of Social and Economic Research University of Alaska Anchorage 3211 Providence Drive Anchorage,
A Primer on Activity-Based Funding
 A Primer on Activity-Based Funding Introduction and Background Canada is ranked sixth among the richest countries in the world in terms of the proportion of gross domestic product (GDP) spent on health
EXECUTIVE COMPENSATION PROGRAM
 EXECUTIVE COMPENSATION PROGRAM 2 Background In 2010, the Province legislated a two-year compensation freeze for all non-unionized employees in the Broader Public Sector (BPS) which prohibited increases
Recommendations to the Natural Sciences and Engineering Research Council
 Recommendations to the Natural Sciences and Engineering Research Council Grant Selection Committee Structure Review Advisory Committee Adel Sedra, Dean of Engineering University of Waterloo Chairman May,
BUILDING CONSENSUS Ottawa Ward Boundary Review
 BUILDING CONSENSUS Ottawa Ward Boundary Review Public Consultation Workbook Wards are a key component in our system of local government. The voters in each ward elect one Councillor to deal with city-wide
Community Health Centre Program
 MINISTRY OF HEALTH AND LONG-TERM CARE Community Health Centre Program BACKGROUND The Ministry of Health and Long-Term Care s Community and Health Promotion Branch is responsible for administering and funding
White Paper on Volunteer Firefighter Training By The National Volunteer Fire Council January 2010
 White Paper on Volunteer Firefighter Training By The National Volunteer Fire Council January 2010 Introduction In 2008, the National Volunteer Fire Council (NVFC) adopted a policy position that all volunteer
Airport Zoning Regulation to Protect Hospital Helicopter Flight Paths- Final Report. Planning and Growth Management Committee
 PG24.3 STAFF REPORT ACTION REQUIRED Airport Zoning Regulation to Protect Hospital Helicopter Flight Paths- Final Report Date: October 18, 2017 To: From: Planning and Growth Management Committee Acting
Summary of the Final Report of The Royal Commission on Aboriginal Peoples: Implications for Canada's Health Care System
 Institute On Governance Summary of the Final Report of The Royal Commission on Aboriginal Peoples: Implications for Canada's Health Care System October 1997 A report by The 122 Clarence Street, Ottawa,
Discussion paper on the Voluntary Sector Investment Programme
 Discussion paper on the Voluntary Sector Investment Programme Overview As important partners in addressing health inequalities and improving health and well-being outcomes, the Department of Health, Public
ONTARIO SENIORS SECRETARIAT SENIORS COMMUNITY GRANT PROGRAM GUIDELINES
 ONTARIO SENIORS SECRETARIAT SENIORS COMMUNITY GRANT PROGRAM GUIDELINES 2014-2015 SENIORS COMMUNITY GRANT PROGRAM 2014-2015 GUIDELINES TABLE OF CONTENTS 1. HIGHLIGHTS... 3 BACKGROUND... 3 2014-15 FUNDING...
Document 2: Assessment of the Use of Local Improvement Charges to Finance Home Energy Retrofits in Ottawa
 Document 2: Assessment of the Use of Local Improvement Charges to Finance Home Energy Retrofits in Ottawa Background On May 28, 2014, Ottawa City Council approved the Air Quality and Climate Change Management
ED8.9 STAFF REPORT ACTION REQUIRED. Canada150 Planning for 2017 SUMMARY. Date: November 16, Economic Development Committee.
 ED8.9 STAFF REPORT ACTION REQUIRED Canada150 Planning for 2017 Date: November 16, 2015 To: From: Wards: Economic Development Committee General Manager, Economic Development and Culture All Reference Number:
Coordinated Transit Consultation Meetings SmartTrack, GO RER, Relief Line, Scarborough Subway Extension June 13, 2015 Highlights Report
 Coordinated Transit Consultation Meetings SmartTrack, GO RER, Relief Line, Scarborough Subway Extension June 13, 2015 Highlights Report This concise Highlights Report has been prepared to provide the City
Request for Proposals
 Request for Proposals Disparity Study PROPOSALS WILL BE RECEIVED UNTIL 12:00 Noon, Friday, July 27 th, 2018 in Purchasing Department, City Hall Building 101 North Main Street, Suite 324 Winston-Salem,
City of Brantford. Terms of Eligibility Annual Operating Grants
 Description of Program City of Brantford Community Cultural Investment Program 2017 Terms of Eligibility Annual Operating Grants Funded by the City of Brantford, the goals for the Community Cultural Investment
Quick Facts Prepared for the Canadian Federation of Nurses Unions by Jacobson Consulting Inc.
 Trends in Own Illness- or Disability-Related Absenteeism and Overtime among Publicly-Employed Registered Nurses: Quick Facts 2017 Prepared for the Canadian Federation of Nurses Unions by Jacobson Consulting
FRENCH LANGUAGE HEALTH SERVICES STRATEGY
 FRENCH LANGUAGE HEALTH SERVICES STRATEGY 2016-2019 Table of Contents I. Introduction... 4 Partners... 4 A. Champlain LHIN IHSP... 4 B. South East LHIN IHSP... 5 C. Réseau Strategic Planning... 5 II. Goal
Recruiting for Diversity
 GUIDE Creating and sustaining patient and family advisory councils Recruiting for Diversity WHO IS HEALTH QUALITY ONTARIO Health Quality Ontario is the provincial advisor on the quality of health care.
Primary Care Workforce Survey Scotland 2017
 Primary Care Workforce Survey Scotland 2017 A Survey of Scottish General Practices and General Practice Out of Hours Services Publication date 06 March 2018 An Official Statistics publication for Scotland
Health. Business Plan to Accountability Statement
 Health Business Plan 1997-1998 to 1999-2000 Accountability Statement This Business Plan for the three years commencing April 1, 1997 was prepared under my direction in accordance with the Government Accountability
The Scarborough Hospital - Alliance Discussions. Presented to the Central East LHIN Board of Directors February 22, 2012
 The Scarborough Hospital - Alliance Discussions Presented to the Central East LHIN Board of Directors February 22, 2012 Objective To respond and provide direction to Integration discussions between The
Patients as Partners Provincial Dialogue Event Summary. March 31, 2014
 Patients as Partners 2014 Provincial Dialogue Event Summary March 31, 2014 Table of Contents Executive Summary... 2 Introduction... 3 Method... 4 Patients as Partners: What have we learned and how can
REGIONAL MUNICIPALITY BY-LAW NUMBER B-700 RESPECTING THE REGULATION OF BUSINESS IMPROVEMENT DISTRICTS
 REGIONAL MUNICIPALITY BY-LAW NUMBER B-700 RESPECTING THE REGULATION OF BUSINESS IMPROVEMENT DISTRICTS WHEREAS Halifax Regional Municipality wishes to support the attraction, retention and promotion of
Policies and Procedures. Unsolicited Proposals. Western Lands
 Metropolitan Washington Airports Authority Real Estate Development Policies Policies and Procedures Regarding Unsolicited Proposals for Western Lands at Washington Dulles International Airport March 3,
K-12 Categorical Reform
 K-12 Categorical Reform E 61 K-12 Categorical Reform The state administers K-12 funding through more than 100 individual funding streams. Reform of the funding system would have several local benefits,
Transportation Demand Management (TDM)
") DEVELOPMENT OF A REGIONAL TRANSPORTATION PLAN FOR THE GREATER TORONTO AND HAMILTON AREA Transportation Demand Management (TDM) Presentation to Metrolinx Board February 8, 2008 TDM Primer TDM is the use
DEVELOPMENT OF A REGIONAL TRANSPORTATION PLAN FOR THE GREATER TORONTO AND HAMILTON AREA Transportation Demand Management (TDM) Presentation to Metrolinx Board February 8, 2008 TDM Primer TDM is the use
STAFF REPORT ACTION REQUIRED. Job Fairs and the City of Toronto SUMMARY RECOMMENDATIONS. Date: January 19, Economic Development Committee.
 STAFF REPORT ACTION REQUIRED Job Fairs and the City of Toronto Date: January 19, 2011 To: From: Wards: Economic Development Committee Heather MacVicar, General Manager, Employment & Social Services All
Draft Community Outreach Plan for the Climate Action Plan Update
 Draft Community Outreach Plan for the Climate Action Plan Update PREPARED FOR 201 North Broadway Escondido, CA 92025 Project Contact Mike Strong, Assistant Planning Director (760) 839-4556 mstrong@escondido.org
Shared Vision, Shared Outcomes: Building on the Foundation of Collaboration between Public Health and Comprehensive Primary Health Care in Ontario
 Shared Vision, Shared Outcomes: Building on the Foundation of Collaboration between Public Health and Comprehensive Primary Health Care in Ontario Submission from the Association of Ontario Health Centres
National review of domiciliary care in Wales. Wrexham County Borough Council
 National review of domiciliary care in Wales Wrexham County Borough Council July 2016 Mae r ddogfen yma hefyd ar gael yn Gymraeg. This document is also available in Welsh. Crown copyright 2016 WG29253
Begin Implementation. Train Your Team and Take Action
 Begin Implementation Train Your Team and Take Action These materials were developed by the Malnutrition Quality Improvement Initiative (MQii), a project of the Academy of Nutrition and Dietetics, Avalere
SUMMARY. Workshop Summary WORKSHOP. Julia Langton, Kim McGrail, Sabrina Wong July 2015
 WORKSHOP SUMMARY A Matrix Approach to Primary Care Performance Measurement: Developing a High Quality Information System Aligned with Modern Primary Care Practice Julia Langton, Kim McGrail, Sabrina Wong
Public Health Accreditation Board Guide to National Public Health Department Reaccreditation: Process and Requirements
 Public Health Accreditation Board Guide to National Public Health Department Reaccreditation: Process and Requirements ADOPTED DECEMBER 2016 TABLE OF CONTENTS INTRODUCTION 1 PART 1 REACCREDITATION PROCESS
Section F: Committee of Adjustment: Minor Variance and Consent Applications
 Executive Summary Introduction The Development Review Process STAR Process Pre-application Consultation Submission of "Complete" Applications STAR Application Streams Section A: Official Plan and Zoning
Methodology Notes. Cost of a Standard Hospital Stay: Appendices to Indicator Library
 Methodology Notes Cost of a Standard Hospital Stay: Appendices to Indicator Library February 2018 Production of this document is made possible by financial contributions from Health Canada and provincial
Downtown Oakland Specific Plan Frequently Asked Questions
 Downtown Oakland Specific Plan Frequently Asked Questions 1. What is the Downtown Oakland Specific Plan? A Specific Plan is a regulatory tool that local governments can use to implement the general plan
ICT SECTOR REGIONAL REPORT
 ICT SECTOR REGIONAL REPORT 1997-2004 (August 2006) Information & Communications Technology Sector Regional Report Definitions (by North American Industrial Classification System, NAICS 2002) The data reported
Analysis of Nursing Workload in Primary Care
 Analysis of Nursing Workload in Primary Care University of Michigan Health System Final Report Client: Candia B. Laughlin, MS, RN Director of Nursing Ambulatory Care Coordinator: Laura Mittendorf Management
Board of Health and Local Health Integration Network Engagement Guideline, 2018
 Ministry of Health and Long-Term Care Board of Health and Local Health Integration Network Engagement Guideline, 2018 Population and Public Health Division, Ministry of Health and Long-Term Care Effective:
TransLink s TravelSmart Program
 Tools of Change Case Study Series Promoting Best Practices in Social Marketing www.toolsofchange.com TransLink s TravelSmart Program Tools of Change Illustrated Building Motivation Over Time Financial
CHAIR AND MEMBERS STRATEGIC PRIORITIES AND POLICY COMMITTEE MEETING ON OCTOBER 26, 2015
 TO: FROM: CHAIR AND MEMBERS STRATEGIC PRIORITIES AND POLICY COMMITTEE MEETING ON OCTOBER 26, 2015 LYNNE LIVINGSTONE MANAGING DIRECTOR, NEIGHBOURHOOD, CHILDREN & FIRE SERVICES SUBJECT: MODERNIZING THE MUNICIPAL
Q4 & Annual 2017 HIGHER EDUCATION. Employment Report. Published by
 Q4 & Annual 2017 HIGHER EDUCATION Employment Report Published by ACE FELLOWS ENHANCE AND ADVANCE FELLOWS PROGRAM American Council on Education HIGHER EDUCATION. With over five decades of success, the ACE
Volunteers and Donors in Arts and Culture Organizations in Canada in 2013
 Volunteers and Donors in Arts and Culture Organizations in Canada in 2013 Vol. 13 No. 3 Prepared by Kelly Hill Hill Strategies Research Inc., February 2016 ISBN 978-1-926674-40-7; Statistical Insights
Health Quality Ontario
 Health Quality Ontario The provincial advisor on the quality of health care in Ontario November 15, 2016 Under Pressure: Emergency department performance in Ontario Technical Appendix Table of Contents
Item 9 - Consideration of 2014 OCP
 Pg. 1 Section Manager / Division Manager Director CAO xi* The Corporation of THE CITY OF NORTH VANCOUVER COMMUNITY DEVELOPMENT DEPARTMENT REPORT To: From: SUBJECT: Date: Mayor Darrell R. Mussatto and Members
Report of the Auditor General of Canada to the House of Commons
 Fall 2012 Report of the Auditor General of Canada to the House of Commons CHAPTER 2 Grant and Contribution Program Reforms Office of the Auditor General of Canada The Report is available on our website
Chapter F - Human Resources
 F - HUMAN RESOURCES MICHELE BABICH Human resource shortages are perhaps the most serious challenge fac Canada s healthcare system. In fact, the Health Council of Canada has stated without an appropriate
Issues and Strategies Shaping Brampton s Economic Base. Presented by Dennis Cutajar, EcD (F), MSc Brampton Economic Development February 10, 2006
, MSc Brampton Economic Development February 10, 2006") Issues and Strategies Shaping Brampton s Economic Base Presented by Dennis Cutajar, EcD (F), MSc Brampton Economic Development February 10, 2006 Introduction In 2005, Brampton Economic Development commissioned
Issues and Strategies Shaping Brampton s Economic Base Presented by Dennis Cutajar, EcD (F), MSc Brampton Economic Development February 10, 2006 Introduction In 2005, Brampton Economic Development commissioned
Municipal Stream. Community Transportation Grant Program. Application Guidelines and Requirements Issued: December 2017
 Community Transportation Grant Program Municipal Stream Application Guidelines and Requirements 2017 Issued: December 2017 Ministry of Transportation Municipal Transit Policy Office Transit Policy Branch
Agenda Item 8.4 BRIEFING NOTE: Toronto Central Local Health Integration Network (LHIN)
") Agenda Item 8.4 BRIEFING NOTE: Toronto Central Local Health Integration Network (LHIN) SUBJECT: Voluntary Integration of the Assisted Living and Attendant Outreach Services from the Canadian Red Cross
Agenda Item 8.4 BRIEFING NOTE: Toronto Central Local Health Integration Network (LHIN) SUBJECT: Voluntary Integration of the Assisted Living and Attendant Outreach Services from the Canadian Red Cross
16 th Annual National Report Card on Health Care
 16 th Annual National Report Card on Health Care August 18, 2016 2016 National Report Card: Canadian Views on the New Health Accord July 2016 Ipsos Public Affairs 160 Bloor Street East, Suite 300 Toronto
ICD-10 Advantages to Providers Looking beyond the isolated patient provider encounter
 A Health Data Consulting White Paper 1056 6th Ave S Edmonds, WA 98020-4035 206-478-8227 www.healthdataconsulting.com ICD-10 Advantages to Providers Looking beyond the isolated patient provider encounter
R E P O R T T O MINIS TER O F N AT I O N A L
 THE R E P O R T T O MINIS TER O F N AT I O N A L FEBRUARY 2016 D EFEN C E A Systemic Review of Compensation Options for Ill and Injured Reservists A Systemic Review of Compensation Options for Ill and
Mid-East RPO - SPOT Local Input Point Assignment Methodology
 Mid-East RPO - SPOT Local Input Point Assignment Methodology The Statewide Mobility category in Prioritization 4.0 is 100% data driven. Therefore the remaining Regional Impact and Division Needs categories
Proposal to Increase M/W/ESB Utilization in PTE Contracting
 Proposal to Increase M/W/ESB Utilization in PTE Contracting Document Prepared by The City of Portland Office of Management and Finance Bureau of Purchases January 2003 This page intentionally left blank.
After Hours Service Requirements
 To: Comprehensive Care Model (CCMs) Published By: Primary Health Care Date Issued: Bulletin #: Re: November 2010 (replaces January 2006 version) 11007 Revised After Hours Service Requirements The purpose
New Affordable Housing Program Opportunities
 STAFF REPORT ACTION REQUIRED New Affordable Housing Program Opportunities Date: August 12, 2009 To: From: Affordable Housing Committee Sue Corke, Deputy City Manager and Director, Purchasing and Materials
FBC2017 SPEAKER SUBMISSION KIT CONNECTING CANADA WITH FOOD
 FBC2017 SPEAKER SUBMISSION KIT CONNECTING CANADA WITH FOOD CANADA S ONLY NATIONAL FOOD BLOGGING CONFERENCE OTTAWA, ONTARIO OCTOBER 20-22, 2017 AT A GLANCE: October 20-22, 2017 Delta Hotels Ottawa City
Community Economic Development
 HANDBOOK Community Economic Development for Municipal Councils Table of Contents 1. What is Community Economic Development?... 1 2. The Role of Municipalities in CED... 2 3. Community Readiness for CED...
The needs-based funding arrangement for the NSW Catholic schools system
 The needs-based funding arrangement for the NSW Catholic schools system March 2018 March 2018 Contents A. Introduction... 2 B. Background... 2 The Approved System Authority for the NSW Catholic schools
Manage the RFP Process
 LOCAL FOOD FRAMEWORK FOR ONTARIO COLLEGES MOHAWK COLLEGE 018 Manage the RFP Process Starting Point: 6 8 months prior to new or updated foodservice contract Goals Set actionable local food procurement goals
Management Response to the International Review of the Discovery Grants Program
 Background: In 2006, the Government of Canada carried out a review of the Natural Sciences and Engineering Research Council (NSERC) and the Social Sciences and Humanities Research Council (SSHRC) 1. The
Midlands and East regional Mental Health Workshop February 2014
 Midlands and East regional Mental Health Workshop February 2014 1 A review of the Midlands and East regionally led Mental Health and Dementia Workshop Held on 4 th February 2014 Report prepared by: Lucy
North Local Collaborative January 23, 2017
 North Local Collaborative January 23, 2017 Get Social with your Local! Share thoughts, projects, and ideas about our North Sub-Region. Use the hashtag: #letsgetdowntolocal 2 Revisiting What to Expect October
NORTHWEST SECTOR STUDY PHASE I REPORT. Approved 17 February 2015 (Resolution )
") EMBRACE ENHANCE EXPAND NORTHWEST SECTOR STUDY PHASE I REPORT Approved 17 February 2015 (Resolution 2015-02-022) This plan has been prepared by Parsons Brinckerhoff and their subconsultants for the City
EMBRACE ENHANCE EXPAND NORTHWEST SECTOR STUDY PHASE I REPORT Approved 17 February 2015 (Resolution 2015-02-022) This plan has been prepared by Parsons Brinckerhoff and their subconsultants for the City
Employers are essential partners in monitoring the practice
 Innovation Canadian Nursing Supervisors Perceptions of Monitoring Discipline Orders: Opportunities for Regulator- Employer Collaboration Farah Ismail, MScN, LLB, RN, FRE, and Sean P. Clarke, PhD, RN, FAAN
On 10 July 2008, the Training and Readiness Authority
 By Lieutenant Colonel Diana M. Holland On 10 July 2008, the Training and Readiness Authority (TRA) policy took effect for the 92d Engineer Battalion (also known as the Black Diamonds). The policy directed
State advocacy roadmap: Medicaid access monitoring review plans
 State advocacy roadmap: Medicaid access monitoring review plans Background Federal Medicaid law requires states to ensure Medicaid beneficiaries are able to access the healthcare providers they need through
REQUEST FOR PROPOSALS 11 th August, A Strategy for the Atlantic Canadian Aerospace and Defence Sector for a Long-term Development Plan
 REQUEST FOR PROPOSALS 11 th August, 2017 A Strategy for the Atlantic Canadian Aerospace and Defence Sector for a Long-term Development Plan Page 1 of 14 Table of Contents 1.0 Introduction... 3 2.0 Contracting
Casemix Measurement in Irish Hospitals. A Brief Guide
 Casemix Measurement in Irish Hospitals A Brief Guide Prepared by: Casemix Unit Department of Health and Children Contact details overleaf: Accurate as of: January 2005 This information is intended for
Improving Quality at Toronto Central LHIN. 2012/13 Year in Review
 Improving Quality at Toronto Central LHIN 2012/13 Year in Review Quality is an integral part of Toronto Central (TC) LHIN s Integrated Health Services Plan 2013-16, reflected in the goal, Better Health