Pali Momi Medical Center Community Health Needs Assessment. April 23, 2013
|
|
|
- Edmund Williams
- 5 years ago
- Views:
Transcription

1 Pali Momi Medical Center Community Health Needs Assessment April 23, 2013
2 Table of Contents Executive Summary... 6 Introduction... 6 Approach... 6 Data Sources and Methods... 6 Areas of Need... 7 Selected Priority Areas... 8 Note to the Reader Introduction Summary of CHNA Report Objectives and context Healthcare Association of Hawaii Pali Momi Medical Center Advisory Committee Consultants Hospital Community Benefit Team and Goals Definition of Community + Map Methods Core Indicator Summary Data Sources Comparisons: Analytic Approach Indicator and Topic Area Scoring Shortage Area Maps Hospitalization Rates Key Informant Interviews Community Survey Community Health Needs Assessment Findings Demographics Population Economy Education Overview of Needs Assessment Access to Health Services Cancer Diabetes Disabilities Economy Education Environment Exercise, Nutrition & Weight Family Planning Heart Disease & Stroke Immunizations & Infectious Diseases Injury Prevention & Safety Maternal, Fetal & Infant Health Mental Health & Mental Disorders
3 Older Adults & Aging Oral Health Respiratory Diseases Social Environment Substance Abuse & Lifestyle Transportation Community Health Needs Summary Findings/Conclusions Disparities Highlights Identified Data Gaps Limitations and Other Considerations Selected Priority Areas Appendix A: HCI Provided Data About HCI Provided Data Framework for Indicator/Data and Topic Selection Core Indicator Data Summary: Analytic Approach and Scoring Methodology Core Indicator Data: Honolulu County Summary Core Indicator Data: West Oahu Appendix B: Hospitalization Data Hospital Service Areas Hospitalization Rates Appendix C: Key Informant Interview Participants Completed Interviews Attempted Interviews Appendix D: Identified Community Resources Appendix E: Referenced Reports Appendix F: Road map to IRS Requirements in Schedule H Form Appendix G: Authors
4 Tables Table 3.1: Median Age, Table 3.2: Economic Indicators for Ewa Subdivisions, Table 3.3: Adults 25+ with at a High School Degree or Higher: Ewa Subdivisions, Table 3.4: Core Indicator Summary Scores Table 3.5: Hospitalization Rates due to Preventable Causes in West Oahu Hospital Service Areas, Table 3.6: Core Indicators Cancer Table 3.7: Percent of Persons with a Disability, Table 3.8: Core Indicators Education Table 3.9: Core Indicators Exercise, Nutrition & Weight Table 3.10: Core Indicators Family Planning Table 3.11: Core Indicators Heart Disease & Stroke Table 3.12: Core Indicators Immunizations & Infectious Diseases Table 3.13: Core Indicators Injury Prevention & Safety Table 3.14: Core Indicators Maternal, Fetal & Infant Health Table 3.15: Core Indicators Mental Health & Mental Disorders Table 3.16: Core Indicators Respiratory Diseases Table 3.17: Core Indicators Substance Abuse & Lifestyle Figures Figure 1.1 Service Area Map Figure 2.1: Comparison Methods Figure 3.1: Population by West Oahu CCD, Figure 3.2: Population Change, Figure 3.3: Population by Age: Honolulu County and West Oahu, Figure 3.4: Population by Age: West Oahu CCDs, Figure 3.5: Population by Race/Ethnicity: Honolulu County and West Oahu, Figure 3.6: Breakdown of Population Reporting Race of Native Hawaiian/Other P.I. Only, Figure 3.7: Breakdown of Population Reporting Race of Asian Only, Figure 3.8: Population by Race/Ethnicity: West Oahu CCDs, Figure 3.9: Foreign Born Population, Figure 3.10: Linguistic Isolation, Figure 3.11: Per Capita and Median Household Income by West Oahu CCDs, Figure 3.12: Ewa Subdivisions Figure 3.13: Poverty in Honolulu County and West Oahu, Figure 3.14: Poverty by West Oahu CCDs, Figure 3.15: Poverty by Race/Ethnicity in West Oahu, Figure 3.16: Educational Attainment among Adults 25+ by West Oahu CCD, Figure 3.17: PQI Composite Hospitalization Rates Figure 3.18: Key Informant Interview Word Cloud Figure 3.19: High Risk Race/Ethnicity Groups Identified through Community Survey Figure 3.20: Federally Designated Medically Underserved Areas/Populations by Census Tracts Figure 3.21: Hospitalization Rates due to Diabetes, Figure 3.22 Percent of Diabetes Related Hospitalizations by Age and Gender, West Oahu, Figure 3.23: Percent of Persons with a Disability by Age and Race/Ethnicity: Honolulu County, Figure 3.24: Percent of Population Living Below Poverty Level, Figure 3.25: Hospitalization Rates due to Heart Disease, Figure 3.26 Percent of Heart Disease Related Hospitalizations by Age and Gender, West Oahu, Figure 3.27: Hospitalization Rates due to Bacterial Pneumonia, Figure 3.28 Percent of Hospitalizations due to Bacterial Pneumonia by Age and Gender, West Oahu,
5 Figure 3.29: Low Birth Weight Rate per 100 Live Births, Figure 3.30: Federally Designated Mental Health Professional Shortage Population Groups by Census Tracts Figure 3.31 Percent of Hospitalizations due to Mental Health by Age and Gender, West Oahu, Figure 3.32: Unadjusted Composite Hospitalization Rates: West Oahu, Figure 3.33: Hospitalization Rates due to Respiratory Disease, Figure 3.34 Percent of Hospitalizations due to COPD or Asthma among Older Adults (40+) by Age and Sex, West Oahu, Figure 3.35 Percent of Children Living in Single Parent Family Households by County Subdivision, West Oahu, Figure 4.1: Areas of Disparity for Race/Ethnicity Groups Figure 5.1 West Oahu Census County Divisions Figure 5.2 Ewa Subdivisions Figure 5.3: Honolulu County Hospital Service Areas
6 Executive Summary Introduction Pali Momi Medical Center is pleased to present the Community Health Needs Assessment (CHNA). This CHNA report was developed through a collaborative process and provides an overview of the health needs in Honolulu County, with a focus on West Oahu. The goal of this report is to offer a meaningful understanding of the health needs in the community and guide Pali Momi Medical Center with their community benefit planning efforts and development of an implementation strategy to address prioritized needs. Special attention has been given to identify health disparities, the needs of vulnerable populations, and unmet health needs or gaps in services. Although this report focuses on needs within the community, it is important to note there are also innumerable community assets and a true aloha spirit that provide ample foundation for community health improvement. Approach In Fall 2012, the Healthcare Association of Hawaii partnered with Healthy Communities Institute to conduct a CHNA for Honolulu County. As a subset of the larger project, additional data that further describes the West Oahu population was incorporated, in order to highlight the population s particular attributes and health needs. Our approach followed the public health model of assessing and understanding community health holistically. A framework for analysis was constructed based on determinants of health; the framework included a broad definition of community health that considers extensive secondary data on the social, economic, and physical environments, as well as health risks and outcomes. The influence of mauka ( toward the mountains ), or upstream factors, and the resulting makai ( toward the ocean ), or downstream impacts, on health is a transcending theme. Key informant interviews with those having special knowledge of health needs, health disparities, and vulnerable populations provided vital information that increased the understanding of the health needs in Honolulu County. A small set of community residents provided additional insights on the health needs in West Oahu. It is hoped that this report will provide a foundation for community health improvement efforts and that community health partners will build on this report. Data Sources and Methods An extensive array of secondary and primary data was collected and synthesized for this report. Core Indicators: Secondary data was analyzed using Hawaii Health Matters ( a publicly available data platform with a dashboard of over 100 indicators from over 20 sources; much of the data comes from Hawaii Department of Health, allowing for Hawaii specific race, age and gender details. This extensive core data was analyzed using a highly systematic and quantitative approach that incorporated multiple benchmarks and comparisons to understand the question: How is Honolulu County performing? Hospitalization Indicators: Eighteen indicators on key preventable causes of hospitalization, analyzed at the sub county/hospital service area level, supplemented the core indicators. This data was provided by Hawaii Health Information Corporation (HHIC) and enabled valuable insights into utilization patterns, geographic disparities in hospitalization rates, and enhanced the core indicator data for important topic areas. Supplemental Information: Recently published reports on Honolulu County s health and access to care were reviewed for additional key information on important topics such as health disparities, primary care needs, and mental health. 6
7 Key Informant Interviews: Storyline Consulting, a local partner of the project, interviewed 17 key informants who had knowledge of the health needs in Honolulu County. The selection of the key informants was guided by preliminary core indicator data findings and followed a structured nomination and selection process by the HAH Advisory Committee. These 17 Honolulu specific interviews were supplemented by relevant information provided by additional key informants who were interviewed for the State of Hawaii. The input by local key informants was invaluable and greatly enhanced the understanding of health needs and offered insight into health resources and health improvement approaches. Community Survey: A small sample of community residents, via an online survey, supplemented the key informant interviews. Highlights of these surveys, or Voices from the Community, are incorporated throughout the report. Areas of Need This report provides an overview of Honolulu County s community health needs. Community health was assessed for Honolulu County as a whole, for race sub groups, and for sub geographies. The findings revealed overall or sub population community needs in the following areas: Access to Health Services Cancer Diabetes Disabilities Economy Education Environment Exercise, Nutrition, & Weight Family Planning Heart Disease & Stroke Immunizations & Infectious Diseases Injury Prevention & Safety Maternal, Fetal & Infant Health Mental Health & Mental Disorders Older Adults & Aging Oral Health Respiratory Diseases Social Environment Substance Abuse & Lifestyle Transportation Several overarching themes emerged across the topic areas: All groups experience adverse health outcomes due to chronic disease and health risk behaviors Individuals from all geographies, race, gender, and age groups experience poor health outcomes. Evidence from high rates of chronic disease patterns, hospitalizations due to preventable causes, and patterns of unhealthy behaviors compels those seeking to improve health to consider interventions at the structural, policy, and community wide level in order to positively impact the long term health of as many West Oahu residents as possible. Special consideration for mental health, a chronic condition that significantly influences overall health, is critical for achieving population health goals. Greater socio economic need and health impacts are found among certain groups and places in West Oahu There are pockets of high socio economic need within West Oahu, especially within Waianae, Wahiawa, and Waipahu. Disparities in educational attainment are important, related concerns. These areas of high socio economic need are also the most affected by health problems, as evidenced by higher hospitalization rates and reinforced by key informants. When planning for heath improvement, careful consideration should be given to highest need groups identified geographically by socio economic measures. 7
8 Cultural and language barriers inhibit effective intervention for the most impacted populations Because of the strong correlation between poverty and race/ethnicity, some of the groups most impacted by health issues often face cultural barriers to health improvement. Language differences, including limited English proficiency, and poor health behaviors that are common within a culture are challenges that must be overcome in order to effectively prevent disease. Limited access to care results in greater health impacts in rural areas of West Oahu The rural areas of West Oahu that have the highest poverty rates were concurrently found to face more severe health problems across many topics. Access to health care presents challenges due to availability of services and transportation issues for those in rural areas and communities outside of Honolulu. These obstacles to care especially impact those who are underinsured, those with cultural differences, and those with complicated needs. Community health centers and schools are key community assets for effective interventions Key informants highlighted the primary assets of community health centers and schools as venues that can provide culturally appropriate services and education that promotes health lifestyles and health literacy. Community based clinics and schools can address human needs in an integrated manner. Children spend the majority of their waking hours in schools and one of the best chances for improving the health of the next generation is through school based programs. While West Oahu has existing community health centers, funding is often a limitation of providing services through these venues. Public schools also have funding challenges that impact their ability to meet the spectrum of student needs. West Oahu is rich with organizations, agencies, and individuals that understand the impact of social determinants of health and seek opportunities to partner or collaborate to improve the health of the community. Fortunately, the aloha spirit in West Oahu embodies concern for community and is deeply infused in the culture of Hawaii. Selected Priority Areas Pali Momi Medical Center has selected the following two priorities: 1. Heart Disease & Stroke 2. Exercise, Nutrition, & Weight Details about the prioritization process can be found in Section 5. 8
9 Note to the Reader Beyond the Executive Summary, readers may choose to study the entire report or alternatively focus on a particular topic area. An overview is provided for each key type of data included in the report: core indicators, hospitalization rates, key informant interviews, and online community survey. To more deeply understand a topic area, the reader can turn to any of the 20 topic area presentations and find all data for the topic and summary conclusions. Each topic specific section is organized in the following way: Core Indicators and Supplemental Information Hospitalization Rates (when available) Key Informant Interview Information Summary of Topic Area 9
10 1 Introduction 1.1 Summary of CHNA Report Objectives and context The state of Hawaii is unique in that all of its community hospitals and hospital systems joined efforts to fulfill new requirements under the Affordable Care Act, which the IRS developed guidelines to implement. The Healthcare Association of Hawaii (HAH) led this collaboration to conduct state and county wide assessments for its members. Building on this collaboration, Pali Momi Medical Center developed a CHNA for Honolulu County, with a focus on the Western side of Oahu Healthcare Association of Hawaii HAH is the unifying voice of Hawaii s health care providers and an authoritative and respected leader in shaping Hawaii s health care policy. Founded in 1939, HAH represents the state s hospitals, nursing facilities, home health agencies, hospices, durable medical equipment suppliers, and other health care providers who employ about 20,000 people in Hawaii. HAH works with committed partners and stakeholders to establish a more equitable, sustainable health care system driven to improve quality, efficiency, and effectiveness for patients and communities Pali Momi Medical Center Pali Momi Medical Center is a 128 bed not for profit community hospital providing inpatient and outpatient services. There are approximately 1200 staff and 400 physicians at Pali Momi Medical Center. The team of professional staff in the Emergency Department includes Board Certified Emergency Physicians who can treat and stabilize all types of patients. Surgical services are available during business hours and on call after hours, Sundays, and holidays. Robotic services are available by trained physicians and staff. Oncology services are available to inpatients and outpatients alike and Pali Momi Medical Center is accredited by the American College of Surgeons for Cancer Care. Inpatient services include medical surgical services, telemetry and intensive care services. The Cardiac Catheterization Lab is available for scheduled as well as emergency cases. Services such as echocardiogram and treadmill stress tests are also available. The Imaging Department provides services such as CAT Scans, MRI, ultrasound, and nuclear medicine. There is also a Women s Center for DEXA scans, mammograms, tomosynthesis, ultrasound biopsies, and stereotactic biopsies Advisory Committee The CHNA process has been informed by hospital leaders and other key stakeholders from the community who constitute the Advisory Committee. The following individuals shared their insights and knowledge about health care, public health, and their respective communities as part of this group. Howard Ainsley Hawaii Health Systems Corporation Bruce Anderson, PhD Hawaii Health Systems Corporation Joy Barua Kaiser Permanente Hawaii Maile Ballesteros St. Francis Home Care Kauai Wendi Barber, CPA, MBA Castle Medical Center Rose Choy Kahi Mohala Behavioral Health Kathleen Deknis, RN, MPH Home Health by Hale Makua Karen Fernandez Wahiawa General Hospital Mark Forman, JD Hawaii Medical Service Association Foundation Loretta J. Fuddy, ACSW, MPH State of Hawaii Department of Health 10
11 Robert Hirokawa, DrPH Hawaii Primary Care Association Mari Jo Hokama Kahi Mohala Behavioral Health Fred Horwitz Life Care Center of Hilo Susan Hunt, MHA Hawaii Island Beacon Community Richard Keene The Queen s Health Systems Jeannette Koijane, MPH Kokua Mau Jay Kreuzer Hawaii Health Systems Corporation Greg LaGoy, ND, MBA Hospice Maui Bernadette Ledesma, MPH Pearl City Nursing Home Vince Lee, ACSW, MPH Hawaii Health Systems Corporation Wesley Lo Hawaii Health Systems Corporation Pat Miyasawa Shriners Hospitals for Children Honolulu R. Don Olden Wahiawa General Hospital Quin Ogawa Kuakini Health System Jason Paret, MBA North Hawaii Community Hospital Ginny Pressler, MD, MBA, FACS Hawaii Pacific Health Hilton Raethel, MBA, MHA Hawaii Medical Service Association Hardy Spoehr Papa Ola Lokahi Jerry Walker Hawaii Health Systems Corporation Katherine Werner Ciano, MS, RN North Hawaii Hospice Ken Zeri, RN, MSN Hospice Hawai`i Lori Miller Kauai Hospice Marie Ruhland, RN Home Healthcare Services of Hilo Medical Center Neill Schultz Castle Medical Center Corinne Suzuka, RN, BNS, MA St. Francis Home Care Peter Sybinsky, PhD Hawaii Health Information Corporation Ty Tomimoto Rehabilitation Hospital of the Pacific Sharlene Tsuda The Queen s Health Systems Stephany Vaioleti, LSW, JD Kahuku Medical Center Sharon Vitousek, MD North Hawaii Outcomes Project Consultants Healthy Communities Institute The Healthy Communities Institute (HCI) mission is to improve the health, environmental sustainability and economic vitality of cities, counties and communities worldwide. The company is rooted in work started in 2002 in concert with the Healthy Cities Movement at the University of California at Berkeley. HCI offers a spectrum of technology and services to support community health improvement. HCI s webbased dashboard system makes data easy to understand and visualize. The web system and services enable planners and community stakeholders to understand all types and sources of data, and then take concrete action to improve target areas of interest. HCI has over 100 implementations of its dashboard for clients in 40+ states. The HCI team is comprised of experts in public health, health informatics, and health policy. The services team provides customized research, analysis, convening, planning and report writing to meet the organizational goals of health departments, hospitals, and community organizations. To learn more about Healthy Communities Institute please visit 11
12 Storyline Consulting Storyline Consulting is dedicated to serving and enhancing Hawaii s nonprofit and public sectors. Storyline provides planning, research, evaluation, grant writing, and other organizational development support and guidance. By gathering and presenting data and testimonies in a clear and effective way, Storyline helps organizations to improve decision making, illustrate impact, and increase resources. To learn more about Storyline Consulting please visit Hospital Community Benefit Team and Goals Pali Momi Medical Center formed a Community Benefit Team to guide the hospital's CHNA and Implementation Strategy. The Team includes the following internal participants: Chief Executive Officer Vice President Patient Services, Chief Nurse Executive Chief Medical Officer Financial Partner Director Case Management Director Philanthropy Director Cardiac Services Director Quality and Patient Safety This internal working group has access to and a reporting relationship with the Pali Momi Medical Center Board and has opportunity to work in partnership with the other Hawaii Pacific Health facilities. Working together with community partners to improve community health guides the team's efforts Definition of Community + Map The hospital service area is defined by a geographical boundary of West Oahu, including the Census County Divisions of Ewa, Wahiawa, Waialua, and Waianae. This portion of Honolulu County will serve as the unit of analysis for this Community Health Needs Assessment. Hence, the health needs discussed in this assessment will pertain to individuals living within this geographic boundary. Whenever data specific to these sub geographies of Honolulu County was not available, Honolulu County data was utilized. The specific area served by Pali Momi Medical Center is indicated in Figure
13 Figure 1.1 Service Area Map 13
14 2 Methods The starting point for this needs assessment is a summary of secondary or core indicator data, which applies a systematic and quantitative method of comparing the relative severity of health indicators across 20 topic areas. When possible, other data are considered, including rates of hospitalization due to preventable causes, to more closely examine the most severe health needs and their impact on health care utilization. Data specific to West Oahu are presented when available. The secondary data findings are further informed by collected primary data. Individuals with special knowledge regarding the health needs of the community, including those with expertise in public health and community health, were interviewed through a key informant interview process. An online survey collected additional opinions from community residents. The quantitative, secondary data is then combined with the knowledge of key informants who have awareness of health needs specific to their community and highlighted with resident opinions on community health concerns. 2.1 Core Indicator Summary Data Sources The core indicators included in this summary originated from Hawaii Health Matters ( a publicly available data platform with a dashboard of over 100 indicators from over 20 sources. Hawaii Health Matters (HHM) was developed as a partnership between Hawaii Health Data Warehouse and Hawaii Department of Health, with technology provided by Healthy Communities Institute. The core indicators cover health outcomes, behaviors that contribute to health, and other factors that are correlated with health. The secondary data available on HHM is continuously updated as sources release new data. The data included in this summary is as of October 17, 2012, and may not reflect data currently on the site. Additional data specific to race, gender, and age subgroups was obtained directly from Hawaii Department of Health. West Oahu values were calculated as a roll up of the following Census County Divisions (CCD): Ewa, Wahiawa, Waialua, and Waianae. See Appendix A for a list of census tracts or parts included in each CCD. Each of the indicators was categorized into one of 20 topic areas, spanning both health and quality of life issues. All indicators, including measurement date, sources and topic area assignment, are included in the Appendix of this report Comparisons: Analytic Approach The status of Honolulu County was assessed one indicator at a time using up to four comparison methods. 1. First, Honolulu County was compared geographically, to the rest of the state as well as the nation. Comparisons of Honolulu County to the United States, the state average, and the county in Hawaii with the best value for the indicator were averaged (see Appendix A for more details and an example). This average was used to determine whether Honolulu County compares poorly to other geographies. 2. The second comparison examined the trend of the data. A line of best fit was calculated for all available data points, and the slope of the line was used to determine the average percent change per year. If Honolulu County s indicator value had worsened by at least 2.5% of the baseline value per year, the trend for the indicator was considered poor. 3. A third comparison measured disparities among sub populations in Honolulu County. If one subpopulation had a value at least four times worse than another for the indicator, then the disparity measurement was considered poor. 4. Finally, the indicator value was compared to nationally recognized Healthy People 2020 (HP2020) benchmarks. The indicator was considered poor if Honolulu County had not yet met 14


15 the target set by the U.S. Department of Health and Human Services (see Appendix A for more information on HP2020 benchmarks). Figure 2.1: Comparison Methods As many comparisons as possible were applied to each indicator. The possible comparisons varied for each indicator depending on the availability of data. Geographic comparisons were only possible when national data was available for the same indicator and time period. Trend comparisons were only possible when at least three periods of measure were available to avoid misinterpreting slight changes between two periods. The availability of sub population data varied by indicator, and so disparity comparisons were incorporated whenever possible. Finally, HP2020 benchmarks only existed for a subset of the indicators included in the summary. Please see Appendix A for more details and examples of this process Indicator and Topic Area Scoring After the status of all possible comparisons was assessed, indicators were aggregated into their respective topic areas. The total number of poor comparisons was divided by the total possible comparisons within the topic area to calculate the topic area score. This score measures the proportion of poor comparisons within the topic, and ranges from zero to one. Scores were not calculated for topic areas that had one or zero indicators, as these areas were deemed to lack an adequate number of indicators. The top ten topic areas with the highest scores were used to guide primary data collection. Please see Appendix A for more details and an example of this process. Because core indicator data specific to West Oahu was only available for a select subset of indicators from the American Community Survey, these values were not included in the core indicator summary scores. When available, these data are presented as a closer look at the population living in West Oahu, following descriptions of Honolulu County indicators Shortage Area Maps Core indicator data for relevant topic areas was supplemented with maps illustrating the following types of federally designated shortage areas and populations: Medically underserved areas and/or populations Mental health professional shortage populations Criteria for medically underserved areas and populations can be found at: 15
16 Criteria for health professional shortage areas can be found at: Maps of shortage areas and populations were based upon shapes generated using the Community Issues Management site s mapping tool: network.org/cim/tools/ Maps were further customized by Healthy Communities Institute. 2.2 Hospitalization Rates While the core indicator summary included several unadjusted hospitalization rate indicators, further risk adjusted rates were obtained for comparison between geographies of varying population makeup. Rates were provided by Hawaii Health Information Corporation (HHIC), and are defined by the Agency for Healthcare Research and Quality (AHRQ) as a set of measures that can be used to identify quality of outpatient care, which can potentially prevent the need for hospitalization. Risk adjustment attempts to account for differences in indicators across providers and geographic areas that are attributable to variations in patient mix. AHRQ s risk adjustment methodology employs multivariate ordinary least squares regression to estimate an expected value of each indicator an area would exhibit with an average case mix. The model adjusts for patient demographics, including age, sex, all age sex combinations, All Payer Refined DRGs (a refinement of CMS s DRGs that additionally classifies non Medicare cases) and severity of illness. HHIC applies AHRQ s risk adjustment methodology to further control for the top four dominant races in Hawaii, as determined by the Hawaii State Department of Health s Hawaii Health Survey. Risk adjustment coefficients are estimated using the Healthcare Cost and Utilization Project s (HCUP) State Inpatient Databases (SID). Please see for a complete definition of indicators. Because the area of mental health was not well represented in the core indicator summary, HHIC also provided unadjusted rates of hospitalization for any mental health related primary diagnosis. Sub county hospitalization rates are included for Hospital Service Areas (HSA), which were defined in 1995 by hospital CEOs and are comprised of contiguous zip codes surrounding a hospital s self defined service area. Please see Appendix B for a list of the zip codes contained within each HSA. Also included in Appendix B are unadjusted rates for age, gender, and race/ethnicity sub populations. The inclusion of these rates in the Findings discussion is limited due to uncertainties in the comparability of these unadjusted rates with the risk adjusted rates. However, the proportion of hospitalizations by age and gender are presented for West Oahu by aggregating hospitalization counts for Leeward Oahu and Wahiawa hospital service areas. Race/ethnicity specific rates are unavailable at the sub county level. All rates and counts are based upon patient residence, and values were suppressed if there were fewer than 10 cases. Population estimates are based on the U.S. Census Bureau, Population Division, Intercensal Estimates of the Resident Population for Counties of Hawaii and Hawaii State Department of Health, Office of Health Status Monitoring, Hawaii Health Survey. Sub county demographic counts are based on estimates/projections provided by Pitney Bowes Business Insight, Population estimates by race were provided by the Hawaii State Department of Health, Office of Health Status Monitoring, Hawaii Health Survey Hospitalization rate area maps were created by HCI using HHIC provided Hospital Service Area maps, where darker shading of Hospital Service Areas reflects higher rates. 16
17 2.3 Key Informant Interviews In order to supplement the quantitative findings, key informants were interviewed to further assess the underlying drivers for health outcomes, current community efforts, and obstacles to health. These key informants were chosen by the HAH Advisory Committee on November 7 8, 2012 through a structured nomination and selection process, which followed a thorough review of the preliminary core indicator data. Advisory members nominated community members with expertise in public health, in the top ten topic areas from the core indicator analysis, as well as in those topic areas where there were data gaps. Key informants were also nominated for their knowledge of vulnerable populations, such as low income or more adversely impacted racial/ethnic groups. After the nomination process, the advisory members prioritized the list through a voting process. The key informant interview process was part of a larger state wide CHNA effort in which a total of 105 community experts were nominated, then prioritized down to a list of 75. The remaining 30 nominated key informants were maintained on an alternate list, in the event that a key informant was not available. Roughly 15 key informants were allotted for each of the four counties and for the overall state perspective. For this CHNA report, 17 key informants were interviewed for their specific knowledge of the health needs of Honolulu County. When certain topic areas were lacking an interview specific to Honolulu County, findings from the state wide perspective were included. The interviews were conducted by local consultants, Storyline Consulting. The interviews took place between November 19, 2012 and January 2, 2013 and lasted minutes in length. Most interviews took place by phone; a few took place in person. Storyline Consulting typed notes from the interviews during the conversation, capturing the bulk of the conversation verbatim. Interview notes were then condensed and entered into a data collection spreadsheet. The information obtained from these interviews was incorporated into this report in three ways. A summary qualitative analysis tool called a word cloud was produced using TagCrowd.com to identify the most common themes and topics. Words or phrases that were mentioned most often display in the word cloud in the largest and darkest font (see Figure 3.18). Next, input from the key informants was included in each relevant topic area in Section 3.2. Lastly, any recommended community programs or resources are referenced in Appendix D: Identified Community Resources. A Key Informant Interview Guide was developed to guide the interviews. Storyline Consulting adapted the interview guide to best suit Hawaii s context, unique ethnic/racial profile, and culture. The questions used in the guide are listed below: Q1: Could you tell me a little bit about yourself, your background, and your organization? Q2: You were selected for this interview because of your specialized knowledge in the area of [topic area]. What are the biggest needs or concerns in this area? Q3: What is the impact of this health issue on low income, underserved/uninsured persons? Q4: Could you speak to the impact on different ethnic groups of this health concern? 17
18 Q5: Could you tell me about some of the strengths and resources in your community that address [topic area]? Q6: Are there opportunities for larger collaboration with hospitals and/or the health department that you want us to take note of? Q7: What advice do you have for a group developing a community health improvement plan to address these needs? Q8: What are the other major health needs/issues you see in the community? Q9: Is there anything else you d like us to note? 2.4 Community Survey An online survey was used to collect community opinions on the greatest health needs for Honolulu County. The survey link was virally distributed by members of the HAH Advisory Committee and was posted on several local websites, including The survey was open from November 28 to December 24, Because the survey sample is a convenience sample, it is not expected to be representative of the population as a whole. Survey respondents provided select personal characteristics, including gender, age, sex, and zip code of residence and whether or not the resident works in the health field. Responses which indicated a zip code residence within the Leeward Oahu or Wahiawa hospital service areas (see Appendix B for included zip codes) are included in this report. Residents were asked to rank the top ten topic areas from the core indicator analysis in order of importance for their community, as well as informing us about other topic areas of concern. Respondents were also asked which racial/ethnic groups they felt experienced more health problems than average. Lastly, there was an open ended question asking the resident if there was anything else they would like to share with us, in terms of health concerns in their community. Opinions gathered with this survey are included in this report as highlights, called Voices from the Community, in describing notable areas of need. 18

19 3 Community Health Needs Assessment Findings 3.1 Demographics The demographics of a community significantly impact its health profile. Different ethnic, age, and socioeconomic groups may have unique needs and take varied approaches to health. This section provides an overview of the demographics of West Oahu, both across the region and by Census County Division (CCD). Additional details are provided at the sub CCD level to describe economic conditions and educational attainment throughout the Ewa CCD, the place of residence for many of the patients served by Pali Momi Medical Center. Comparisons to Honolulu County are also provided for reference. All estimates are sourced from the U.S. Census Bureau s American Community Survey unless otherwise indicated. Figure 3.1: Population by West Oahu CCD, Population In , West Oahu had an estimated population of 421,534, with a heavy concentration of residents in the Ewa region. The population distribution across the West Oahu is shown in Figure 3.1. As measured by the decennial Census, West Oahu grew by 16.1% between 2000 and Ewa experienced the fastest growth in the decade, at 18.7%. Waialua was the only region that experienced a decrease in population. 1 Figure 3.2: Population Change, Age As seen in Figure 3.3, the age distribution of West Oahu in was slightly younger than but overall very similar to that of Honolulu County. The median age of each CCD in West Oahu was younger than the median age in the county overall (Table 3.1) U.S. Census 19


20 Figure 3.3: Population by Age: Honolulu County and West Oahu, Table 3.1: Median Age, Honolulu County Ewa Wahiawa Waialua Waianae Median Age The youngest median age (27) was found in Wahiawa, which had a larger proportion of young adults aged than the rest of West Oahu. The population of Waianae, which had the second youngest median age of 30, included a large proportion of children and teens aged Figure 3.4: Population by Age: West Oahu CCDs,
 are")
.")
21 Racial/Ethnic Diversity The race/ethnic distribution of West Oahu is also similar to that of Honolulu County overall. In Figure 3.5 and Figure 3.8 below, the race groups displayed to the left of the blue line include residents reporting one race only, while residents reporting two or more races and Hispanic/Latino ethnicity (of any race) are shown to the right of this line. Figure 3.5: Population by Race/Ethnicity: Honolulu County and West Oahu, The largest single race group in West Oahu in was Asian at 41.8%. The majority of the Asian population is Japanese or Filipino, as seen in Figure 3.7 (which includes all residents reporting a race of Asian only, regardless of Hispanic/Latino ethnicity). West Oahu has a larger Native Hawaiian/Other Pacific Islander population (10.2%) than the rest of the island. Native Hawaiians, at 5.3% of the total population, make up the largest share of the Native Hawaiian/Other Pacific Islander single race group. Figure 3.7: Breakdown of Population Reporting Race of Asian Only, Figure 3.6: Breakdown of Population Reporting Race of Native Hawaiian/Other P.I. Only,

. In West Oahu, Ewa had the largest foreign born population (19.")
22 Although West Oahu s race/ethnicity distribution was similar to Honolulu County, substantial variations were observed across the CCDs in West Oahu. Proportionally, Waianae had much larger mixed race and Native Hawaiian or Other Pacific Islander populations than the rest of the West Oahu region and the rest of Honolulu County. Figure 3.8: Population by Race/Ethnicity: West Oahu CCDs, A lower percent of West Oahu was foreign born compared to Honolulu County in All of West Oahu s CCDs had lower proportions of foreignborn residents than Honolulu County (19.5%). In West Oahu, Ewa had the largest foreign born population (19.1%); at the other end of the spectrum, only 6.9% of Waianae residents were foreign born. Figure 3.9: Foreign Born Population, Figure 3.10: Linguistic Isolation, A lower percent of West Oahu households were linguistically isolated compared to Honolulu County: 5.0% of households reported that all of its members ages 14 and over had some difficulty speaking English, contrasted with 7.6% in Honolulu County overall. 22

23 3.1.2 Economy Per capita income in West Oahu is lower than the Honolulu County average, at just $26,410 vs. $29,516 in Within the region, Wahiawa and Waianae had the lowest income levels. Ewa, the most populous CCD in West Oahu and the home of many Pali Momi patients, had the highest income levels, both when measured per capita and when measured by household. Figure 3.11: Per Capita and Median Household Income by West Oahu CCDs, Figure 3.12: Ewa Subdivisions However, wealth is unevenly distributed across Ewa. Geographic subdivisions within Ewa are presented in Figure Waipahu and Mililani, the two landlocked subdivisions, had the lowest per capita income and highest levels of poverty in Ewa, and perform poorly overall on the economic indicators presented in Table Table 3.2: Economic Indicators for Ewa Subdivisions, % Population Living in Poverty % Children in Households Receiving Assistance % Households Receiving SNAP % Civilian Labor Force Unemployed Per Capita Income Ewa $28, Waipahu $24, Mililani $26, Kapolei Makakilo $28, Hickam Pearl City $29, Ewa Kalaeloa $33, From the Family Health Services Division, Hawaii Department of Health Report: State of Hawaii Primary Care Needs Assessment Data Book 2012, July

. Figure 3.")
24 As a whole, West Oahu had lower or equal levels of poverty across all age groups compared to Honolulu County (Figure 3.13). As with income, however, large geographic disparities exist within West Oahu. Waianae and Wahiawa had poverty levels well above those of the West Oahu region and Honolulu County. Waianae, which counts among its population a large share of children, had a child poverty level over twice that of the West Oahu region and the county. Adults ages 65 and over in West Oahu experienced the highest poverty rates in Wahiawa, which has a younger population overall relative to the West Oahu and the county (Figure 3.14). Figure 3.13: Poverty in Honolulu County and West Oahu, Figure 3.14: Poverty by West Oahu CCDs, Certain race/ethnicity groups in West Oahu are also more affected by poverty, as seen in Figure Overall, the Other and Native Hawaiian or Other Pacific Islander populations had the highest poverty rates at 17.4% and 15.7% respectively in These two race/ethnic groups also had the highest poverty levels when considering children, families, and adults over age 65. The two least impoverished groups overall were Asian (4.6%) and White (7.2%). It is important to note that federal definitions of poverty are not geographically adjusted, so the data may not adequately reflect the proportion of Hawaii residents who struggle to provide for themselves due to the high cost of living in the state. 24
 was almost equal to Honolulu County s 89.8%. Within the populous Ewa region, residents of Ewa Kalaeloa had the highest levels of educational attainment at the high school level, while Waipahu residents had the lowest, with just 84.")

25 Figure 3.15: Poverty by Race/Ethnicity in West Oahu, Education The percent of West Oahu residents aged 25 and over who had at least a high school degree in (89.8%) was almost equal to Honolulu County s 89.8%. Within the populous Ewa region, residents of Ewa Kalaeloa had the highest levels of educational attainment at the high school level, while Waipahu residents had the lowest, with just 84.7% of residents with a high school degree or higher (Table 3.3). 3 Figure 3.16: Educational Attainment among Adults 25+ by West Oahu CCD, Table 3.3: Adults 25+ with at a High School Degree or Higher: Ewa Subdivisions, Ewa 90.7% Waipahu 84.7% Mililani 91.6% Kapolei Makakilo 92.5% Hickam Pearl City 91.8% Ewa Kalaeloa 95.0% Just 24.6% of the West Oahu 25 andover population had at least a bachelor s degree, compared to Honolulu County s 31.1%. Within the region, residents of Waianae had the lowest levels of educational attainment: only 10.3% of residents 25 and older there received at least a bachelor s degree, less than a third of the county value. 3 From the Family Health Services Division, Hawaii Department of Health Report: State of Hawaii Primary Care Needs Assessment Data Book 2012, July
26 3.2 Overview of Needs Assessment Core Indicator Summary Ninety seven indicators of health drivers and outcomes were included in the systematic review of secondary data for Honolulu County. Table 3.4 shows the weighted ranking scores for each topic area, from most severe to least. Table 3.4: Core Indicator Summary Scores Topic Area Indicators Score Rank Heart Disease & Stroke Education Maternal, Fetal & Infant Health Immunizations & Infectious Diseases Exercise, Nutrition, & Weight Cancer Substance Abuse & Lifestyle Respiratory Diseases Injury Prevention & Safety Family Planning Mental Health & Mental Disorders Economy Environment Access to Health Services Transportation Oral Health Diabetes 1 n/a n/a Disabilities 0 n/a n/a Older Adults & Aging 1 n/a n/a Social Environment 1 n/a n/a The ranking of scores for the topic areas provides a systematic way to assess a large number of indicators across many topic areas. Because the absolute and relative scores are influenced by the number of available inputs for the scoring equation, scoring differences can arise due to availability of data, so it is important to consider the scores in the context of the primary data and the interrelatedness of many of the topic areas. Findings of both quantitative and qualitative nature are presented below by topic area, along with a discussion of what can be learned from these results. For a complete list of indicators included in the core indicator summary, see Appendix A. Hospitalization Rates Risk Adjusted Hospitalization Rates due to Preventable Causes in the Leeward Oahu and Wahiawa hospital service areas for the most recent year available, 2011, are presented in Table 3.5. The specific causes of hospitalization with the three highest overall rates are Mental Health, COPD or Asthma in Older Adults, and Heart Failure. Prevention Quality Indicator (PQI) Composite Rates are a summary of preventable causes as described in the table footnote. Specific causes of hospitalization are further discussed in applicable topic areas below. All hospitalization rates are listed in Appendix B. 26
27 Table 3.5: Hospitalization Rates due to Preventable Causes in West Oahu Hospital Service Areas, 2011 Leeward Oahu Wahiawa Preventable Cause Cases Risk Adjusted Rate Risk Adjusted Rate Cases per 100,000 per 100,000 Mental Health* Heart Failure Bacterial Pneumonia COPD or Asthma in Older Adults (Ages 40+) Low Birth Weight** Urinary Tract Infection Diabetes Long Term Complication Dehydration Diabetes Short Term Complication Perforated Appendix*** Hypertension Rate of Lower Extremity Amputation <10 Angina Without Procedure <10 Asthma in Younger Adults (Ages 18 39) <10 Uncontrolled Diabetes <10 Composite Hospitalization Rates PQI Composite Acute Conditions PQI Composite Chronic Conditions PQI Composite * Rate for this cause is unadjusted **Rate is per 100 live births ***Rate is per 100 appendicitis admissions Included in Acute Condi ons Composite Rate Included in Chronic Conditions Composite Rate Compared to other service areas in Honolulu, Leeward Oahu and Wahiawa had the highest chronic composite hospitalization rates and highest total composite hospitalization rates in The acute composite hospitalization rate was higher in Kahuku compared to both West Oahu services areas. 27


28 Figure 3.17: PQI Composite Hospitalization Rates Key Informant Interviews The word cloud below illustrates the Honolulu County needs mentioned most often by key informants, where the size and shading of the word reflects the frequency of its use. The concerns include both those pertaining to the informants specific areas of expertise, as well as other issues they see in the community as a whole. Interviews are summarized by the topic area covered by the interviewees expertise in sections through Figure 3.18: Key Informant Interview Word Cloud 28
29 Community Survey During the period of November 28 to December 24, 2012, 32 surveys were completed online by West Oahu residents. As the survey was a convenience sample, it was not expected to be representative of the population as a whole. Of the respondents, 78.1% were female, 21.9% male. Over half of respondents were between the ages of 45 and 64; 34.4% were under 45 and 6.3% were 65 or older. More than two thirds of respondents were Community Health or Public Health Professionals (68.8%). Highest Ranked Topic Areas Exercise, Nutrition, & Weight Education Cancer Heart Disease & Stroke Substance Abuse & Lifestyle From the topics that scored highest in the core indicator data summary, residents ranked the topic areas to the left highest. From the topic areas that did not score high based on core indicator data, five were selected as also being a concern by at least 50% of respondents. Other Areas of Concern Older adults & Aging Diabetes Access to Health Services Economy Transportation Mental Health & Mental Disorders Figure 3.19: High Risk Race/Ethnicity Groups Identified through Community Survey The race/ethnic group most commonly reported as experiencing more health problems than average was Native Hawaiians, followed by Other Pacific Islanders. Please see highlights throughout this report of respondent opinions titled Voices from the Community. 29
30 The sections below, , will describe the findings by topic area in the following format: Core Indicators and Supplemental Information This section is more extensive for those topics where need demonstrated in the core indicator summary was greatest. The top ten scoring topic areas include a list of highlights followed by a table including the indicators, most recent value, and how Honolulu County fared across the four comparison methods. Green checkmarks indicate that the comparison was good, red X s indicate a poor comparison, and a blank cell indicates no comparison was possible. Further information about core indicators is included in Appendix A. When possible, data is supplemented by West Oahu values and additional information obtained from previous needs assessments and reports. Hospitalization Rates As applicable, preventable hospitalization rates are compared to values across the County of Honolulu. All hospitalization data for Leeward Oahu and Wahiawa, with a description of the Hospital Service Areas, are included in Appendix B. Key Informant Interviews The information gleaned from key informants who were interviewed for their expertise in the relevant topic area is summarized in a table. Main points made by interviewees are organized by the needs and concerns for Honolulu County; the impact on low income, underserved or uninsured, and/or race or ethnic groups; and the opportunities and strengths that they have identified in their community. Summary All findings are summarized for the topic with a focus on common themes. 30
 and adults aged 18 24 (15.5%).")


31 3.2.1 Access to Health Services Core Indicators and Supplemental Information Core indicators for access to health services in Honolulu County compare favorably to the rest of the state and the U.S. Although all three indicators in this topic are trending in a good direction, there are race and age disparities among adults for health insurance coverage. While 7.2% of all adults in the county had no insurance coverage in 2010, the percent was higher for Other Pacific Islander adults (16.9%) and adults aged (15.5%). Some areas and populations in Honolulu County have been designated as medically underserved by the Health Resources and Services Administration. Figure 3.20 shows the geographic location of these areas, with included census tracts. Within the Pali Momi Medical Center service area, Waianae is considered to be an underserved area according to this designation. While HRSA has also designated some parts of Hawaii as primary care health professional shortage areas, there are none in Honolulu County. Key Informant Interviews Needs/Concerns *Primary care shortage and access challenges *Access challenges for rural parts of Oahu are underestimated *Shortage in specialty care for heart disease and stroke *Need a statewide health information exchange to connect all providers and payers Impact on Low Income, Underserved/Uninsured, Race/Ethnic Groups *Rural families sometimes need to take off of work to receive Honolulu based care; if unable to get to Honolulu an ambulance is called *Low income people disproportionately affected by primary care shortage *Native Hawaiians and Micronesians are most impacted, due to socioeconomic disadvantage Figure 3.20: Federally Designated Medically Underserved Areas/Populations by Census Tracts Opportunities/Strengths *Community health centers are making a huge impact on indigent population and have immense potential to expand reach as physician shortage worsens Summary Access to health services is a particular challenge in West Oahu s rural areas, and certain sub populations face further challenges in receiving care. Waianae, which has the highest proportion of residents living below poverty, has been designated as medically underserved by federal standards. The residents in most need of improved access to care are the socioeconomically disadvantaged, which includes many residents of Waipahu. Key informants suggest that community health centers are best positioned to assist hard to reach populations. Voices from the Community [One concern for the community is that there is] not enough staff for inpatient care. 31

 is unmet The proportion of adults aged 50 and older who have had a blood stool test within the past two years decreased from 44.1% in 2003 to 26.1% in 2010 Table 3.")
32 3.2.2 Cancer Core Indicators and Supplemental Information While there are many drivers of cancer, early detection and steps toward prevention can lessen the burden on a community s health. In Honolulu County, the incidence and death rates due to several different types of cancers ranked this area relatively high: Regarding screenings: The HP2020 target for women who have had mammograms within the past two years (81.1%) is unmet The HP2020 target for women aged 18 and older who have had a pap test in the past three years (93.0%) is unmet The proportion of adults aged 50 and older who have had a blood stool test within the past two years decreased from 44.1% in 2003 to 26.1% in 2010 Table 3.6: Core Indicators Cancer Regarding new cases and mortality rates: Breast cancer incidence is in the worst quartile of US counties and higher than the state average of cases per 100,000 females. The death rate is highest for Hawaiian/Pacific Islander women (56.0 deaths/100,000 females) Cervical cancer incidence compares poorly to other Hawaii counties, and has increased from 7.6 cases/100,000 females in to 8.3 in Colorectal cancer incidence compares poorly to the nation (48.5 cases per 100,000 population) and the state (48.6 cases per 100,000 population 32
33 Key Informant Interviews Needs/Concerns *Needs are increasing as the elderly population grows and experiences more longevity *Need for work in the communities, not just universities and cancer centers Impact on Low Income, Underserved/Uninsured, Race/Ethnic Groups *Culturally appropriate communication is needed for Hawaiian communities that tend to be low income and therefore more affected *Micronesians accept chemotherapy at last minute after having diagnosis a long time; death perceived to be attributed to chemotherapy. Opportunities/Strengths *Increase support for community health centers that pick up the slack on underserved *Hiring within the community empowers residents, promotes economic health, and gathers better information because people know their communities Summary The burden of many types of cancers in Honolulu County is greater than other Hawaii counties and the nation. Cancer screening for women has not met national targets, and colon cancer screening has decreased in recent years. Cultural barriers prevent proper care from reaching underserved and highrisk populations, particularly Compact of Free Association (COFA) migrants, Hawaiians/Pacific Islanders, and new immigrant groups. Community level interventions would be most effective in providing prevention, education, and early detection Diabetes Core Indicators and Supplemental Information While diabetes as a topic area did not rank high in the core indicator summary due to a limited number of available indicators for the topic, the proportion of adults with diabetes in Honolulu County (8.5%) is the highest rate in the state. The groups most impacted by high diabetes rates are Native Hawaiian (12.3%) and Filipino (10.9%) adults. Hospitalization Rates In 2011, all hospitalization rates due to complications of diabetes were higher in Leeward Oahu than any other hospital service area in Honolulu County. Wahiawa had the lowest hospitalization rate due to short term complications of diabetes and second lowest rate due to long term complications of diabetes compared to elsewhere in Honolulu County. 33

,")


34 Figure 3.21: Hospitalization Rates due to Diabetes, 2011 Across Leeward Oahu and Wahiawa (West Oahu), short term complications of diabetes hospitalizations were approximately proportional to the population make up by age and gender. Hospitalizations due to long term complications of diabetes, uncontrolled diabetes, and the rate of lower extremity amputations were disproportionately high for adults 65 and older and for men. Figure 3.22 Percent of Diabetes Related Hospitalizations by Age and Gender, West Oahu,
35 Key Informant Interviews Needs/Concerns *National trend is that 1:3 children will have Type II diabetes; in Hawaii, much higher rate of 1:2 children *Childhood obesity will lead to diabetes becoming an even bigger problem in the future; the amount of resources spent on diabetes will double *Diabetes is going undiagnosed in many Hawaiians Impact on Low Income, Underserved/Uninsured, Race/Ethnic Groups *Native Hawaiians have a higher rate of diabetes, and those living in rural areas have little access to specialists *Outlying areas, low income population high rates could be lack of overall knowledge of assessment of body and lack of access to critical care *Higher prevalence for diabetes among Native Hawaiians, other Pacific Islanders, Japanese, and Filipinos and we have such a blend of those bloodlines in Hawaii. *Difficulties in translating messages to Samoan and other Pacific Island languages Opportunities/Strengths *Work with American Heart and American Cancer Associations to combat obesity *Work with schools to increase physical activity *Ask legislature to put physical education back in schools *Sports teams and love of sports in communities can be entryway to talking about proper nutrition and health Summary The prevalence of diabetes in Honolulu County currently affects a large number of adults and is projected to increase in severity due to childhood obesity. Diabetes greatest impact is on low income residents with low access to medical care, many of whom live Waianae, Wahiawa, Waialua, and Waipahu. Hospitalization rates in Leeward Oahu suggest poor disease management in this area leading to more severe disease and inpatient based care. Reducing the impact of diabetes in West Oahu will require universal and effective primary care management Voices from the Community [One community issue is the] dwindling resources for people who require hemodialysis. of those with disease and preventing new disease by combatting obesity through a multi level approach that can effectively include, schools, employers, city planning, and community based organizations that promote physical activity across generations. 35
36 3.2.4 Disabilities Supplemental Information There was no data included in the core indicator summary specific to disabilities (please see Section for a discussion on data gaps). Based on data from the 2011 American Community Survey, the proportion of persons in Honolulu County with a disability (10.3%) is lower than the national average of 12.1%. Among people aged 20 to 64 with a disability, 24.1% were living below poverty in The most common type of difficulty is ambulatory (serious difficulty walking or climbing stairs), as seen in Table 3.7. Table 3.7: Percent of Persons with a Disability, Honolulu State County Persons with a Disability Hearing Difficulty Vision Difficulty Cognitive Difficulty (ages 5+) Ambulatory Difficulty (ages 5+) Self Care Difficulty (ages 5+) Independent Living Difficulty (ages 18+) Children with a Disability Includes all ages unless noted Figure 3.23: Percent of Persons with a Disability by Age and Race/Ethnicity: Honolulu County, One consideration of this needs assessment should be the identification of two priorities for children with special health care needs in a recent statewide needs assessment of Maternal and Child Health Needs 5 : Promote the identification of children with developmental delay Promote the transition of adolescents with special health care needs to adult health care Furthermore, given the large proportion of aging adults 65+ with a disability (33.5%), 4 the living needs (including housing, transportation, health care, and social support) of the aged and disabled population must be strongly considered in community planning. Summary The population of West Oahu living with a disability must not be ignored in a needs assessment as their needs may require special attention. Adults with a disability may require special housing, transportation, and health care services. Early identification of needs among children is needed to lessen the burden of disability on their health and wellness, and special focus may be needed to ensure a smooth transition from pediatric to adult health care. Although there are fewer persons living with a disability compared to the nation, a much larger percentage of disabled persons live in poverty in Honolulu County compared to the population at large. Socioeconomic constraints put this population at further disadvantage. 4 U.S. Census, American Community Survey, 2011 Estimates 5 From the Family Health Services Division, Hawaii Department of Health Report: State of Hawaii Maternal & Child Health Needs Assessment Summary, November NASummary
 and 18.3% (Native Hawaiian and Other Pacific Islanders).")

37 3.2.5 Economy Core Indicators and Supplemental Information Economic conditions are highly correlated with health. Although Honolulu County has a relatively low poverty rate compared to the U.S. at 8.8%, the poverty rate for some subpopulations is as high as 24% (American Indian and Alaska Natives) and 18.3% (Native Hawaiian and Other Pacific Islanders). The resulting income inequality is worse in Honolulu County than other Hawaii counties. 6 As seen in Section 3.1.2, the highest poverty rates in West Oahu are found in Waianae and Wahiawa. However, the majority of West Oahu residents living below poverty reside in Ewa, where 17,991 people were living below poverty in Similar patterns are found across all economic indicators within West Oahu. Moreover, while 16.0% of children Figure 3.24: Percent of Population Living Below Poverty Level, Map created with Community Issues Management tool: network.org/cim/ in Honolulu County live in households receiving government assistance, among children in Waianae the rate is 49.2% and in Waipahu (Ewa subdivision) the rate is 17.9%. 7 Core Indicator Waianae Wahiawa Waialua Ewa West Oahu Unemployment Rate 12.9% 8.6% 9.4% 4.7% 6.0% Households with Cash Public Assistance Income Renters Spending 30% or More of Household Income on Rent 13.2% 4.4% 2.4% 3.1% 4.2% 63.8% 68.0% 54.6% 55.5% 58.1% Key Informant Interviews Although no key informants were interviewed specifically for their knowledge on the economy of Honolulu County, the effects of poverty on health were mentioned in several interviews spanning many topics. Please see a discussion of the impact of socioeconomics in Section 4.1. Voices from the Community [One community issue is] homelessness. Summary The economic disparity in West Oahu drives many of the health disparities discussed throughout this report; it is widely understood to be one of the determinants of health, along with education and the social environment. While this topic was not focused on in primary data collection, it was mentioned 6 U.S. Census, American Community Survey, Estimates 7 From the Family Health Services Division, Hawaii Department of Health Report: State of Hawaii Primary Care Needs Assessment Data Book 2012, July


38 many times for its relevancy to patterns of health access, health behaviors, and health outcomes. Income inequality is worse in Honolulu County than other Hawaii counties. The necessity of addressing health and quality of life needs among the 31,977 residents of West Oahu who have income below the federal poverty level 8 is critical in order to realize a healthy community. Furthermore, because federal definitions of poverty do not adjust for geographic variations in the cost of living, the data likely does not adequately reflect the proportion of residents who struggle to provide for themselves due to the high cost of living in Hawaii Education Core Indicators and Supplemental Information The core indicators for education reflect the disparity that exists in Honolulu County for opportunities towards economic and social advancement: The proportion of adults without a high school degree is 57% higher in Honolulu County compared to the Hawaii county with the best value (Hawaii County, at 3.5%). The groups with the highest proportions of low education are Native Hawaiian adults (11.8%) and Other Pacific Islanders (16.3%) The student to teacher ratio in Honolulu County is higher than other Hawaii counties, and in the worst quartile among all U.S. counties Table 3.8: Core Indicators Education Educational attainment varies within West Oahu. Among adults 25 and older, the lowest educational attainment rates are in Waianae and Waipahu (Table 3.3, Figure 3.16). Key Informant Interviews Needs/Concerns *High quality early childhood education is a critical foundation for later success, but the majority of young children do not have access to early education opportunities *Hawaii does not have universal preschool or mandatory kindergarten *Teen dropouts impact not only education but their ability to advocate for themselves around Impact on Low Income, Underserved/Uninsured, Race/Ethnic Groups *Challenges for low income students include nutrition, adequate sleep, and family dynamics that create depression *Teenagers are at risk with alcohol and drug use, chronic diseases like diabetes, and teen pregnancies *Culture is especially important to students who have lost their sense of belonging Opportunities/Strengths *Single most important thing to be done today is establishing an early learning base *Many after school support systems are in place today, which are incredibly important *Groups are making home visits to dropouts to re engage them in learning *Should develop village oriented 8 U.S. Census, American Community Survey, Estimates 38
39 health and wellness efforts to share success and accountability with community *Prioritize funding for children Summary Measures of education among adults show that Honolulu County is behind other Hawaii counties, especially among Native Hawaiian and Other Pacific Islander adults. A relatively large proportion of Waianae s population is Native Hawaiian and other Pacific Islander (Figure 3.8), and this area also has a very low rate of higher educational attainment. A poor student to teacher ratio and a lack of widely available early learning programs for children fuel disparity and prevent low income children from obtaining a quality education. With support, schools can guide children through special challenges with after school programs and education programs that emphasize students culture and interests. An early start to learning can be supported by financial support for preschool and kindergarten for all children in Honolulu County Environment Core Indicators and Supplemental Information The physical environment is a strength for Honolulu County, with good beach water quality and good grades for annual ozone air quality ( A ) and annual particle pollution ( B ) from the American Lung Association. However, there was more PBT and recognized carcinogens released in Honolulu County than elsewhere in the state in Summary While the environment did not arise as a great need for Honolulu County, it should be noted that environmental safety can vary within the county on a more local level for which data is not available. Air and water quality has the strongest health effect on the most vulnerable in the community, including children and older adults. Care should be taken to maintain stewardship of West Oahu s environment Exercise, Nutrition & Weight Core Indicators and Supplemental Information Healthy activity patterns, diet, and weight have profound effects on chronic disease. Core indicators signal that this area needs improvement in Honolulu County, as its core indicator summary score ranked 5 th highest. Notable findings include: Lower availability of healthy living resources, such as nutritious food stores and recreational facilities, compared to other Hawaii counties and the U.S. An increase in the obesity rate among adults, from 16.5% in 2003 to 21.9% in 2010 While only 40.9% of adults reported a healthy body weight in 2010, the proportion was lower still among Native Hawaiians (25.0%) and Other Pacific Islanders (7.0%). 39


40 Table 3.9: Core Indicators Exercise, Nutrition & Weight Furthermore, a recent statewide needs assessment of Maternal and Child Health Needs identified reducing the rate of overweight and obesity in young children ages 0 5 as a priority for children in the state. 9 Key Informant Interviews Needs/Concerns *Community sees obesity as greatest health challenge *Need for more required physical activity and education in schools *Though sugar sweetened beverages are less available in schools, parents bring in snacks not compliant with USDA policy *Need more walkable/bikeable communities less reliant on cars *Seeing pre diabetes in children and high blood pressure in young adults Impact on Low Income, Underserved/Uninsured, Race/Ethnic Groups *Low income families have limited access to healthy food outlets and recreational facilities *Stress caused by socioeconomic factors in low income children negatively impacts healthy behaviors *While obesity is widespread, it particularly affects low income, Native Hawaiian, and Micronesian populations *A high proportion of residents in Waianae are Native Hawaiian as well as low income Opportunities/Strengths *Addressing obesity is a legislative priority *Potential partnerships with insurance companies who have a vested, financial interest in keeping people healthy *Resources for community gardens in low income areas *Sports can be a basis for health promotion among children, i.e. emphasize healthy snacks and drinking water instead of soda 9 From the Family Health Services Division, Hawaii Department of Health Report: State of Hawaii Maternal & Child Health Needs Assessment Summary, November NASummary
![Voices from the Community [One community issues is] obese kids.](/docs-images/82/85695432/images/41-0.jpg "Summary Given its large impact on health outcomes, West Oahu residents would benefit from improved exercise patterns, eating habits, and weight control.")
41 Voices from the Community [One community issues is] obese kids. Summary Given its large impact on health outcomes, West Oahu residents would benefit from improved exercise patterns, eating habits, and weight control. The problem is apparent for adults in secondary data, and children are also affected at an early age by poor nutrition and activity. Native Hawaiians and other Pacific Islanders are especially in need of assistance to improve their lifestyles, which is especially difficult given the high poverty rate in this subpopulation. Key informants note that Waianae has a particularly high proportion of residents who are both low income and Native Hawaiian. Potential avenues for improving health in this area include enhanced education on nutrition and physical activity, increasing access to healthy foods and providing support and incentives for weight control Family Planning Core Indicators and Supplemental Information Family Planning is notable in Honolulu County due mainly to disparities: A severe disparity exists in the teen birth rate (129.6 births per 1,000 Hawaiian/Pacific Islander women aged years compared to 17.3 for Asian women aged 15 19), as well as the proportion of infants born to mothers with less than 12 years of education (12.5% among Hawaiian/Pacific Islanders vs. 1.2% for Black infants) Honolulu County has not met the HP2020 target of 56.0% for intended pregnancies Table 3.10: Core Indicators Family Planning Furthermore, a recent statewide needs assessment of Maternal and Child Health Needs identified reducing the rate of unintended pregnancy (including a focus on teen pregnancy) as a priority for Women and Infants. 10 Key Informant Interviews Needs/Concerns *Priority is increasing access to long acting, reversible Impact on Low Income, Underserved/Uninsured, Race/Ethnic Groups *Higher incidence of unwanted/unintended pregnancies Opportunities/Strengths *Community health centers are biggest assets for family planning 10 From the Family Health Services Division, Hawaii Department of Health Report: State of Hawaii Maternal & Child Health Needs Assessment Summary, November NASummary
42 contraception, such as IUDs and implants, which have high upfront costs *Cultural factors in different communities around family planning and birth are not well understood; more research is needed in low income groups *Access to most effective contraceptive methods is limited or too expensive *The centers evening and weekend hours improve working patients access to care Summary Family planning is a need for particular groups in Honolulu County, primarily low income families. Access to long acting, reversible contraception would help reduce the proportion of pregnancies that are unintended, but the cost of these family planning methods is prohibitive in some communities. The high teen birth rate among particular race/ethnic groups is problematic for the social and educational development of mothers and healthy birth outcomes for newborns. Key informants note that community health centers are the biggest assets for providing family planning resources to those with low access Heart Disease & Stroke Core Indicators and Supplemental Information Strongly driven by poor lifestyle patterns, heart disease and stroke are a major concern for Honolulu County. The score for this topic was higher than for any other area covered by the core indicators. Notable findings include: An increase in the prevalence of high blood pressure among adults, from 22.8% in 2003 to 31.3% in High blood pressure prevalence also compared poorly to other Hawaii counties and the U.S. average of 28.7% The prevalence of high cholesterol increased from 26.6% in 2003 to 38.9% in 2009 The death rate due to heart disease (68.1 deaths/100,000 population), though lower than other Hawaii counties, was extremely high for Hawaiian/Pacific Islanders (280.7 deaths/100,000 population) The death rate due to stroke (36.4 deaths/100,000 population) was also very high for Hawaiian/Pacific Islanders (110.5 deaths/100,000 population). Deaths due to strokes among all Honolulu County residents occurred at a rate 30% higher than the Hawaii county with the lowest value, Maui County (28.1 deaths/100,000 population) Honolulu County has not met the HP2020 targets for high blood pressure prevalence (26.9%) and high cholesterol prevalence (13.5%) 42


43 Table 3.11: Core Indicators Heart Disease & Stroke Hospitalization Rates In 2011, the highest rates of hospitalization due to hypertension and heart failure were in Leeward Oahu and Wahiawa Oahu. Windward Oahu had the highest hospitalization rate due to angina without procedure. Figure 3.25: Hospitalization Rates due to Heart Disease,

44 Within West Oahu (Leeward Oahu and Wahiawa service areas combined), a disproportionate number of preventable heart disease hospitalizations occurred among adults 65 and older in More hospitalizations due to hypertension were among women and more hospitalizations due to heart failure were among men relative to their respective populations. Figure 3.26 Percent of Heart Disease Related Hospitalizations by Age and Gender, West Oahu, Key Informant Interviews Needs/Concerns *Need to focus on solutions and evaluations rather than just continuing to study problems *Difficult to fund programs and interventions *Younger generation may not understand the work it took and will take to secure funding Impact on Low Income, Underserved/Uninsured, Race/Ethnic Groups *Low income groups are affected the most; poverty is a bigger risk factor than race/ethnicity Opportunities/Strengths *Adapt health communications and effective programs to be culturally appropriate *Utilize the spirit of helping (kokua) that exists in the community to help each other Summary The lack of healthy eating and exercise behaviors in Honolulu County largely contribute to poor cardiovascular health. Those living in low income areas are disproportionately affected, and resources are not effectively reaching those most in need. Geographically, the most impacted by poor heart health are in the Leeward Oahu and Wahiawa hospital service areas. Community health centers may be best equipped to improve heart health in culturally appropriate ways, but adequate resources are frequently not directed towards such community based efforts. 44


45 Immunizations & Infectious Diseases Core Indicators and Supplemental Information Incidence rates for infectious disease are higher in Honolulu County than other Hawaii counties. This area ranked fourth highest in the core indicator summary: AIDS incidence is 11% higher than the state average of 4.6 cases per 100,000 population Tuberculosis incidence is 19% higher than the state average of 9.0 cases per 100,000 population Chlamydia, gonorrhea, and syphilis incidence rates are all several times higher in Honolulu County than all other Hawaii counties. Syphilis incidence increased from 1.8 cases per 100,000 population in to 2.3 in Honolulu County has not met three HP2020 targets: influenza vaccination of older adults (target: 90%), pneumonia vaccination of older adults (target: 90%), and tuberculosis incidence (target: 1 case/100,000 population) Table 3.12: Core Indicators Immunizations & Infectious Diseases Hospitalization Rates In both Leeward Oahu and Wahiawa, hospitalizations due to bacterial pneumonia were the third most frequent cause of hospitalization in 2011 among the 15 preventable causes studied. These two West Oahu service areas had the highest bacterial pneumonia hospitalization rates within Honolulu County. 45


46 Figure 3.27: Hospitalization Rates due to Bacterial Pneumonia, 2011 A much higher proportion of bacterial pneumonia hospitalizations were among adults 65 and older in , and a slightly disproportionately high number were male. Figure 3.28 Percent of Hospitalizations due to Bacterial Pneumonia by Age and Gender, West Oahu, Key Informant Interviews Needs/Concerns *Some parents are choosing not to get their children vaccinated; seeing diseases we thought we had eradicated (e.g. Pertussis /whooping cough) *Once kids go to school they rarely go to doctor visits or receive vaccinations Impact on Low Income, Underserved/Uninsured, Race/Ethnic Groups *People entering Hawaii from Pacific Islands aren t screened for tuberculosis and other diseases; new populations may not be aware *Pockets of children with no wellchild visits and primary care *Despite availability of interpreters, communication barriers with Pacific Opportunities/Strengths *Shift to preventative care is positive and important *Med QUEST is placing greater emphasis on care coordination *Trend to consumer driven health care where patients are more educated *Asia Pacific Economic Cooperation 46
47 *Risk of pandemic outbreaks are a big concern, needs to be addressed with disaster preparedness Islanders (APEC) has helped with disaster preparedness Summary In Honolulu County, incidence rates of several sexually transmitted diseases are higher than anywhere else in Hawaii, Healthy People 2020 targets for vaccination of older adults are not met, and a growing number of families are choosing to forgo vaccination for Voices from the Community their children. The frequent hospitalizations due to bacterial [One community issue is the] pneumonia could, in many cases, be prevented by increasing cavalier attitude of healthcare vaccination rates among adults 65 and older from the 67.1% providers towards people who coverage rate to the HP2020 target of 90% coverage. The regular have multi drug resistant influx of new residents from far and neighboring countries puts West organisms, where the infected Oahu at increased risk for infectious disease outbreak, and maintaining vaccination levels is essential to preventing widespread patients are released back out to illness. For those diseases without a vaccine, efforts to prevent the community. disease must overcome barriers that are similar to those faced in chronic disease prevention: effective communication that is culturally appropriate Injury Prevention & Safety Core Indicators and Supplemental Information Injuries are a concern for Honolulu County; some types of injury cause significant deaths and hospitalizations among residents: The pedestrian death rate, poisoning death rate, and hospitalization rate due to assault compare poorly to other Hawaii counties (see Appendix A for all comparisons) Motor vehicle collision, drowning, poisoning, unintentional injury, and injury death rates are highest for Hawaiian/Pacific Islanders Healthy People targets for drowning (1.1 deaths/100,000 population) and pedestrian death rates (1.3 deaths/100,000 population) are not met 47


48 Table 3.13: Core Indicators Injury Prevention & Safety Key Informant Interviews Needs/Concerns *Hawaii needs motorcycle helmet law, seizure protocol for driving *Need improved enforcement of DUI laws *Falls are #1 cause of hospitalization among elderly *Increase in poisoning deaths often related to prescription drugs *Lack of acute psychiatric care puts additional burden on ERs *Two hospital closures impacts remaining ERs Impact on Low Income, Underserved/Uninsured, Race/Ethnic Groups *Disproportionate injuries in underserved areas and children falling from second/third floors *Residents in rural areas are more likely to ride in back of pickup trucks *People with less education may be less likely to engage in protective risk reduction factors *Some cultures accept risky behaviors (e.g. drinking and driving is seen as ok) Opportunities/Strengths *Hawaii has fairly strict gun laws, few violent crimes and accidents related to firearms *High compliance with seatbelt laws *Cell phone ban in place, although not yet strongly enforced *Child and passenger safety programs at community health centers *Helmet drives *Infant/child car seat installation checks Summary A large number of accidental deaths and hospitalizations could be prevented by increasing West Oahu s safety. Some residents put themselves at increased risk of injury by engaging in risky behaviors or avoiding safety precautions due to local cultural norms. Local efforts in schools and communities may help reduce risky behaviors, and legislative steps such as instituting a motorcycle helmet law may 48

 The infant mortality rate, at 7.1 deaths per 1,000 live births, is much higher than all other Hawaii counties The proportion of births delivered by cesarean section increased from 19.")
49 reduce serious injuries. While preventing every injury is unlikely, improving prompt treatment for injuries can be better handled by emergency rooms if they are not over burdened Maternal, Fetal & Infant Health Core Indicators and Supplemental Information Evidence of Honolulu County s need in maternal, fetal & infant health is apparent in core indicator data, ranking third highest among the topic areas: The proportion of mothers who received late or no prenatal care is 34% higher in Honolulu County than the Hawaii county with the best value (Kauai County, at 10.7%) The infant mortality rate, at 7.1 deaths per 1,000 live births, is much higher than all other Hawaii counties The proportion of births delivered by cesarean section increased from 19.8% in 2003 to 24.1% in 2011 Honolulu County has not met HP2020 targets for low birth weight (target: 7.8%) and infant mortality rate (target: 6.0 deaths/1,000 live births) Furthermore, a recent statewide needs assessment of Maternal and Child Health Needs identified reducing the use of alcohol during pregnancy as one of its priorities for Women and Infants. 11 Table 3.14: Core Indicators Maternal, Fetal & Infant Health Hospitalization Rates According to hospitalization data, the highest rates of low birth weight among newborns in Honolulu County in 2011 were in Leeward Oahu and Wahiawa. 11 From the Family Health Services Division, Hawaii Department of Health Report: State of Hawaii Maternal & Child Health Needs Assessment Summary, November NASummary
50 Figure 3.29: Low Birth Weight Rate per 100 Live Births, 2011 Key Informant Interviews Needs/Concerns *Root causes of poor health (e.g. social determinants, stress management skills) are not being addressed and lead to poor lifestyle choices *Need to educate parents that no amount of alcohol is safe if mother is pregnant Impact on Low Income, Underserved/Uninsured, Race/Ethnic Groups *Hospitals are challenging environment for giving birth, and many people don t feel empowered *Whether they come to Hawaii early or late in pregnancy, Micronesian migrants do not come in for prenatal care *Underserved have higher probability of experiencing high stress and making poor health choices Opportunities/Strengths *Good doctors in Honolulu County *Women do some visits and prenatal education together through Centering Pregnancy program *Would like to see programs that help new mothers learn skills around coping with stress *Should trend toward quality improvement and performance measure like reducing readmission Summary Infants and mothers in West Oahu would benefit from improved prenatal care and other maternal care. Honolulu County s infant mortality rate is the highest among all Hawaii counties. Low income residents are disproportionately affected by birth complications such as low birth weight and preterm births. COFA migrant women in particular do not utilize prenatal care resources, perhaps due to cultural barriers. Key informants recommend removing the barriers that deter low income women from accessing care and providing programs to holistically improve the quality of life for women and children Mental Health & Mental Disorders Core Indicators and Supplemental Information Mental health includes several poor comparisons for the suicide death rate: 50


 as a mental health professional shortage area.")

, even though this age group only represents 85.6% of the total population. Also, more than Voices from the half of mental health admissions were for males (59.6%).")
![Community [One community need is] accessibility to affordable health care and resolution to mental health issues.](/docs-images/82/85695432/images/51-5.jpg "Because mental health hospitalization rates are not risk or age adjusted, the mental health admission rates are not compared across geographies due to uncertainties in")
51 The suicide death rate is trending poorly; the deaths per 100,000 increased from 8.3 deaths/100,000 population in to 10.9 in The rate of deaths due to suicide is much higher in Hawaiian/Pacific Islanders (35.9 deaths/100,000 population) than the general population The HP2020 target for suicide death rate (10.2 deaths/100,000 population) is unmet Table 3.15: Core Indicators Mental Health & Mental Disorders There may be an insufficient number of Figure 3.30: Federally Designated Mental Health mental health indicators to fully assess the Professional Shortage Population Groups by Census Tracts scope of the issue. The Health Resources and Services Administration has designated the North Shore area (shown with included census tracts) as a mental health professional shortage area. This shortage area includes the Waialua CCD within West Oahu. Hospitalization Rates It is notable that mental health was the most frequent cause for hospitalization among the 15 different preventable hospitalizations that were studied 1,176 hospitalizations were due to mental health in West Oahu in In , almost all mental health admissions were among ages (90.8%), even though this age group only represents 85.6% of the total population. Also, more than Voices from the half of mental health admissions were for males (59.6%). Community [One community need is] accessibility to affordable health care and resolution to mental health issues. Because mental health hospitalization rates are not risk or age adjusted, the mental health admission rates are not compared across geographies due to uncertainties in varying population characteristics. All 2011 values are included in Appendix B. Further data on mental health hospitalizations at a sub county level can be found in the State of Hawaii Primary Care Needs Assessment Data Book Family Health Services Division, Hawaii Department of Health Report: State of Hawaii Primary Care Needs Assessment Data Book 2012, July

 or Medicare because reimbursements are too low *Groups")
52 Figure 3.31 Percent of Hospitalizations due to Mental Health by Age and Gender, West Oahu, Key Informant Interviews Needs/Concerns *Treating mental health often requires ongoing therapy, ancillary services, extended hospital stays that insurance companies don t often pay for *Too much emphasis on medically/pharmacologically treating health outcomes without addressing underlying behavioral health issues Impact on Low Income, Underserved/Uninsured, Race/Ethnic Groups *No psychiatrists take low income patients on Med QUEST (Medicaid) or Medicare because reimbursements are too low *Groups like Native Hawaiians are kept away from traditional forms of healing *Adults in rural areas have a hard time accessing services *Recent immigrants face language challenges Opportunities/Strengths *Should look at treatment of families and move away from concentration on individual health *Availability of a suicide/crisis hotline is critical; currently there is no multi lingual access *Native Hawaiian community treats seriously mentally ill population with far greater regard and respect than more urban communities *The state s Clubhouse program provides psycho social rehab and supported employment services for the severely mentally ill, but most insurance companies will not support such a program Summary Although mental health is better in Honolulu County than other Hawaiian counties, mental health needs impact many in Honolulu and access to quality mental health care remains an issue. Within West Oahu, Waialua is federally designated as having a shortage of mental health professionals. Aggregate findings from the key informant interviews indicate that mental health is a top concern. The key informant word cloud (Figure 3.18) prominently showed that mental health was the single most frequently noted health concern among key informant interviewees. Low income and rural residents have difficulty accessing mental health care as they do physical health care. For many, insurance coverage for mental health care may be an issue, leading to inadequate treatment for sub acute mental health concerns. Reducing hospitalizations for acute mental health disorders is important for improved quality of life and 52
53 reduced health services costs for mental health. Ideas around improvement from those interviewed are that mental health care in West Oahu could improve by becoming more culturally sensitive, by adding multi lingual access to services and integrating traditional forms of healing Older Adults & Aging Core Indicators and Supplemental Information Little data specific to older adults was available for the core indicator summary. The rate of hospitalization due to falls among people aged 65 and older was higher for Honolulu County than other Hawaii counties and increased slightly between 2003 and As seen under Immunizations & Infectious Diseases (section ), vaccination rates among people 65 and older have not met Healthy People targets. Figure 3.32: Unadjusted Composite Hospitalization Rates: West Oahu, Hospitalization Rates Overall, most hospitalizations occur among older adults. With the exception of hospitalizations due to short term complications of diabetes and mental health hospitalizations, the unadjusted hospitalization rates were much higher for adults aged 65 and older in both Leeward Oahu and Wahiawa. Key Informant Interviews Needs/Concerns *Need to take care of mental and emotional needs of seniors *Increased lifespans are leading to more health problems and people needing special care *Falls are an issue because people want to live in their own homes as long as possible *Patients may not accept home care even if covered by insurance because of co pay *Seniors don t understand health care reform and have questions *Shortage of beds in Skilled Nursing Impact on Low Income, Underserved/Uninsured, Race/Ethnic Groups *Gaps between haves and havenots *In rural areas, transportation to doctors appointments difficult; expensive private transport necessary for wheelchair access *Low income people with no social network also don t have electronic devices that some use to maintain connections *May not be compliant with medications because of cost or difficulty picking them up *Translating care and medication materials into all languages required Opportunities/Strengths *Oahu has an abundance of community based services and care homes, foster family homes *Many individuals have chosen profession of home based or community based assistance for elderly *Culture of caring for aging family members, although this is changing with younger generations *Executive Office on Aging (DOH) and Area Agency on aging are strengths because they cover all seniors, not just those ill *Meals on Wheels impacted by lack 53
54 Facilities *Nursing facilities are very costly, especially for patients with multiple conditions *A growing share of homeless population is elderly *Need to focus on preventive action of funding, but do important work *Dana Group provides fall prevention services Summary Although health data for seniors is lacking, the longevity in Hawaii is leading to an increased need for care for seniors. Specific difficulties faced by older residents of Honolulu County include accessible transportation needs, high costs of specialized care, and emotional stress caused by loss and social isolation. Many different organizations are assisting seniors, but the high cost of providing services remains an issue. Improved primary care, chronic disease management, and attention to mental health concerns can significantly impact the effective health management of older adults. Furthermore, coordination of care for seniors could reduce the burden of managing advice and medications from multiple providers and more effectively deliver health services for this growing population. Voices from the Community [Our community needs] education around death and dying, i.e. Physician Orders for Life Sustaining Treatment (POLST) Oral Health Core Indicators and Supplemental Information Honolulu County compares favorably to the nation and the state in adult oral health indicators. The largest disparity evident in the data was for adults aged 65 and older with total tooth loss in 2010, which was much higher among Filipino (12.2%) and Native Hawaiian adults (11.8%) than among the general population (7.2%). Although no oral health indicators in the summary addressed children, a report by the Pew Research Center gave the State of Hawaii a grade of F for meeting only one out of eight benchmarks for key policy indicators. In The State of Children s Dental Health: Making Coverage Matter, 13 Hawaii compared poorly to the nation due to several factors, including: Sealant programs were in place in 0% of high risk schools in 2010 Optimally fluoridated water was provided to only 10.8% of citizens on community systems in 2008 As of 2010, the Medicaid program does not reimburse medical care providers for preventive dental health services 13 From the Pew Research Center s The State of Children s Dental Health: Making Coverage Matter, May


55 Key Informant Interviews Needs/Concerns *We have particularly bad dental health in Hawaii *Access to dental care a huge issue Impact on Low Income, Underserved/Uninsured, Race/Ethnic Groups *Medicaid covered services are not adequate; kids have great benefits but no access, adults have access but no benefits Opportunities/Strengths *Need to support appropriate presence of community health centers, particularly important for dental and behavioral health Summary Given the large impact oral health has on overall health and wellbeing, it is important that West Oahu residents have access to and utilize preventative dental care. Both insurance coverage and access to dental care are necessary to maintain good oral health. Several statewide policy changes are potential avenues for improving oral health, including strengthening Medicaid coverage for dental care, providing dental sealants through schools, and fluoridating public water. Key informants also recommend supporting dental care programs provided by community health centers Respiratory Diseases Core Indicators and Supplemental Information Although only two asthma indicators were available for this topic, adult asthma compared poorly in Honolulu County: Asthma prevalence among adults increased from 5.5% in 2003 to 8.9% in 2010 By race/ethnicity, the percent of adults with asthma is highest for Native Hawaiian adults (12.2%) Table 3.16: Core Indicators Respiratory Diseases Hospitalization Rates In 2011, respiratory disease related hospitalization rates were highest in Leeward Oahu. 55


56 Figure 3.33: Hospitalization Rates due to Respiratory Disease, 2011 Among adults 40 and older in West Oahu, there were a disproportionate number of hospitalizations among adults over 65 in relative to their population make up. Counts of hospitalizations due to asthma in younger adults by age and gender are unavailable due to data suppression. Figure 3.34 Percent of Hospitalizations due to COPD or Asthma among Older Adults (40+) by Age and Sex, West Oahu, Key Informant Interviews Needs/Concerns *Tobacco related respiratory illness is preventable Impact on Low Income, Underserved/Uninsured, Race/Ethnic Groups *Lower socioeconomic levels correlated with higher smoking Opportunities/Strengths *Hawaii s progressive laws have positively impacted smoking rates in 56

57 *Women who are pregnant and smoking is a concern; women who resume smoking after pregnancy also put children s respiratory health at risk *Asthma correlated with obesity for unknown reasons *Asthma prevalence is significant in kids ages 0 4 *Asthma most common reason for child to be hospitalized *Asthma causes school absenteeism and grades drop rates *Native Hawaiian, Pacific Islander, and Filipino populations also have higher smoking rates *Asthma more prevalent with poverty; higher rates where housing conditions are not good *Native Hawaiians have highest rate of asthma & chronic disease last 10 years * Catch a roach program in public housing helps reduce this asthma trigger *Chronic disease self management programs *Data collection and analysis efforts play an important role in educating and empowering people *Community health centers are a great model Summary Respiratory disease is a health issue with high disparity in Honolulu County. Residents living in poverty are more likely to smoke and more likely to live in conditions that may trigger asthma. Sub populations that are often living below poverty are most impacted by respiratory disease, including Native Hawaiian, Pacific Islander, and Filipino families. Controlling asthma is particularly important for children, whose education can be negatively affected by the disease if the school environment is not able to provide asthma medication support. Key informants herald progressive laws that have made an impact on smoking rates, and recommend chronic disease self management programs and further data collection and analysis efforts Social Environment Core Indicators and Supplemental Information Little data was available for the core indicator summary that directly pertains to the social environment. A lower proportion of children in Honolulu County live in a single parent family household (27.1%) than in other Hawaii counties and the nation. The proportion in West Oahu is slightly higher (27.7%), and is especially high in Waianae (47.0%, Figure 3.35). A lower percent of West Oahu households were linguistically isolated compared to Honolulu County: 5.0% of households reported that all of its members ages 14 and over had some difficulty speaking English, contrasted with 7.6% of households in Honolulu County. Of note, certain race/ethnicity groups are also more affected by poverty, as seen in Section Figure 3.35 Percent of Children Living in Single Parent Family Households by County Subdivision, West Oahu, U.S. Census, American Community Survey, Estimates 57
58 An additional consideration for the social environment is the inclusion of two priorities in a recent statewide needs assessment of Maternal and Child Health Needs 15 : Reduce the rate of child abuse and neglect with special attention on ages 0 5 years Prevent bullying behavior among children with special attention on adolescents age Key Informant Interviews Needs/Concerns *People feel insecure about the economy and don t understand the Affordable Care Act *We wait until problems are really big and react to them; little to no effort is made to look downstream at what is coming *Affordable housing cuts across all domains, impacts health and provider shortage *Unemployment, education, lack of prevention, alcoholism, domestic violence, transportation affect health Impact on Low Income, Underserved/Uninsured, Race/Ethnic Groups *Pay for performance is likely to hurt low income communities since doctors will not have incentives to treat the most at risk populations *Census tract is more indicative of health outcomes than genetics, yet we invest most in genetics and electronic health records Opportunities/Strengths *Support land based and cultural programs that build relationships and support systems within communities *Hui Kūpa a/collective Impact program Summary Largely driven by economic insecurity, social issues such as unemployment, education, alcoholism, and domestic violence all influence a community s health. Low income residents are most impacted by poor social environments that limit opportunities for economic and social advancement. Key informants are concerned that pay for performance legislation will negatively affect at risk populations who may be turned away from providers. One opportunity for strengthening West Oahu s social environment is to support land based and cultural programs that build relationships and support systems within communities Substance Abuse & Lifestyle Core Indicators and Supplemental Information Measures of substance abuse in Honolulu County indicate that this topic is a health concern. Secondary data include measures of adult substance abuse and liquor availability: Adults aged are the most likely to binge drink and smoke; 30.5% of adults in this age group binge drink and 21.0% smoke The smoking rate among adults of certain race/ethnicities is higher, particularly among Native Hawaiians (24.8) The Healthy People target for adult smoking (target: 12.0%) is unmet 15 From the Family Health Services Division, Hawaii Department of Health Report: State of Hawaii Maternal & Child Health Needs Assessment Summary, November NASummary

59 There are more liquor stores per 100,000 population in Honolulu County than other counties in Hawaii; the state has an overall liquor store density of 3.7 stores per 100,000 population Table 3.17: Core Indicators Substance Abuse & Lifestyle In , the percent of hospital admissions that were associated with a substance related disorder was lower in Honolulu County (8.0%) than the state average (8.9%). However, the percent was higher in Waianae (9.2%) 16. Key Informant Interviews Needs/Concerns *Significant need in drug and alcohol addiction and related problems like accidents and psychosocial disorders *Highest drug use for youth is marijuana followed by alcohol *High rate of women binge drinking during pregnancy; haven t gotten message out successfully *Ice/Crystal Meth is big problem for both youth and adults *Low health literacy leads to poor decisions when seeking care *Need to address mental health & substance abuse co morbidity Impact on Low Income, Underserved/Uninsured, Race/Ethnic Groups *With Marshallese population and others, there are issues related to language and culture; need for translation *With Hawaiians, cultural issues come into play and comes down to how we offer services and what services we offer Opportunities/Strengths *DOH has data for youth usage of alcohol and drugs and a school survey *Work with University of Hawaii Center on the Family *Hawaii Primary Care Association is required to do a lot of things around language and services and will have a good handle on this Summary Honolulu County s problems with substance abuse have a wide impact on health. Alcohol abuse is particularly severe among young adults and teens, and the danger of alcohol use during pregnancy has yet to be effectively communicated. Smoking is much more common among race groups who also tend to be more impacted by other economic and social problems. Hospitalization patterns suggest that substance abuse is a particular problem in Waianae. Intervention for substance abuse for certain subpopulations is inhibited by translation needs and lack of culturally appropriate communication. 16 From the Family Health Services Division, Hawaii Department of Health Report: State of Hawaii Primary Care Needs Assessment Data Book 2012, July
60 Intervening on psychosocial disorders and other mental health issues may indirectly assist in controlling substance abuse in West Oahu Transportation Core Indicators and Supplemental Information Access to transportation is essential for accessing health services, and the choices a community makes for daily transportation can have a great impact on the environment. Although the average time spent commuting to work in Honolulu County is higher than other Hawaii counties and in the worst quartile of U.S. counties, more workers in Honolulu County use public transportation or walk to work. Key Informant Interviews Needs/Concerns *Transportation is a major issue on all Hawaiian islands; rail and bus won t help seniors *Lack of transportation contributes to lack of access to care Summary Impact on Low Income, Underserved/Uninsured, Race/Ethnic Groups *Handicabs (door to door service for wheelchairs, walkers, and stretchers) are often too expensive Opportunities/Strengths *Geriatric home visit program provides services to seniors While commuters in Honolulu County are utilizing alternative transportation options that are healthy for the environment, transportation issues exist for older adults. Adults who have special needs for transportation may have trouble affording services, especially if they need to travel long distances for care. Efforts to improve this barrier for older adults may include funding home visit programs, expanding telemedicine, or providing transportation that is both affordable and accessible. 60
61 4 Community Health Needs Summary 4.1 Findings/Conclusions The community health needs of West Oahu span across all of the topics included in this report. Some health issues impact a larger proportion of the population, while others are of greatest impact to particular groups or sub geographies. In order to assess the health needs in Honolulu County, both objective indicator data and subjective interviews were considered. While indicator data provided a good starting point for determining where attention should be focused, sometimes the data was lacking in depth or breadth on important topics. Interviewing key informants who have local knowledge on the topics helped to fill in details and bring attention to data gaps. The core indicator summary and interviews were conducted at the county level, however some findings specific to West Oahu did emerge. Additionally, some subpopulations which make up a large proportion of West Oahu s residents were identified as having an increased need across many topic areas. Surveying residents elicited health concerns from a small proportion of the community and added highlights. Planners will want to consider how to impact these areas, as many areas can be addressed concurrently with appropriate primary and holistic interventions. Several common themes emerge in this assessment that can guide community health improvement planning: All groups experience adverse health outcomes due to chronic disease and health risk behaviors While there are significant disparities in chronic disease, it is important to note that areas such as heart disease and stroke, cancer, diabetes, and asthma affect many residents of West Oahu. Moreover, key health behaviors that impact chronic disease, including optimal exercise, nutrition, and weight need attention across all age, gender, and race/ethnic groups. While some core indicators in the area of physical activity and body weight compared favorably to the nation, it is important to remember that obesity and inactivity is a problem nationwide. With only 40% of the population maintaining a healthy weight, Honolulu County s obesity and overweight rate is at a hazardous level that is imperative to address through improved healthy behaviors. Attention to this area at many levels could have an enormous positive impact on the long term health of the community. As a chronic condition that significantly influences overall health, mental health and associated substance abuse arose repeatedly throughout key informant interviews as a concern in Honolulu County. Depression induced by poor nutrition, inadequate sleep, and stressful family dynamics are detrimental to wellbeing and educational success for young people; drug use among teens further inhibits learning. Stress is also considered to have a negative effect on health behaviors, further worsening the chronic conditions mentioned above. The suicide death rate has increased in recent years, and the increasing rate of poisoning deaths was attributed to prescription drugs. In addition, many injury related hospitalizations and deaths may be attributable to substance abuse, including motor vehicle collision deaths caused by driving under the influence of alcohol. Specific populations in need include: teens, whose increasing drug use interferes with educational progress; pregnant women who use alcohol during pregnancy; new mothers who need to learn stress coping skills; and older adults with dementia or depression associated with disability and/or the loss of loved ones. Greater socioeconomic need and health impacts are found among certain groups and places in West Oahu Repeatedly throughout this needs assessment, key informants stressed that Honolulu County residents who are low income are the most affected by health problems and often the most difficult to help. 61
62 There are pockets of high socio economic need within West Oahu, especially within Waianae, Wahiawa, and Waipahu. Because Census estimates of poverty do not adjust for the higher cost of living in Hawaii, the number of West Oahu residents impacted by poverty is likely underestimated. When planning for heath improvement, careful consideration should be given to highest need groups identified geographically from socioeconomic measures. Financial constraints affect residents access to health services, including effective contraceptive methods and oral health care. Low income families often have limited access to healthy food outlets and recreational facilities, and are less likely to engage in healthy behaviors that can prevent chronic disease. People living in poverty are more likely to suffer from asthma as a result of poor housing conditions, and are limited to residence choices by a lack of affordable housing. Older adults are often unable to afford the transportation and living accommodations required for special health needs. Additionally, the stress caused by socioeconomic factors puts students at a disadvantage in obtaining a quality education, increases the likelihood of substance abuse among youth and adults, and generally decreases the ability of low income residents to improve their health and wellness. Cultural and language barriers inhibit effective intervention for the most impacted populations Because of the strong correlation between poverty and race/ethnicity, some of the groups most impacted by health issues often face cultural barriers to health improvement. Language differences, including limited English proficiency, and poor health behaviors that are common within a culture are challenges that must be overcome in order to effectively prevent disease. Key informants cited challenges in effective communication and intervention to particular race/ethnic groups in the areas of cancer; diabetes; family planning; heart disease; immunization and infectious diseases; injury prevention and safety; maternal, fetal, and infant health; and substance abuse. Culture is also cited as an important consideration in providing educational opportunities that will motivate youth and mental health care that effectively incorporates both traditional and modern methods of healing. Groups that were frequently cited as facing strong health barriers include Native Hawaiians and Pacific Islanders, which make up an especially large proportion of the population in Waianae. See section for further discussion on health disparities by race/ethnicity. Limited access to care results in greater health impacts in rural areas of West Oahu Another pervasive theme of this assessment is that residents of rural parts of Oahu are often more impacted by poor health. Because many health services are based in the City of Honolulu, accessing care is often limited by expensive and challenging transportation options and is a particular problem for older adults. Higher rates of diabetes related hospitalizations in rural areas reflect both unhealthy behaviors and poor disease management. The rural areas of West Oahu that have the highest poverty rates were recurrently found to face more severe health problems across many topics. Waianae, a Federally Designated Medically Underserved Area (MUA), was specifically highlighted by key informants as having poor exercise and eating behaviors. The Hospital Service Area containing Waianae, Leeward Oahu, has the highest rates of hospitalization due to diabetes, heart disease, bacterial pneumonia, and low birth weight. On the north side of the island, Waialua is contained within the federally designated mental health professional shortage area of North Shore. Community health centers and schools are key community assets for effective interventions Given the barriers described above, several key informants recommended focusing on interventions through community health centers. Locally based care has many advantages, including the ability to bring primary care services that are culturally appropriate to different populations. Staffing community 62
63 health centers with residents from the served community offers opportunities for economic advancement and improved social environment. While West Oahu has existing community health centers, funding is often a limitation of providing services through these venues. Health interventions for children and teens can have a two fold benefit of establishing healthy life long behaviors among Hawaii s youth, as well as influencing the health of their families. Preventative services and health literacy education can be effectively delivered in school environments. Key informants often recommended interventions that are school based or involve collaboration with Hawaii schools. For instance, increased physical activity time and expanded sports activities could help combat childhood obesity. Dental health can also be improved by implementing evidence based strategies that are provided in the school environment. 63
 are listed in Figure 4.1 below.")

64 4.1.1 Disparities Highlights Although the root causes of health disparities are attributable to socioeconomics, race/ethnicity is a correlate for which data is more often available. The topic areas for which each race/ethnic group was noted to have a severe disparity (either by a key informant or for at least one indicator) are listed in Figure 4.1 below. Note that some race/ethnic category definitions differ between secondary data sources, and the degree to which disparities could be assessed depend on data availability. A significant finding is that Native Hawaiians and Pacific Islanders are faring worse across more topic areas than any other group. This population also has one of the highest poverty rates in West Oahu. Figure 4.1: Areas of Disparity for Race/Ethnicity Groups 64
65 4.1.2 Identified Data Gaps There were four topic areas for which so little data was available that a core indicator summary score was not calculated: Diabetes, Disabilities, Older Adults & Aging, and Social Environment. Although Diabetes was further informed by hospitalization rates, more data is needed on the disease regarding children and teens. Obesity indicators, while correlated with diabetes, are not necessarily predictive of diabetes impact. Although the population affected by disabilities was described with data from the American Community Survey, information on the specific needs and challenges of this group is lacking. The health needs of Older Adults can be further described with data from other topics such as tooth loss, immunization rates for adults 65 and older, and age specific hospitalization rates, but data describing the social isolation, disability, and care needs faced by this population is lacking. While some secondary data shed light on the topic of mental health, primary data brought further attention to this critical area that impacts many other health behaviors and outcomes. For Immunizations & Infectious Diseases, little sub population data is available to examine disparities. And across most topic areas, little data specific to children and teens is available for Honolulu County. In particular, Exercise, Nutrition & Weight, Oral Health, and Injury Prevention & Safety are areas that affect children according to key informants but are not represented well in secondary data. Another area where available data does not fully describe the health needs is with new immigrant and transient populations. Primary data did highlight the populations arriving in Hawaii under the Compact of Free Association and the new challenges this growing group presents to the state s health care system. Due to this population s mobility, marginalized existence, and cultural isolation, traditional public health surveys and population statistics typically do not capture their data and circumstance. However, acute care settings are challenged to provide services and community infrastructure to support the new populations. 4.2 Limitations and Other Considerations This needs assessment is subject to limitations of the methods used for summarizing secondary data and key informant interview findings. Core indicator summary scores and key informant interviews were originally conducted to assess the needs of Honolulu County, and specific needs of West Oahu were not always described in detail. However, socio economic and hospitalization data describe the West Oahu sub populations in detail and identified those groups in greatest need in West Oahu. Topic areas to which core indicators were assigned are not truly independent of each other, and the scoring system used could not account for the inherent relationships between health and wellness topics. The number of indicators available for each topic area varied, and while the scoring system numerically accounted for this variation, the impact of a given indicator on the final scoring for a topic area was greater if fewer indicators and/or comparisons were available. Nonetheless, this needs assessment utilized an extensive data set, derived from the best public health data made available by the Hawaii State Department of Health and the Hawaii Health Data Warehouse. By using the local website source for indicator data, available from the most recent, least aggregated across years, and most detailed race/ethnicity disparity data possible was considered. Race and ethnicity breakout data from this source provides information on the numerous subgroups in Hawaii (Japanese, Filipino, Chinese, Native Hawaiian, Pacific Islander), allowing this report to understand health needs and disparities for groups that together comprise a majority of the population in West Oahu. Indicators from national data sources had limitations, including combining important race and ethnic groups together and thus masking disparities. Importantly, in assessing poverty and economic measures, 65
66 data sources did not account for the higher cost of living on the islands, resulting in an underestimation of poverty in West Oahu. The variability in accuracy and precision of secondary data indicators, as well as the comparisons used, are further limitations. Some indicators, such as those from vital statistics, are based on accurate counts and are the most exact. Other indicators that are based on surveys are subject to variability due to sampling error and accuracy of self reported data. Because Honolulu County comprises a large proportion of the state population, state rates and Honolulu County rates could not differ tremendously. The small number of counties in Hawaii allowed for few other in state comparisons. Because of the varying amount of historical data available for different sources, trend comparisons were not equal between indicators. Additionally, many indicators from surveys conducted in Hawaii, including the Hawaii Health Survey (HHS) and Pregnancy Risk Assessment Monitoring System (PRAMS), could not be compared to a national value or benchmark due to lack of equivalent data. When national comparisons were available, sometimes the indicator was in an area where the nation as a whole is doing very poorly and a favorable comparison for Honolulu County did not necessarily reflect good health; examples of this include obesity and physical activity measures. Healthy People 2020 benchmarks were used for comparisons, when available, though some of these can be ambitious targets for communities to meet. While preventable hospitalization rate indicators provided by HHIC were invaluable for their insight into the underlying health of the community at a sub county level, it should also be considered that the variation in rates may reflect geographic differences in access and timeliness of care. Further analysis may be needed to better understand West Oahu s preventable hospitalization patterns. One challenge in conducting this community health needs assessment was the condensed timeline. All of this work was compressed into a 6 month time frame, overlapping the winter holidays, which impacted the primary data collection strategy. However, the key public health officials and community health leaders of Honolulu County were successfully included in the key informant process (see Appendix C for a full list of key informants interviewed). The online community survey was aimed to further complete the understanding of the local needs in Honolulu County and West Oahu, although the limited participation makes it difficult to assess if findings accurately reflect the broader community s perspective. While invaluable data was provided through the primary data collected for this report, a future CHNA process would benefit from a longer time horizon and would allow for expanded involvement and input from the community. Regardless of the limitations, this report provides a snapshot of the health and quality of life challenges in West Oahu. The needs outlined provide a guide for community benefit planning, but subsequent efforts may be needed to delve deeper into specific areas of need and the most effective methods of intervention. While there are many areas of need, there are also innumerable community assets and a true aloha spirit that provide ample foundation for community health improvement activities. 66
67 5 Selected Priority Areas On March 26, 2013, HCI presented the Community Health Needs Assessment findings for Honolulu County, with special attention to the needs of West Oahu, to the Pali Momi Medical Center Community Benefit team. Following the presentation, HCI facilitated a prioritization process whereby the team of eight narrowed down the 20 topic areas of need from the CHNA report to two priorities. These two priorities will be the focus for Pali Momi s implementation strategy planning. The group used the Nominal Group Planning Process. The group determined the following criteria for selecting priorities: Magnitude/severity of problem Opportunity to intervene at prevention level Alignment with Pali Momi s mission/strengths/programs Opportunity for partnership Solution could impact multiple problems Feasibility of change Importance of problem to community Each member of the community benefit team was given a ballot that listed the 20 topic areas of need highlighted in the CHNA report. Each member cast their vote, selecting three topic areas as the key areas of need to focus community benefit efforts. The team members understood that the selected priorities would become the areas of focus for their implementation strategy planning. After two rounds of voting and discussion, the top two topic areas selected as priorities were: 1. Heart Disease & Stroke 2. Exercise, Nutrition & Weight HCI then asked for nominations for key stakeholders so that their priorities could be validated and communicated to the larger community. The group nominated the following individuals: Loretta Fuddy, Director, Hawaii Department of Health Dee Jay Mailer, CEO, Kamehameha Schools HCI conducted these key stakeholder interviews and were able to share and validate the hospital s priorities and learn about partnership opportunities. 67
68 Appendix A: HCI Provided Data About HCI Provided Data Healthy Communities Institute (HCI), in partnership with the Hawaii Department of Health and the Hawaii Health Data Warehouse, provides demographic and secondary indicator data on health, health determinants, and quality of life topics. Data is typically presented in comparison to the distribution of counties, state average, national average, or Healthy People 2020 targets. Data is primarily derived from state and national public health sources. HCI also provides a database of promising practices from a variety of sources, including the Centers for Disease Control and Prevention. All of the HCI content is presented in a public web platform that also serves as a publishing tool for components of Community Health Needs Assessments. Framework for Indicator/Data and Topic Selection The framework for indicator selection within the Health category is based on the Department of Health and Human Services (DHHS) Healthy People initiative. Healthy People establishes science based national objectives for improving the health of the nation. The initiative establishes benchmarks every ten years and tracks progress toward these achievable goals. This framework encourages collaboration across sectors and allows communities to track important health and quality of life indicators focusing on general health status, health related quality of life and wellbeing, determinants of health and disparities. The Health subcategories are based on the Healthy People framework, and multiple indicators across the health sub topics that correspond with Healthy People targets have been chosen (based on data availability, reliability and validity from the source). Indicators in the other categories were selected according to national consensus and feedback from a wide set of advisors, public health officials, health departments, and local stakeholders from various sectors in the community. For example, the education indicators are based on the National Center for Health Research and Statistics and United Way of America, and the standards and goals they set forth to help track educational attainment in the U.S. Economic indicators were selected in conjunction with economic development and chamber of commerce input. All of the selected indicators have gone through a vetting process where HCI s advisory board, as well as stakeholders in communities who have implemented HCI systems, provide feedback to refine the core indicators in order to best reflect local priorities. The indicator selection process evolves over time with changing health priorities, new research models and national benchmarks. HCI continues to incorporate models and standards from nationally recognized institutions such HHS s Healthy People, AHRQ s PQI s, EPA Air Quality standards, National Center for Education Research and Statistics priorities, United Way, and United States Department of Agriculture s Food Atlas, among many others. Core Indicator Data Summary: Analytic Approach and Scoring Methodology As discussed in Section 2.1, the selection of topic areas for primary data collection relied on four types of Core Indicator comparisons: geographic, trend, disparity, and benchmark. A four point system was used to evaluate each indicator on these four comparison methods, as illustrated in the examples below. Please note the data in this section is presented only to demonstrate the methodology and may not reflect data referenced elsewhere in this report. 68


69 Geographic Comparison The core indicator was assigned a geographic comparison point if it was worse than its comparison values on average: Relative to the comparison geography s value, the county value receives one of three designations, which is translated into points to calculate an average: Better/same 0 points Worse 1 point For example, this breast cancer core indicator for Honolulu County would be assigned a geographic comparison point. Much worse 2 points The following criteria were used to assign points for worse or much worse comparisons: Comparison Worse 1 point Much worse 2 points National* worse than U.S. value *or* worst 50th percentile of U.S. counties >25% worse than U.S. value *or* worst 25th percentile of U.S. counties State worse than state value >25% worse than state value HI counties worse than best county value >25% worse than best county value *National comparison uses either the U.S. value or a distribution of U.S. counties depending on data availability. An indicator with a national comparison will be compared to either the U.S. value or the county distribution, never both. Average was calculated as total points divided by number of possible geographic comparisons. If average was at least 1 (worse), then geographic comparison was considered poor for indicator. National The county value is in the worst 25 th percentile of U.S. counties 2 points State The county value is worse than the state value of cases per 100,000 females, but not more than 25% worse 1 point HI counties The county value is worse than the best county value (Kauai, at cases per 100,000 females), but not more than 25% worse Sum of Points 1 point 4 points Since the average was greater than 1, this breast cancer incidence rate core indicator was assigned a geographic comparison point. 69

70 Trend Comparison The indicator was assigned a point if the value was worsening by at least 2.5% on average. In this example of a colon cancer screening indicator, a point would be assigned because the value decreased by 7.9% on average: Disparity Analysis The indicator was assigned a point if there were large disparities among subpopulations. In this Core Indicator analysis, any indicator with a maximum disparity ratio of 4 or greater received a point. This example of an adult smoking indicator would receive a point because its maximum disparity ratio is 4: Healthy People 2020 Target Comparison The indicator was assigned a point if it did not meet a Healthy People 2020 target. In this high cholesterol prevalence example, a point would be assigned because the county did not meet the target of 13.5%: 70
71 Scoring The total earned points and total possible points were tallied for each indicator. In this example of a mammogram history indicator, four points were possible since all four comparisons were available. Out of the four potential points, the indicator earned only one point, for not meeting the Healthy People 2020 target: The total earned points and total possible points were then tallied for all indicators in a topic area to calculate the topic area summary score. In this cancer topic area example, 15 points were earned out of 38 possible points, giving the topic area a summary score of These summary scores were then ranked in descending order to help guide the primary data collection process. 71
.")
72 Core Indicator Data: Honolulu County Summary Most of the core indicator data included in this report can be found on Hawaii Health Matters ( 72
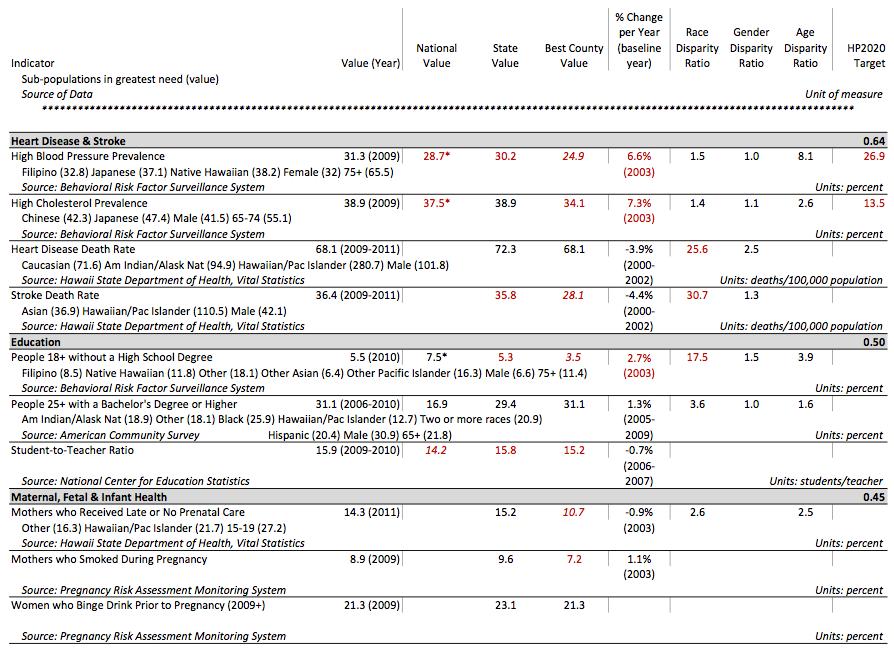
73 73
74 74
75 75
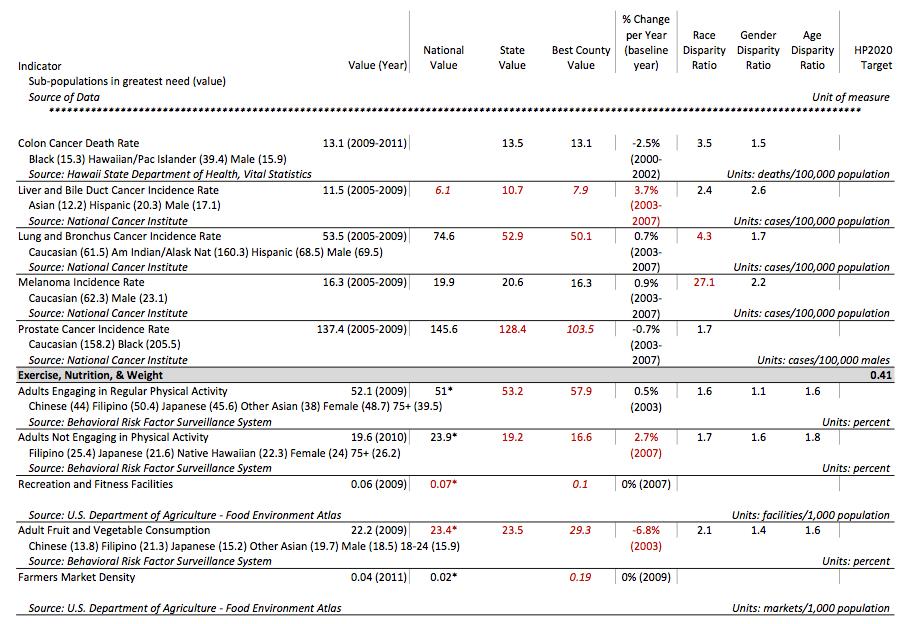
76 76
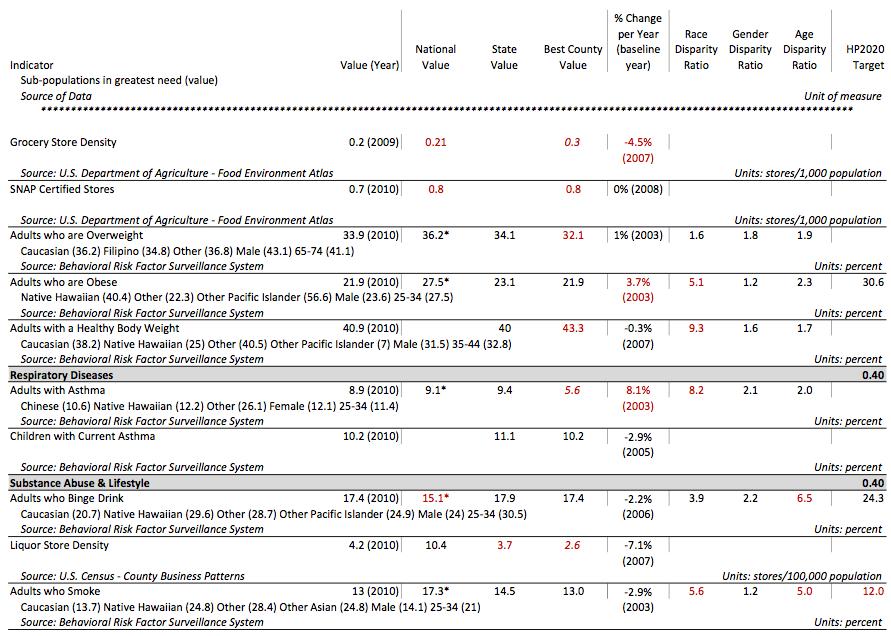
77 77
78 78
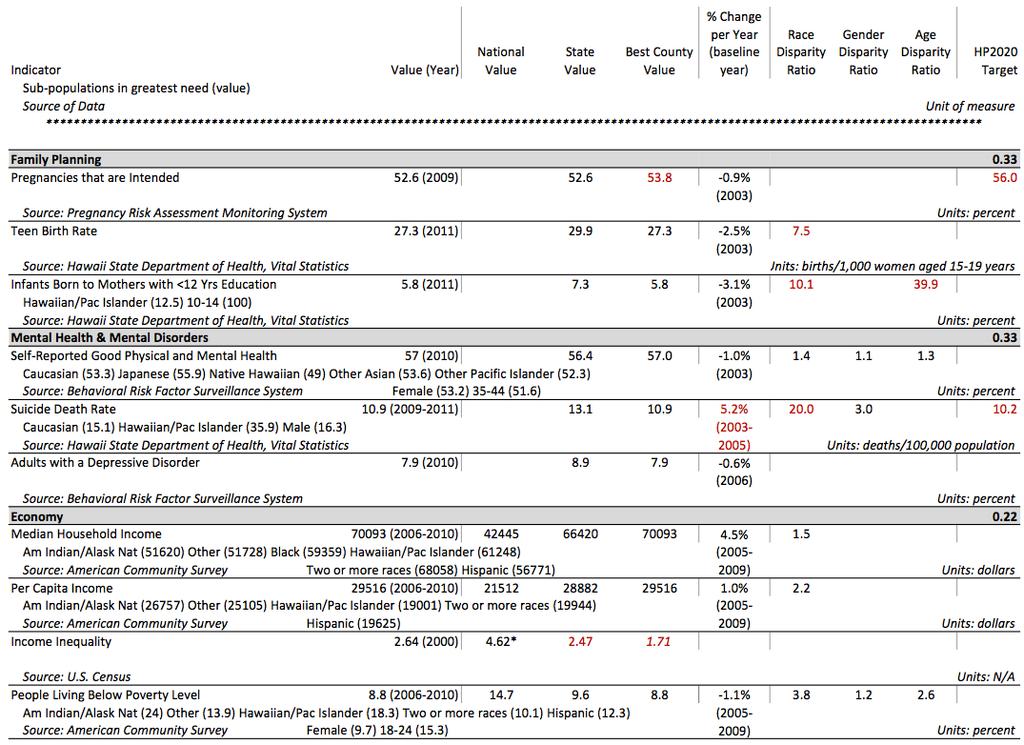
79 79
80 80
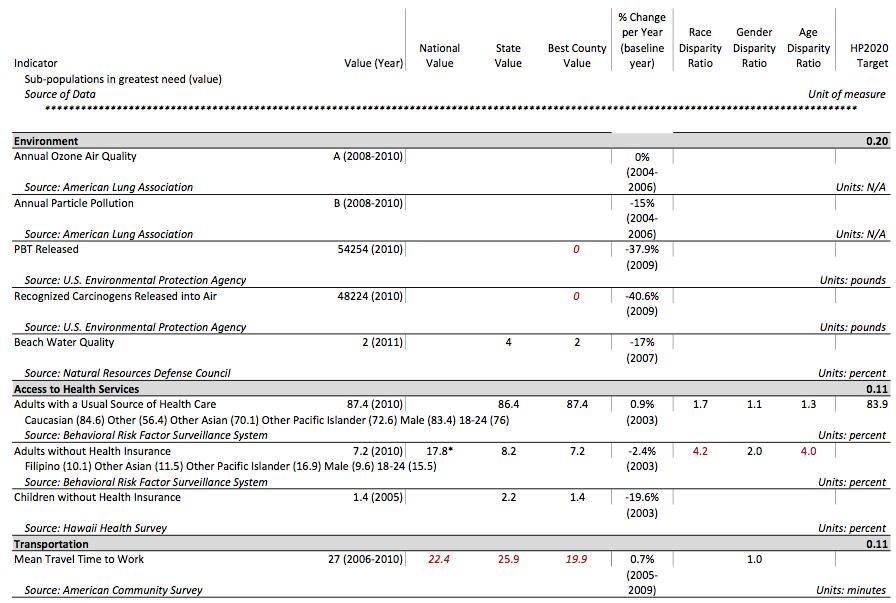
81 81
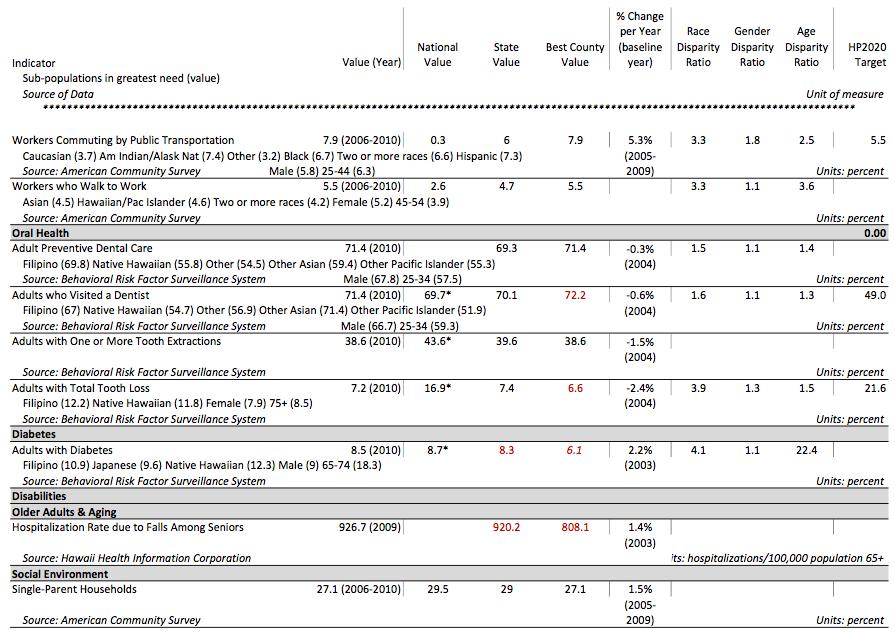
82 82

83 Core Indicator Data: West Oahu The following 2010 Census Tracts are included in each division of West Oahu: 17 Geography 2010 Census Tracts Ewa 73 89, 114, 115, 9803 Hickam Pearl City 73 80, 114 Waipahu 87 88, , Ewa Kalaeloa 83 85, 9803 Kapolei Makakilo 86, 115 Mililani , , Wahiawa 90 95, 9806, 9807 Waianae 96 98, Waialua Figure 5.1 West Oahu Census County Divisions Figure 5.2 Ewa Subdivisions 17 Family Health Services Division, Hawaii Department of Health Report: State of Hawaii Primary Care Needs Assessment Data Book 2012, July
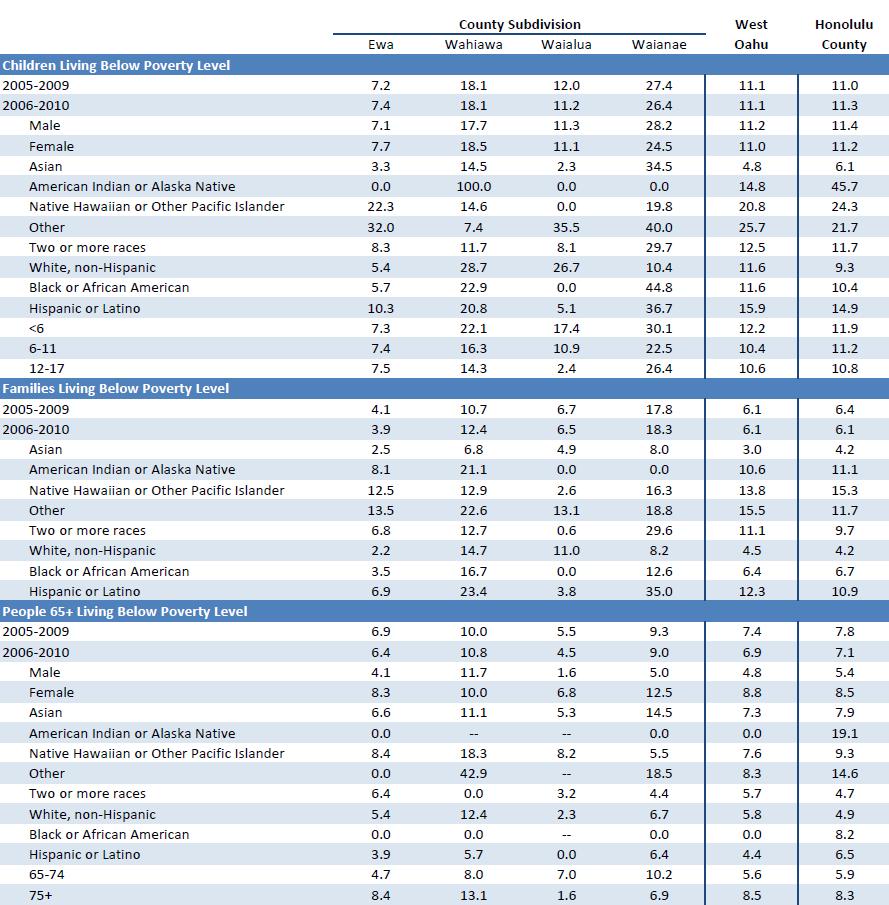
84 84
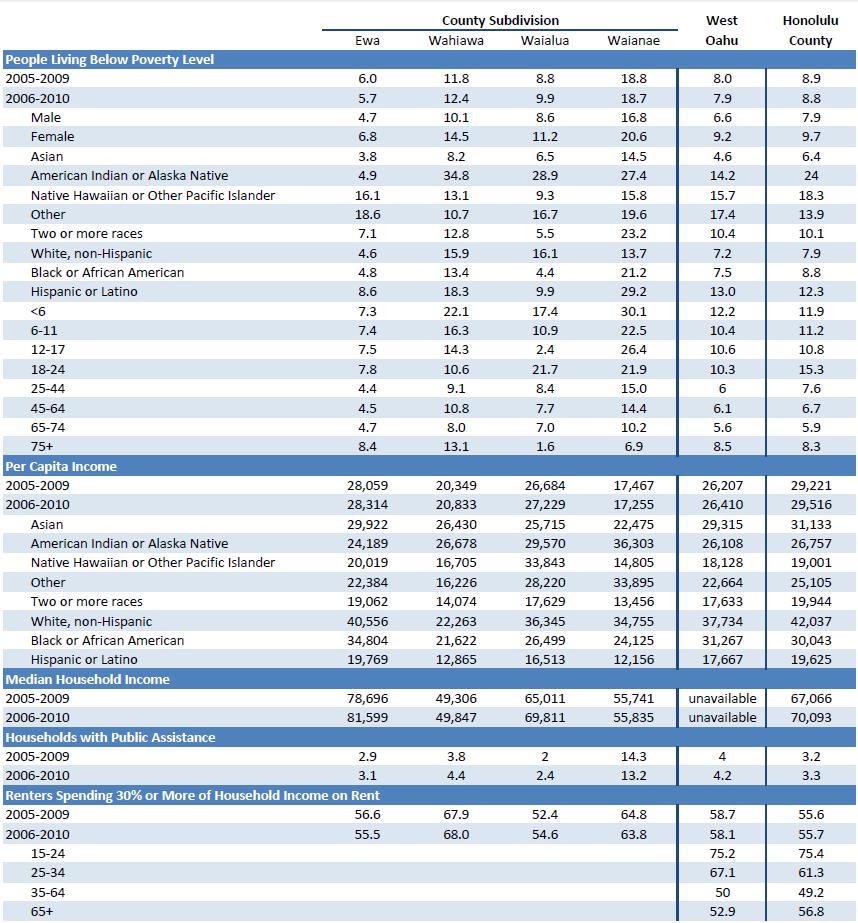
85 85
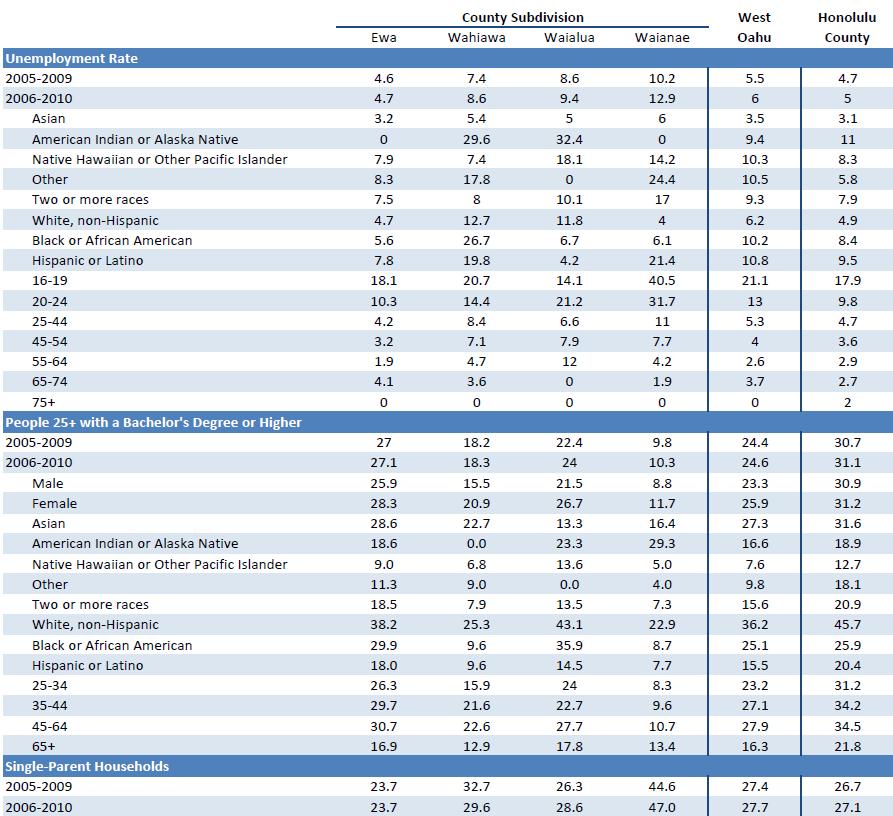
86 86
 derived the Hospital Service Areas (HSAs) used in this report.")
87 Appendix B: Hospitalization Data Hospital Service Areas Figure 5.3: Honolulu County Hospital Service Areas The Hawaii Health Information Corporation (HHIC) derived the Hospital Service Areas (HSAs) used in this report. These HSAs comprise contiguous zip codes surrounding hospitals self defined service areas, and were delineated by hospital CEOs in The following zip codes are included in each HSA: Honolulu Leeward Oahu Wahiawa Windward Kahuku Hospitalization Rates Rates were provided by HHIC, and are defined by the Agency for Healthcare Research and Quality (AHRQ) as a set of measures that can be used to identify quality of outpatient care, which can potentially prevent the need for hospitalization. Rates are risk adjusted based on the Healthcare Cost and Utilization Project s State Inpatient Databases. Please see for a complete definition of indicators. Because the area of mental health was not well represented in the core indicator summary, HHIC also provided unadjusted rates of hospitalization for any mental health related primary diagnosis. For all rates, values were suppressed if based on fewer than 10 cases. Population estimates are based on the U.S. Census Bureau, Population Division, Intercensal Estimates of the Resident Population for 87
Kauai County Community Health Needs Assessment. February 28, 2013
 Kauai County Community Health Needs Assessment February 28, 2013 Table of Contents Executive Summary... 3 Introduction... 3 Approach... 3 Data Sources and Methods... 3 Areas of Need... 4 Selected Priority
Castle Medical Center Community Health Needs Assessment
 h hh Castle Medical Center Community Health Needs Assessment December 16, 2013 Caring for our community, Sharing God s Love Mālama ana i kō kākou kaiāulu, Ka ana i ke aloha o ke Akua Table of Contents
Potentially Avoidable Hospitalizations in Tennessee, Final Report. May 2006
 The Methodist LeBonheur Center for Healthcare Economics 312 Fogelman College of Business & Economics Memphis, Tennessee 38152-3120 Office: 901.678.3565 Fax: 901.678.2865 Potentially Avoidable Hospitalizations
WilCo Wellness Alliance. Summit Presentation. Cara Woodard Account Manager. April 25, 2017
 WilCo Wellness Alliance Summit Presentation Cara Woodard Account Manager April 25, 2017 Background and Overview Healthy Communities Institute Mission Headquarters Improve the health, vitality and environmental
Community Health Needs Assessment Supplement
 2016 Community Health Needs Assessment Supplement June 30, 2016 Mission Statement, Core Values, and Guiding Social Teachings We, St. Francis Medical Center and Trinity Health, serve together in the spirit
2012 Community Health Needs Assessment
 2012 Community Health Needs Assessment University Hospitals (UH) long-standing commitment to the community spans more than 145 years. This commitment has grown and evolved through significant thought and
Health Indicators. for the Dallas/Fort Worth Combined Metropolitan Statistical Area Brad Walsh and Sue Pickens Owens
 Health Indicators Our Community Health for the Dallas/ Fort Worth Combined Metropolitan Statistical Area Checkup 2007 for the Dallas/Fort Worth Combined Metropolitan Statistical Area Brad Walsh and Sue
Implementation Strategy
 2017-2019 Implementation Strategy Table of Contents Introduction... 2 2016 Community Health Needs Assessment Summary... 2 Definition of the Community Service Area... 3 Significant Health Needs the Hospital
Community Health Needs Assessment for Corning Hospital: Schuyler, NY and Steuben, NY:
 Community Health Needs Assessment for Corning Hospital: Schuyler, NY and Steuben, NY: November 2012 Approved February 20, 2013 One Guthrie Square Sayre, PA 18840 www.guthrie.org Page 1 of 18 Table of Contents
COMMUNITY HEALTH NEEDS ASSESSMENT HINDS, RANKIN, MADISON COUNTIES STATE OF MISSISSIPPI
 COMMUNITY HEALTH NEEDS ASSESSMENT HINDS, RANKIN, MADISON COUNTIES STATE OF MISSISSIPPI Sample CHNA. This document is intended to be used as a reference only. Some information and data has been altered
COMMUNITY HEALTH NEEDS ASSESSMENT ST. VINCENT MADISON COUNTY SERVICE AREA COMMUNITY HEALTH NEEDS ASSESSMENT REPORT 2016
 2016 COMMUNITY HEALTH NEEDS ASSESSMENT ST. VINCENT MADISON COUNTY SERVICE AREA COMMUNITY HEALTH NEEDS ASSESSMENT REPORT 2016 COMMUNITY HEALTH NEEDS ASSESSMENT - 2 CONTENTS EXECUTIVE SUMMARY... 5 DEMOGRAPHICS...5
Chapter VII. Health Data Warehouse
 Broward County Health Plan Chapter VII Health Data Warehouse CHAPTER VII: THE HEALTH DATA WAREHOUSE Table of Contents INTRODUCTION... 3 ICD-9-CM to ICD-10-CM TRANSITION... 3 PREVENTION QUALITY INDICATORS...
BARNES-JEWISH HOSPITAL 2016 COMMUNITY HEALTH NEEDS ASSESSMENT & IMPLEMENTATION PLAN
 BARNES-JEWISH HOSPITAL 2016 COMMUNITY HEALTH NEEDS ASSESSMENT & IMPLEMENTATION PLAN 1 TABLE OF CONTENTS Executive Summary... 3 Community Description... 4 Geography... 4 Population Trends... 5 Income...
MONROE COUNTY HEALTH PROFILE. Finger Lakes Health Systems Agency, 2017
 MONROE COUNTY HEALTH PROFILE Finger Lakes Health Systems Agency, 2017 About the Report The purpose of this report is to provide a summary of health data specific to Monroe County. Where possible, benchmarks
STEUBEN COUNTY HEALTH PROFILE. Finger Lakes Health Systems Agency, 2017
 STEUBEN COUNTY HEALTH PROFILE Finger Lakes Health Systems Agency, 2017 About the Report The purpose of this report is to provide a summary of health data specific to Steuben County. Where possible, benchmarks
MEDICARE ENROLLMENT, HEALTH STATUS, SERVICE USE AND PAYMENT DATA FOR AMERICAN INDIANS & ALASKA NATIVES
 American Indian & Alaska Native Data Project of the Centers for Medicare and Medicaid Services Tribal Technical Advisory Group MEDICARE ENROLLMENT, HEALTH STATUS, SERVICE USE AND PAYMENT DATA FOR AMERICAN
ONTARIO COUNTY HEALTH PROFILE. Finger Lakes Health Systems Agency, 2017
 ONTARIO COUNTY HEALTH PROFILE Finger Lakes Health Systems Agency, 2017 About the Report The purpose of this report is to provide a summary of health data specific to Ontario County. Where possible, benchmarks
STEUBEN COUNTY HEALTH PROFILE
 STEUBEN COUNTY HEALTH PROFILE 2017 ABOUT THE REPORT The purpose of this report is to provide a summary of health data specific to Steuben County. Where possible, benchmarks have been given to compare county
LIVINGSTON COUNTY HEALTH PROFILE. Finger Lakes Health Systems Agency, 2017
 LIVINGSTON COUNTY HEALTH PROFILE Finger Lakes Health Systems Agency, 2017 About the Report The purpose of this report is to provide a summary of health data specific to Livingston County. Where possible,
CHEMUNG COUNTY HEALTH PROFILE. Finger Lakes Health Systems Agency, 2017
 CHEMUNG COUNTY HEALTH PROFILE Finger Lakes Health Systems Agency, 2017 About the Report The purpose of this report is to provide a summary of health data specific to Chemung County. Where possible, benchmarks
2016 Community Health Needs Assessment. Kaiser Foundation Hospital Fontana/Ontario License #
 2016 Community Health Needs Assessment Kaiser Foundation Hospital Fontana/Ontario License #240000159 To provide feedback about this Community Health Needs Assessment, email CHNA-communications@kp.org Approved
Community Performance Report
 : Wenatchee Current Year: Q1 217 through Q4 217 Qualis Health Communities for Safer Transitions of Care Performance Report : Wenatchee Includes Data Through: Q4 217 Report Created: May 3, 218 Purpose of
Hospital Discharge Data, 2005 From The University of Memphis Methodist Le Bonheur Center for Healthcare Economics
 Hospital Discharge Data, 2005 From The University of Memphis Methodist Le Bonheur Center for Healthcare Economics August 22, 2008 Potentially Avoidable Pediatric Hospitalizations in Tennessee, 2005 Cyril
EXECUTIVE SUMMARY... Page 3. I. Objectives of a Community Health Needs Assessment... Page 9. II. Definition of the UPMC Mercy Community...
 June 30, 2016 3 TABLE OF CONTENTS EXECUTIVE SUMMARY... Page 3 I. Objectives of a Community Health Needs Assessment... Page 9 II. Definition of the UPMC Mercy Community... Page 10 III. Methods Used to Conduct
Introduction. Background. Service Area Description/Determination
 Introduction UC Davis Medical Center, part of the UC Davis Health System, is a comprehensive academic medical center where clinical practice, teaching and research converge to advance human health. Centers
Implementation Strategy For the 2016 Community Health Needs Assessment North Texas Zone 2
 For the 2016 Community Health Needs Assessment North Texas Zone 2 Baylor Emergency Medical Center at Murphy Baylor Emergency Medical Center at Aubrey Baylor Emergency Medical Center at Colleyville Baylor
2013 Community Health Needs Assessment-Lakewood Hospital
 2013 Community Health Needs Assessment-Lakewood Hospital Founded in 1907, Lakewood Hospital is an acute care facility with 263 staffed beds offering advanced medical and surgical care, sophisticated technology,
Model Community Health Needs Assessment and Implementation Strategy Summaries
 The Catholic Health Association of the United States 1 Model Community Health Needs Assessment and Implementation Strategy Summaries These model summaries of a community health needs assessment and an
Union County Community Health Needs Assessment
 Community Health Needs Assessment November 2007 This page is intentionally left blank Community Health Needs Assessment November 2007 Health Department Needs Assessment Committee Winifred M. Holland, MPH,
Collaborative Activation of Resources and Empowerment Services Building Programs to Fit Patients vs. Bending Patients to Fit Programs
 Organization: Solution Title: Calvert Memorial Hospital Calvert CARES: Collaborative Activation of Resources and Empowerment Services Building Programs to Fit Patients vs. Bending Patients to Fit Programs
2016 Keck Hospital of USC Implementation Strategy
 2016 Keck Hospital of USC Implementation Strategy INTRODUCTION Keck Hospital of USC is a private, nonprofit 411-bed acute care hospital staffed by the faculty at the Keck School of Medicine of the University
Southwest General Health Center
 Southwest General Health Center Community Health Needs Assessment Executive Summary July 2016 Southwest General Health Center CHNA Executive Summary Introduction Southwest General Health Center, a 358-bed
2015 Community Health Needs Assessment Saint Joseph Hospital Denver, Colorado
 2015 Community Health Needs Assessment Saint Joseph Hospital Denver, Colorado December 11, 2015 [Type text] Page 1 Contributors Denver County Public Health Dr. Bill Burman, Director, and the team from
Carthage Area Hospital, Inc.
 Carthage Area Hospital, Inc. 1. Mission: Carthage Area Hospital provides quality comprehensive healthcare services in a community setting. 2. Service Area: Located in Northern New York, Carthage Area Hospital
1A) National-level Data Examples: Free or Inexpensive NHANES - National Health and Nutrition Examination Survey (NHANES). .
 National-level Data Examples: Free or Inexpensive NHANES - National Health and Nutrition Examination Survey (NHANES). .") 1A) National-level Data Examples: Free or Inexpensive NHANES - National Health and Nutrition Examination Survey (NHANES). Selected diseases and conditions including those undiagnosed or undetected - Nutrition
1A) National-level Data Examples: Free or Inexpensive NHANES - National Health and Nutrition Examination Survey (NHANES). Selected diseases and conditions including those undiagnosed or undetected - Nutrition
Chronic Disease Surveillance and Office of Surveillance, Evaluation, and Research
 Chronic Disease Surveillance and Office of Surveillance, Evaluation, and Research Potentially Preventable Hospitalizations Program 2015 Annual Meeting Nimisha Bhakta, MPH September 29, 2015 Presentation
September 2013 COMMUNITY HEALTH NEEDS ASSESSMENT: EXECUTIVE SUMMARY. Prepared by: Tripp Umbach TOURO INFIRMARY
 September 2013 COMMUNITY HEALTH NEEDS ASSESSMENT: EXECUTIVE SUMMARY Prepared by: Tripp Umbach TOURO INFIRMARY Introduction Touro Infirmary (Touro) is New Orleans' only community based, not for profit,
A Battelle White Paper. How Do You Turn Hospital Quality Data into Insight?
 A Battelle White Paper How Do You Turn Hospital Quality Data into Insight? Data-driven quality improvement is one of the cornerstones of modern healthcare. Hospitals and healthcare providers now record,
Implementation Strategy Report for Community Health Needs
 2013 Implementation Strategy Report for Community Health Needs Kaiser Foundation Hospital WALNUT CREEK License #140000290 Kaiser Foundation Hospitals Community Health Needs Assessment (CHNA) Implementation
Licensed Nurses in Florida: Trends and Longitudinal Analysis
 Licensed Nurses in Florida: 2007-2009 Trends and Longitudinal Analysis March 2009 Addressing Nurse Workforce Issues for the Health of Florida www.flcenterfornursing.org March 2009 2007-2009 Licensure Trends
METHODOLOGY FOR INDICATOR SELECTION AND EVALUATION
 CHAPTER VIII METHODOLOGY FOR INDICATOR SELECTION AND EVALUATION The Report Card is designed to present an accurate, broad assessment of women s health and the challenges that the country must meet to improve
Ambulatory-care-sensitive admission rates: A key metric in evaluating health plan medicalmanagement effectiveness
 Milliman Prepared by: Kathryn Fitch, RN, MEd Principal, Healthcare Management Consultant Kosuke Iwasaki, FIAJ, MAAA Consulting Actuary Ambulatory-care-sensitive admission rates: A key metric in evaluating
2016 Survey of Michigan Nurses
 2016 Survey of Michigan Nurses Survey Summary Report November 15, 2016 Office of Nursing Policy Michigan Department of Health and Human Services Prepared by the Michigan Public Health Institute Table of
Community Health Needs Assessment. And. Community Health Strategic Plan
 Community Health Needs Assessment And Community Health Strategic Plan June 30, 2013 TABLE OF CONTENTS EXECUTIVE SUMMARY... Page 3 I. Objectives of a Community Health Needs Assessment... Page 7 II. Definition
COMMUNITY HEALTH NEEDS ASSESSMENT. TMC Hospital Hill
 COMMUNITY HEALTH NEEDS ASSESSMENT TMC Hospital Hill TABLE OF CONTENTS 1 2 Letter from CEO 3 Purpose of the Report 4 Mission and Vision of Organization 5 Service Area 7 Process to Determine Priority Needs
Methodist Hospital of Sacramento Community Health Needs Assessment 2013 Community Benefit Implementation Plan
 Methodist Hospital of Sacramento 2013 Community Health Needs Assessment 2013 Community Benefit Implementation Plan Table of Contents I. 2013 Methodist Hospital of Sacramento Community Health Needs Assessment
Community Health Needs Assessment: St. John Owasso
 Community Health Needs Assessment: St. John Owasso IRC Section 501(r) requires healthcare organizations to assess the health needs of their communities and adopt implementation strategies to address identified
Maximizing the Community Health Impact of Community Health Needs Assessments Conducted by Tax-exempt Hospitals
 Maximizing the Community Health Impact of Community Health Needs Assessments Conducted by Tax-exempt Hospitals Consensus Statement from American Public Health Association (APHA), Association of Schools
Mary Free Bed Rehabilitation Hospital: COMMUNITY HEALTH NEEDS ASSESSMENT
 Mary Free Bed Rehabilitation Hospital: COMMUNITY HEALTH NEEDS ASSESSMENT 2016-2018 Acknowledgements PAGE 1 Executive Summary Mary Free Bed Rehabilitation Hospital is a non-for-profit, nationally-accredited,
Inpatient Experience Survey 2012 Research conducted by Ipsos MORI on behalf of Great Ormond Street Hospital
 1 Version 2 Internal Use Only Inpatient Experience Survey 2012 Research conducted by Ipsos MORI on behalf of Great Ormond Street Hospital Table of Contents 2 Introduction Overall findings and key messages
Suicide Among Veterans and Other Americans Office of Suicide Prevention
 Suicide Among Veterans and Other Americans 21 214 Office of Suicide Prevention 3 August 216 Contents I. Introduction... 3 II. Executive Summary... 4 III. Background... 5 IV. Methodology... 5 V. Results
Findings Brief. NC Rural Health Research Program
 Safety Net Clinics Serving the Elderly in Rural Areas: Rural Health Clinic Patients Compared to Federally Qualified Health Center Patients BACKGROUND Andrea D. Radford, DrPH; Victoria A. Freeman, RN, DrPH;
Caring for the Whole Patient Predictive Analytics Technology, Socio-demographic Insights, and Improved Patient Outcomes Randy K.
 WHITE PAPER Caring for the Whole Patient Randy K. Hawkins, MD Caring for the Whole Patient Socio-demographic data, not normally present in the electronic health record, and not routinely found in the hands
Community Health Needs Assessment & Implementation Strategy
 Community Health Needs Assessment & Implementation Strategy Fiscal Years 2014 2016 for Beth Israel Deaconess Hospital - Milton This report was prepared by: 95 Berkeley Street, Suite 208 Boston, MA 02116
CER Module ACCESS TO CARE January 14, AM 12:30 PM
 CER Module ACCESS TO CARE January 14, 2014. 830 AM 12:30 PM Topics 1. Definition, Model & equity of Access Ron Andersen (8:30 10:30) 2. Effectiveness, Efficiency & future of Access Martin Shapiro (10:30
Community Health Needs Assessment 2016
 Community Health Needs Assessment 2016 OSF ST. FRANCIS HOSPITAL & MEDICAL GROUP DELTA COUNTY CHNA 2016 Delta County 2 TABLE OF CONTENTS Executive Summary... 3 Introduction... 5 Methods... 6 Chapter 1.
Demographic Profile of the Officer, Enlisted, and Warrant Officer Populations of the National Guard September 2008 Snapshot
 Issue Paper #55 National Guard & Reserve MLDC Research Areas Definition of Diversity Legal Implications Outreach & Recruiting Leadership & Training Branching & Assignments Promotion Retention Implementation
Module 3 Identifying Health Problems
 Slide 1: Title Slide Module 3 Thank you for joining us for Module 3:. Now that we have defined our community, it s time to identify its priority health problems. Slide 2: Disclosures for Continuing Medical
CALIFORNIA HEALTHCARE FOUNDATION. Medi-Cal Versus Employer- Based Coverage: Comparing Access to Care JULY 2015 (REVISED JANUARY 2016)
") CALIFORNIA HEALTHCARE FOUNDATION Medi-Cal Versus Employer- Based Coverage: Comparing Access to Care JULY 2015 (REVISED JANUARY 2016) Contents About the Authors Tara Becker, PhD, is a statistician at the
CALIFORNIA HEALTHCARE FOUNDATION Medi-Cal Versus Employer- Based Coverage: Comparing Access to Care JULY 2015 (REVISED JANUARY 2016) Contents About the Authors Tara Becker, PhD, is a statistician at the
Cite as: LeVasseur, S.A. (2015) Nursing Education Programs Hawai i State Center for Nursing, University of Hawai i at Mānoa, Honolulu.
 Nursing Education Programs Hawai i State Center for Nursing, University of Hawai i at Mānoa, Honolulu.") Nursing Education Program Capacity 2012-2013 1 Written by: Dr. Sandra A. LeVasseur, PhD, RN Associate Director, Research Hawai i State Center for Nursing University of Hawai i at Mānoa, Honolulu, Hawai
Nursing Education Program Capacity 2012-2013 1 Written by: Dr. Sandra A. LeVasseur, PhD, RN Associate Director, Research Hawai i State Center for Nursing University of Hawai i at Mānoa, Honolulu, Hawai
Washington County Public Health
 Washington County Public Health Strategic Plan 2012-2016 Message from the Division Manager I am pleased to present the Washington County Public Health Division s strategic plan for fiscal years 2012 to
Community Health Needs Assessment. Implementation Plan FISCA L Y E AR
 Community Health Needs Assessment Implementation Plan FISCA L Y E AR 2 0 1 5-2 0 1 8 Table of Contents: I. Background 1 II. Areas of Priority 2 a. Preventive Care and Chronic Conditions b. Community Health
Colorado s Health Care Safety Net
 PRIMER Colorado s Health Care Safety Net The same is true for Colorado s health care safety net, the network of clinics and providers that care for the most vulnerable residents. The state s safety net
School of Public Health University at Albany, State University of New York
 2017 A Profile of New York State Nurse Practitioners, 2017 School of Public Health University at Albany, State University of New York A Profile of New York State Nurse Practitioners, 2017 October 2017
Texas Health Presbyterian Hospital Denton Community Health Needs Assessment: Implementation Strategy Report
 Texas Presbyterian Hospital Denton 2016 Needs Assessment: Implementation Strategy Report Implementation Strategy Outline 2 Report Contents Background About the Organizations CHNA Overview Implementation
DELAWARE FACTBOOK EXECUTIVE SUMMARY
 DELAWARE FACTBOOK EXECUTIVE SUMMARY DaimlerChrysler and the International Union, United Auto Workers (UAW) launched a Community Health Initiative in Delaware to encourage continued improvement in the state
Community Health Needs Assessment and Implementation Strategy
 Community Health Needs Assessment and Implementation Strategy St. Luke s Lakeside Hospital October 29, 2013 The for the St. Luke s Lakeside Hospital were conducted and developed between April 22 and October
=======================================================================
 ======================================================================= ----------------------------------------------------------------------- DEPARTMENT OF HEALTH AND HUMAN SERVICES Office of the Secretary
Community Health Needs Assessment July 2015
 Community Health Needs Assessment July 2015 1 Executive Summary UNM Hospitals is committed to meeting the healthcare needs of our community. As a part of this commitment, UNM Hospitals has attended forums
2014 MASTER PROJECT LIST
 Promoting Integrated Care for Dual Eligibles (PRIDE) This project addressed a set of organizational challenges that high performing plans must resolve in order to scale up to serve larger numbers of dual
TABLE OF CONTENTS. CHRISTUS Health Central Louisiana CHNA
 TABLE OF CONTENTS Figures... 3 Acknowledgements... 4 Executive Summary... 5 Introduction... 7 Methodology... 7 Advisory Committee... 8 Quantitative Indicators... 8 Key Informant Interview Protocol... 9
Updated validation of AHRQ Prevention Quality Indicators in the USA
 Updated validation of AHRQ Prevention Quality Indicators in the USA Patrick S. Romano, MD MPH UC Davis Center for Healthcare Policy and Research Organization for Economic Cooperation and Development October
Methodist McKinney Hospital Community Health Needs Assessment Overview:
 Methodist McKinney Hospital Community Health Needs Assessment Overview: 2017-2019 October 26, 2016 Prepared by MHS Planning CHNA Requirement: Overview In order to maintain tax exempt status, the Affordable
TECHNICAL ASSISTANCE GUIDE
 TECHNICAL ASSISTANCE GUIDE COE DEVELOPED CSBG ORGANIZATIONAL STANDARDS Category 3 Community Assessment Community Action Partnership 1140 Connecticut Avenue, NW, Suite 1210 Washington, DC 20036 202.265.7546
Waterloo Wellington Community Care Access Centre. Community Needs Assessment
 Waterloo Wellington Community Care Access Centre Community Needs Assessment Table of Contents 1. Geography & Demographics 2. Socio-Economic Status & Population Health Community Needs Assessment 3. Community
Achieving Health Equity After the ACA: Implications for cost, quality and access
 Achieving Health Equity After the ACA: Implications for cost, quality and access Michelle Cabrera, Research Director SEIU State Council April 23, 2015 SEIU California 700,000 Members Majority people of
Final Report No. 101 April Trends in Skilled Nursing Facility and Swing Bed Use in Rural Areas Following the Medicare Modernization Act of 2003
 Final Report No. 101 April 2011 Trends in Skilled Nursing Facility and Swing Bed Use in Rural Areas Following the Medicare Modernization Act of 2003 The North Carolina Rural Health Research & Policy Analysis
Hendrick Medical Center. Community Health Needs Assessment Implementation Plan
 Hendrick Medical Center Community Health Needs Assessment Implementation Plan - 2014-2016 Hendrick Medical Center Community Health Needs Assessment Implementation Plan - 2014-2016 Overview: Hendrick Medical
Balanced Scorecards & Population Health
 Balanced Scorecards & Population Health Presentation Outline of Work In Progress 1. Collaborators & Funding 2. Initial Four Questions & Underlying Assumption 3. Initial Findings 4. IOM Vision for American
Navigating Standard 3.1
 Navigating Standard 3.1 Annette Mercurio, MPH, MCHES City of Hope Duarte, CA Close Up is One Way to View It It s Helpful to Enlarge Perspective Standard 3.1 Patient Navigation Process A patient navigation
Prepared for North Gunther Hospital Medicare ID August 06, 2012
 Prepared for North Gunther Hospital Medicare ID 000001 August 06, 2012 TABLE OF CONTENTS Introduction: Benchmarking Your Hospital 3 Section 1: Hospital Operating Costs 5 Section 2: Margins 10 Section 3:
Medicare Spending and Rehospitalization for Chronically Ill Medicare Beneficiaries: Home Health Use Compared to Other Post-Acute Care Settings
 Medicare Spending and Rehospitalization for Chronically Ill Medicare Beneficiaries: Home Health Use Compared to Other Post-Acute Care Settings May 11, 2009 Avalere Health LLC Avalere Health LLC The intersection
2017 SPECIALTY REPORT ANNUAL REPORT
 2017 SPECIALTY REPORT ANNUAL REPORT National Commission on Certification of Physician Assistants Table of Contents Message from the President... 3 About the Data Collection and Methodology...4 All Specialties....
Hendrick Center for Extended Care. Community Health Needs Assessment Implementation Plan
 Hendrick Center for Extended Care Community Health Needs Assessment Implementation Plan - 2014-2016 Overview: Hendrick Center for Extended Care ( HCEC ) is a Long Term Acute Care Hospital, within Hendrick
UNIVERSITY OF HAWAI I SYSTEM TESTIMONY
 UNIVERSITY OF HAWAI I SYSTEM TESTIMONY SB 304 SD1: RELATING TO WORKFORCE DEVELOPMENT Testimony Presented Before the Senate Committee on Labor and Committee on Higher Education February 16, 2006 by Mary
California Community Clinics
 California Community Clinics A Financial and Operational Profile, 2008 2011 Prepared by Sponsored by Blue Shield of California Foundation and The California HealthCare Foundation TABLE OF CONTENTS Introduction
Successful Grant Writing
 December 2, 2011 Successful Grant Writing Simona Kwon NYU Center for the Study of Asian American Health Email: simona.kwon@nyumc.org Acknowledgements to Institute for Family Health, Grant Me This: Sustaining
Evaluation of Health Care Homes:
 Division of Health Policy PO Box 64882 St. Paul, MN 55164-0882 651-201-3626 www.health.state.mn.us Evaluation of Health Care Homes: 2010-2012 Minnesota Department of Health Minnesota Department of Human
HEDIS Ad-Hoc Public Comment: Table of Contents
 HEDIS 1 2018 Ad-Hoc Public Comment: Table of Contents HEDIS Overview... 1 The HEDIS Measure Development Process... Synopsis... Submitting Comments... NCQA Review of Public Comments... Value Set Directory...
2015 Executive Overview
 An Independent Licensee of the Blue Cross and Blue Shield Association 2015 Executive Overview Criteria for the Blue Cross and Blue Shield of Alabama Hospital Tiered Network will be updated effective January
2012 Community Health Needs Assessment
 Indiana University Health Goshen 2012 Community Health Needs Assessment A Report on Implementation Strategies to Address Community Health Needs Summary Report Our Commitment to You We are here for you,
PCMH 2014 Recognition Checklist
 1 PCMH1: Patient Centered Access 10.00 points Element A - Patient-Centered Appointment Access ~~ MUST PASS 4.50 points 1 Providing same-day appointments for routine and urgent care (Critical Factor) Policy
Demographic Profile of the Active-Duty Warrant Officer Corps September 2008 Snapshot
 Issue Paper #44 Implementation & Accountability MLDC Research Areas Definition of Diversity Legal Implications Outreach & Recruiting Leadership & Training Branching & Assignments Promotion Retention Implementation
Case-mix Analysis Across Patient Populations and Boundaries: A Refined Classification System
 Case-mix Analysis Across Patient Populations and Boundaries: A Refined Classification System Designed Specifically for International Quality and Performance Use A white paper by: Marc Berlinguet, MD, MPH
Leveraging the Community Health Needs Assessment Process to Improve Population Health: Lessons Learned from Kaiser Permanente
 Leveraging the Community Health Needs Assessment Process to Improve Population Health: Lessons Learned from Kaiser Permanente Association for Community Health Improvement (ACHI) 2015 Conference What We
Addressing Low Health Literacy to Achieve Racial and Ethnic Health Equity
 Hedge Health Funds 2/28/04 October 2009 Addressing Low Health to Achieve Racial and Ethnic Health Equity Anne Beal, MD, MPH President Aetna Foundation, Inc. Minorities Are More Likely to Have Diabetes
Grande Ronde Hospital, Inc. Community Needs Health Assessment Implementation Strategy Fiscal Years
 Grande Ronde Hospital, Inc. Community Needs Health Assessment Implementation Strategy Fiscal Years 2016-2018 In 2015, Grande Ronde Hospital (GRH) completed a wide-ranging, regionally inclusive Community
St. Barnabas Hospital, Bronx NY [aka SBH Health System]
![St. Barnabas Hospital, Bronx NY [aka SBH Health System]](/thumbs/74/70151677.jpg "St. Barnabas Hospital, Bronx NY [aka SBH Health System]") St. Barnabas Hospital, Bronx NY [aka SBH Health System] NYS 2016 Community Health Assessment and Improvement Plan and Community Service Plan The Service area covered by this work plan are the NYC South
St. Barnabas Hospital, Bronx NY [aka SBH Health System] NYS 2016 Community Health Assessment and Improvement Plan and Community Service Plan The Service area covered by this work plan are the NYC South
Disparities in Primary Health Care Experiences Among Canadians With Ambulatory Care Sensitive Conditions
 March 2012 Disparities in Primary Health Care Experiences Among Canadians With Ambulatory Care Sensitive Conditions Highlights This report uses the 2008 Canadian Survey of Experiences With Primary Health
Survey of Nurses 2015
 Survey of Nurses 2015 Prepared by Public Sector Consultants Inc. Lansing, Michigan www.pscinc.com There are an estimated... 104,351 &17,559 LPNs RNs onehundredfourteenthousdfourhundredtwentyregisterednursesactiveinmichigan