Community Health Needs Assessment 2016
|
|
|
- Alexandrina Parrish
- 5 years ago
- Views:
Transcription

1 Community Health Needs Assessment 2016
2 Contents Introduction... 1 Summary of Community Health Needs Assessment... 2 General Description of the Medical Center... 3 Evaluation of Prior Implementation Strategy... 5 Summary of Findings 2015 Tax Year CHNA... 6 Community Served by the Medical Center... 7 Defined Community... 6 Community Details... 7 Identification and Description of Geographical Community... 8 Community Population and Demographics... 9 Socioeconomic Characteristics of the Community Income and Employment Unemployment Rate Poverty Uninsured Medicaid Education Physical Environment of the Community Grocery Store Access Food Access/Food Deserts Recreation and Fitness Facility Access Clinical Care of the Community Access to Primary Care Lack of a Consistent Source of Primary Care Population Living in a Health Professional Shortage Area Preventable Hospital Events Health Status of the Community Leading Causes of Death Health Outcomes and Factors Diabetes (Adult) High Blood Pressure (Adult) Obesity... 32
3 Poor Dental Health Low Birth Weight Community Input Key Stakeholder Interviews Methodology Key Informant Profiles Key Stakeholder Interview Results Key Findings Health Issues of Vulnerable Populations Information Gaps Prioritization of Identified Health Needs Management s Prioritization Process Resources Available to Address Significant Health Needs Health Care Resources Hospitals Other Health Care Facilities Health Departments Appendices Appendix A: Analysis of Data Appendix B: Sources Appendix C: Dignity Health CNI Report Appendix D: Key Stakeholder Interview Protocol & Acknowledgements... 54

4 Introduction Internal Revenue Code (IRC) Section 501(r) requires health care organizations to assess the health needs of their communities and adopt implementation strategies to address identified needs. Per IRC Section 501(r), a byproduct of the Affordable Care Act, to comply with federal tax-exemption requirements, a tax-exempt hospital facility must: Conduct a community health needs assessment (CHNA) every three years. Adopt an implementation strategy to meet the community health needs identified through the assessment. Report how it is addressing the needs identified in the CHNA as well as a description of needs that are not being addressed with the reasons why such needs are not being addressed. The CHNA must take into account input from persons including those with special knowledge of or expertise in public health, those who serve or interact with vulnerable populations and those who represent the broad interest of the community served by the hospital facility. The hospital facility must make the CHNA widely available to the public. This CHNA, which describes both a process and a document, is intended to document Hendrick Medical Center s (Medical Center or Hendrick) compliance with IRC Section 501(r)(3). Health needs of the community have been identified and prioritized so that the Medical Center may adopt an implementation strategy to address specific needs of the community. The process involved: An evaluation of the implementation strategy for fiscal years ending August 31, 2014 through August 31, 2016, which was adopted by the Medical Center board of directors in Collection and analysis of a large range of data, including demographic, socioeconomic and health statistics, health care resources and hospital data. Obtaining community input through interviews with key stakeholders who represent a) persons with specialized knowledge in public health, b) populations of need or c) broad interests of the community. This document is a summary of all the available evidence collected during the CHNA conducted in tax year It will serve as a compliance document, as well as a resource, until the next assessment cycle. Both the process and document serve as the basis for prioritizing the community s health needs and will aid in planning to meet those needs. Intital CHNA Adopted August Tax Year Implementation Strategy Calendar Years Ending August 31, 2014, August 31, 2015 and August 31, 2016 CHNA 2015 Tax Year August 31,
5 Summary of Community Health Needs Assessment The purpose of the CHNA is to understand the unique health needs of the community served by the Medical Center and to document compliance with new federal laws outlined above. The Medical Center engaged BKD, LLP to conduct a formal CHNA. BKD, LLP is one of the largest CPA and advisory firms in the United States, with approximately 2,000 partners and employees in 34 offices. BKD serves more than 900 hospitals and health care systems across the country. The CHNA was conducted from January 2016 to June Based on current literature and other guidance from the treasury and the IRS, the following steps were conducted as part of Hendrick s CHNA: An evaluation of the impact of actions taken to address the significant health needs identified in the tax year 2013 CHNA was completed to understand the effectiveness of the Hendrick s current strategies and programs. The community served by Hendrick was defined by utilizing inpatient data regarding patient origin. This process is further described in Community Served by the Medical Center. Population demographics and socioeconomic characteristics of the community were gathered and reported utilizing various third parties (see references in Appendices). The health status of the community was then reviewed. Information on the leading causes of death and morbidity information was analyzed in conjunction with health outcomes and factors reported for the community by the Center for Disease Control and Prevention (Community Health Status Indicators) as well as countyhealthrankings.org. Health factors with significant opportunity for improvement were noted. Community input was provided through key stakeholder interviews of 33 stakeholders. Results and findings are described in the Key Stakeholder Interview Results section of this report. Information gathered in the above steps was analyzed and reviewed to identify health issues of uninsured persons, low-income persons and minority groups and the community as a whole. Health needs were ranked utilizing a weighting method that weighs 1) the size of the problem, 2) the seriousness of the problem, 3) the impact of the issues on vulnerable populations, 4) the prevalence of common themes and 5) how important the issue is to the community. An inventory of health care facilities and other community resources potentially available to address the significant health needs identified through the CHNA was prepared and collaborative efforts were identified. Health needs were then prioritized taking into account the perceived degree of influence the Medical Center has to impact the need and the health needs impact on overall health for the community. Information gaps identified during the prioritization process have been reported. 2
6 General Description of the Medical Center Hendrick Medical Center is a 522 bed medical center located in Abilene, Texas, that offers a women s center, cancer center and numerous other innovative services. In service for over 90 years, Hendrick was the first hospital to permanently serve the Texas Midwest when its doors opened in Hendrick is an institution where people can feel a strong sense of belonging, an advanced medical provider the people of Texas Midwest can call their own. Hendrick offers aggressive, innovative treatments and preventative healthcare measures ranging from services such as cancer screenings and pre-natal education courses to electro-physiology procedures and pediatric intensive care. Providing the strength of a complete system of health services available in their own backyards, most of the citizens of Abilene and the 19 counties that surround it look to Hendrick as their first choice for healthcare. In fact, research shows 64 percent of area residents prefer Hendrick for their healthcare needs. Mission To deliver high quality healthcare emphasizing excellence and compassion consistent with the healing ministry of Jesus Christ. Vision To be the leading healthcare provider of choice in our region and beyond recognized for enhancing quality, expanding access and excelling in patient engagement. Integrity: Reflect honesty, transparency and trust Core Values Teamwork: Value our diverse talents, backgrounds, ideas and experiences to improve outcomes and create solutions Compassion: Treat patients with dignity, sensitivity and empathy Excellence: Demonstrate efficient stewardship of our resources that consistently results in quality improvement and outstanding customer service Positive Attitude: Expect the best possible outcomes while performing responsibilities and interacting with patients, visitors and fellow employees Engagement: Cultivate an environment of commitment, communication, personal and professional growth, and a shared vision for success 3

7 Our Pledge to Patients, Families and Co-Workers: Patient-Centered Pledge I WILL Communicate Share and receive meaningful information Support Stand up, educate others and lend a voice Unite Work together for a common purpose Be Professional Maintain high standards and respect for myself and others Take Ownership Understand how my role contributes to our organization and community TO ACHIEVE Safety Protect others by following best practices and policies Quality Perform with consistency and excellence for the best possible outcome Integrity Do what is right all the time TO UPHOLD Our Mission Statement To deliver high quality healthcare emphasizing excellence and compassion consistent with the healing ministry of Jesus Christ. 4
8 Evaluation of Prior Implementation Strategy The implementation strategy for fiscal years ending August 30, 2014 August 30, 2016, focused on three priorities to address identified health needs. Based on the Medical Center s most recent evaluation, the Medical Center has made significant progress in meeting their goals and strategies outlined in their 2013 Implementation Strategy as reported below. Summary of 3-year Results 2013 Implementation Strategy Priority 1: Primary Care Physicians Added 2 Internal Medicine providers (Net 1) Added 4 Family Medicine providers (Net 3) Opening of South Abilene, Hendrick Medical Plaza Continued partnership with Presbyterian Medical Care Mission to care for uninsured patients Rural response to health needs in surrounding areas Priority 2: Health Education In 3 years, documented approximately 17,797 education opportunities (Cancer, Heart, COPD, Diabetes, Ortho, Wellness & Women s Health) 1,027 screened at A Day to Take Heart 2,425 received diabetes education Increased Joint Venture attendance from 92% to 95% Health education partnership with IRC to target refugee health Priority 3: Chronic Disease Management Diabetes education working with Stephens Memorial Hospital to trial a satellite DSME Clinic in Breckenridge one day a month as of March Heart Failure Accreditation achieved and Transition of Care program implemented Pathways program expanded to include outpatient services 300 enrolled in Hendrick Professional Pharmacy program to assists chronic disease patients acquire medications as low as $2 per prescription. CHF, DM, COPD and HTN for $2.00 per month per prescription if the patient has a financial barrier defined as medical insurance that provides no coverage of these items. Collaboratively with Texas Tech University Health Sciences Center (TTUHSC), a Federally Qualified Health Center (FQHC) was established. Texas Tech FQHC provides indigent, uninsured and underserved healthcare by nurse practitioners and collaborates with HMC chronic care program in the management of these patients 5
9 Summary of Findings 2015 Tax Year CHNA Community Health Needs Assessment 2016 Health needs were identified based on information gathered and analyzed through the 2016 CHNA conducted by the Medical Center. These identified community health needs are discussed in greater detail later in this report and the prioritized listing is available at Exhibit 26. Based on the prioritization process, the following significant needs were identified: Lack of health knowledge/education Healthy behaviors/lifestyle choices Adult obesity Lack of primary care physicians High cost of health care Uninsured Poverty/children in poverty Diabetes Physical inactivity Lack of mental health services/providers Language/cultural mindset Lack of agency collaboration Utilization of emergency room for episodic care Heart disease Transportation in rural areas These needs have been prioritized based on information gathered through the CHNA and the prioritization process is discussed in greater detail later in this report. 6
10 Community Served by the Medical Center The Medical Center is located in Abilene, Texas, in Taylor County, 2 hours between Midland and Fort Worth, Texas. The Medical Center is located off Interstate highway 20. As a regional facility, the Medical Center serves residents in and around the Abilene. Hendrick serves 19 counties that surround Taylor County including Fisher, Jones, Shackelford, Nolan, Callahan, Coke, Runnels and Coleman Counties which surround Taylor County. These counties are more rural in nature and hospitals available in the surrounding counties are primarily critical access hospitals. Some of the surrounding counties do not have a hospital located within them. Defined Community A community is defined as the geographic area from which a significant number of the patients utilizing Medical Center services reside. While the CHNA considers other types of health care providers, the Medical Center is the single largest provider of acute care services. For this reason, the utilization of Medical Center services provides the clearest definition of the community. Based on the patient origin of acute care inpatient discharges from July 1, 2014, through August 31, 2015, management has identified Taylor County as the defined CHNA community. Taylor County represents approximately 60% of the inpatient discharges as reflected in Exhibit 1 below. The CHNA will utilize data and input from this county, as well as the top five zip codes within Taylor County to analyze health needs for the community. Exhibit 1 Summary of Inpatient Discharges by Zip Code 7/1/2014-8/31/2015 Percent Zip Code City Discharges Discharges Taylor County: Abilene 1, % Abilene 1, % Abilene 1, % Abilene 1, % Abilene % Other Taylor % Total Taylor County 7, % All Other 5, % Total 13, % Source: Hendrick Medical Center 7

11 Community Details Identification and Description of Geographical Community The following map geographically illustrates the Medical Center s community by showing the community zip codes shaded by number of inpatient discharges. The map below displays the Medical Center s geographic relationship to the community, as well as significant roads and highways. 8
12 Community Population and Demographics The U.S. Bureau of Census has compiled population and demographic data. Exhibit 2 below shows the total population of the CHNA community. It also provides the breakout of the CHNA community between the male and female population, age distribution, race/ethnicity and the Hispanic population. DEMOGRAPHIC CHARACTERISTICS Total Taylor Population County Taylor County 133,560 Texas 26,092,032 Total Male Population 65,239 United States 314,107,083 Total Female Populati 68,321 POPULATION DISTRIBUTION Age Distribution Taylor Percent of Percent Percent Age Group County Total Texas of Total Texas United States of Total US 0-4 9, % 1,940, % 19,973, % , % 5,049, % 53,803, % , % 2,675, % 31,273, % , % 3,766, % 42,310, % , % 3,556, % 40,723, % , % 3,451, % 44,248, % , % 2,801, % 38,596, % , % 2,849, % 43,177, % Total 133, % 26,092, % 314,107, % RACE/ETHNICITY Exhibit 2 Demographic Snapshot Race/Ethnicity Distribution Taylor Percent of Percent Percent Race/Ethnicity County Total Texas of Total Texas United States of Total US White Non-Hispanic 88, % 11,562, % 197,159, % Hispanic 30, % 9,962, % 53,070, % Black Non-Hispanic 9, % 3,015, % 38,460, % Asian & Pacific Island Non-Hispanic 2, % 1,072, % 16,029, % All Others 2, % 478, % 9,387, % Total 133, % 26,092, % 314,107, % Source: Community Commons (ACS data sets) While the relative age of the community population can impact community health needs, so can the ethnicity and race of a population. The population of the CHNA community by race and illustrates different categories of race such as, white, black, Asian, other and multiple races. White non-hispanics make up almost 66% of the community while Hispanics make up approximately 23% of the CHNA community. The community within Taylor County is more diverse when comparing all other race/ethnicities to the state of Texas. This is largely due to the International Rescue Committee office and services available in Abilene (Taylor County), which provides opportunities for refugees to thrive in America. 9
13 Exhibit 3 reports the percentage of population living in urban and rural areas. Urban areas are identified using population density, count, and size thresholds. Urban areas also include territory with a high degree of impervious surface (development). Rural areas are all areas that are not urban. This table could help to understand why transportation may or may not be considered a need within the community, especially within the rural and outlying populations. Exhibit 3 County Percent Urban Percent Rural Abilene 96.81% 3.13% Abilene 98.97% 1.03% Abilene 66.07% 33.93% Abilene 82.87% 17.13% Abilene 86.89% 13.11% Taylor County, TX 83.97% 16.03% TEXAS 84.70% 15.30% UNITED STATES 80.89% 19.11% Source: Community Commons (2010) 10
14 Socioeconomic Characteristics of the Community Community Health Needs Assessment 2016 The socioeconomic characteristics of a geographic area influence the way residents access health care services and perceive the need for health care services within society. The economic status of an area may be assessed by examining multiple variables within the CHNA community. The following exhibits are a compilation of data that includes household per capita income, unemployment rates, poverty, uninsured population and educational attainment for the CHNA community. These standard measures will be used to compare the socioeconomic status of the community to the state of Texas and the United States. Income and Employment Exhibit 4 presents the per capita income for the CHNA community. This includes all reported income from wages and salaries, as well as income from self-employment, interest or dividends, public assistance, retirement and other sources. The per capita income in this exhibit is the average (mean) income computed for every man, woman and child in the specified area. Taylor County s per capita income is below the state of Texas and the United States. There is a large disparity between zip codes and within the CHNA community; with having a per capita income well below Texas and the United States. Exhibit 4 County Total Population Total Income ($) Per Capita Income ($) Abilene 23,877 $ 439,542,112 $ 18, Abilene 29,903 $ 679,833,600 $ 22, Abilene 27,433 $ 411,804,992 $ 15, Abilene 21,885 $ 544,636,032 $ 24, Abilene 23,879 $ 713,999,296 $ 29,900 Taylor County, TX 133,560 $ 3,134,932,736 $ 23,472 TEXAS 26,092,032 $ 691,771,801,600 $ 26,512 UNITED STATES 314,107,072 $ 8,969,237,037,056 $ 28,554 Source: Community Commons ( ) 11

15 Unemployment Rate Exhibit 5 presents the average annual unemployment rate from for the community defined as the community, as well as the trend for Texas and the United States. On average, the unemployment rates for the community are lower than both the United States and the state of Texas. A decrease in the unemployment rate has been the trend since Exhibit 5 Poverty Data Source: US Department of Labor, Bureau of Labor Statistics May. Source geography: County Exhibit 6 presents the percentage of total population below 100% Federal Poverty Level (FPL). Poverty is a key driver of health status and is relevant because poverty creates barriers to access, including health services, healthy food choices and other factors that contribute to poor health. Taylor County s poverty rate is greater than the state poverty rate and the national rate. Zip code has the highest poverty rate of 29.83% when compared to Texas and the United States. Exhibit 6 County Total Population Population in Poverty Percent Population in Poverty Abilene 23,491 5, % Abilene 28,881 4, % Abilene 18,373 5, % Abilene 21,034 4, % Abilene 23,548 2, % Taylor County, TX 127,628 23, % TEXAS 25,478,976 4,500, % UNITED STATES 306,226,400 47,755, % Data Source: US Census Bureau, American Community Survey Source geography: Tract Note: Total population for poverty status was determined at the household level. 12

16 Uninsured Exhibit 7 reports the percentage of the total civilian non-institutionalized population without health insurance coverage. This indicator is relevant because lack of insurance is a primary barrier to health care access, including regular primary care, specialty care and other health services that contribute to poor health status. Exhibit 7 shows almost 24,000 persons are uninsured in the CHNA community based on 5- year estimates produced by the U.S. Census Bureau, American Community Survey. However, the 2015 uninsured rate is estimated to be 16% for Taylor County, per which indicates the uninsured population has decreased by an additional 2,000 persons, since 2014, in in the CHNA Community; primarily the result of the Affordable Care Act. The table below shows of the main zip codes, zip code has the highest percentage of uninsured and is the only zip code higher than Texas and the United States rate. Exhibit 7 Percent Uninsured Population County Total Population (For Whom Insurance Status is Determined) Total Uninsured Population Percent Uninsured Population Abilene 23,475 6, % Abilene 29,351 5, % Abilene 20,395 3, % Abilene 20,951 4, % Abilene 22,786 2, % Taylor County, TX (18.48%) Texas (21.91%) United States (14.20%) Taylor County, TX 128,969 23, % TEXAS 25,613,334 5,610, % UNITED STATES 309,082,272 43,878, % Data Source: US Census Bureau, American Community Survey Source geography: Tract 13
17 Medicaid The Medicaid indicator reports the percentage of the population with insurance enrolled in Medicaid (or other means-tested public health insurance). This is relevant because it assesses vulnerable populations, which are more likely to have multiple health access, health status and social support needs; when combined with poverty data, providers can use this measure to identify gaps in eligibility and enrollment. Exhibit 8 shows Taylor County as a whole ranks favorably compared to the state of Texas, while zip codes and rank unfavorably to both the state of Texas and the United States. County Total Population (For Whom Insurance Status is Determined) Exhibit 8 Population with Any Health Insurance Population Receiving Medicaid Percent of Insured Population Receiving Medicaid Percent of Insured Population Receiving Medicaid Abilene 23,475 17,402 5, % Abilene 29,351 23,963 6, % Abilene 20,395 16,643 3, % Abilene 20,951 16,737 3, % Taylor County, TX (21.84%) Texas (22.06%) United States (20.75%) Abilene 22,786 19,884 2, % Taylor County, TX 128, ,135 22, % TEXAS 25,613,334 20,002,428 4,412, % UNITED STATES 309,082, ,204,128 55,035, % Data Source: US Census Bureau, American Community Survey Source geography: Tract 14
18 Education Exhibit 9 presents the population with an Associate s degree or higher in Taylor County versus Texas and the United States. County Total Population Age 25 Exhibit 9 Population Age 25 with Associate s Degree or Higher Percent Population Age 25 with Associate s Degree or Higher Percent Population Age 25 With Associate s Degree or Higher Abilene 14,890 2, % Abilene 18,702 5, % Abilene 16,219 3, % Abilene 14,141 4, % Abilene 15,125 6, % Taylor County, TX (31.74%) Texas (33.66%) United States (37.21%) Taylor County, TX 81,156 25, % TEXAS 16,426,730 5,529, % UNITED STATES 209,056,128 77,786, % Data Source: US Census Bureau, American Community Survey Source geography: Tract Education levels obtained by community residents may impact the local economy. Higher levels of education generally lead to higher wages, less unemployment and job stability. These factors may indirectly influence community health. As noted in Exhibit 9, the percent of residents within the CHNA community of Taylor County obtaining an associate s degree or higher is below the state and national percentages. Only zip codes and have a greater percentage of the population with an associate s degree or higher. 15
19 Physical Environment of the Community A community s health is also affected by the physical environment. A safe, clean environment that provides access to healthy food and recreational opportunities is important to maintaining and improving community health. This section will touch on a few of the elements that relate to some needs mentioned throughout the report. Grocery Store Access Exhibit 10 reports the number of grocery stores per 100,000-population. Grocery stores are defined as supermarkets and smaller grocery stores primarily engaged in retailing a general line of food, such as canned and frozen foods, fresh fruits and vegetables and fresh and prepared meats, such as fish and poultry. Included are delicatessen-type establishments. Convenience stores and large general merchandise stores that also retail food, such as supercenters and warehouse club stores, are excluded. This indicator is relevant because it provides a measure of healthy food access and environmental influences on dietary behaviors. Exhibit 10 Grocery Stores, Rate (Per 100,000 Population) County Total Population Number of Establishments Establishments, Rate per 100,000 Population Abilene 24, Abilene 30, Abilene 25, Abilene 21, Abilene 22, Taylor County, TX 131, Taylor County, TX (10.65) Texas (13.80) United States (21.20) TEXAS 25,145,561 3, UNITED STATES 312,732,537 66, Data Source: U.S. Census Bureau, County Business Patterns. Additional data analysis by CARES Source geography: County 16
20 Food Access/Food Deserts This indicator reports the percentage of the population living in census tracts designated as food deserts. A food desert is defined as a low-income census tract where a substantial number or share of residents has low access to a supermarket or large grocery stores. The information in Exhibit 11 below is relevant because it highlights populations and geographies facing food insecurity. Taylor County as a whole along with zip codes 79605, 79602, and have a population with low food access when compared to Texas and the United States. Exhibit 11 Percent Population With Low Food Access Exhibit 11 Total Population Population With Low Food Access Percent Population With Low Food Access Abilene 24,288 7, % Abilene 30,098 12, % Abilene 25,085 2, % Abilene 21,519 7, % Abilene 22,885 9, % Taylor County, TX (31.04%) Texas (30.38%) United States (23.61%) Taylor County, TX 131,506 40, % TEXAS 25,145,561 7,639, % UNITED STATES 308,745,538 72,905, % Data Source: US Department of Agriculture, Economic Research Service, USDA - Food Access Research Atlas Source geography: Tract 17
21 Recreation and Fitness Facility Access This indicator reports the number per 100,000-population of recreation and fitness facilities as defined by North American Industry Classification System (NAICS) Code It is relevant because access to recreation and fitness facilities encourages physical activity and other healthy behaviors. Exhibit 12 shows that Taylor County has fewer fitness establishments available to the residents of the community than Texas as a whole. County Exhibit 12 Total Population Number of Establishments Establishments, Rate per 100,000 Population Recreation and Fitness Facilities, Rate (Per 100,000 Population) Abilene 24, Abilene 30, Abilene 25, Abilene 21, Abilene 22, Taylor County, TX 131, TEXAS 25,145,561 1, Taylor County, TX (7.60) Texas (7.70) United States (9.70) UNITED STATES 312,732,537 30, Data Source: US Census Bureau, County Business Patterns. Additional data analysis by CARES Source geography: County 18

22 The trend graph below (Exhibit 13) shows the percentage of adults who are physically inactive by year for the community and compared to Texas and the United States. From , the CHNA community percentage of adults who are physically inactive were on the rise and higher than both the state of Texas and the United States. The trend has been decreasing since 2009, when the community hit a peak of 33%. The latest data (2012) shows that the community now has a lower percentage of physically inactive adults than the state of Texas. Exhibit 13 Data Source: Centers for Disease Control and Prevention, National Center for Chronic Disease Prevention and Health Promotion Source geography: County 19
23 Clinical Care of the Community A lack of access to care presents barriers to good health. The supply and accessibility of facilities and physicians, the rate of uninsured, financial hardship, transportation barriers, cultural competency and coverage limitations affect access. Rates of morbidity, mortality and emergency hospitalizations can be reduced if community residents access services such as health screenings, routine tests and vaccinations. Prevention indicators can call attention to a lack of access or knowledge regarding one or more health issues and can inform program interventions. Access to Primary Care Exhibit 14 shows the number of primary care physicians per 100,000-population. Doctors classified as primary care physicians by the American Medical Association include general family medicine MDs and DOs, general practice MDs and DOs, general internal medicine MDs and general pediatrics MDs. Physicians age 75 and over and physicians practicing sub-specialties within the listed specialties are excluded. This indicator is relevant because a shortage of health professionals contributes to access and health status issues. Exhibit 14 County Total Population, 2012 Primary Care Physicians, 2012 Primary Care Physicians, Rate per 100,000 Pop Abilene 24, Abilene 30, Abilene 25, Abilene 21, Abilene 23, Taylor County, TX 133, TEXAS 26,059,203 15, UNITED STATES 313,914, , Data Source: US Department of Health Human Services, Health Resources and Services Administration, Area Health Resource File Source geography: County Although the above Exhibit shows Taylor County as having a greater rate of primary care physicians than the state, the map below shows many of the surrounding counties are lacking sufficient access to primary care. Many of the hospitals located in these counties are short-term and critical access hospitals, while some counties do not even have a hospital located within them (for example, Coke and Shackelford Counties). Residents in the surrounding counties rely on medical providers located in Taylor County. The rate of primary care physicians per 100,000 population for the counties outlined in red on the map below is 53.4 which is below the state and national rates. 20

24 Lack of a Consistent Source of Primary Care Exhibit 15 reports the percentage of adults aged 18 and older who self-report that they do not have at least one person who they think of as their personal doctor or health care provider. This indicator is relevant because access to regular primary care is important to preventing major health issues and emergency department visits. Exhibit 15 County Survey Population (Adults Age 18 ) Total Adults Without Any Regular Doctor Percent Adults Without Any Regular Doctor Taylor County, TX 79,291 13, % Texas 18,375,873 5,946, % United States 236,884,668 52,290, % Data Source: Centers for Disease Control and Prevention, Behavioral Risk Factor Surveillance System. Additional data analysis by CARES Source geography: County. Note: Information reported above is unavailable at the zip code level. 21
, defined as having a shortage of primary medical care, dental or mental health professionals.")
25 Population Living in a Health Professional Shortage Area Community Health Needs Assessment 2016 This indicator reports the percentage of the population that is living in a geographic area designated as a Health Professional Shortage Area (HPSA), defined as having a shortage of primary medical care, dental or mental health professionals. This indicator is relevant because a shortage of health professionals contributes to access and health status issues. As Exhibit 16 below shows, Taylor County is not considered a health professional shortage area. The map below show residents within all the surrounding counties are living in a health professional shortage area, with the exception of Nolan and Callahan Counties. Exhibit 16 County Total Area Population Population Living in a HPSA Percentage of Population Living in a HPSA Taylor County, TX 131, % Texas 25,145,561 6,121, % United States 308,745, ,203, % Data Source: U.S. Department of Health Human Services, Health Resources and Services Administration, Health Professional Shortage Areas. March Source geography: HPSA Note: Information reported above is unavailable at the zip code level. Population Group; Over 20.0 FTE Needed Population Group; FTE Needed Population Group; Under 1.1 FTE Needed Geographic Area; Over 20.0 FTE Needed Geographic Area; FTE Needed Geographic Area; Under 1.1 FTE Needed Report Area 22
26 Preventable Hospital Events Exhibit 17 reports the discharge rate (per 1,000 Medicare enrollees) for conditions that are ambulatory care sensitive (ACS). ACS conditions include pneumonia, dehydration, asthma, diabetes and other conditions, which could have been prevented if adequate primary care resources were available and accessed by those patients. This indicator is relevant because analysis of ACS discharges allows demonstrating a possible return on investment from interventions that reduce admissions (for example, for uninsured or Medicaid patients) through better access to primary care resources. Exhibit 17 County Total Medicare Part A Enrollees Ambulatory Care Sensitive Condition Medical Center Discharges Ambulatory Care Sensitive Condition Discharge Rate Taylor County, TX 15, Texas 2,030, , United States 58,209,898 3,448, Data Source: Dartmouth College Institute for Health Policy Clinical Practice, Dartmouth Atlas of Health Care Source geography: County Note: Information reported above is unavailable at the zip code level. 23
27 Health Status of the Community This section of the assessment reviews the health status of the CHNA community and its residents. As in the previous section, comparisons are provided with the state of Texas and the United States. This in-depth assessment of the mortality and morbidity data, health outcomes, health factors and mental health indicators of the county residents that make up the CHNA community will enable the Medical Center to identify priority health issues related to the health status of its residents. Good health can be defined as a state of physical, mental and social well-being, rather than the absence of disease or infirmity. According to Healthy People 2020, the national health objectives released by the U.S. Department of Health and Human Services, individual health is closely linked to community health. Community health, which includes both the physical and social environment in which individuals live, work and play, is profoundly affected by the collective behaviors, attitudes and beliefs of everyone who lives in the community. Healthy people are among a community s most essential resources. Numerous factors have a significant impact on an individual s health status: lifestyle and behavior, human biology, environmental and socioeconomic conditions, as well as access to adequate and appropriate health care and medical services. Studies by the American Society of Internal Medicine conclude that up to 70% of an individual s health status is directly attributable to personal lifestyle decisions and attitudes. Persons who do not smoke, drink in moderation (if at all), use automobile seat belts (car seats for infants and small children), maintain a nutritious low-fat, high-fiber diet, reduce excess stress in daily living and exercise regularly have a significantly greater potential of avoiding debilitating diseases, infirmities and premature death. The interrelationship among lifestyle/behavior, personal health attitude and poor health status is gaining recognition and acceptance by both the general public and health care providers. Some examples of lifestyle/behavior and related health care problems include the following: Lifestyle/Behavior Smoking Alcohol/drug abuse Poor nutrition Driving at excessive speeds Lack of exercise Overstressed Primary Disease Factor Lung cancer Cardiovascular disease Cirrhosis of liver Motor vehicle crashes Unintentional injuries Malnutrition Obesity Digestive disease Depression Trauma Motor vehicle crashes Cardiovascular disease Depression Mental illness Alcohol/drug abuse Cardiovascular disease Emphysema Chronic bronchitis Suicide Homicide Mental illness 24
28 Health problems should be examined in terms of morbidity as well as mortality. Morbidity is defined as the incidence of illness or injury, and mortality is defined as the incidence of death. Such information provides useful indicators of health status trends and permits an assessment of the impact of changes in health services on a resident population during an established period of time. Community attention and health care resources may then be directed to those areas of greatest impact and concern. Leading Causes of Death and Health Outcomes Exhibit 18 reflects the leading causes of death for the community and compares the age-adjusted rates to the state of Texas and the United States. Exhibit 18 Selected Causes of Resident Deaths Age-Adjusted Death Rate per 100,000 Population Taylor County Texas United States Cancer Heart Disease Lung Disease Stroke Unintentional Injury Source: Community Commons The table above shows leading causes of death within Taylor County as compared to the state of Texas and the United States. The age-adjusted rate is shown per 100,000 residents. The rates in red represent Taylor County and corresponding leading causes of death that are greater than the state rates. As the table indicates, all of the leading causes of death above are greater than the Texas and national rates. 25
29 Health Outcomes and Factors An analysis of various health outcomes and factors for a particular community can, if improved, help make the community a healthier place to live, learn, work and play. A better understanding of the factors that affect the health of the community will assist with how to improve the community s habits, culture and environment. This portion of the community health needs assessment utilizes information from County Health Rankings, a key component of the Mobilizing Action Toward Community Health (MATCH) project, a collaboration between the Robert Wood Johnson Foundation and the University of Wisconsin Population Health Institute. The County Health Rankings model is grounded in the belief that programs and policies implemented at the local, state and federal levels have an impact on the variety of factors that, in turn, determine the health outcomes for communities across the nation. The model provides a ranking method that ranks all 50 states and the counties within each state, based on the measurement of two types of health outcomes for each county: how long people live (mortality) and how healthy people feel (morbidity). These outcomes are the result of a collection of health factors and are influenced by programs and policies at the local, state and federal levels. Counties in each of the 50 states are ranked according to summaries of a variety of health measures. Those having high ranks, e.g. 1 or 2, are considered to be the healthiest. Counties are ranked relative to the health of other counties in the same state based on health outcomes and factors, clinical care, economic status and the physical environment. A number of different health factors shape a community s health outcomes. The County Health Rankings model includes four types of health factors: health behaviors, clinical care, social and economic and the physical environment. As can be seen from the chart below, all rankings within each area have improved from 2012 with the exception of physical environment. Taylor County Indicators Health Outcomes Mortality Morbidity Health Factors Health Behaviors Clinical Care Social and Economic Factors Physical Environment Source: countyhealthrankings.org The following Exhibits 19.1 and 19.2 include the 2012 and 2015 indicators reported by County Health Rankings for Taylor County. The health indicators that are unfavorable when compared to the Texas rates are shaded in gray. 26
30 Exhibit 19.1 County Health Rankings Health Outcomes Taylor Taylor Top U.S. County County Texas Performers 2012*** 2015*** Mortality * Premature death Years of potential life lost before age 75 per 100,000 population (ageadjusted) 8,870 8,500 6,600 5,200 Morbidity * Poor or fair health Percent of adults reporting fair or poor health (age-adjusted) 20% 18% 20% 12% Poor physical health days Average number of physically unhealthy days reported in past 30 days (age-adjusted) Poor mental health days Average number of mentally unhealthy days reported in past 30 days (age-adjusted) Low birth weight Percent of live births with low birth weight (<2500 grams) 9.0% 9.0% 8.0% 6.0% * Rank out of 232 Texas counties in 2012 and 241 counties in 2015 ** 90th percentile, i.e., only 10% are better *** Data for 2012 and 2015 was pulled in 2013 and 2016 Data should not be compared betw een years due to changes in definition and/or methods Source: Countyhealthrankings.org 27
31 Exhibit 19.2 County Health Rankings Health Factors Taylor Taylor Top County County Texas Performers 2012*** 2015*** ** Health Behaviors * Adult smoking Percent of adults that report smoking at least 100 cigarettes and that they currently smoke 23.0% 16.0% 15.0% 14.0% Adult obesity Percent of adults that report a BMI >= % 31.0% 28.0% 25.0% Food environment index Index of factors that contribute to a healthy food environment, 0 (worst) to 10 N/A Physical inactivity Percent of adults age 20 and over reporting no leisure time physical activity 33.0% 24.0% 24.0% 20.0% Access to exercise opportunities Percentage of population with adequate access to locations for physical N/A 85.0% 84.0% 91.0% Excessive drinking Percent of adults that report excessive drinking in the past 30 days 10.0% 17.0% 17.0% 12.0% Alcohol-impaired driving deaths Percentage of driving deaths with alcohol involvement N/A 24.0% 32.0% 14.0% Sexually transmitted infections Chlamydia rate per 100K population Teen birth rate Per 1,000 female population, ages Clinical Care * Uninsured adults Percent of population under age 65 without health insurance 24.0% 22.0% 25.0% 11% Primary care physicians Ratio of population to primary care physicians 1,552:1 1,470:1 1,680:1 1,040:1 Dentists Ratio of population to dentists 1,670:1 1,450:1 1,880:1 1,340:1 Mental health providers Ratio of population to mental health providers N/A 710:1 990:1 370:1 Preventable hospital stays Hospitalization rate for ambulatory-care sensitive conditions per 1,000 Medicare enrollees Diabetic screening Percent of diabetic Medicare enrollees that receive HbA1c screening 79.0% 79.0% 84.0% 90.0% Mammography screening Percent of female Medicare enrollees that receive mammography screening 65.7% 60.0% 58.0% 71.0% 28
32 Exhibit 19.2 County Health Rankings Health Factors (cont.) Taylor Taylor Top County County Texas Performers 2012*** 2015*** ** Social and Economic Factors * High school graduation Percent of ninth grade cohort that graduates in 4 years 90.0% 92.0% 88.0% 93% Some college Percent of adults aged years with some post-secondary education 60.0% 63.0% 59.0% 72.0% Unemployment Percent of population age 16+ unemployed but seeking work 6.3% 4.2% 5.1% 3.5% Children in poverty Percent of children under age 18 in poverty 21.0% 22.0% 25.0% 13.0% Income inequality Ratio of household income at the 80th percentile to income at the 20th percentile N/A Children in single-parent households Percent of children that live in household headed by single parent 34.0% 37.0% 33.0% 21% Social associations Number of membership associations per 10,000 population N/A Violent crime rate Violent crime rate per 100,000 population (age-adjusted) Injury deaths Number of deaths due to injury per 100,000 population N/A Physical Environment * Air pollution-particulate matter days Average daily measure of fine particulate matter in micrograms per cubic meter Severe housing problems Percentage of household with at least one of four housing problems: overcrowding, high housing costs or lack of kitchen or plumbing facilities N/A 15.0% 18.0% 9.0% Driving alone to work Percentage of the workforce that drives alone to work N/A 81.0% 80.0% 71.0% Long commute, driving alone Among workers who commute in their car alone, the percentage that commute N/A 9.0% 36.0% 15.0% * Rank out of 232 Texas counties in 2012 and 241 counties in 2015 ** 90th percentile, i.e., only 10% are better *** Data for 2012 and 2015 was pulled in 2013 and 2016 Note: N/A indicates unreliable or missing data Data should not be compared betw een years due to changes in definition and/or methods Source: Countyhealthrankings.org 29
33 Community Health Status Indicators The Community Health Status Indicators (CHSI) Project of the U.S. Department of Health and Human Services compares many health status and access indicators to both the median rates in the United States and to rates in peer counties across the United States. Counties are considered peers if they share common characteristics such as population size, poverty rate, average age, and population density. Taylor County has multiple designated peer counties throughout the US, including Tom Green, Wichita and Victoria Counties in Texas, Pueblo County in Colorado and Comanche County in Oklahoma. Exhibit 20 provides a summary comparison of how Taylor County compares with peer counties on the full set of primary indicators. Peer county values for each indicator were ranked and then divided into quartiles. Mortality Exhibit 20 Taylor County, Texas Most Favorable Quartile Middle Two Quartiles Least Favorable Quartile Cancer Deaths Alzheimer's disease deaths Stroke Deaths Chronic kidney disease deaths Chronic lower respiratory Unintentional injury (including disease (CLDR) deaths motor vehicle) Coronary heart disease Diabetes deaths Female life expectancy Male life expectancy Motor vehicle deaths Morbidity Health Care Access and Quality Cancer Older adult asthma Older adult preventable hospitalization Adult Diabetes Adult overall health status Gonorrhea HIV Preterm births Syphilis Primary Care Provider Access Uninsured Adult Obesity Alzheimer's disease/dementia Older adult depression Cost barrier to care Health Behaviors Social Factors Adult binge drinking Children in single-parent households On time high school graduation Unemployment Adult physical inactivity Adult smoking Teen births High Housing Costs Inadequate social support Poverty Violent Crime Adult female routine pap tests Physical Environment Annual average PM2.5 concentration Access to parks Housing stress Limited access to healthy food Living near highways 30
34 The following exhibits show a more detailed view of certain health outcomes and factors. The percentages for Taylor County are compared to the state of Texas and the United States. Diabetes (Adult) Exhibit 21 reports the percentage of adults, aged 20 and older, who have ever been told by a doctor that they have diabetes. This indicator is relevant because diabetes is a prevalent problem in the U.S.; it may indicate an unhealthy lifestyle and puts individuals at risk for further health issues. County Total Population Age 20 Exhibit 21 Population With Diagnosed Diabetes Population With Diagnosed Diabetes, Crude Rate Population With Diagnosed Diabetes, Age- Adjusted Rate Percent Adults With Diagnosed Diabetes (Age-Adjusted) Taylor County, TX 95,495 9, % Texas 18,357,669 1,698, % United States 234,058,710 23,059, % Data Source: Centers for Disease Control and Prevention, National Center for Chronic Disease Prevention and Health Promotion Source geography: County Note: Information reported above is unavailable at the zip code level. Taylor County, TX (9.50%) Texas (9.24%) United States (9.11%) High Blood Pressure (Adult) Per Exhibit 22 below, 37,025, or 37.6%, of adults aged 18 and older have ever been told by a doctor that they have high blood pressure or hypertension. The community percentage of high blood pressure among adults is greater than the percentage of Texas and the United States. Exhibit 22 Percent Adults With High Blood Pressure County Total Population (Age 18 ) Total Adults With High Blood Pressure Percent Adults With High Blood Pressure Taylor County, TX 98,470 37, % Texas 17,999,726 5,399, % United States 232,556,016 65,476, % Data Source: Centers for Disease Control and Prevention, Behavioral Risk Factor Surveillance System. Additional data analysis by CARES Source geography: County Note: Information reported above is unavailable at the zip code level. Taylor County, TX (37.6%) Texas (30.0%) United States (28.2%) 31
35 Obesity Of adults aged 20 and older, 31.4% self-report that they have a Body Mass Index (BMI) greater than 30.0 (obese) in the Community per Exhibit 23. Excess weight may indicate an unhealthy lifestyle and puts individuals at risk for further health issues. The CHNA community has a BMI percentage slightly higher than the state and national rates. Exhibit 23 Percent Adults With BMI > 30.0 (Obese) County Total Population Age 20 Adults With BMI > 30.0 (Obese) Percent Adults With BMI > 30.0 (Obese) Taylor County, TX 95,885 30, % Texas 18,326,228 5,204, % United States 231,417,834 63,336, % Data Source: Centers for Disease Control and Prevention, National Center for Chronic Disease Prevention and Health Promotion Source geography: County Note: Information reported above is unavailable at the zip code level. Taylor County, TX (31.4%) Texas (28.2%) United States (27.1%) Poor Dental Health This indicator is relevant because it indicates lack of access to dental care and/or social barriers to utilization of dental services. Exhibit 24 shows the total CHNA community has a larger percentage of adults with poor health than that of Texas and the United States. Exhibit 24 Percent Adults With Poor Dental Health County Total Population (Age 18 ) Total Adults With Poor Dental Health Percent Adults With Poor Dental Health Taylor County, TX 97,629 16, % Texas 17,999,726 2,279, % United States 235,375,690 36,842, % Data Source: Centers for Disease Control and Prevention, Behavioral Risk Factor Surveillance System. Additional data analysis by CARES Source geography: County Note: Information reported above is unavailable at the zip code level. Taylor County, TX (16.7%) Texas (12.7%) United States (15.7%) 32
36 Low Birth Weight Exhibit 25 reports the percentage of total births that are low birth weight (under 2500g). This indicator is relevant because low birth weight infants are at high risk for health problems. This indicator can also highlight the existence of health disparities. Exhibit 25 Percent Low Birth Weight Births County Total Live Births Low Weight Births (Under 2500g) Low Weight Births, Percent of Total Taylor County, TX 14,721 1, % Texas 2,759, , % United States 29,300,495 2,402, % HP 2020 Target <= 7.8% Data Source: U.S. Department of Health Human Services, Health Indicators Warehouse. Centers for Disease Control and Prevention, National Vital Statistics System. Accessed via CDC WONDER Source geography: County Note: Information reported above is unavailable at the zip code level. Taylor County, TX (9.0%) Texas (8.4%) United States (8.2%) 33
37 Community Input Key Stakeholder Interviews Interviewing key stakeholders (persons with knowledge of or expertise in public health, community members who represent the broad interest of the community or persons representing vulnerable populations) is a technique employed to assess public perceptions of the county s health status and unmet needs. These interviews are intended to ascertain opinions among individuals likely to be knowledgeable about the community and influential over the opinions of others about health concerns in the community. Methodology Interviews were performed with 33 key stakeholders. Stakeholders were determined based on a) their specialized knowledge or expertise in public health, b) their involvement with underserved and minority populations or c) their affiliation with local government, schools and industry. All interviews were conducted by BKD personnel. Participants provided comments on the following issues: Health and quality of life for residents of the primary community Underserved populations and communities of need Barriers to improving health and quality of life for residents of the community Opinions regarding the important health issues that affect community residents and the types of services that are important for addressing these issues Interview data was initially recorded in narrative form asking participants a series of fourteen questions. Please refer to Appendix D for a copy of the interview instrument. This technique does not provide a quantitative analysis of the stakeholders opinions but reveals community input for some of the factors affecting the views and sentiments about overall health and quality of life within the community. Key Stakeholder Profiles Key stakeholders from the community (see Appendix D for a list of key stakeholders) worked for the following types of organizations and agencies: Hendrick Medical Center Social service agencies and non-profit organizations Local school systems and universities Public health agencies Other medical providers Local elected officials and governmental agencies Local businesses Key Stakeholder Interview Results The questions on the interview instrument are grouped into four major categories for discussion. The interview questions for each key stakeholder were identical. A summary of the stakeholders responses by each of the categories follows. Paraphrased quotes are included to reflect some commonly held opinions and direct quotes are employed to emphasize strong feelings associated with the statements. 34
38 This section of the report summarizes what the key stakeholders said without assessing the credibility of their comments. 1. General Opinions Regarding Health and Quality of Life in the Community The key stakeholders were asked to rate the health and quality of life in Taylor County. They were also asked to provide their opinion whether the health and quality of life had improved, declined or stayed the same over the past few years. Lastly, key stakeholders were asked to provide support for their answers. Forty-two percent (14 out of 33) rated the health and quality of life as above average or very good. Fifty-four percent (18 out of 33) of the key stakeholders rated the health and quality of life in their county as good, average or fair. Only one key stakeholder rated the health and quality of life as less than average or poor. Stakeholders noted that for a community the size of the Abilene there are good health resources available to the community. They referred to the recent opening of more clinics by medical providers and the city having a positive impact to the community. Stakeholders also thought there has been increased focus on health promotion and the community is being encouraged to be more physically active. The community has a significant number of nonprofit organizations serving the community and stakeholders acknowledged the philanthropic culture within Taylor County to be a community asset. Many organizations are partnering together and coordinating services to avoid duplication and combine resources to address unmet needs. Conditions such as obesity, diabetes and high blood pressure were mentioned most often as negatively impacting the health of the community. Additionally, the challenges that come with having a significant refugee population, as a result of the International Rescue Committee, were mentioned as impacting health and quality of life in the community. Significant resources are required to assimilate refugees into the community, including integration into the healthcare system. When asked whether the health and quality of life had improved, declined or stayed the same, almost half of the stakeholders, 15 of 33, responded they felt the health and quality of life had improved over the last few years. Fourteen of the remaining 33 stakeholders expressed they thought the health and quality of life had stayed the same over the last three years. When asked why they thought the health and quality of life had improved, key stakeholders noted the Abilene Community Health Center, a Federally Qualified Health Center opened by Texas Tech School of Nursing in the fall of 2015, had made a significant positive impact on the availability of services to low-income and uninsured members of the community. They also highlighted the increased contribution of Hendrick Medical Center to the Medical Mission. Stakeholders feelings regarding health reform were mixed, but many stakeholders acknowledged the increase in the insured population as a result of the Affordable Care Act. Other positive factors include services provided by the health department including recently expanded women s services as well as efforts of recruiting more primary care physicians to the community and the increased expansion of the Texas Tech Health Sciences Center. The addition of more hospitalists to the physician group is providing increased access for patients, post-discharge from the hospital. Even though there have clearly been efforts at expanding access to primary care, stakeholders consistently mentioned that persons in the community improperly utilize the hospital s emergency room and continued efforts are needed to educate the community on the available resources for care; particularly for low-income and uninsured persons. There are a lot of smart people here and they are interested in the community doing well. 35
39 The health department has made strides to expand health services. Education is not changing people s behaviors to go to the doctor and prevention is not reaching the people to keep them out of the emergency room. Hendrick Medical Center is bringing more health professionals to the community. 2. Underserved Populations and Communities of Need Key stakeholders were asked to provide their opinions regarding specific populations or groups of people whose health or quality of life may not be as good as others. BKD also asked the key stakeholders to provide their opinions as to why they thought these populations were underserved or in need. Each key stakeholder was asked to consider the specific populations they serve or those with which they usually work. Virtually, all of the key stakeholders identified persons living with low-incomes or in poverty as most likely to be underserved due to lack of access to services. Lack of financial resources prevents persons with low-income from seeking medical care and receiving the resources they need. It also leads to people being uninsured and underinsured. Stakeholders noted that knowing how to effectively utilize insurance programs such as Medicaid and/or Children s Health Insurance Plan (CHIP) is an issue. For these families, access to care is available, but they simply do not understand where to go or how to navigate the health system. Often, persons living with low-income also have less access to reliable transportation. Persons with mental health needs were also identified as a population whose health needs are not being met in the community. Stakeholders expressed a lack of mental health providers resulting in long waits for appointments. Additionally, the stigma surrounding mental illness prevents people from getting help. The stigma also causes people to stop taking medicines for behavioral health conditions. Mental health patients are complicated to serve and often chronic health conditions accompany mental health issues. For these patients, there is a need for more coordinated care. The poor elderly were also identified as a population that is faced with challenges accessing care due to limited transportation and fixed incomes. Poor elderly who do not have adequate support systems have a difficult time managing chronic diseases without additional support and they are often not equipped to take care of themselves when they are released from an inpatient stay at the hospital. The refugee population and other immigrant populations were regularly noted as persons who may have unmet health needs due to language barriers, cultural differences that make them reluctant of care and fear of repercussions of being caught, for those who are in the United States illegally. Stakeholders noted that interpretation services offered by Hendrick make a big difference in the ability to provide medical care and outreach to the non-english speaking population, but most providers don t have interpretation services which is a barrier. The homeless population has few resources for healthcare, transportation, housing and food. There are some church missions who serve this population, but resources are limited. Key stakeholders were then asked to provide opinions regarding actions that should be taken to respond to the identified needs above. Many of the stakeholders suggested that free screenings should be continued and their availability and frequency should be increased. Some of the stakeholders felt communication regarding free screenings and low-cost services may need to be intentionally directed to the underserved populations who need these services most and some stated they thought many persons in the community are still unaware of these services. They also felt that 36
40 screenings and health education events should be conducted out in neighborhood settings and where people who need the services most already are instead of in the hospital. Stakeholders also suggested that organizations should focus on common issues and programs and that a single convener would be valuable to coordinate services and monitor activities. Due to limited funding, the best way to address certain issues will be for organizations to network and work together. Finally, stakeholders suggested a task force/intense group be formed to evaluate what can be done regarding mental health services in the community. The more we can prevent, the better outcomes we will have. In order to get to the parts of the community that need to be reached, you need to go out into the community. Outreach needs to be done in people s neighborhoods. Integrate health education with what is already happening in the neighborhoods. We all need to work together (health department, Texas Tech, Community Health Center and hospitals) to get prevention and healthy living out there. 3. Barriers The key stakeholders were asked what barriers or problems keep community residents from obtaining necessary health services and improving health in their community. The majority of the key stakeholders indicated lack of financial resources is the biggest barrier to improving health in the community. Stakeholders noted that there are many people in the community who lack insurance due to the high cost. Persons who may be employed need to choose between food, shelter, basic needs and health insurance. Healthcare often costs more than household budgets can pay for. Resources available for persons who are uninsured are limited in the community. The opening of the Abilene Community Health Center is another additional resource for these persons, but efforts need to be made to educate the community on available services. Stakeholders emphasized that people, particularly those that need services most, lack knowledge surrounding available services and they don t know how to navigate the health system. Additionally, they are uninformed and uneducated on how insurance works. Stakeholders also noted the culture does not emphasize physical activity even though there have been recent efforts to address this and the community does not see value in preventive care. Smoking and obesity were identified as unhealthy behaviors or conditions prevalent in the community. Difficulty in accessing primary care physicians was also noted as a barrier to improving health. Stakeholders noted it is a struggle to recruit new physicians to the community. They also stated there are limited providers in the community and many physician offices have limited hours, i.e. closed on Fridays and during the lunch hour. In order for physician offices to remain financially viable, physicians are limiting the number of Medicaid and/or Medicare patients they can take as patients. There are even fewer physician resources for uninsured patients. The lack of communication and collaboration among agencies, organizations and local government was also noted as a barrier. Stakeholders acknowledged there are many organizations providing much needed services in the community. However, many organizations are working in silos. Stakeholders expressed the need for organizations to work together to work to address issues in the community as a whole. They felt more could be accomplished by organizations partnering together 37
41 or working together on strategic plans which would also result in the most efficient and cost-effective use of community financial resources. Transportation was noted as a barrier to health services and stakeholders identified that accessing health services is difficult for some with the current transportation system. They also shared that persons who would like to utilize the Medical Mission or Community Health Center may not have a way to get there. People don t want to make the necessary life choices for better health. People don t know what resources are available and that if it s a minor health issue, they should call their primary care physician. Healthcare is expensive-whether you are insured or not. You have to make that investment. Even though people are working, their income isn t as high. When people are working, they have to decide whether to pay electric bill or groceries instead of healthcare. It is really hard to get collaboration between local government, businesses and nonprofit organizations. All of these groups are trying to address the issues in silos, but we need to look at the community as a whole. 4. Most Important Health and Quality of Life Issues Key stakeholders were asked to provide their opinion as to the most critical health and quality of life issues facing the county. The issues identified most frequently were: Obesity Lack of primary care for Medicaid and Medicare patients The increased need for mental health services due to increased drug and alcohol abuse as well as the lack of mental health providers in the community. It was also noted that diabetes, cancer and heart disease are health conditions that impact the community. The aging population and the growing number of patients with dementia or Alzheimer s were noted as an emerging issue in the community. As the older population continues to age, additional services will be needed to care for them and coordination of care will become more important. Education of the community s children was also a concern for stakeholders. Stakeholders felt that children are not being taught basic life skills and are unprepared to take care of themselves as young adults. A high percentage of children in the community are going up in poverty and educational opportunities are limited. Students are in need of education on a variety of topics such as health, nutrition and financial literacy. 38
42 The key stakeholders were also asked to provide suggestions on what should be done to address the most critical issues. Responses included: Many of the key stakeholders recommended that education is the best way to address most of the needs identified above. Education on preventive care, healthy living and awareness regarding available resources targeted to the populations who most need is recommended. Stakeholders recommended partnering with schools and youth programs in order to access families in settings where they already are to incorporate health education or related health information. Stakeholders also recommended the Hospital should continue to increase partnerships and collaborations to help in the delivery of educational programs to reduce costs and expand outreach Educational activities, health fairs and screening events should be coordinated and conducted with programs which are already occurring out in the community. Strategic priorities should be identified and communicated to the community and organizations should work together to focus on common issues. Consistent and routine communication regarding community resources and changes to available resources is needed. 211 is great for the community, but the organizations serving the community need to be aware of what the other organizations are doing and specifics regarding how they are doing it so they can effectively communicate with persons who need to access the available service. A forum where all groups serving the community could regularly come together to share information and foster collaborative efforts would be beneficial. The community should come together to address mental health issues and the shortage of mental health providers in the community. In closing, the key stakeholders were asked to recommend the most important issue the Hospital should address over the next three to five years. The number one suggestion made by stakeholders was that the Hospital should focus on education and engaging the community in healthy living and preventative care. The Hospital should also promote all of the services and educational opportunities that are available at Hendrick and increase its efforts on engaging the community by conducting events out in the community as opposed to inside the hospital. Secondly, stakeholders suggested maintaining the focus on recruiting providers to the community, both primary care and specialists, and that Hendrick should consider expanding certain services such as pediatrics and cancer care. The lack of services available to meet the community s mental health needs was also identified as an important issue the Hospital should address in the next few years. Stakeholders also suggested increased efforts and focus on transition of care once patients leave the Hospital, noting the importance of follow-up care as well as addressing other concerns that exist in the home environments which inhibits people from getting better or managing chronic diseases such as inability to afford medications, lack of basic necessities and lack of needed assistance or support. Specifically, individuals who incorrectly utilize the Hospital emergency room should be provided additional resources and a care plan. 39
43 Key Findings A summary of themes and key findings provided by the key informants follows: The community s perception regarding health and quality of life in Taylor County is very positive and a significant number of key stakeholders felt the health and quality of life in the county was above average. The affiliation with Texas Tech is seen very positively by the community. Opening of Abilene Community Health Center and expansion of services provided by the Medical Care Mission and the health department are helping serve the low-income and uninsured populations, but there is still a need that exceeds current capacity. The community has a number of distinct populations identified as being underserved (lowincome, persons with mental health issues, poor elderly, refugees, other immigrants, homeless) which are in need of targeted outreach to address health needs. Although most interviewees thought access to care has improved over the past three years, it continues to be an issue due to the shortage of primary care doctors in the community and the cost of health care including co-pays and deductibles associated with high-deductible health plans. The community generally has an unhealthy culture due to lack of health knowledge and/or apathy regarding personal health and wellness There is a perceived need for increased collaboration among the various organizations serving the community. Organizations need to work together in a more coordinated, strategic approach to respond to community needs. The Hospital should seek opportunities to collaborate with other community organizations to help deliver health education to the community and/or aid in communication regarding available educational resources. 40
44 Health Issues of Vulnerable Populations According to Dignity Health s Community Need Index (see Appendices), the Medical Center s community has a moderate level of need. The CNI score is an average of five different barrier scores that measure socioeconomic indicators of each community (income, cultural, education, insurance and housing). The median CNI score for Taylor County is 3.6. The zip codes with the highest CNI scores within the community are: Abilene (4.8), Abilene (4.6), Abilene (4.2) and Abilene (4.0). Certain key stakeholders were selected due to their positions working with low-income and uninsured populations. Several key stakeholders were selected due to their work with minority populations. Based on information obtained through key stakeholder interviews and the community health survey, the following populations are considered to be vulnerable or underserved in the community and the identified needs are listed: Uninsured/Working Poor Population/Homeless o Access to primary care physicians o High cost of health care prevents needs from being met o Lack of healthy lifestyle and health nutrition education o Lack of mental health services o Transportation o Preventative Care Person with Mental Health Needs o Lack of mental health providers o Substance abuse Poor Elderly o Cost of prescriptions/health care services o Transportation o Lack of health knowledge regarding how to navigate and access services Refugees/Other Immigrants o Lack of health knowledge/culture regarding health o Financial barriers o Language barriers o Access to primary care o Fear of repercussions 41
45 Information Gaps This assessment was designed to provide a comprehensive and broad picture of the health in the overall community served by the Medical Center; however, there may be a number of medical conditions that are not specifically addressed in this report due to various factors, including but not limited to, publically available information or limited community input. In addition, certain population groups might not be identifiable or might not be represented in numbers sufficient for independent analysis. Examples include homeless, institutionalized persons, undocumented residents and members of certain ethnic groups who do not speak English or Spanish. Efforts were made to obtain input from these specific populations through key stakeholder interviews. 42
46 Prioritization of Identified Health Needs Priority setting is a required step in the community benefit planning process. The IRS regulations indicate that the CHNA must provide a prioritized description of the community health needs identified through the CHNA and include a description of the process and criteria used in prioritizing the health needs. Using findings obtained through the collection of primary and secondary data, the Medical Center completed an analysis of these inputs (see Appendices) to identify community health needs. The following data was analyzed to identify health needs for the community: Leading Causes of Death Leading causes of death for the community and the death rates for the leading causes of death for each county within the Medical Center s CHNA community were compared to U.S. adjusted death rates. Causes of death in which the county rate compared unfavorably to the U.S. adjusted death rate resulted in a health need for the Medical Center s CHNA community. Health Outcomes and Factors An analysis of the County Health Rankings health outcomes and factors data was prepared for each county within Hendrick s CHNA community. County rates and measurements for health behaviors, clinical care, social and economic factors and the physical environment were compared to state benchmarks. County rankings in which the county rate compared unfavorably (by greater than 30% of the national benchmark) resulted in an identified health need. The indicators falling within the least favorable quartile from the Community Health Status Indicators (CHSI) resulted in an identified health need. Primary Data Health needs identified through key informant interviews were included as health needs. Needs for vulnerable populations were separately reported on the analysis in order to facilitate the prioritization process. Health Needs of Vulnerable Populations Health needs of vulnerable populations were included for ranking purposes. 43
47 To facilitate prioritization of identified health needs, a ranking process was used. Health needs were ranked based on the following five factors. Each factor received a score between 0 and 5. 1) How many people are affected by the issue or size of the issue? For this factor, ratings were based on the percentage of the community who are impacted by the identified need. The following scale was utilized: >25% of the community= 5; >15% and <25%=4; >10% and <15%=3; >5% and <10%=2 and <5%=1. 2) What are the consequences of not addressing this problem? Identified health needs which have a high death rate or have a high impact on chronic diseases received a higher rating. 3) The impact of the problem on vulnerable populations. Needs identified which pertained to vulnerable populations were rated for this factor. 4) How important the problem is to the community. Needs identified through community interviews and/or focus groups were rated for this factor. 5) Prevalence of common themes. The rating for this factor was determined by how many sources of data (leading causes of death, health outcomes and factors and primary data) identified the need. Each need was ranked based on the five prioritization metrics. As a result, the following summary list of needs was identified: 44
48 How Many People Are Affected by the Issue? What Are the Consequences of Not Addressing This Problem? What is the Impact on Vulnerable Populations? How Important is it to the Community? How Many Sources Identified the Need? Total Score * Lack of Health Knowledge Healthy Behaviors/Lifestyle Changes Adult Obesity Lack of Primary Care Physicians High Cost of Health Care Uninsured Poverty/Children in Poverty Diabetes Physical Inactivity Lack of Mental Health Providers Language/Cultural Mindset Lack of Agency Collaboration Utilization of Emergency Room Heart Disease Transportation in Rural Areas Children in Single-Parent Households Substance Abuse Lung Disease Stroke Limited Access to Healthy Foods Alcohol Impaired Driving Deaths Sexually Transmitted Infections Teen Birth Rate Violent Crime Rate Alzheimer's disease/dementia Routine Pap Tests *Highest potential score = 25 Exhibit 26 Prioritization of Health Needs 45
 existing hospital programs that respond to the identified need; and 3) the potential opportunities to collaborate with other organizations at")
49 Health needs were then charted on the graph below taking into account their ranking on factors 1 through 5 (perceived importance of the need) for the horizontal axis and their ranking regarding 1) alignment with the Hospital s strategic plans, 2) existing hospital programs that respond to the identified need; and 3) the potential opportunities to collaborate with other organizations at local/state level including available grant funding as the vertical axis. Each need was also assigned a rating between 1 and 14 regarding the health needs impact on overall health. Those health needs receiving the highest rating are represented by the largest spher Management s Prioritization Process For the health needs prioritization process, the Hospital engaged a hospital leadership team to review the most significant health needs reported the prior CHNA, as well as in Exhibits 26 and 27, using the following criteria: Current area of hospital focus Established relationships with community partners to address the health need Organizational capacity and existing infrastructure to address the health need Based on the criteria outlined above, the leadership team ranked each of the health needs. As a result of the priority setting process, the identified priority areas that will be addressed through the Hospital s Implementation Strategy for fiscal years will be: 46
50 Hendrick Medical Center Priority Chronic Disease Management Correlated Community Health Need Heart Disease Diabetes Stroke Lung Disease Utilization of Emergency Room for Episodic Care Primary Care Physicians Lack of Primary Care Physicians Uninsured Utilization of Emergency Room for Episodic Care Health Education Healthy Behaviors and Lifestyle Choices Heart Disease Lack of Health Knowledge Obesity Physical Inactivity Adult Smoking Diabetes Stroke Lung Disease Lack of Agency Collaboration Language and Cultural Mindset The Hospital s next steps include developing an implementation strategy to address these priority areas. 47
51 Resources Available to Address Significant Health Needs Health Care Resources Community Health Needs Assessment 2016 The availability of health care resources is a critical component to the health of a county s residents and a measure of the soundness of the area s health care delivery system. An adequate number of health care facilities and health care providers are vital for sustaining a community s health status. Fewer health care facilities and health care providers can impact the timely delivery of services. A limited supply of health resources, especially providers, results in the limited capacity of the health care delivery system to absorb charity and indigent care as there are fewer providers upon which to distribute the burden of indigent care. Hospitals The Medical Center has 522 acute beds. Residents of the community can also take advantage of services provided by hospitals in neighboring counties, as well as services offered by other facilities and providers. Exhibit 27 summarizes hospitals available to the residents of CHNA Community. Exhibit 27 Hospital Address County Abilene Behavioral Health LLC 4225 Woods Place, Abilene, TX Taylor Reliant Rehabilitation Hospital Abilene 6401 Directors Parkway, Abilene, TX Taylor Abilene Regional Medical Center 6250 HWY 83/84, Abilene, TX Taylor Oceans Behavioral Hospital of Abilene 6401 Directors Parkway, Abilene, TX Taylor US Air Force Hospital Dyess Air Force Base, Abilene, TX Taylor Source: US Hospital Finder 48
52 Other Health Care Facilities Short-term acute care Medical Center services are not the only health services available to members of the Medical Center s community. Exhibit 28 provides a listing of community health centers and rural health clinics in the Medical Center s community. Exhibit 28 Health Care Facility Facility Type Address County Clearfork Health Center Rural Health Clinic 774 State Hwy 70N, PO Drawer L, Rotan, TX Fisher Roby Rural Health Clinic Rural Health Clinic 117 North 1st North Concho Box 66, Roby, TX Fisher Coleman Medical Associates Rural Health Clinic 310 South Pecos 2nd Floor, Coleman, TX Coleman Ballinger Hospital Clinic Rural Health Clinic 2001 Hutchins Ave, Suite C, Ballinger, TX Runnels NRH Clinic Rural Health Clinic 7571 State Hwy 153/ PO Box 185, Winters, TX Runnels Shannon Clinic Sweetwater Rural Health Clinic 201 E Arizona Ave, Sweetwater, TX Nolan Source: CMS.gov, Health Resources & Services Administration (HRSA) Health Departments The Medical Center s CHNA community has one county health department located within it: City of Abilene Taylor County Health Department. The Health Services Department is responsible for public health issues ranging from water testing to immunizations. Additionally, the department provides various testing and screening including, but not limited to: Blood pressure, Dental, Pregnancy, TB and STD. The Health Department also has a Women, Infants, and Children (WIC) program. It is a supplemental food program for women, infants, and children, an important resource in improving the health and nutrition of women, infants and children during pregnancy and early childhood. 49
53 APPENDICES Community Health Needs Assessment 2016
54 APPENDIX A ANALYSIS OF DATA
55 Hendrick Medical Center Analysis of CHNA Data Community Health Needs Assessment 2016 Analysis of Health Status-Leading Causes of Death (A) (B) U.S. Age- Adjusted Rate 10% of U.S. Age- Adjusted Rate County Rate County Rate Less U.S. Age- Adjusted Rate If (B)>(A), then "Health Need" Taylor County: Cancer Heart Disease Health Need Lung Disease Health Need Stroke Health Need Unintentional Injury ***The age-adjusted rate is shown per 100,000 residents. Please refer to Exhibit 18 for more information. Analysis of Health Outcomes and Factors - County Health Rankings (A) (B) 30% of National Benchmark National Benchmark County Rate County Rate Less National Benchmark If (B)>(A), then "Health Need" Taylor County, TX: Adult Smoking 14.0% 4.2% 16.0% 2.0% Adult Obesity 25.0% 7.5% 31.0% 6.0% Food Environment Index Health Need Physical Inactivity 20.0% 6.0% 24.0% 4.0% Access to Exercise Opportunities 91.0% 27.3% 85.0% 6.0% Excessive Drinking 12.0% 3.6% 17.0% -5.0% Alcohol-Impaired Driving Deaths 14.0% 4.2% 24.0% 10% Health Need Sexually Transmitted Infections Health Need Teen Birth Rate Health Need Uninsured 11.0% 3.3% 22.0% 11.0% Health Need Primary Care Physicians 1, , Health Need Dentists 1, , Mental Health Providers Health Need Preventable Hospital Stays Diabetic Screen Rate 90.0% 27.0% 79.0% 11.0% Mammography Screening 71.0% 21.3% 60.0% 11.0% Violent Crime Rate Health Need Children in Poverty 13.0% 3.9% 22.0% 9.0% Health Need Children in Single-Parent Households 21.0% 6.3% 37.0% 16.0% Health Need * From County Health Rankings 50
56 Analysis of Health Outcomes and Factors - Community Health Status Indicators Least Favorable Stroke Deaths Adult Obesity Alzheimer's disease/ dementia Older adult depression Cost barrier to care Adult female routine pap tests Limited access to healthy food Living near highways * From Community Health Status Indicators Analysis of Primary Data Key Informant Interviews Poverty Utilization of Emergency Room Lack of Health Knowledge/Education Healthy Behaviors/Lifestyle Choices Lack of Mental Health Services Language & Cultural Mindset Obesity Diabetes Transportation Physical Inactivity Uninsured Lack of Physicians Cost of Health Care Lack of collaboration between agencies Population Issues of Uninsured Persons, Low-Income Persons and Minority/Vulnerable Populations Issues Uninsured/Working Poor Population Access to primary care physicians High cost of health care prevents needs from being met Lack of healthy lifestyle and health nutrition education Lack of mental health services Transportation Preventative Care Persons with Mental Health Needs Poor Elderly Refugees/Other Immigrants Lack of mental health providers Substance Abuse Cost of prescriptions/health care services Transportation Lack of health knowledge regarding how to navigate and access services Lack of health knowledge/culture regarding health Financial barriers Language barriers Access to primary care Fear of repercussions 51
57 APPENDIX B SOURCES
58 DATA TYPE SOURCE YEAR(S) Discharges by Zip Code Hospital FY 2015 Population Estimates Community Commons via American Community Survey Demographics - Race/Ethnicity Community Commons via American Community Survey Demographics - Income Community Commons via American Community Survey Unemployment Community Commons via US Department of Labor Poverty Uninsured Status Community Commons via US Census Bureau, Small Areas Estimates Branch Community Commons via US Census Bureau, Small area Helath Insurance Estimates Medicaid Education Physical Environment - Grocery Store Access Physical Environment - Food Access/Food Deserts Physical Environment - Recreation and Fitness Facilities Physical Environment - Physically Inactive Clinical Care - Access to Primary Care Clinical Care - Lack of a Consistent Source of Primary Care Clinical Care - Population Living in a Health Professional Shortage Area Community Commons via American Community Survey Community Commons via American Community Survey Community Commons via US Cenus Bureau, County Business Patterns Community Commons via US Department of Agriculture Community Commons via US Cenus Bureau, County Business Patterns Community Commons via US Centers for Disease control and Prevention Community Commons via US Department of Health & Human Services Community Commons via US Department of Health & Human Services Community Commons via US Department of Health & Human Services Clinical Care - Preventable Hospital Events Community Commons via Dartmouth College Institute for Health Policy & Clinical Practice Leading Causes of Death Health Outcomes and Factors Health Care Resources Community Commons via CDC national Bital Statistics System County Health Rankings Community Commons & Community Health Status Indicators Community Commons, CMS.gov, HRSA &
59 APPENDIX C DIGNITY HEALTH COMMUNITY NEED INDEX (CNI) REPORT
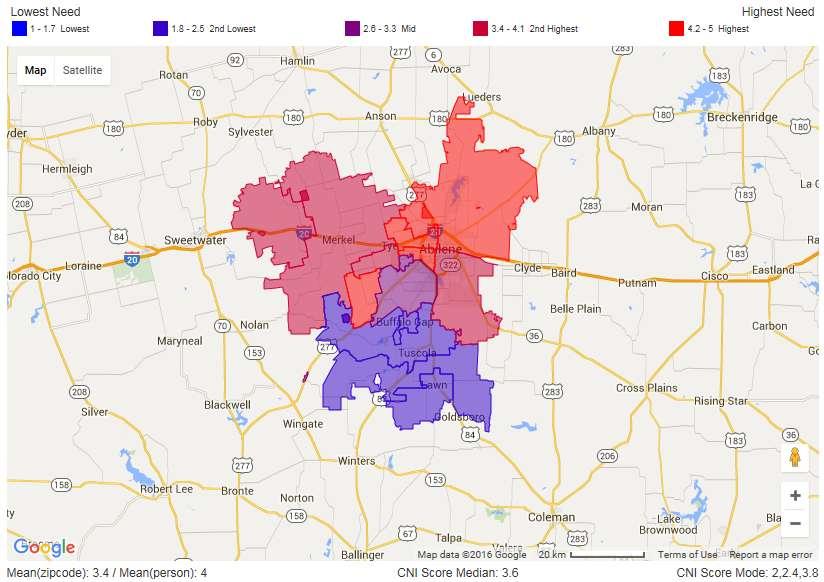
60 53
61 APPENDIX D KEY STAKEHOLDER INTERVIEW PROTOCOL & ACKNOWLEDGEMENTS
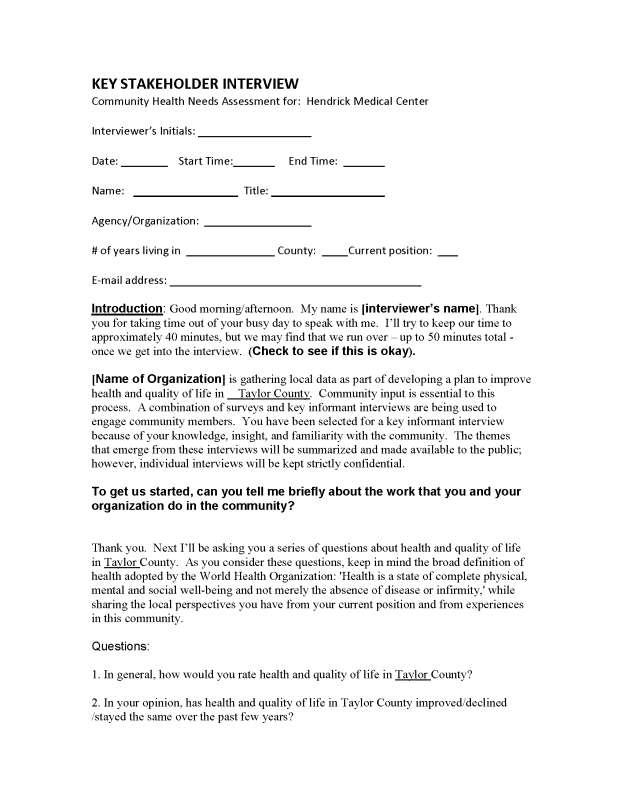
62 54
63 55
64 56
Community Health Needs Assessment 2016
 Community Health Needs Assessment 2016 Contents Introduction... 1 Summary of Community Health Needs Assessment... 2 Summary of Findings... 3 General Description of the Hospital... 4 Community Served by
Community Health Needs Assessment
 Community Health Needs Assessment 2016 3 Divine Providence Hospital Muncy Valley Hospital Williamsport Regional Medical Center Contents Introduction... 1 Summary of Community Health Needs Assessment...
Hendrick Center for Extended Care. Community Health Needs Assessment Implementation Plan
 Hendrick Center for Extended Care Community Health Needs Assessment Implementation Plan - 2014-2016 Overview: Hendrick Center for Extended Care ( HCEC ) is a Long Term Acute Care Hospital, within Hendrick
Community Health Needs Assessment for Corning Hospital: Schuyler, NY and Steuben, NY:
 Community Health Needs Assessment for Corning Hospital: Schuyler, NY and Steuben, NY: November 2012 Approved February 20, 2013 One Guthrie Square Sayre, PA 18840 www.guthrie.org Page 1 of 18 Table of Contents
Hendrick Medical Center. Community Health Needs Assessment Implementation Plan
 Hendrick Medical Center Community Health Needs Assessment Implementation Plan - 2014-2016 Hendrick Medical Center Community Health Needs Assessment Implementation Plan - 2014-2016 Overview: Hendrick Medical
2012 Community Health Needs Assessment
 2012 Community Health Needs Assessment University Hospitals (UH) long-standing commitment to the community spans more than 145 years. This commitment has grown and evolved through significant thought and
Community Analysis Summary Report for Clinical Care
 Community Analysis Summary Report for Clinical Care BACKGROUND ABOUT THE HEALTHY COMMUNITY STUDY The Rockford Health Council (RHC) exists to build and improve community health in the region. To address
ONTARIO COUNTY HEALTH PROFILE. Finger Lakes Health Systems Agency, 2017
 ONTARIO COUNTY HEALTH PROFILE Finger Lakes Health Systems Agency, 2017 About the Report The purpose of this report is to provide a summary of health data specific to Ontario County. Where possible, benchmarks
Central Iowa Healthcare. Community Health Needs Assessment
 Central Iowa Healthcare Community Health Needs Assessment October 20, 2016 Table of Contents Executive Summary 1 Introduction 3 Summary Observations from Current CHNA 5 Information Sources and Data Collection
LIVINGSTON COUNTY HEALTH PROFILE. Finger Lakes Health Systems Agency, 2017
 LIVINGSTON COUNTY HEALTH PROFILE Finger Lakes Health Systems Agency, 2017 About the Report The purpose of this report is to provide a summary of health data specific to Livingston County. Where possible,
CHEMUNG COUNTY HEALTH PROFILE. Finger Lakes Health Systems Agency, 2017
 CHEMUNG COUNTY HEALTH PROFILE Finger Lakes Health Systems Agency, 2017 About the Report The purpose of this report is to provide a summary of health data specific to Chemung County. Where possible, benchmarks
STEUBEN COUNTY HEALTH PROFILE. Finger Lakes Health Systems Agency, 2017
 STEUBEN COUNTY HEALTH PROFILE Finger Lakes Health Systems Agency, 2017 About the Report The purpose of this report is to provide a summary of health data specific to Steuben County. Where possible, benchmarks
MONROE COUNTY HEALTH PROFILE. Finger Lakes Health Systems Agency, 2017
 MONROE COUNTY HEALTH PROFILE Finger Lakes Health Systems Agency, 2017 About the Report The purpose of this report is to provide a summary of health data specific to Monroe County. Where possible, benchmarks
STEUBEN COUNTY HEALTH PROFILE
 STEUBEN COUNTY HEALTH PROFILE 2017 ABOUT THE REPORT The purpose of this report is to provide a summary of health data specific to Steuben County. Where possible, benchmarks have been given to compare county
Norton Hospital Norton Audubon Hospital Norton Women s and Children s Hospital Norton Brownsboro Hospital Norton Children s Hospital
 Norton Hospital Norton Audubon Hospital Norton Women s and Children s Hospital Norton Brownsboro Hospital Norton Children s Hospital Community Health Needs Assessment 2016 Community Health Needs Assessment
Community Health Needs Assessment: St. John Owasso
 Community Health Needs Assessment: St. John Owasso IRC Section 501(r) requires healthcare organizations to assess the health needs of their communities and adopt implementation strategies to address identified
Community Health Needs Assessment FY
 Community Health Needs Assessment FY 2017-19 Contents Introduction... 3 Forward... 3 Executive Summary... 3 Organization Description... 3 Community Served by the Hospital... 5 Defined Community... 5 Identification
King County City Health Profile Seattle
 King County City Health Profile Seattle Shoreline Kenmore/LFP Bothell/Woodinville NW Seattle North Seattle Kirkland North Ballard Fremont/Greenlake NE Seattle Kirkland Redmond QA/Magnolia Capitol Hill/E.lake
Community Health Needs Assessment
 Community Health Needs Assessment Prepared for Inova Alexandria Hospital By Verité Healthcare Consulting, LLC Board Approved June 29, 2016 1 TABLE OF CONTENTS ABOUT VERITÉ HEALTHCARE CONSULTING... 4 EXECUTIVE
Community Health Needs Assessment 2017 North Texas Zone 6 Baylor Scott & White Surgical Hospital at Sherman
 2017 North Texas Zone 6 Baylor Scott & White Surgical Hospital at Sherman The prioritized list of significant health needs has been presented and approved by the hospital facilities governing body, and
Community Health Needs Assessment FY
 Community Health Needs Assessment FY 2017-19 Contents Introduction... 3 Forward... 3 Executive Summary... 3 Organization Description... 3 Community Served by the Hospital... 5 Defined Community... 5 Identification
Community Health Needs Assessment
 Community Health Needs Assessment Prepared for Inova Mount Vernon Hospital By Verité Healthcare Consulting, LLC Board Approved June 29, 2016 1 Contents ABOUT VERITÉ HEALTHCARE CONSULTING... 4 EXECUTIVE
Community Health Needs Assessment & Implementation Plan. July 1, 2013 June 30, 2016
 Community Health Needs Assessment & Implementation Plan July 1, 2013 June 30, 2016 For Period FY - July 1, 2013 June 30, 2016 Page 1 Introduction and Purpose The Patient Protection and Affordable Care
BARNES-JEWISH HOSPITAL 2016 COMMUNITY HEALTH NEEDS ASSESSMENT & IMPLEMENTATION PLAN
 BARNES-JEWISH HOSPITAL 2016 COMMUNITY HEALTH NEEDS ASSESSMENT & IMPLEMENTATION PLAN 1 TABLE OF CONTENTS Executive Summary... 3 Community Description... 4 Geography... 4 Population Trends... 5 Income...
Community Health Needs Assessment
 Community Health Needs Assessment Bollinger County, Missouri This assessment will identify the health needs of the residents of Bollinger County, Missouri, and those needs will be prioritized and recommendations
Community Health Needs Assessment Implementation Strategy Adopted by St. Vincent Charity Medical Center Board of Directors on April 5, 2017
 St. Vincent Charity Medical Center Community Health Needs Assessment Implementation Strategy Adopted by St. Vincent Charity Medical Center Board of Directors on April 5, 2017 Introduction In 2016, St.
KVC Prairie Ridge Psychiatric Hospital
 KVC Prairie Ridge Psychiatric Hospital Community Health Needs Assessment June 2013 KVC Prairie Ridge Psychiatric Hospital Community Health Needs Assessment June 2013 Contents Consultant s Report... 1 Introduction...
COMMUNITY HEALTH NEEDS ASSESSMENT 2016
 COMMUNITY HEALTH NEEDS ASSESSMENT 2016 A Collaborative Approach to CENTER Impacting Population Health in Piatt County and Surrounding Areas SM KIRBY MEDICAL CENTER COMMUNITY HEALTH NEEDS ASSESSMENT TABLE
Methodist McKinney Hospital Community Health Needs Assessment Overview:
 Methodist McKinney Hospital Community Health Needs Assessment Overview: 2017-2019 October 26, 2016 Prepared by MHS Planning CHNA Requirement: Overview In order to maintain tax exempt status, the Affordable
A Strategic Vision-based Publication of the Greater Flint Health Coalition
 A Strategic Vision-based Publication of the Greater Flint Health Coalition A community where all residents realize positive health outcomes through the practice of healthy lifestyles, while having access
Critical Access Hospital-Relevant Measures for Health System Development and Population Health
 Flex Monitoring Team Policy Brief #42 December 2015 Critical Access Hospital-Relevant Measures for Health System Development and Population Health John Gale, MS; Andrew Coburn, PhD; Zach Croll, BA University
Implementation Plan Community Health Needs Assessment ADOPTED BY THE MARKET PARENT BOARD OF TRUSTEES, OCTOBER 2016
 2017 2019 Community Health Needs Assessment Implementation Plan ADOPTED BY THE MARKET PARENT BOARD OF TRUSTEES, OCTOBER 2016 MERCY HEALTH LOURDES HOSPITAL 1530 Lone Oak Rd., Paducah, KY 42003 A Catholic
Region 1 Parish Community Health Assessment Profile: St. Bernard Parish
 Region 1 Parish Community Health Assessment Profile: Spring 2014 FOREWORD The Regional Meeting on Health Priorities was held in Harvey, LA in November 2013, and was co-convened by the Department of Health
Community Health Needs Assessment FY
 Community Health Needs Assessment FY 2017-19 Contents Introduction... 3 Forward... 3 Executive Summary... 3 Organization Description... 4 Community Served by the Hospital... 5 Defined Community... 5 Identification
DELAWARE FACTBOOK EXECUTIVE SUMMARY
 DELAWARE FACTBOOK EXECUTIVE SUMMARY DaimlerChrysler and the International Union, United Auto Workers (UAW) launched a Community Health Initiative in Delaware to encourage continued improvement in the state
Implementation Strategy For the 2016 Community Health Needs Assessment North Texas Zone 2
 For the 2016 Community Health Needs Assessment North Texas Zone 2 Baylor Emergency Medical Center at Murphy Baylor Emergency Medical Center at Aubrey Baylor Emergency Medical Center at Colleyville Baylor
2013 Greene County, Arkansas Community Health Needs Assessment
 2013 Greene County, Arkansas Community Health Needs Assessment Creating a Call to Action in our Community This report is available at www.myammc.org or at Arkansas Methodist Medical Center 900 W. Kingshighway,
Community Health Needs Assessment Supplement
 2016 Community Health Needs Assessment Supplement June 30, 2016 Mission Statement, Core Values, and Guiding Social Teachings We, St. Francis Medical Center and Trinity Health, serve together in the spirit
Hendry County & Glades County, Florida. Hendry and Glades Rural Health Planning Council Strategic Plan
 The Health Planning Council of Southwest Florida Hendry and Glades Rural Health Planning Council Strategic Plan 2016-2019 Hendry County & Glades County, Florida Table of Contents Introduction......3 Methodology...
Model Community Health Needs Assessment and Implementation Strategy Summaries
 The Catholic Health Association of the United States 1 Model Community Health Needs Assessment and Implementation Strategy Summaries These model summaries of a community health needs assessment and an
2015 Community Health Needs Assessment Saint Joseph Hospital Denver, Colorado
 2015 Community Health Needs Assessment Saint Joseph Hospital Denver, Colorado December 11, 2015 [Type text] Page 1 Contributors Denver County Public Health Dr. Bill Burman, Director, and the team from
Community Health Needs Assessment and Implementation Strategy
 Community Health Needs Assessment and Implementation Strategy St. Luke s Lakeside Hospital October 29, 2013 The for the St. Luke s Lakeside Hospital were conducted and developed between April 22 and October
Community Health Needs Assessment 2016
 Community Health Needs Assessment 2016 Baylor Scott & White Medical Center Brenham Baylor Scott & White Medical Center College Station The prioritized list of significant health needs has been presented
2015 DUPLIN COUNTY SOTCH REPORT
 2015 DUPLIN COUNTY SOTCH REPORT Reported March 2016 State of the County Health Report The State of the County Health Report provides a review of the current county health statistics and compares them to
Community Health Needs Assessment
 Community Health Needs Assessment Region 10 RHP s Community Health Needs Assessment (CHNA) offers Regional data and related county-specific health needs information to inform the selection of the delivery
Southwest General Health Center
 Southwest General Health Center Community Health Needs Assessment Executive Summary July 2016 Southwest General Health Center CHNA Executive Summary Introduction Southwest General Health Center, a 358-bed
EXECUTIVE SUMMARY... Page 3. I. Objectives of a Community Health Needs Assessment... Page 9. II. Definition of the UPMC Mercy Community...
 June 30, 2016 3 TABLE OF CONTENTS EXECUTIVE SUMMARY... Page 3 I. Objectives of a Community Health Needs Assessment... Page 9 II. Definition of the UPMC Mercy Community... Page 10 III. Methods Used to Conduct
How Wheaton Franciscan is meeting the NEEDS of our community. NSWERING HE CALL
 ANSWERING THE CALL MEETING OUR COMMUNITY NEEDS S July 1, 2013 June 30, 2016 S How Wheaton Franciscan is meeting the NEEDS of our community. NSWERING HE CALL COMMUNITY HEALTH NEEDS IMPLEMENTATION PLAN:
2004 BAKER COUNTY HEALTH NEEDS ASSESSMENT
 Taking the pulse of the community 2004 BAKER COUNTY HEALTH NEEDS ASSESSMENT Prepared by: Health Planning Council of Northeast Florida, Inc. 900 University Blvd North, Suite 110 Jacksonville, Florida 32211
Community Health Needs Assessment 2016
 Community Health Needs Assessment 2016 Baylor Scott & White Medical Center Hillcrest The prioritized list of significant health needs has been presented and approved by the hospital facilities governing
Region 3 Parish Community Health Assessment Profile: Lafourche Parish
 Region 3 Parish Community Health Assessment Profile: Spring 2014 FOREWARD The Regional Meeting on Health Priorities was held in Houma, LA in November 2013, and was co-convened by the Department of Health
Commonwealth Fund Scorecard on State Health System Performance, Baseline
 1 1 Commonwealth Fund Scorecard on Health System Performance, 017 Florida Florida's Scorecard s (a) Overall Access & Affordability Prevention & Treatment Avoidable Hospital Use & Cost 017 Baseline 39 39
Allegan General Hospital Community Health Needs Assessment
 Allegan General Hospital Community Health Needs Assessment July 15, 2013 Prepared with consulting assistance from: July 15, 2013 Dear Residents of the greater Allegan area, I am pleased to share with you
COMMUNITY HEALTH NEEDS ASSESSMENT HINDS, RANKIN, MADISON COUNTIES STATE OF MISSISSIPPI
 COMMUNITY HEALTH NEEDS ASSESSMENT HINDS, RANKIN, MADISON COUNTIES STATE OF MISSISSIPPI Sample CHNA. This document is intended to be used as a reference only. Some information and data has been altered
Caldwell County Community Health Needs Assessment May 2016
 Caldwell County Community Health Needs Assessment May 2016 Prepared by Seton Family of Hospitals. Formally adopted by the Seton Family of Hospitals Board of Directors on May 24, 2016. For questions, comments
Baylor Scott & White Medical Center Llano Baylor Scott & White Medical Center Marble Falls
 Community Health Needs Assessment 2016 Baylor Scott & White Medical Center Llano Baylor Scott & White Medical Center Marble Falls The prioritized list of significant health needs has been presented and
GREATER VICTORIA Local Health Area Profile 2015
 GREATER VICTORIA Local Health Area Profile 215 Greater Victoria LHA is one of 14 LHAs in Island Health and is located in Island Health s South Island Health Service Delivery Area (HSDA). The LHA is at
COURTENAY Local Health Area Profile 2015
 COURTENAY Local Health Area Profile 215 Courtenay Local Health Area (LHA) is one of 14 LHAs in Island Health and is located in Island Health s North Island Health Service Delivery Area (HSDA). Courtenay
Community Health Needs Assessment July 2015
 Community Health Needs Assessment July 2015 1 Executive Summary UNM Hospitals is committed to meeting the healthcare needs of our community. As a part of this commitment, UNM Hospitals has attended forums
Pocahontas Memorial Hospital. Community Health Needs Assessment
 Memorial Hospital Community Health Needs Assessment 2013 Memorial Hospital Community Health Needs Assessment October 2013 Table of Contents Executive Summary Page 3 Background: Hospital Profile Page 4
Community Health Needs Assessment 2016
 Community Health Needs Assessment 2016 Scott & White Memorial Hospital (including Baylor Scott & White McLane Children's Medical Center) Baylor Scott & White Continuing Care Hospital The prioritized list
Community Health Needs Assessment IMPLEMENTATION STRATEGY. and
 2015-2018 Community Health Needs Assessment IMPLEMENTATION STRATEGY and Collaborative Health Improvement Plan Palisades Medical Center Implementation Strategy - 1- Introduction: Palisades Medical Center
Union County Community Health Needs Assessment
 Community Health Needs Assessment November 2007 This page is intentionally left blank Community Health Needs Assessment November 2007 Health Department Needs Assessment Committee Winifred M. Holland, MPH,
Health Indicators. for the Dallas/Fort Worth Combined Metropolitan Statistical Area Brad Walsh and Sue Pickens Owens
 Health Indicators Our Community Health for the Dallas/ Fort Worth Combined Metropolitan Statistical Area Checkup 2007 for the Dallas/Fort Worth Combined Metropolitan Statistical Area Brad Walsh and Sue
Community Health Needs Assessment FY
 Community Health Needs Assessment FY 2016-2018 Community Health Needs Assessment FY 2016-2018 1 MERCY MEDICAL CENTER-CLINTON COMMUNITY HEALTH NEEDS ASSESSMENT FY 2016-2018 I. Introduction The Community
Colorado s Health Care Safety Net
 PRIMER Colorado s Health Care Safety Net The same is true for Colorado s health care safety net, the network of clinics and providers that care for the most vulnerable residents. The state s safety net
2013 Community Health Needs Assessment-Lakewood Hospital
 2013 Community Health Needs Assessment-Lakewood Hospital Founded in 1907, Lakewood Hospital is an acute care facility with 263 staffed beds offering advanced medical and surgical care, sophisticated technology,
Community Health Needs Assessment 2016
 Community Health Needs Assessment 2016 OSF ST. FRANCIS HOSPITAL & MEDICAL GROUP DELTA COUNTY CHNA 2016 Delta County 2 TABLE OF CONTENTS Executive Summary... 3 Introduction... 5 Methods... 6 Chapter 1.
BOONE HOSPITAL CENTER COMMUNITY HEALTH NEEDS ASSESSMENT REPORT AND IMPLEMENTATION PLAN
 - BOONE HOSPITAL CENTER COMMUNITY HEALTH NEEDS ASSESSMENT REPORT AND IMPLEMENTATION PLAN 2013 TABLE OF CONTENTS EXECUTIVE SUMMARY.....3 COMMUNITY DESCRIPTION.........4 Overview and Map....... 4 Demographics....6
Gr andview Medical Center Community Health Needs Assessment
 2013 Gr andview Medical Center Community Health Needs Assessment Table of Contents Figures... 2 Introduction... 3 How to Read This Report... 3 Definition of the Community Served... 4 Consulting Persons
Methodist Hospital of Sacramento Community Health Needs Assessment 2013 Community Benefit Implementation Plan
 Methodist Hospital of Sacramento 2013 Community Health Needs Assessment 2013 Community Benefit Implementation Plan Table of Contents I. 2013 Methodist Hospital of Sacramento Community Health Needs Assessment
Community Health Needs Assessment FY
 Community Health Needs Assessment FY 2019-2021 Community Health Needs Assessment FY 2019-2021 1 MERCY MEDICAL CENTER-CLINTON COMMUNITY HEALTH NEEDS ASSESSMENT FY 2019-2021 I. Introduction Electronic copies
2012 Community Health Needs Assessment
 2012 Community Health Needs Assessment Table of Contents Executive Summary... 3 Overview of Key Findings.4 Conclusion...6 Introduction...7 1a. A Definition of the Community Served by the Hospital Facility...8
CER Module ACCESS TO CARE January 14, AM 12:30 PM
 CER Module ACCESS TO CARE January 14, 2014. 830 AM 12:30 PM Topics 1. Definition, Model & equity of Access Ron Andersen (8:30 10:30) 2. Effectiveness, Efficiency & future of Access Martin Shapiro (10:30
WilCo Wellness Alliance. Summit Presentation. Cara Woodard Account Manager. April 25, 2017
 WilCo Wellness Alliance Summit Presentation Cara Woodard Account Manager April 25, 2017 Background and Overview Healthy Communities Institute Mission Headquarters Improve the health, vitality and environmental
COMMUNITY HEALTH IMPLEMENTATION PLAN
 COMMUNITY HEALTH IMPLEMENTATION PLAN 2017 2017-2020 Table of Contents Letter from Jeff Feasel, President & CEO 1 About Halifax Health 3 Executive Summary 6 Halifax Health Community Health Plan 2017-2020
Community Health Needs Assessment. And. Community Health Strategic Plan
 Community Health Needs Assessment And Community Health Strategic Plan June 30, 2013 TABLE OF CONTENTS EXECUTIVE SUMMARY... Page 3 I. Objectives of a Community Health Needs Assessment... Page 7 II. Definition
MOUNT CARMEL EAST 6001 EAST BROAD STREET COLUMBUS, OHIO mountcarmelhealth.com
 MOUNT CARMEL EAST 6001 EAST BROAD STREET COLUMBUS, OHIO 43213 mountcarmelhealth.com COMMUNITY BENEFIT IMPLEMENTATION PLAN 2016-2018 COMMUNITY BENEFIT IMPLEMENTATION PLAN Page 1 Mount Carmel Health System
MEDICARE ENROLLMENT, HEALTH STATUS, SERVICE USE AND PAYMENT DATA FOR AMERICAN INDIANS & ALASKA NATIVES
 American Indian & Alaska Native Data Project of the Centers for Medicare and Medicaid Services Tribal Technical Advisory Group MEDICARE ENROLLMENT, HEALTH STATUS, SERVICE USE AND PAYMENT DATA FOR AMERICAN
Atrium Medical Center!"#$
 Table of Contents Figures... 2 Introduction... 3 How to Read This Report and How Data were obtained... 3 Definition of the Community Served... 4 Consulting Persons and Organizations... 4 Demographics of
Community Health Needs Assessment (CHNA) Implementation Plan. October 2016 Believe. Inspire. Do
 Implementation Plan. October 2016 Believe. Inspire. Do") Community Health Needs Assessment (CHNA) Implementation Plan Believe. Inspire. Do Great Plains Health FY 2017 - FY 2019 Implementation Plan A comprehensive, six-step community health needs assessment (
Community Health Needs Assessment (CHNA) Implementation Plan Believe. Inspire. Do Great Plains Health FY 2017 - FY 2019 Implementation Plan A comprehensive, six-step community health needs assessment (
Community Health Needs Assessment 2016
 Community Health Needs Assessment 2016 SAINT JAMES HOSPITAL known as OSF SAINT JAMES - JOHN W. ALBRECHT MEDICAL CENTER LIVINGSTON COUNTY CHNA 2016 Livingston County 2 TABLE OF CONTENTS Executive Summary...
Data Use in Public Health: Challenges, Successes and New Opportunities. Iowa Governor s Conference on Public Health April 14, 2015
 Data Use in Public Health: Challenges, Successes and New Opportunities Iowa Governor s Conference on Public Health April 14, 2015 Learning Objectives Locate and utilize local data for assessment, planning,
Community Health Needs Assessment
 Community Health Needs Assessment 2017-2019 1 About Texas Health Institute: Texas Health Institute (THI) is a nonpartisan, nonprofit organization whose mission is to improve the health of Texans and their
SAINT LUKE S COMMUNITY HEALTH NEEDS ASSESSMENT & IMPLEMENTATION PLAN
 SAINT LUKE S COMMUNITY HEALTH NEEDS ASSESSMENT & IMPLEMENTATION PLAN 2016 Kansas City Orthopaedic Institute Contact us Kansas City Orthopaedic Institute 3651 College Blvd. Leawood, KS 66211 913-338-4100
Revised March Originally published June Assessment & Community Health. Improvement Plan. Mahoning County, Ohio
 Originally published June 2011- Revised March 2014 Community Health Assessment & Community Health Improvement Plan Mahoning County, Ohio This page is intentionally left blank 2 TABLE OF CONTENTS COMMUNITY
Ascension Columbia St. Mary s Ozaukee
 Ascension Columbia St. Mary s Ozaukee Community Health Needs Assessment & Implementation Strategy 2017 2020 1 Community Served by the Hospital Although Ascension Columbia St. Mary s Ozaukee (CSM) serves
Introduction. Background. Service Area Description/Determination
 Introduction UC Davis Medical Center, part of the UC Davis Health System, is a comprehensive academic medical center where clinical practice, teaching and research converge to advance human health. Centers
Community Health Needs Assessment 2013 Oakwood Heritage Hospital Implementation Strategy
 Community Health Needs Assessment 2013 Oakwood Heritage Hospital Implementation Strategy Community Health Needs Assessment 2013 Oakwood Healthcare CHNA Implementation Strategy Community Health Needs Assessment
COMMUNITY HEALTH NEEDS ASSESSMENT. TMC Hospital Hill
 COMMUNITY HEALTH NEEDS ASSESSMENT TMC Hospital Hill TABLE OF CONTENTS 1 2 Letter from CEO 3 Purpose of the Report 4 Mission and Vision of Organization 5 Service Area 7 Process to Determine Priority Needs
St. Jude Medical Center St. Jude Heritage Healthcare. FY 09 FY 11 Community Benefit Plan
 St. Jude Medical Center St. Jude Heritage Healthcare FY 09 FY 11 Community Benefit Plan 1 St. Jude Medical Center FY 09 - FY 11 Community Benefit Plan TABLE OF CONTENTS Executive Summary 3 A. Community
Industry Market Research release date: November 2016 ALL US [238220] Plumbing, Heating, and Air-Conditioning Contractors Sector: Construction
![Industry Market Research release date: November 2016 ALL US [238220] Plumbing, Heating, and Air-Conditioning Contractors Sector: Construction](/thumbs/80/81994465.jpg "Industry Market Research release date: November 2016 ALL US [238220] Plumbing, Heating, and Air-Conditioning Contractors Sector: Construction") Industry Market Research release date: November 2016 ALL US [238220] Plumbing, Heating, and Air-Conditioning Contractors Sector: Construction Contents P1: Industry Population, Time Series P2: Cessation
Industry Market Research release date: November 2016 ALL US [238220] Plumbing, Heating, and Air-Conditioning Contractors Sector: Construction Contents P1: Industry Population, Time Series P2: Cessation
Implementation Strategy Report for Community Health Needs
 2013 Implementation Strategy Report for Community Health Needs Kaiser Foundation Hospital WALNUT CREEK License #140000290 Kaiser Foundation Hospitals Community Health Needs Assessment (CHNA) Implementation
Mercy Hospital Downtown Mercy Hospital Southwest Bakersfield, California. Community Benefit 2017 Report and 2018 Plan
 Mercy Hospital Downtown Mercy Hospital Southwest Bakersfield, California Community Benefit 2017 Report and 2018 Plan A message from Bruce Peters, President and CEO of Mercy Hospitals, and Morgan Clayton,
Transforming Health and Health Care Through Nurses in Tennessee
 Transforming Health and Health Care Through Nurses in Tennessee Nursing Leadership Workshop I: Building a Culture of Health in Tennessee Carole R. Myers, PhD, RN Nursing Lead-Tennessee Action Coalition
Implementation Strategy
 2017-2019 Implementation Strategy Table of Contents Introduction... 2 2016 Community Health Needs Assessment Summary... 2 Definition of the Community Service Area... 3 Significant Health Needs the Hospital
Community Health Needs Assessment. July 1, June 30, 2016 FINAL
 July 1, 2013 - June 30, 2016 Community Health Needs Assessment FINAL Approved by: Mission and Community Benefits Committee June 14, 2013 Approved by: Baylor Health Care System Board of Trustees June 24,
2016 Community Health Needs Assessment
 2016 Community Health Needs Assessment Table of Contents Our Commitment to Community Health 2 2016 CHNA Overview: A Statewide Approach to Community Health Improvement 2016 CHNA Partners Research Methodology
2012 Community Health Needs Assessment
 Indiana University Health Goshen 2012 Community Health Needs Assessment A Report on Implementation Strategies to Address Community Health Needs Summary Report Our Commitment to You We are here for you,
Why Massachusetts Community Health Centers
 ? Why Massachusetts Community Health Centers A history of excellence The health care safety net Massachusetts Community Health Centers: A History of Firsts In 1965, the nation s first community health