Integrating supportive housing into the continuum of care in Ontario. Norma M. Jutan. A thesis. presented to the University of Waterloo
|
|
|
- Baldwin Bradley
- 5 years ago
- Views:
Transcription
1 Integrating supportive housing into the continuum of care in Ontario by Norma M. Jutan A thesis presented to the University of Waterloo in fulfillment of the thesis requirement for the degree of Doctor of Philosophy in Health Studies and Gerontology - Aging, Health and Well-Being Waterloo, Ontario, Canada, 2010 Norma M. Jutan 2010
2 Author's Declaration I hereby declare that I am the sole author of this thesis. This is a true copy of the thesis, including any required final revisions, as accepted by my examiners. I understand that my thesis may be made electronically available to the public. ii
3 Abstract Background: An essential component of managing the health care system effectively as the population ages is to provide care to seniors in the care setting that can best meet their needs. The majority of seniors wish to remain at home, to maintain their independence. Informal caregivers (family, friends and neighbours) provide as much as 80% of care to seniors who reside at home. The absence of or loss of an informal caregiver and/or a decline in a senior s health may necessitate a change in care setting. Supportive Housing (SH) is a rapidly emerging alternative care setting for seniors who can no longer have their needs met at home. Objective: The objectives of this dissertation were: to provide a comprehensive description of the profile of SH clients in Ontario; to determining the role of SH in the continuum of care; to develop an algorithm to support care placement decisions; and to explore the longitudinal outcomes of SH clients including quality of life, and long-term care placement. The following four research questions were addressed: What are the socio-demographic and clinical characteristics of persons currently residing in SH units in Ontario? How do the profiles of current SH clients differ from the profiles of persons residing in other care settings? What changes occur in the appropriateness of SH to meet care needs over time? What factors are associated with discharge from SH to a long-term-care facility (LTC)? Methodology: The research questions were answered primarily using two Ontario interrai data sets: A pilot sample of 1,720 SH clients collected using the interrai Community Health Assessment and a sample of 29,790 Community Care Access Centre (CCAC) clients collected as part of normal clinical practice from clients residing in residential care setting, including SH. Data from LTC (N=832) and complex continuing care (CCC; N=425) clients in the iii
4 Mississauga-Halton (MH) LHIN were also used. Data on care placement decisions were collected using a Staff Rating Form (N=332 in SH). Results: SH clients are a relatively light-care population who require support with instrumental activities of daily living (IADLs) and tend to lack an informal caregiver. SH clients who receive care from a CCAC are in the minority but represent a much more clinically complex sub-population. According to staff members, the majority (80%) of SH clients are appropriately placed; of the remaining 20%, 17% were prematurely admitted to SH and would be best cared for at home, a further 3% require LTC placement. Moreover, about 10% of seniors who receive care in the MH LHIN, have been inappropriately placed and would be best cared for in a SH unit. A Decisions Support Algorithm for SH (DASH) was developed to inform care placement decisions in Ontario. The algorithm was based on both resource availability and client care needs. Level of impairment in: IADLs, cognition, continence and score on the MAPLe algorithm (an interrai prioritization algorithm; see Figure 11), were found to be significant predictors of care placement. Poor QoL was relatively rare (~5%) among SH clients and regression analysis was used to determine the variables associated with a decline in QoL. Finally, survival analysis determined that 20% of SH clients are discharged to LTC within one year. Age, dependence on others to perform IADLs, bladder incontinence, cognitive impairment, and higher MAPLe scores were associated with this discharge. Conclusions: Analyses in this dissertation have clearly indicated the need for a standardized assessment instrument in this sector. Arbitrary decisions around eligibility and discharge criteria for supportive housing have led to inappropriate placement of clients and confusion iv
5 over the role supportive housing is to play in the continuum of care. Evidence-informed care placement decisions should consider client care needs as well as both the availability of formal and informal support. An integrated health information system, such as the interrai instruments, facilitates a culture of evidence and improves communication across the care continuum. SH is a rapidly emerging alternative care setting for seniors. If managed carefully, SH has the potential to help address many health system level concerns as the population ages. It is hoped that this dissertation has answered some key questions and also inspired further research into an important and growing field. v
6 Acknowledgments Sincere thanks to Dr. John P. Hirdes, my PhD supervisor, mentor and inspiration. I am so grateful for the many opportunities with which you have provided me during these past 6 years. You have helped me develop my skills as a researcher, taught me how to disseminate knowledge, and thrown me in the deep end over and over to see if I could learn to swim. I am a hirdes-nerdie through-and-through and on a mission to be crowned the CHA-Queen one of these days. A heart-felt thanks to my dissertation committee members, Dr. Roger Mannell, Dr. Jeff Poss, and Dr. Martin Cooke. Roger, your support and kind words throughout this process have helped build my confidence and your insights have been very helpful in developing my research goals. Marty, you have been part of my graduate school journey since the beginning; your enthusiasm inspires me and I hope one day to be as accomplished a person and researcher as you are. Jeff, you baked me cinnamon rolls, you laughed at my jokes and you teased me about my cat obsession and I have never met anyone who understood data like you do! Thanks to the ideas for Health research team: To Maureen for all those practical skills, to Micaela for allowing me to bounce so many idea off of you, to Nancy for your hilarious stories and clinical insights, to Jeff for that data-geek badge you wear so proudly, and to Leslie for your friendship, support and all those people-skills you have taught me. Sincere thanks folks. vi
7 My years at UW have been the happiest of my life and I have the people of UW to thank. To my dear M.Sc. friends: Joe Griffiths, Melody Ashworth, Fathima Moola, and Peter Brink what fun we had! To my Ph.D. friends: Taryn Sendzik, Laura McCammon-Tripp, Andrew Costa, Micaela Jantzi, Christine Glenny and so many more. Thanks for the inspiration, support, and genuine affection you all showed me. To my profs who taught me so much and believed in me when I was not so sure and to Tracy we all know you run this place! I am a stronger and happier person for having known all of you. Please stay in touch. To my loving parents and baby brother: thank you for your love, patience and encouragement to be all I could be. You always told me to dare to be different and I must say I think I have achieved that goal. I gratefully acknowledge support and collaboration with clinicians from the Mississauga- Halton LHIN including Judy Bowyer. I am grateful for the assistance received from clients and staff members in completing assessments and for the IT staff and vendors who supported the data abstraction. Funding by: the Mississauga-Halton LHIN, the Primary Health Care Transition Fund, and the CIHR Institute of Aging. vii
8 Dedication This dissertation is lovingly dedicated to: Adam Jutan (July 30, 2003 July 15, 2010) I loved you with all my heart and soul. I am grateful for the time we had together and pray you are happy in your new home until we meet again, D. You saw me through all the ups and downs and Benjamin and I miss you very much Rest in Peace, love. viii
9 Table of Contents Author's Declaration... ii Abstract... iii Acknowledgments... vi Dedication... viii Table of Contents... ix List of Figures... xii List of Tables... xiii CHAPTER 1 : INTRODUCTION Study Rationale Conceptual Framework Key Research Questions Definitions of Supportive Housing Assessing the Strengths, Preference and Needs of Vulnerable Populations Geriatric Assessment in Canada The interrai family of assessment instruments CHAPTER 2 : A Description Profile of supportive housing clients in Ontario: Regional variability and clinical sub-populations Introduction Methodology Samples Measures Methods Results Socio-demographic and clinical characteristics Regional variability in socio-demographic and clinical characteristics Clinical Assessment Protocols (CAPs) ix
10 2.3.4 Disease Diagnoses Discussion CHAPTER 3 : Determining the role of supportive housing in the continuum of care: The Mississauga- Halton LHIN study of appropriate service environments Introduction Methods Samples Measures Data Collection Results Descriptive Statistics Logistic Regression Model Predicting Staff Ratings of Appropriate Care Settings Discussion CHAPTER 4 : Longitudinal analysis of CCAC residential care clients: Changes in client fit with supportive housing and factors associated with decline in quality of life Introduction Methodology Samples Analytic Methods Results Appropriateness of care setting placement over time Quality of Life Logistic Regression Model Predicting Decline in QoL Discussion CHAPTER 5 : Time to event analyses among CCAC residential care clients: Factors associated with time to discharge to LTC and death Introduction Methodology x
11 5.2.1 Samples Data Sources Analytic Methods Results Discussion CHAPTER 6 : Discussion Policy Implications For research For clinical practice For health system policy Methodological limitations and challenges Recommendations Future direction for research on supportive housing References Appendix A : interrai CHA data collected, by LHIN Appendix B : Staff Rating Form Appendix C : Staff Rating Form Care Setting Definitions Appendix D : Glossary of Terms Appendix E : interrai Assessment Scale Scores Appendix F : Clinical Assessment Protocols Appendix G : Local Health Integration Networks (LHINs) in Ontario Appendix H : Services provided by CCAC, CSAs and SH in Ontario xi
12 List of Figures Figure 1 The balance model between the needs of individuals and available resources... 5 Figure 2: Number of CAPs triggered by supportive housing clients not receiving CCAC services (No- CCAC(SH) clients) Figure 3: Number of CAPs triggered by CCAC clients in residential care settings including supportive housing (CCAC(RC) clients) Figure 4: Number of CAPs triggered by the CCAC(RC) group compared with the No-CCAC(SH) group including CAPs intended to prevent decline Figure 5: Number of CAPs triggered by the CCAC(RC) group compared with the No-CCAC(SH) group excluding CAPs intended to prevent decline Figure 6: Schematic representation of the continuum of care Figure 7: Schematic summary of variables associated with admission to and discharge from SH Figure 8: Decision tree predicting current care setting in the MH LHIN Figure 9: Survivor distribution function: Days to discharge to LTC among CCAC(RC) clients Figure 10: Survivor distribution function: Days to discharge to death among CCAC(RC) clients Figure 11: Schematic representation of the MAPLe algorithm Figure 12: Services provided by CCAC, CSAs and Supportive Housing in Ontario xii
13 List of Tables Table 1: Socio-demographic and clinical characteristics of clients who receive CCAC services in their residential care setting (including SH), with SH clients who do not receive CCAC services Table 2: Socio-demographic and clinical characteristics of clients who receive CCAC services in their residential care setting (including SH), with SH clients who do not receive CCAC services Table 3: Socio-demographic characteristics of clients who receive CCAC services in their residential care setting (including SH), compared with supportive housing clients who do not receive CCAC services, by LHIN Table 4: Range and SD of scale scores for CCAC(RC) and No CCAC(SH) clients, by LHIN Table 5: Proportion of clients who trigger each CAP among both those who receive CCAC services in their residential care setting (including SH) and SH client who do not receive CCAC services Table 6: Prevalence of disease diagnoses for CCAC(RC) and No-CCAC(SH) clients Table 7: Socio-demographic and clinical characteristics of participants in the Mississauga-Halton LHIN project, by care setting Table 8: Percentage distribution of staff ratings on most appropriate care settings, by care setting Table 9: Staff ratings of support services needed for persons to make a transition to a less intensive care setting, by current care setting Table 10: Summary of staff rating form results Table 11: Candidate variables for predicting staff ratings of being most appropriate for SH (as Table 12: Final logistic regression model for staff ratings of being most appropriate for SH (as compared to most appropriate to remain at home) xiii
14 Table 13: Candidate variables for predicting staff ratings of being most appropriate for a more intensive care setting than SH (such as LTC) Table 14: Final logistic regression model for staff rating of being most appropriate for a more intensive care setting than SH (such as LTC) Table 15: Distribution of decision tree algorithm for clients in both the derivation and the validation samples Table 16: DASH branch number for CCAC(RC) clients at two time intervals Table 17: Longitudinal changes in appropriateness of client care setting Table 18: Changes in DASH score over time Table 19: Changes in quality of life measures over time among CCAC(RC) clients Table 20: Candidate variables for predicting decline in the QoL of CCAC(RC) clients Table 21: Final logistic regression model predicting decline in the QoL of CCAC(RC) clients Table 22: Candidate variables for a model predicting time to LTC admission (1 year) among persons receiving CCAC services in their residential care setting, including SH Table 23: Final survival model predicting time to event (LTC admission within one year) among clients receiving CCAC services in their residential care setting, including SH Table 24: Candidate variables for survival model predicting time to death (1 year) among persons receiving CCAC services in their residential care setting, including SH Table 25: Final survival model predicting time to event (death within one year) among clients receiving CCAC services in their residential care setting, including SH xiv
15 CHAPTER 1: INTRODUCTION 1.1 Study Rationale Canada s population is aging in part due to an increase in life expectancy. Between 1956 and 2006, the proportion of the Canadian population aged 65 years and older increased from 7.7% to 13.7%. According to Statistics Canada (2006a), this proportion is projected to reach 24.5% by 2036, representing 9.8 million seniors in Canada. This large increase can be explained by declining fertility rates and the aging of the baby boom generation, who will begin turning 65 in While life expectancy has increased in Canada, many people live these extra years of life with some form of a disability, requiring care and support from others. Statistics Canada (1996) estimated disability-free life expectancy to be 68.6 years, with life expectancy at 78.3 years, on average. Moreover, the fastest growing segment of the population, the oldest-old (people aged 85 years and over), may have co-morbidities requiring complex care. There is widespread concern that Canada s health care system may be unable to cope, both fiscally and otherwise, with population aging. However, there is evidence to suggest that an aging population can be accommodated if the health care system is managed appropriately (Hirdes, 2006). Population aging is not unique to Canada and there are many comparative opportunities around the world that can provide evidence relevant for managing a changing demographic. Among the G8 countries, for example, Canada is one of the youngest compared with older populations in Japan, Italy, Germany, France and the UK (Statistics Canada, 2006b). 1
16 An essential component of managing the health care system is providing care to seniors in the setting that best meet their needs. The preferred care setting for the majority of seniors is their own home. From a health-system perspective, formal home care services (e.g. nursing or physiotherapy) may be a cost-effective alternative to placement in a Long- Term Care (LTC) Facility (Weissert & Hedrick, 1994; van Haastregt et al., 2000). However, informal support, provided by family and friends, is a critical determinant of a senior s ability to live at home, even with formal support services in place(e.g. Spillman & Long, 2009; Knight, Lutzky, & Macofsky-Urban, 1993). Trends noted by the Canadian Mortgage and Housing Corporation (CMHC, 2000b) predict a decrease in the availability of informal support. An increase in the participation of women in the workforce, a decline in the number of children people are having and the challenges associated with the sandwich generation are expected to result in a substantial decrease in the availability of informal support networks (Spillman & Pezzin, 2000). In order to determine the most appropriate setting in which to provide care, a balance must be reached between the needs of the senior and available resources (Rockwood et al., 1994). Persons with high resource needs may place undue strain on informal caregivers. On the other hand, premature admission to a LTC facility may reduce the quality of life and wellbeing of the individual while restricting access to beds for those with more complex care needs. Until recently, seniors were placed on a wait list for a LTC facility if they tipped the balance (see Figure 1) between care needs and available resources in the home. As a result, LTC wait lists have become unmanageable and caregiver distress is becoming a serious 2
17 concern as seniors with complex care needs wait in the community until a LTC bed becomes available. It has become clear that an alternative care setting needs to be considered if the Canadian healthcare system is to cope effectively with the aging population. This alternative is called Supportive Housing (SH) and will be the focus of this dissertation. SH is a rapidly emerging, but very poorly understood component of the health care continuum. As such, we have the opportunity to develop evidence-informed decisions that will help shape healthcare policy. Key questions must be addressed in order to take full advantage of the potential benefits of SH to meet the needs of Canada s aging population. 1.2 Conceptual Framework The place in which a person resides in later life plays a key role in health and wellbeing (Hays, 2002). It is integral to how old age is experienced and constructed (Kontos, 1998). The literature on place of residence and health is vast and includes: sense of place (e.g., Tuan, 1975), place identity (e.g., Cuba & Hummon, 1993), and place attachment (e.g., Altman & Low, 1992). The relationship between place of residence and the health and well-being of seniors is complex and multidimensional. Kahana, Lovegreen, Kahana, and Kahana (2003) proposed that the ability of a care setting to meet the needs of an individual depends on a complex interplay between these needs and the resources available in the environment. Wahl 3
18 & Weisman (2003) furthered this discussion, referring to the individual as an active participant in the environment, able to modify or optimized it rather than be a passive recipient of it. Many aspects of a place of residence can be modified or optimized to meet the needs of the resident. For example, installing a bathroom on the main floor to avoid the need to climb stairs, or removing throw rugs and increasing lighting to reduce the risk of falls. However, one key environmental factor cannot be easily modified the formal and/or informal support needed to complete daily living tasks. Rockwood et al. (1994) proposed a model focused on reaching a balance between the needs of the senior and the available resources. Using the balance scale as a metaphor (Figure 1), too many needs (e.g. medical conditions, or cognitive or functional impairments), coupled with sparse support, may tip the balance. If the balance gets tipped, whether due to an increase in care needs and/or a decrease in resource availability, then the current care setting may cease to be the most appropriate care setting and relocation may become necessary. For example, a person who experiences an increase in care needs as a result of a decline in cognitive functioning requires an increase in resources, whether informal or formal, in order to balance needs with resources and remain in the community. If more resources are unavailable, this decline in cognitive functioning may necessitate a transition to LTC. 4

19 Figure 1 The balance model between the needs of individuals and available resources RESOURCES NEEDS (adapted from the Dynamic Model of Frailty, Rockwood et al., 2004) 1.3 Key Research Questions This dissertation will determine for whom SH is the most appropriate care setting. The following research questions will be addressed: 1. What are the socio-demographic and clinical characteristics of persons currently residing in supportive housing units in Ontario? This research question will be addressed in Chapter 2, which will present Province-wide data. The purpose of this chapter is to provide a comprehensive description of the sociodemographic and clinical characteristics of current SH clients in Ontario. This is a necessary first step to further analyses on the appropriateness of SH to meet the needs of their clients. 5
20 2. How do the profiles of current supportive housing clients differ from the profiles of persons residing in a LTC facility, in a complex continuing care unit/hospital, or at home receiving home care support? This research question will be addressed in Chapter 3 which will focus on results from a two-year study conducted in partnership with the Mississauga Halton Local Health Integration Network (MH LHIN). The purpose of this chapter will be to describe the profiles of persons who currently reside in each of the care settings in the MH LHIN including SH. A continuum of care perspective will be taken to explore how decisions around care setting placement should be made. A decision support algorithm will be developed to support this decision making process. 3. What changes occur in the appropriateness of supportive housing to meet care needs over time? This research question will be addressed in Chapter 4 which will present a longitudinal sample of supportive housing data. The purpose of this chapter will be to move past crosssectional analyses and explore change over time in the ability of SH to meet changing care needs. The decision support algorithm that was developed in Chapter 2 will be used to make longitudinal comparisons. Changes in the appropriateness of SH will be explored in terms of clinical characteristics, resource availability and quality of life. 6
21 4. What factors are associated with discharge from supportive housing to a long-termcare facility? This research question will be addressed in Chapter 5 which will use survival analysis techniques with a longitudinal sample of SH data. The purpose of this chapter is to determine the proportion of and factors associated with current SH clients who are discharged from SH to a LTC facility within a one-year time period. This chapter will support appropriate care setting placement decisions by determining to what degree SH can serve as an alternative care setting to a LTC facility. 1.4 Definitions of Supportive Housing Traditionally, the term SH described a congregate-living residence for persons with a low-income, a physical disability, a mental illness or a substance addiction. Only very recently have SH units been designated as a care setting in which to provide support to seniors. As a result of this recent development, there is a dearth of literature on SH and no agreed-upon national definition. Much of the research to date on SH comes from care settings such as assisted living in the USA. Definitions of assisted living vary widely and there are clear overlaps between assisted living in the USA and supportive housing in Ontario. Although they are not identical in terms of the populations they serve, nor the policies surrounding them, the literature for this dissertation has drawn on the assisted living literature as being applicable to the discussion of care challenges for an ageing population in 7
22 western society. For the purpose of this dissertation, SH will be defined as: a care setting that combines the bricks and mortar of housing with the availability of support services. Both the CMHC and the Ontario Ministry of Health and Long-Term Care (MOHLTC) provide similar definitions. The CMHC s definition focuses more on the housing aspect while acknowledging the service aspect, while the MOHLTC s definition is focused more on the support services provided. The CMHC research report on SH for seniors (CMHC, 2000a), defines SH as: housing that helps people in their daily living through the provision of a physical environment that is safe, secure, enabling and homelike. The CMHC goes on to note the provision of support services including: meals, housekeeping, and social and recreational activities. It also states SH maximizes independence, privacy, decision-making and involvement, dignity and choices and preferences (CMHC, 2000a). In comparison the MOHLTC defines SH as: a care setting designed for those who need minimal or moderate care in order to remain living independently (MOHLTC, 2007d). This suggests that the services provided through SH, prevent institutionalization. This assumption will be addressed in Chapter five. In terms of the bricks and mortar aspect of SH, these units tend to be subsidized by the government, with rent costs ranging from approximately $600 to $1200 per month (MOHLTC, 2007d). This makes SH much more affordable than other LTC alternatives such as retirement homes. Entire buildings may be designated as SH sites or seniors may live in a more integrated apartment where only some of the units are designated as SH units. The building may stand alone or be located on the site of a LTC facility. Most SH buildings 8
23 offer amenities on-site, such as meeting rooms or tuck shops. SH sites may accommodate persons with similar needs such as seniors with physical disabilities, while other sites may accommodate persons with varying needs or medical conditions. In terms of the allocation of support services, there is evidence to suggest that seniors are not always aware of the health services available to them or how to navigate through the health care system (vanbilsen et al., 2006). With SH, a case manager is assigned to the client to assist them and their families with coordinating services, both those on-site and those provided by a Community Care Access Centre (CCAC) or Community Support Agency (CSA). The somewhat liberal definition of SH used in this dissertation is partly out of necessity and partly to allow for the inclusion of as many sites as possible. In-home SH (a new innovation providing IADL support in the home), will be excluded from the definition. The term supportive housing will refer to some form of a congregate living facility in which care is provided to residents outside the home. To be included in the definition, support services must be provided to clients by on-site SH services and/or by a CCAC. 1.5 Assessing the Strengths, Preference and Needs of Vulnerable Populations Geriatric Assessment in Canada SH has the potential to address many health system concerns as the population in Canada ages. A comprehensive assessment of the needs, strengths and preferences of seniors 9
24 is required in order to determine for whom SH is most appropriate. Assessment instruments must be reliable and valid and provide enough information to enable informed care setting placement decisions for individual clients, monitor health status over time, and inform resource allocation decision across the care continuum. Assessments should be thorough but not overly burdensome to either the assessor or the persons being assessed. In Canada, two main assessment systems are currently in use: the Functional Autonomy Measurement System SMAF and the interrai assessment instruments. The SMAF (e.g. Hébert, Guilbault, Desrosiers, & Dubuc, 2001) was developed in 1984 and revised in It is a 29 item scale developed using World Health Organization (WHO) classifications of disabilities. It focuses on impairment, disability and handicap. It must be completed by a nurse or social worker. The SMAF is used for all Quebec home support programs and for decision-making on admission to residential care settings. The interrai ( assessment instruments are mandated (or recommended) across Canada, including British Columbia, Saskatchewan, Alberta, Ontario, Nova Scotia, Newfoundland and the Yukon Territory. They are also used across the world in the USA, Europe, the Middle East, the Pacific Rim, and in Central and South America (Bernabei et al., 2009). This family of assessment instruments includes assessments for persons who require access to home care services, or admission to a LTC facility, or a complex continuing care (CCC) hospital/unit. The interrai assessment instruments have been chosen as the source of data for the current dissertation. To the author s knowledge, the interrai Community Health 10
25 Assessment (interrai CHA) is the first standardized, comprehensive assessment instrument, with documented validity and reliability, used to assess the needs, strengths and preferences of persons residing in SH units in Ontario (Hirdes, 2006). Moreover, the interrai CHA is part of a suite of already mandated assessment instruments designed by interrai to act as an integrated health information system (Hirdes, Poss, & Curtin-Telegdi, 2008). In 2010, the Ontario MOHLTC implemented the interrai-cha as the provincial standard for all community support services including supportive housing. This is an important step forward in establishing a culture of evidence. This dissertation focuses on supportive housing client in Ontario. The Province of Ontario has been ahead of many jurisdictions in Canada in adopting instrumentation that has made apples to apples comparisons across the care continuum possible. It has taken steps to establish an integrated health information system by adopting several interrai assessment instruments as its standard across the care continuum (Hirdes, 2006). Hirdes (2006) cites collaboration among key stakeholders, strong leadership across the continuum of care, and an established infrastructure to capture and report on the data collected, as factors that have contributed to the progress Ontario has made to date The interrai family of assessment instruments interrai ( is an international not-for-profit consortium of researchers and clinicians from over 30 countries who conduct collaborative research to 11
26 develop, implement and evaluate comprehensive assessment instruments and their related applications across the health care continuum (Bernabei, Landi, Onder et.al, 2008). A recent international study (Hirdes et al., 2009) found that interrai items retain their reliability when used across the health care continuum. Instruments include a core set of items that are considered important in all care settings, and additional items of importance to particular care settings. All interrai instruments have a common language (terminology), clinical emphasis, data collection methodology, and theoretical / conceptual basis. This facilitates continuity of care when clients transfer between care settings or access services concurrently from more than one health sector. interrai instruments collect data on the following: socio-demographic variables, cognitive and functional capacity, mood and behaviours, health conditions, medications and both informal and formal service utilization. The data collected are used for individual care planning, measuring key outcomes (e.g. depression and cognitive decline) over time, and developing quality care indicators (e.g. pressure ulcers) and case-mix algorithms. interrai instruments are available for the following care settings: community care, home care, LTC, complex continuing care, acute care, palliative care, inpatient mental health and psychiatry, developmental difficulties and rehabilitation. This dissertation will use data from SH clients collected using the interrai CHA, from home care clients using the RAI Home Care (RAI-HC), and from both LTC and CCC clients using the RAI- Minimum Data Set (RAI 2.0). Below is a brief description of these assessment instruments and related applications. 12
27 interrai Community Health Assessment (interrai CHA) The interrai CHA is part of the newly developed suite of interrai assessment instruments. The interrai CHA is a comprehensive standardized assessment instrument used to evaluate the needs, strengths and preferences of clients receiving community support services including SH. It is a short, modular instrument that efficiently assesses the well elderly using a few core items, and can determine for whom further assessment may be beneficial in terms of functional or mental health capacity. The interrai CHA includes a core set of items and the following four supplements: the functional supplement, the mental health supplement, the deaf-blind supplement, and the assisted living supplement. The need for one or more of these supplements depends on the persons being assessed. If the core set of interrai CHA items is completed along with a functional supplement, the assessment is identical to the newer version of the RAI-HC (the interrai Home Care). An algorithm is built into a research grade software program that indicates the need for a supplement to be completed. The assessor may also choose to complete one or more of the supplements based on clinical judgement. The interrai-cha was not a mandated assessment instrument for supportive housing clients in Ontario at the time that the data were being collected for this dissertation. Therefore, primary data collection was required. It was expected that the result may somewhat underestimate impairment among clients given that clinicians were able to select whom they chose to assess. However, conversations with the clinicians who completed the assessments indicated that a reasonable cross-section of supportive housing clients was 13
28 assessed. Moreover, data were collected primarily for the purposes of resource allocation and client care planning and therefore supportive housing sites had a vested interest in completing assessments accurately and with as many clients as possible. In the Mississauga- Halton LHIN, for example, the data collected for chapter 3 of this dissertation were a subset of other research activities in the LHIN. These activities were being undertaken using evidence to inform policy decisions that resulted, for example, in revised eligibility criteria for supportive housing and a pilot project to explore the feasibility of providing SH-type services to person in their own home. Prior to the Ontario MOHLTC s implementation of the CHA as the provincial standard for assessing client for supportive housing, decisions around eligibility for SH relied on home grown assessments. These assessments often lacked reliability and validity testing and the opportunities for comparisons between SH sites or between SH and other health care sectors was limited as a result of non-compatible assessment instruments. Ideally, the CCAC case- manager would make evidence-informed decisions with persons residing at home based on the mandated RAI-HC assessment. However, CCACs in Ontario are not yet the only gateway to SH settings. Referrals are made by family, physicians, other health care professional, and community support agencies, each with differing levels of knowledge and expertise. The individual themselves as well as family should be consulted when exploring the possibility of relocating to a new care setting, including supportive housing. 14
29 Resident Assessment Instrument for Home Care (RAI HC) In Ontario, the RAI HC has been the mandatory assessment instrument since 2002 for all adult home care clients expected to receive services for more than 60 days. It contains over 300 items and is a comprehensive instrument designed to assess the needs, strengths and preferences of a community-based population. A recent study (Berg et al., 2009) found substantial overlap between the RAI HC items and the WHO International Classification of Functioning, a gold-standard framework for conceptualizing functioning and disability. The RAI-HC was initially developed in 1994 and later adapted to the current version (2.0) in It was designed to be compatible with the other RAI assessment instruments including the interrai CHA. CCACs in Ontario are expected to transition to the new version of the RAI HC (the interrai HC) in the near future. The advantage of using data collected as part of normal clinical practice is the large sample size and census level data. All clients expected to be on long-stay service with the CCAC in Ontario were assessed. Therefore, there are fewer concerns in terms of biases related to the selection of persons to be assessed. However, there are some disadvantages to secondary data analysis. One major disadvantage is that the data elements available for analysis are limited to the information collected during the primary data collection process Residential Assessment Instrument-Minimum Data Set (RAI-MDS 2.0) The RAI 2.0 has been the mandatory assessment instrument for all CCC hospitals/units in Ontario since 1996 and has recently been mandated for use in LTC facilities. It is a comprehensive instrument designed to assess the needs, strengths and 15
30 preferences of clients residing in LTC or CCC facilities. It was designed to be compatible with the other RAI assessment instruments. The interrai CHA, RAI-HC and RAI 2.0 are designed to act as an integrated health information system, along with interrai assessments in several other care settings (Hirdes et al., 2099). In addition to a core set of items embedded algorithms are also common across the assessment instruments helping to inform appropriateness of placement decisions by providing a means by which to compare and contrast clinical characteristics of clients across and within settings and to monitor changes over time Scale Score and Algorithms Scale scores are calculated based on a combination of items in the interrai assessment instruments. These scales are embedded in the assessment instrument and therefore require no further work by clinicians to complete them. Scales are calculated for each individual to assess current clinical status and for the purpose of care planning. Scales can also be used to monitor changes over time. These scales have been carefully constructed and compared with industry gold-standard assessments. The scale scores available are as follows and a detailed explanation of these scores can be found in Appendix E. The Cognitive Performance Scale (CPS) measures a person s cognitive status ranging from intact to very severe impairment. This scale has been validated against the Mini Mental State Examination (Morris et al., 1994). 16
31 The Depression Rating Scale (DRS) measures depressive symptoms. A score of three or more has been shown to suggestive possible depression. The DRS has been validated against the Hamilton Depression Rating Scale and the Cornell Scale for Depression (Burrows et al., 2000). The Pain Scale measures the intensity and frequency of pain. It has been validated against the Visual Analogue Scale (Fries et al., 2001). The Activities of Daily Living (ADL) Hierarchy Scale measures a client s ability to perform ADL. This ability ranges from independent to complete dependence on others to perform daily tasks. A high correlation was found between this scale and the Barthel Index (Landi et al., 2000). The Instrumental Activities of Daily Living (IADL) Involvement Scale measures a persons ability to perform IADL. This scale has been validated against the Lawton IADL Index (Landi et al., 2000). The Method for Assigning Priority Levels (MAPLe) algorithm is used to categorize home care clients into five levels of risk for adverse outcomes including nursing home placement and caregiver distress (Hirdes, Poss, and Curtin-Telegdi, 2008). This algorithm is commonly used to support and inform decision making. The Self-Reliance Index (SRI) is a measure of self- reliance and is used to distinguish between low and mild MAPLe scores. It is also used to trigger the functional supplement to the Community health Assessment (CHA). 17
32 The Changes in Health, End-Stage Disease, Sign and Symptoms (CHESS) scale is a measure of health instability and decline in the ability to function (Hirdes, Frijters, & Teare, 2003) Clinical Assessment Protocols In addition to the scale scores embedded in the interrai instruments, Clinical Assessment Protocols (CAPs; Morris, 2010) provide red flags for clinicians indicating possible areas of concern for their client s health and well-being. Sixteen CAPs may be triggered through the completion of the interrai CHA core assessment. An additional ten CAPs may be triggered when a functional supplement is completed (see Appendix F). When a CAP is triggered, the clinician may consult with the individual and decided whether or not to intervene, and how. CAPs are not designed to automate care planning, but rather draw attention to possible areas of concern. The CAPs manual provides clinicians with guidelines and possible courses of action for each CAP. Some CAPs are designed so that they are either triggered or not (Yes or No), while others may be triggered at multiple levels (e.g. not triggered, or triggered at low-, medium- or high- risk). A summary of CAP trigger levels is provided in Appendix F. 18
33 CHAPTER 2: A Description Profile of supportive housing clients in Ontario: Regional variability and clinical sub-populations This chapter will address the first research question by identifying the sociodemographic and clinical characteristics of persons currently residing in SH units in Ontario. This descritptive chapter is a necessary first step in determining for whom SH is most appropriate. The balance model (see Figure 1) indicates that a care setting is appropriate when there is a balance between the care needs of individuals and the resources available to meet those needs. This chapter will provide a comprehensive description of the needs of current SH clients using provincial data collected as part of normal clinical practice through the RAI-HC, as well as primary data collected through the interrai CHA. 2.1 Introduction From a resourcing perspective, there are many individual-level and health care system-level advantages to caring for seniors at home. It is well recognized that the majority of seniors would prefer to remain at home for as long as possible (Demiris et al., 2006). Remaining in our own home as we age may be a source of pride. As well, the home is a reflection of self, a source of continuity, a place to develop and nurture relationships and engage in activities, and a source of security and a place of retreat (Despres, 1991). From a health system-level perspective, providing care to seniors at home may be a cost-effective alternative to providing care in a LTC facility (Miller & Weissert, 2007; Hollander et al., 19
34 2009). Moreover, when care is provided in the home, family and friends provide as much as 80% of the care, which may reduce the need for formal support services(chappell & Blandford, 1991). In addition, as the population ages, providing carefully targeted support in the home may reduce the need for institutionalization and therefore the need to build new LTC facilities ((Spillman & Long, 2009; Knight, Lutzky, & Macofsky-Urban, 1993); Stuck et al., 2002). In 2007, the McGuinty government announced an Aging at Home Strategy and $700 million over three years to help Ontario s seniors lead healthy and independent lives in the community (MOHLTC, 2007a). This is a clear indication that the Ontario government recognizes the advantages of providing care in the community and is willing to fund research on the best strategies to accomplish this goal. The Aging at Home Strategy was established to focus on the following priorities matching the needs of seniors with appropriate local support services expanding existing community support services such as supportive housing avoiding premature admission to LTC facilities being innovative finding new ways to support seniors in the community creating a new approach to integrate the continuum of community-based services supporting family caregivers sustaining the health care system (MOHLTC, 2007b) 20
35 The Aging at Home Strategy recognizes that not all seniors can be supported in their own home. However, other community-based alternatives have been suggested that could have the same individual-level and health system-level benefits as providing care in the home. SH is one such alternative that addresses the care needs of seniors who lack the resources meet their needs at home. Persons in Ontario who reside in a SH unit, have three main resources from which to receive care and support: family and friends, a CCAC, or a CSA (see figure in Appendix H). The majority of SH buildings provide some on-site support to residents. In a SH linked model the same organization provides both the support services and the housing while in a delinked model, one organization owns and operates the housing component and a separate organization provides the support services (Jones, 2007). Strict eligibility criteria must be met in order for a SH client to be eligible for CCAC services. Therefore, in general, those who receive CCAC services in a residential setting are expected to be a more impaired population than those who do not. SH clients who do not receive CCAC services may be ineligible because they have fewer or less complex care needs. Alternatively, they may be unaware of the availability of these services, have a strong informal support system, have adequate funds to pay out of pocket for CSA services, or may reside in a SH building that has sufficient on-site care; this may be of particular concern to minority groups (Thomas & Payne, 1998). Currently in Canada, there is considerable diversity in supported housing in terms of services offered, models of care / 21
36 terminology, and client characteristics. This had led to difficulty determining best practices (Fakhoury, Murray, Shepherd, & Priebe, 2002) In 2005, Health Canada, in cooperation with the Canadian Mortgage and Housing Corporation, identified supportive housing projects across Canada in an attempt to ascertain the number and types of supportive housing services available to seniors across the country (Social Data Research, 2005). The majority offered on site repairs/ maintenance, meals in a common dining area, recreational facilities, 24 hour security, ADL assistance, medication management and laundry/housekeeping. Some sites offered additional services such as transportation to medical appointments, and mental health services. Most (70%) SH sites offered services to support aging at home and to improve the quality and life of residents. Over 3000 SH projects were identified across the country, a selection of which was explored in further detail. SH was most commonly found in urban centres, as compared with rural, and there were a combination of for-profit and not-for-profit sites. Most (85%) SH units had one bedroom suites and some also offered bachelor and two-bedroom options. A wide range of clinical characteristics were found among SH clients. For example, about half of residents required assistance with activities of daily living such as grooming, dressing, eating and bathing. Severe cognitive impairment was rare, but 22% of SH clients had mild Dementia. Many (42%) SH residents self-report to be in good health, with a further 41% reporting fair health; few self-rated their health to be poor or very poor (15%). Much of the literature to date on the characteristics of persons residing in care facilities outside of nursing homes is found in papers published on the characteristics of 22
37 assisted living clients. Given the diversity in both and supportive housing terminology and definition, it is reasonable to expect there to be some overlap between these populations. For example, the Assisted Living Federation of America (ALFA,2009) defines assisted living as a long-term care option that combines housing, support services and health care a similar definition to supportive housing defined by the MOHLTC as: a care setting designed for those who need minimal or moderate care in order to remain living independently (MOHLTC, 2007d). Moreover, to date, the literature on assisted living is the best source of demographic and clinical information available on SH-type populations. The Assisted Living Federation of America (ALFA, 2009), reported that the average age of assisted living residents in the USA was 86.9 years. The majority are female (73.6%) and have been widowed (76.6%). Persons tend to remain in an assisted living facility for about two years on average (the median is 21 months). AL facilities provide care to seniors as well as persons with mentally illness, and some AL facilities provide care for persons with early to mid stage dementia including Alzheimer's disease. Long term skilled nursing care tends to require placement in a nursing home since assisted living does not provide this level of care. Instead, assisted living resident receive support with ADL such as bathing, grooming, dressing, eating, and toileting. Some facilities also offer assistance with IADLs such a medication management and transportation to appointments. There are over 36,000 assisted living communities in the USA (estimate by ALFA, 2009) serving more than one million seniors and is expected to see rapid growth as the population ages. 23
38 SH is a rapidly emerging part of the healthcare continuum and a care setting that has the potential to help Ontario meet many of the challenges associated with an aging population. As a starting point for understanding for whom SH is most appropriate, this chapter will provide a comprehensive description of the socio-demographic and clinical characteristics of persons who currently reside in SH units in Ontario. The balancing of care needs with resource availability will further the discussion on for whom SH is most appropriate. Care needs will be measured using interrai scale scores, CAPs and disease diagnoses. Resource availability will be addressed by contrasting the care needs of SH clients who receive CCAC services with the care needs of those who do not. 2.2 Methodology Samples The data for this chapter will include all interrai CHA pilot study data collected to August (N=1,720), and a subset of RAI HC data collected between January 2, 2003 and Jan, as part of normal clinical practice across Ontario (N=29,790). The subset of persons assessed with the RAI HC who will be included in the analyses, are those identified as residing in board and care, assisted living or in a group home (RAI-HC item cc5=3). The cc5 item on the RAI HC distinguishes between CCAC clients who receive their care at home and those who receive their services in a residential care setting. Although we cannot be sure that all persons identified with the cc5 item reside specifically in a designated 24
39 SH unit, board and care, assisted living home or a group home is the best proxy that is available on the RAI HC. The advantage of secondary analysis of interrai data holdings is that they provide large sample sizes and census level data; however, data were not collected specifically on supportive housing clients and therefore a proxy measure was used for analysis in this dissertation. Moreover, conversations with clinicians who are familiar with the RAI HC, indicate that the majority of cc5=3 clients reside in assistive living and the literature often uses this term synonymously with SH. However, to be accurate and ensure careful interpretation of results, persons assessed with the RAI HC (cc5=3 only) will be referred to as clients who receive CCAC services in a residential care setting (including SH) and will be abbreviated CCAC (Residential Care; RC). All persons assed with the interrai CHA will be included in the analyses in this chapter. Persons assessed with the interrai CHA are those who reside in a SH unit and do not receive any of their care from a CCAC. As such, this population will be abbreviated No CCAC(SH). As of August 31, 2009, the interrai CHA has been used to collect SH data from 30 SH sites in 11 of the 14 Local Health Integration Networks (LHINs; see 0). Most SH sites provided data to the University of Waterloo through research grade software provided for CHA data collection. This software was designed as an interim solution until a secure commercial software vendor could be acquired, a license issued to run the interrai CHA, and a decisions made on a central data repository. This research grade software eliminated the need for paper copies of the instrument to be completed. The advantages of completing an electronic copy of the interrai CHA are numerous. The software has been developed to 25
40 provide immediate feedback to the clinician upon completion of the assessment. Once the core assessment has been completed, clinicians were informed about any missing items and directed to complete them. Clinicians were then informed as to whether the client has triggered the need for one or more of the interrai CHA supplements. Once the assessment was complete, clinicians receive feedback on CAPs (Appendix F) that the client had triggered, as well as the client s scale score distributions (Appendix E). Clinicians were also provided with a short summary to help them to interpret the scale scores Measures A summary of the interrai CHA and RAI-HC was provided in chapter 1. All items included in both assessments were available for analysis as were the summary scales described in chapter 1. Copies of the interrai CHA and RAI HC have not been included in this chapter due to copyright restrictions but are available upon request Methods The socio-demographic and clinical characteristics of client will be described for both care settings. Data will be presented to contrast the characteristics of CCAC(RC) clients with No CCAC (SH). Variables will include: age, gender, marital status, and the scale score distributions for CPS, CHESS, DRS, SRI, MAPLe, Pain, IADL Capacity, and the ADL Hierarchy Scale. The percentage of clients who are independent in specific ADLs and IADLs will also be provided. 26
41 Regional variability in the distribution of client scale scores will be determined. Data will be presented for all of the major scale scores (described in further detail in Appendix E). A summary of regional variability will be provided by calculating a range and SD of scale scores. For example, data from the LHIN with the lowest proportion of clients with a CPS score of zero and data from the LHIN with the highest proportion will be presented, as well as the SD to give an indication of variability and spread of the distribution. Clients who are assessed with the RAI-HC have 23 available Clinical Assessment Protocols (CAPs). Clients assessed with the interrai CHA have 16 available CAPs. There are 14 CAPs that can be calculated for both groups. The proportion of clients who trigger each CAP will be calculated. These data will be presented for both binary level CAPS (those that are either triggered or not) and for multi-level CAPs (may be triggered at various levels). For multi-level CAPs those that are triggered to facilitate improvement will be distinguished from those triggered to prevent decline. Finally, the number of CAPs triggered by both groups (of the 14 available) will be calculated and presented in a bar graph to provide a visual comparison. Where appropriate, the chi-square test will be used to test for differences between the study samples. 2.3 Results Socio-demographic and clinical characteristics Table 1 and table 2 show statistically significant differences (p <.05) between the socio-demographic and clinical characteristics of client who receive CCAC services in their residential care setting (including SH), compared with SH clients who do not receive CCAC 27
42 services. Table 1 shows that a higher proportion of CCAC(RC) clients, as compared with No-CCAC(SH) clients, are 85 years of age and older (60.2% vs. 39.7%). No-CCAC(SH) clients are more likely to be married than CCAC(RC) clients (22.2% vs. 13.9%) and slightly more likely to be female. CCAC(RC) clients are more likely than No-CCAC(SH) clients to have never been married (14.5% vs. 10.2%, respectively). Living arrangement is associated with marital status (not shown in the table). For example, those who are currently married, 84.5% live with their spouse/partner. Of those who do not have a partner, most (73.4% or more) live alone. About one quarter (24.6%) of clients who have never been married live with another person who is not their spouse or their child. Based on the distributions of the interrai scale scores, the CCAC(RC) clients are a significantly more impaired population, than the No-CCAC(SH) clients. The proportion of No-CCAC(SH) clients who are cognitively intact (63.8%) is more than twice the proportion of CCAC clients who are cognitively intact (27.7%). The majorities of both groups have a CHESS score of 0 or 1 and do not have any depressive symptoms. The majority (89.0%) of CCAC(RC) clients is not self-reliant, but this proportion is closer to 50% among No- CCAC(SH) clients. Table 2 shows statistically significant difference in the distribution of the MAPLe score between the CCAC(RC) and the No-CCAC(SH) groups. For example, low or mild MAPLe scores are found among 39.3% of No-CCAC(SH) client but only 12.3% of CCAC(RC) clients. Daily pain is more prevalent among CCAC(RC) clients, but 28
43 excruciating daily pain occurred among 14.9% of No-CCAC(SH) clients compared with 8.2% of CCAC(RC) clients Major differences in the ability to perform both IADLs and ADLs are found between the groups. For example, 30.3% of the No-CCAC(SH) clients have no difficult in their ability to perform IADLs compared with less than 1% of CCAC(RC) clients. Severe difficulty in IADLs is experienced by almost one quarter of CCAC(RC) clients (23.6%) compared with only 3.5% of No-CCAC(SH) clients. When looking at specific IADLs, phone use is performed independently (capacity to perform) by the majority of clients in both groups. Managing medications, finances and transportation are independent IADLs for most No-CCAC(SH) clients (between 55.0% and 67.8%), but no more than 16% of CCAC(RC) clients have the capacity to perform these IADLs independently. Of the 8 IADLs, the capacity to perform housework independently is the most impaired with only 1.3% of CCAC(RC) and 31.9% of No-CCAC(SH) clients being independent. When looking at specific ADLs, bathing is the most common problem for both groups. Dressing the lower body is the next most difficult ADL with less than half (42.9%) of CCAC(RC) clients being able to perform this ADL independently. Greater than 70.0% of client in both groups are independent in locomotion in their own home. 29
44 2.3.2 Regional variability in socio-demographic and clinical characteristics This section will explore regional variability in the characteristics of CCAC(RC) and No-CCAC(SH) clients. The CCAC(RC) sample size of 29,653 provides ample data from all 14 LHINs with the smallest sample size being 253 from the North West Local Health Integration Network (NW LHIN) and largest sample size being 4,907 from Hamilton Niagara Haldimand Brant LHIN (see Table 3). interrai CHA data has been collected to date from 11 of the 14 LHINs with a total sample size of 1,719. Of the 1,719 assessments completed, 504 were completed with clients in the Mississauga-Halton LHIN. 30
45 Table 1: Socio-demographic and clinical characteristics of clients who receive CCAC services in their residential care setting (including SH), with SH clients who do not receive CCAC services. Type of Care Received CCAC(RC) N=29,790 No CCAC(SH) N=1,720 Age yrs. 7.3(1806) 13.1(177) yrs. 32.5(7986) 47.2(639) 85+ yrs. 60.2(14811) 39.7(537) Gender Female 71.6(21245) 73.5 (1263) Marital Status Never Married 14.5(4308) 10.2(175) Married/Partner 13.9(4146) 22.2(379) Widowed 63.9(18959) 55.2(949) Separated 2.1(628) 3.3(56) Divorced 5.0(1497) 8.6(148) Cognitive Performance Scale Intact (0) 27.7(8249) 63.8(1097) Borderline Intact (1) 17.5(5208) 19.4(334) Mild Impairment (2) 33.6(9986) 11.5(197) Moderate Impairment (3) 11.9(3543) 4.4(76) Moderate/Severe Impairment (4) - Very Severe Impairment (6) 9.8(2792) 0.9(15) CHESS Scale Not Unstable (0) 32.7(9729) 45.2(762) CHESS = (9359) 34.2(577) CHESS = (7138) 13.5(227) CHESS = 3 - Highly Unstable CHESS (5) 11.9(3544) 7.1 (119) Depression Rating Scale No Depressive Symptoms (0) 64.6(19224) 74.8(1278) DRS = 1 or (6677) 14.4(246) Possible Depression (3+) 12.9(3849) 10.8(184) Self-Reliance Index Independent (0) 11.0(3267) 49.8(853) Dependent (1) 89.0(26523) 50.2(861) 31
46 Table 2: Socio-demographic and clinical characteristics of clients who receive CCAC services in their residential care setting (including SH), with SH clients who do not receive CCAC services. Type of Care Received CCAC(RC) N=29,790 No CCAC(SH) N=1,720 MAPLe Algorithm Low (1) / Mild (2) 12.3(3364) 39.3(156) Moderate (3) 37.7(11241) 38.3(152) High(4) / Very High (5) 50.0(14885) 22.3(13) Pain Score No Pain (0) 47.6(14173) 43.0(737) Less than daily pain (1) 12.4(3694) 23.9(409) Daily Pain Moderate- Severe (2) 31.8(9449) 18.2(311) Daily pain horrible or excruciating (3) 8.2(2449) 14.9(256) IADL Capacity Independent (0) 0.8(230) 30.3(497) 1 1.5(436) 15.7(257) 2 6.9(2053) 5.8(95) 3 0.8(236) 0.7(12) (3099) 22.6(370) (16714) 21.6(354) Dependent (6) 23.6(7014) 3.3(55) Independence in IADLs Phone use 57.5(17113) 89.5(1522) Medication Management 16.0(4753) 67.8(1152) Managing Finances 14.5(4333) 64.7(1100) Transportation (public or own car) 16.0(4757) 55.0(939) Meal Preparation 2.9(856) 55.0(927) Shopping 5.6(1679) 43.8(745) Stairs 19.1(5695) 40.2(683) Ordinary Housework 1.3(375) 31.9(543) Independence in ADLs Bathing 12.7(3788) 52.8(908) Personal Hygiene 49.5(14739) 80.2(1378) Dressing upper body 49.9(13950) 78.9(1353) Dressing lower body 42.9(12784) 68.6(600) Locomotion in home 73.9(22011) 78.2(683) 32
47 Table 3 provides demographic data, by LHIN, for CCAC(RC) and No-CCAC(SH) clients. The CCAC(RC) data include contributions from all 14 LHINs. The No-CCAC(SH) data are missing contributions from the Central West, Champlain and the South East LHINs. There is a significant difference between the percentage of client aged 85 or older in the CCAC(RC) group as compared with the No-CCAC(SH) group, 60.2% and 39.7%, respectively. Wide regional variability is also observed between the LHINs. Among the CCAC(RC) group, the percentage of client age 85+ ranges from 49.0% in the North East LHIN to 64.8% in the South East LHIN. Among the No-CCAC SH clients, the range is between 29.4% in the Central East LHIN and 53.2% in the Toronto Central LHIN. Overall, the majority of clients are female, 71.6% of CCAC(RC) clients and 73.5% of No-CCAC(SH) clients. The majority of clients in both groups have been widowed, 63.9% of CCAC(RC) and 55.2% of the No-CCAC(SH). When looking at marital status by LHIN, the exceptions are CCAC(RC) clients in the North West LHIN and No-CCAC(SH) clients in both the Mississauga-Halton LHIN and the Central East LHINs, where less that 50.0% have been widowed. Table 4 provides a summary of regional variability in the scale score distributions of SH client across Ontario. The table provides data on the extreme ends of scale distributions, both high and low levels of impairment. ADL hierarchy data are not provided for the No- CCAC(SH) group, because the interrai CHA does not provide all of the items necessary for this algorithm to be calculated. 33
48 Data are provided in each case for the LHIN with the lowest proportion of, and highest proportion of, each scale score measure. For example, the No-CCAC(SH) group has a more cognitively intact population on average than the CCAC(RC) group. The percentage of clients with no cognitive impairment (CPS=0) ranges from 23.0% to 36.9% for the CCAC(RC) clients and ranges from 52.4% and 80.5% for the No-CCAC(SH) clients. This table provides evidence for the CCAC(RC) group being a more impaired group, on average, than the No-CCAC(SH) group. However, there are areas of overlap between the groups. For most measures, the SD is higher for the No-CCAC(SH) group, indicating more variability in the distribution of scale scores across the LHINs. This may also reflect the smaller sample size. There is also clear evidence of heterogeneity within both groups. 34
49 Table 3: Socio-demographic characteristics of clients who receive CCAC services in their residential care setting (including SH), compared with supportive housing clients who do not receive CCAC services, by LHIN. LHIN* All Cases % (n) Age 85+ % (n) Female % (n) Widowed % (n) CCAC(RC) No CCAC (SH) CCAC(RC) No CCAC (SH) CCAC(RC) No CCAC (SH) CCAC(RC) No CCAC (SH) Erie 6.3(1870) (966) (1323) (1205) - SW 9.6(2852) 3.5(60) 62.6(1535) 30.4(17) 75.3(2145) 74.6(44) 67.6 (1926) 61.7(37) WW 9.7(2882) 8.6(147) 63.8(1594) 39.6(53) 73.6(2121) 71.4(105) 66.1(1904) 69.2(101) HNHB 16.5(4907) (2298) (3410) (3038) - CenW 1.6(474) (230) (339) (307) - MH 5.8(1733) 29.3(504) 60.5(900) 38.1(106) 73.4(1270) 71.2(344) 69.5(1201) 43.1(214) TC 5.2(1551) 15.3(263) 60.0(700) 53.2(125) 68.4(1061) 79.5(209) 52.1(808) 64.5(169) Cen 6.2(1846) 11.6(200) 57.7(862) 32.0(58) 69.2(1844) 76.0(152) 61.9(1141) 54.0(108) CenE 7.6(2250) 12.9(221) 59.8(1149) 29.4(50) 71.5(2248) 68.8(152) 70.1(1575) 47.0(104) SE 7.0(2073) (1138) (1490) (1374) - Champ 14.3(4237) (2069) (3042) (2550) - Simco 4.7(1387) 6.6(113) 60.5(699) 33.9(37) 71.5(991) 69.0(78) 66.2 (917) 61.1(69) NE 4.5(1338) 4.3(74) 49.0(521) 33.3(23) 67.8(906) 82.4(61) 62.0 (829) 62.1(46) NW 0.9(253) 7.0(121) 55.5(81) 56.1(60) 63.2(160) 85.1(103) 39.5 (100) 76.9(93) All LHINs 100(29653) 100(1719) 60.2(14811) 39.7(537) 71.6(21245) 73.5 (1263) 63.9(18959) 55.2(949) * Erie St Clair, South West, Waterloo-Wellington, Hamilton Niagara Haldimand Brant, Central West, Mississauga-Halton, Toronto Central, Central, Central East, South east, Champlain, North Simco Muskoka, North East, North West (See Appendix G) - suppressed due to small sample size 35
50 Table 4: Range and SD of scale scores for CCAC(RC) and No CCAC(SH) clients, by LHIN. Variability Across LHINs Scale Scores Range of Scores Mean (SD) Lowest proportion (%) Highest proportion (%) CCAC(RC) No CCAC (SH) CCAC(RC) No CCAC (SH) CCAC(RC) No CCAC (SH) CPS Intact (0) (4.6) 65.6(10.1) Moderate to high impairment (3+) (3.5) 4.9(5.0) CHESS No Instability (0) (5.6) 46.2(9.8) Moderate to high instability (3+) (4.3) 6.3(4.4) ADL Hierarchy ADL hierarchy (0) 38.5 N/A 60.5 N/A 51.6(5.5) N/A ADL hierarchy (3+) 15.0 N/A 25.6 N/A 18.4(2.9) N/A SRI Independent (0) (5.0) 57.7(17.4) IADL Capacity IADL capacity (0-3) (5.7) 59.1(21.4) IADL capacity (6) (3.7) 3.1(1.6) MAPLe Low (1) (4.4) 63.9(21.1) Very high (5) (2.6) 2.6(2.7) DRS No depressive symptoms(0) (3.0) 77.5(10.1) Possible depression (3+) (2.1) 8.4(5.7) Pain No pain (0) (4.0) 43.9(13.2) Daily excruciating pain (3) (1.0) 14.8(9.9) 36
51 2.3.3 Clinical Assessment Protocols (CAPs) The Clinical Assessment Protocols (CAPs) were developed by interrai to identify area of risk and to support care plan development. This section presented findings from the new CAPs develop in 2007 as part of an interrai international collaboration. The CAPs were developed using evidence from the literature, best practice guidelines, expert opinions, and extensive analysis of international data holdings. Twenty-seven CAPs were developed for use in multiple care settings. Twenty-five can be applied to home care and/or SH and will be explored further in this chapter. Some CAPs are either triggered or not (binary CAPs), while others may be triggered to prevent decline or to facilitate improvement (multilevel CAPs). Clients who trigger a CAP to facilitate improvement may have experienced an acute episode but have the potential to improve with an appropriate care plan and support. Clients who trigger a CAP to prevent decline may be well today but be at risk for declining in the future and a care plan can be put in place to help prevent this potential decline. Table 5 presents data for 14 CAPs. These are the CAPs that may be triggered for both the CCAC (RC) and the No-CCAC(SH) groups. The proportion of clients who trigger each CAP is shown. Data for the CCAC(RC) and No-CCAC(SH) groups are presented separately for the purpose of comparison. 37
52 Table 5: Proportion of clients who trigger each CAP among both those who receive CCAC services in their residential care setting (including SH) and SH client who do not receive CCAC services. Percentage of clients who triggered the CAP CCAC(RC) No CCAC(SH) Binary-level CAPs Activities Social Relationships IADL Informal Support Physical Activity Promotion Appropriate Medications Cardio-Respiratory Percentage of clients who triggered The CAP (level 1) Percentage of clients who triggered The CAP (level 2) CCAC(RC) No CCAC(SH) CCAC(RC) No CCAC(SH) Multi-level CAPs Abusive Relationships Dehydration Mood Urinary Incontinence Communication Fall Pain Cognitive Decline All differences are significant at p<
53 The 7 CAPs with binary trigger levels, are presented in the first half of Table 5, all difference were found to be statistically significant (p<.0001). The CCAC(RC) group has a higher proportion of clients than the No-CCAC(SH) group that triggers the IADL CAP (35.0% vs. 21.0%), the Physical Activity Promotion CAP (66.2% vs. 39.0%) and the Appropriate Medications CAP (39.2% vs. 9.2%). The IADL CAP is triggered for persons who have the ability and desire to become more independent in their IADL. The Physical Activity Promotion CAP identifies clients who currently engage in little physical activity but have the desire and ability to do more. The Appropriate Medications CAP is triggered for clients who take more than 9 medications. The No-CCAC(SH) group has a higher proportion of clients than the CCAC(RC) group that triggers the Activities CAP(13.4% vs. 9.0%), Social Relationships CAP (36.6% vs. 15.1%), Informal Support CAP (66.2% vs. 36.0%) and Cardio-Respiratory CAP (57.2% vs. 31.9%). The Activities CAP is triggered for clients who have withdrawn from daily activities or are not at ease in social situations. The Social Relationships CAP is triggered for clients who are distressed about being lonely. The Informal Support CAP is triggered for clients who have some impairment in IADLs and also lack an informal caregiver or spend a lot of time alone. The Cardio-Respiratory CAP reflects a high prevalence of dizziness and shortness of breath. The lower half of Table 5 shows the percentage of clients who trigger the multi-level CAPs. These 8 CAPs may be triggered at one of two levels. For example, some CAPs may 39
54 be triggered at a low or high risk level. Others may be triggered to facilitate improvement or to prevent decline (see Appendix E for details). The No-CCAC(SH) group has a higher proportion of clients than the CCAC(RC) group that triggers the Abusive Relationships CAP (5.8% vs. 0.9% at high risk) and the Dehydration CAP (13.5% vs. 0.8% at high risk). The Abusive Relationships CAP identifies persons in a neglectful or abusive relationship or persons at risk of being in such a relationship. This CAP is rarely triggered, and often reflects high levels of conflict with family members rather than actual current abuse or mistreatment. The Dehydration CAP is rarely triggered, and often reflects inadequate fluid intake and weight loss. The CCAC(RC) group has a higher proportion of clients than the No-CCAC(SH) group that trigger the Mood and Urinary Incontinence CAPs at both levels of risk. The Mood CAP is based on the DRS and is triggered by a higher proportion of CCAC(RC) compared with No-CCAC(SH) clients (22.4% vs.14.1% at low risk) clients reflecting possible levels of depression. The Urinary Incontinence CAP is a four level CAP. A client may fall into the not-triggered group if they are continent or if they are assessed to have severe cognitive impairments. The trigger groups include clients at risk for further decline and clients who may be able to improve their level of continence with care. The CCAC(RC) and No-CCAC(SH) groups have a similar proportion of clients who trigger the Communication CAP and Falls CAP at level 1. A level 1 trigger indicates the potential to improve communication skills, and medium risk for falls based on one past fall, respectively. At level 2, the CCAC(RC) have a much higher proportion who trigger these 40
55 CAPs (21.1% vs. 5.3% for the Communication CAP, and 18.5% vs. 5.3% for the Fall CAP). Persons, who trigger the Communication CAP at level 2, are impaired in their cognitive abilities and those for whom we aim to prevent further decline. The Falls CAP reflects risk of falls based on prior falls. Multiple falls are more common among the CCAC(RC) clients reflected in a higher proportion triggering the CAP at level 2. Mild or moderate daily pain is more common among the CCAC(RC) clients as compared with the No-CCAC(SH) clients (31.7% vs. 19.2%). However, horrible excruciating pain, whether daily or not, is more common among the No-CCAC(SH) group. The Cognitive Loss CAP is triggered to monitor for risk of decline among most (90.1%) of the No-CCAC(SH) clients. This reflects their low CPS scores and therefore a risk of these scores increasing indicating cognitive loss. The CCAC(RC) group is more likely to have other diagnoses/conditions that increase the likelihood of triggering the CAP to prevent decline, for example, Dementia or a worsening of cognitive skills over the previous 90 days. In addition to the CAPs that can be calculated for both the CCAC(RC) and the No- CCAC(SH) groups, there are 3 binary-level and 5 multi-level CAPs that can only be calculated for the CCAC(RC) group. The proportions of CCAC(RC) clients who trigger the binary-level CAPs are as follows: Delirium (3.3%), Home Environment Optimization (3.3%), and Risk for Institutionalization (51.3%). The proportions who trigger the multilevel CAPs at a level 1 and level 2 respectively are as follows: Feeding Tube (0.2%, 0.3%), Bowel Conditions (5.0%, 9.6%), Behaviour (11.1%, 4.3%), and ADL (16.5%,31.6%). Less 41
56 than 6.0% of CCAC(RC) clients trigger the Pressure Ulcer CAP. The Addictions CAP and Prevention CAP may be calculated for the No-CCAC(SH) group only. The Prevention CAP is triggered by most clients (97.8%) indicating the need for one or more preventive health care measures such as a flu shot. About one in ten (9.9%) trigger the Addictions CAP. Figure 2 shows the number of CAPs, of the 16 available, that were triggered by the No-CCAC(SH) clients. The number triggered ranged from 1 to 13, no clients triggered zero CAPs. The majority of No-CCAC (SH) clients (61.9%) triggered between 4 and 7 CAPs. Figure 3 shows the number of CAPs, of the 23 available, that were triggered by CCAC(RC) clients. The number triggered ranged from 1 to 18, again, no client triggered zero CAPs. The majority of CCAC(RC) clients (55.2%) triggered between 5 and 8 CAPs. Figure 4 and Figure 5 compare the number of CAPs triggered by the CCAC(RC) group with the number of CAPs triggered by the No-CCAC(SH) group. Figure 4 defines a CAP as having been triggered whether it was triggered at a low or high risk, or whether it was triggered to prevent decline or to facilitate improvement. Figure 5 also defines a CAP as having been triggered whether it was triggered at a low or high risk, but for CAPs that may be triggered to either prevent decline or to facilitate improvement, only those who trigger to facilitate improvement contribute to the trigger group. No client triggered zero CAPs. Figure 4 presents the CAPs as binary (i.e. either triggered or not) which is accurate and appropriate for the binary level CAPs and for the multi-level CAPs that are triggered a low or high risk. However, Figure 5 is a more accurate depiction of the CAPs related to 42
57 impairment because it excludes persons who are well today but may decline in the future (those who trigger the CAP to prevent decline). 43
58 % of clients Figure 2: Number of CAPs triggered by supportive housing clients not receiving CCAC services (No-CCAC(SH) clients) Number of CAPs triggered by No-CCAC(SH) Clients Number of CAPs Triggered 44
59 % of clients Figure 3: Number of CAPs triggered by CCAC clients in residential care settings including supportive housing (CCAC(RC) clients) Number of CAPs triggered by CCAC(RC) clients Number of CAPs Triggered 45
60 These clients are triggering the CAP for a qualitatively different reason than are those who trigger the CAP to facilitate improvement. The differences between the figures reflect the higher proportion of the No-CCAC(SH) group who trigger the multi-level CAPs to prevent decline Disease Diagnoses This section will provide data on the prevalence of disease diagnoses among CCAC(RC) and No-CCAC(SH) clients. Section J1 on the RAI HC instrument provides a list of common diseases and a place for the assessor to indicate whether the disease is absent, present and being treated / monitored or present but not being treated/monitored. The look back period is 90 days or since the last assessment. Section I1 on the interrai CHA also provides a list of common diseases. The response set in addition to those provided in the RAI HC also has an option of the diagnosis being the primary diagnosis. Due to the different response sets between the assessment instruments, Table 6 provides a comparison between disease prevalence in terms of being present or not (all significant difference at p<.0001). Hypertension, arthritis and osteoporosis are common conditions associated with aging. These conditions are part of the list of diseases on the RAI HC but not on the interrai CHA. In order to provide a No-CCAC(SH) prevalence estimate of these three conditions, the other diagnoses section of the interrai CHA was searched. This section is provided for assessors to manually enter diseases that do not appear on the I1 disease diagnosis list but are present in their clients. 46
61 % of clients Figure 4: Number of CAPs triggered by the CCAC(RC) group compared with the No- CCAC(SH) group including CAPs intended to prevent decline Number of CAPs triggered by CCAC(RC) vs. No-CCAC(SH) CCAC(RC) No-CCAC(SH) Number of CAPs Triggered 47
62 % of clients Figure 5: Number of CAPs triggered by the CCAC(RC) group compared with the No- CCAC(SH) group excluding CAPs intended to prevent decline 30 Number of CAPs triggered by CCAC(RC) vs. No-CCAC(SH) CCAC(RC) No-CCAC(SH) Number of CAPs triggered 48
63 Table 6: Prevalence of disease diagnoses for CCAC(RC) and No-CCAC(SH) clients CCAC(RC) No-CCAC Diagnosis Hypertension * Arthritis * Other Dementias Osteoporosis * Stroke Diabetes COPD Congestive Heart Failure Alzheimer s Disease Hip Fracture All differences are significant at p<.0001 *Not listed diagnoses on interrai CHA in section I1, but manually entered in section I2. 49
64 Chi-square analysis yielded statistically significant differences (p<0.0001) for all disease prevalence between CCAC(RC) and No-CCAC(SH) clients. With the exception of diabetes, all other diseases listed in Table 6 have a higher prevalence among CCAC(RC) client compared with No-CCAC(SH) clients. The lower prevalence of hypertension, arthritis and osteoporosis among No-CCAC(SH) clients may be due to their exclusion in the list of common diagnoses in the interrai CHA but their inclusion on the RAI HC. Close to half of CCAC(RC) clients and about 1 in 5 No-CCAC(SH) clients have hypertension or arthritis. Diabetes in the most prevalent condition among No-CCAC(SH) clients (23.4%). Hip fractures are very rare among No-CCAC(SH) clients (less than 1.0%) but more common among CCAC(RC) clients (6.1%). 2.4 Discussion The primary purpose of this chapter was to provide a comprehensive descriptive profile of the socio-demographic and clinical characteristics (needs) of SH clients in Ontario. This was a necessary first step in beginning to explore an important and rapidly emerging part of the health care continuum. In order for SH to help meet the Aging at Home MOHLTC goals, it is imperative that researchers and clinicians have a clear picture of the needs of those who currently reside in SH. Only once this has been achieved, can an informed discussion begin about the resources required to support these clients and therefore the appropriateness of SH to meet their needs. 50
65 The likelihood that a SH client will be able to remain in the community and avoid, or at least delay LTC admission, is in part a function of resource availability. Currently in Ontario, the majority of SH clients receive their care from a combination of CSAs, and onsite services provided within SH buildings. The majority of SH clients have been widowed and are unable to manage their own IADLs such as shopping, transportation, meal preparation and housework. This inability to independently manage IADLs coupled with the loss of a major resource (the spouse), often results in the need to relocate to SH. As such, informal support may play a smaller role in the care of seniors who reside in a SH unit as compared with person residing at home. The majority of current SH clients are cognitively intact facilitating client participation in the development of care plans. One key finding in this chapter was the presence of a small sub-population of SH clients who receive the majority of their care from a CCAC. These clients are significantly more impaired than the more typical SH client. CCAC (RC) clients had both higher CPS scores and more commonly triggered the cognitive decline CAP. This decline in cognitive functioning is an important consideration since SH is not currently resourced to care for person with moderate to severe cognitive impairment. The CCAC(RC) clients also had a higher proportion of high/very high MAPLe scores, indicating a higher risk for institutionalization. Other key differences were higher level of impairment in IADLs, especially meals, shopping and housework, and more dependence in all ADLs, especially bathing. The on-site SH services that are currently available may not be diverse enough or 51
66 intense enough to keep CCAC(RC) clients out of LTC. The CCAC has a clear role in assisting the SH team to help keep these more impaired clients out of LTC for as long as possible. More ADL support may be required to support these high risk clients, as well as either the provision of IADL support, or a referral to a community support agency to provide meals and housework services. Without this targeted care, many SH clients who receive CCAC support, especially those with high/very high MAPLe scores will likely be institutionalized. Comparative analysis across LHINs, revealed regional variability in the characteristics and needs of SH clients in Ontario, both within the CCAC(RC) and the No- CCAC(SH) sub-population. The MOHLTC aims to provide equity across Ontario in terms of service availability. However, some LHINs have many SH units while others have few or none at all (Health Data Branch Report, MOHLTC, 2005). This may result in a person needing to relocate in order to access the service they require. Moreover, regional variability in the current characteristics and needs of SH clients, may be in part, a result of differing eligibility and discharge criteria between LHINs. This may also threaten equity in that an individual with moderate cognitive impairment, for example, may be eligible for admittance to a SH unit in one LHIN, but may be ineligible in another. Similarly, clients with comparable clinical characteristics who reside in different LHINs may experience different outcomes in terms of discharge to LTC. Discharge criteria within LHINs, as well the available resources in the unit/building, may result in very different client trajectories. Differences in the definition of supportive housing between 52
67 LHINs makes benchmarking difficult. SH is a relatively new addition to the health care continuum and LHINs would benefit from benchmarking their practices by observing successes in other LHINs. One common assessment system would facilitate this process allowing for apples to apples comparisons. The SH care team and where applicable, the CCAC, has a role to play in not only identifying current care needs, but also anticipating future care needs. The Clinical Assessment Protocols (CAPs) provide an indication of these red flags domains and also provide the care team with some insight into the degree of risk or potential to improve. The majority of SH clients are able to direct their own care and clinicians should engage the client in a conversation about the triggered CAPs and identify the client s priorities, especially when several CAPs have been triggered. The SH care teams may be better equipped to address some CAPs than others. A referral may be needed or the CCAC may be able to assist. For example a SH client who triggers the Prevention CAP may simply require transportation to their physician to get their yearly flu shot, while a client who triggers the Pain Cap may need a referral to an off-site pain specialist. interrai s newly developed CAPs were designed with higher specificity than the older CAPs. This results in fewer CAPs being triggered for each individual, but also necessities some form of follow-up to occur for each CAPs that is triggered. This follow-up may be a treatment plan, a referral, or a discussion with the client about their priorities. In addition, clinicians may choose to address high risk triggers prior to low risk triggers, or CAPs triggered to facilitate improvement prior to those triggered to prevent 53
68 decline. These multi-level CAPs help the care team to consider health trajectories and set priorities in partnership with the client. Priorities to address in a SH population should include variables associated with a decline in quality of life such as pain, incontinence and social relationships as well as variables that have been shown to increase the likelihood of institutionalization such as the MAPLe algorithm and a decline in cognitive functioning. Another aspect of anticipating future care needs is identifying disease prevalence and ensuring adequate care is being provided. For chronic disease where deterioration is expected, such as Dementia, care may be able to be provided in the SH unit, with the help of the CCAC, for a period of time. Eventually however, the individual may require more care than is able to be provided in the SH unit. At this time, a discharge to LTC may be appropriate and in the best interest of the individual. Other conditions, such a hypertension or diabetes, may be monitored to help minimize the risk of decline or a sudden episode requiring hospitalization. Supportive housing is an emerging part of the heath care continuum. This chapter has provided a comprehensive description of the needs of SH clients in Ontario. Some challenges have been identified including defining eligibility and discharge criteria for SH, providing quality care in SH to a diverse population, the role of CCACs in SH, and the need for equity across the Province. This is the first step towards beginning the discussion of the role of SH and the clients that it serves in the continuum of care in Ontario. The needs of SH clients are very diverse. Many SH client have very light care needs and may be residing in a SH unit due to resource availability (no informal support) more 54
69 than due to complexity of care needs. A small but very impaired sub-population with higher care needs was also identified. Resources available to care for SH clients include CCAC, CSA and on-site services. In order to ensure that a balance is reached between care needs and resources available to meet those needs, a partnership must be reached between CCACs and SH. CCAC support is the reason that many SH clients can remain in their SH units rather than be discharged to LTC. Moreover, in some LHINs, CCACs have begun to play a role in determining eligibility for SH, as they already do for LTC in Ontario. Every effort should be made to strengthen the relationship between community care sectors. This will promote client-centered care and reduce burden for both the care provider and recipient. Taking care to consider privacy and confidentially, client information may be able to be shared among care providers and care sectors providing care to the same individual. Chapter 2 provided a comprehensive description of the needs of SH clients and explored the various resources available to support these clients. SH currently provides care to both a very light care population with few cognitive or functional impairments, and a smaller sub-population with very complex care needs. On-site SH services and CSA assistance are able to provide care to the majority of SH clients. However, it is clear that as SH sites are resourced today, CCACs have a critical role to play within SH to support the small sub-population of SH client with high resource intensive needs. Chapter 3 will explore how care placement decisions are currently being made and provide guidance as to how they should be made in terms of eligibly for and discharge from SH. 55
70 Determining for whom SH is most appropriate is a matter of ensuring that the right clients are admitted and the right clients are discharged, as needed. Persons most appropriate for SH may be residing in another care settings such as at home or in a LTC facility. Chapter 3 will compare and contrast the needs of SH clients with the needs of persons in these other care settings. Opportunities to relocate seniors will be explored and the role of SH in the continuum of care will be clarified. 56
71 CHAPTER 3: Determining the role of supportive housing in the continuum of care: The Mississauga-Halton LHIN study of appropriate service environments. This chapter will address the second research question using interrai data to compare the needs of SH clients with the needs of persons receiving care in a LTC facility, a CCC hospital/unit, or at home. Care placement decisions are often made to keep seniors in a familiar region close to family and friends, where possible. Therefore, many transitions take place within the same LHIN. This chapter will present data from persons residing in the Mississauga-Halton (MH) LHIN. interrai CHA data collected from SH clients as part of a pilot project with the MH LHIN, and secondary data from home care clients (RAI HC) and both LTC and CCC clients (RAI 2.0) will also be used to address the research questions in this chapter. In order to determine for whom SH is most appropriate, this chapter will address care placement decisions using a subjective Staff Rating Form that was developed for the above-mentioned pilot project, as well as a newly developed decision support algorithm. This chapter will highlight the importance of making evidence-informed care placement decisions and will provide a support instrument to assist clinicians in this decision making. 57
72 3.1 Introduction Managing the continuum of care involves persons being placed in the most appropriate care setting to meet their needs. Identifying the unique combination of care needs and resource availability required to match people with their most appropriate care setting is a challenging task (Pine & Pine, 2002). It is particularly challenging to determine for whom a care setting is most appropriate when that care setting lacks standardized data (Hawes and Phillips, 2007); the consequence of which has been arbitrary placement decisions for SH. The needs of SH clients must also be monitored over time to ensure the continued appropriateness of their placement. Discharge to a more intensive care setting may be warranted if the resources available can no longer meet the client s care needs (e.g. Kelsey, Laditka, & Laditka, 2010). Similarly, due to arbitrary decision making practices, persons with very light care needs may reside in SH units when they could be cared for by a combination of formal and informal support in their own homes. Effectively managing the continuum of care involves evidence-informed care placement decisions, and transitions to more appropriate care settings as required (Lavis et al.,2005). SH is a recent addition to the continuum of care and therefore a new placement option for care managers (Jones, 2007). Therefore, there may be seniors residing at home or in an LTC facility who are eligible for care in an SH unit but who have yet to be transitioned there. Persons with high-resource intensive care needs may be residing at home since they may be unaware of the availability of formal care, or unwilling to accept care. Alternatively, they may be living with family who are at a high risk for caregiver distress which may lead 58
73 to caregiver inability to continue providing care (Spillman & Long, 2009; Knight, Lutzky, & Macofsky-Urban, 1993). Similarly, there are seniors residing in LTC facilities who were placed there due to care needs that could no longer be met in the community and who perhaps lacked the financial means to pay for out-of-pocket care. This premature placement in LTC may threaten the quality of life and well-being of the individual while blocking beds for those with more complex care need (MOHLTC, 2007b). When determining for whom supportive housing (or home care or long term care) is most appropriate, the clinical care needs of the client must be considered in the context of the services and care option available within the supportive housing setting. There needs to be a fit between the care need of the individual and the resources available in any given setting to meet those needs (Zimmerman et al., 2002). For example, supportive housing admits persons who are able to direct their own care, typically meaning no more than mild cognitive impairment (Golant, 2004). However, if extra resources are made available, persons with dementia may be able to be cared for in a supportive housing setting. Koptez (2000) compared the characteristics of persons with dementia who were residing in a dementia-specialized assisted living facility with person with dementia residing at home or in a nursing home. Persons with dementia who lived at home were younger and less cognitively impaired that those residing in assisted living or a nursing home. They were also less likely to wander or show aggressive behavior such as physical or verbal abuse. Comorbities were more common among nursing home client with dementia. As persons with dementia declined, most moved from the assisted living home to a nursing home due to increasing care needs, cognitive decline, falls, and wandering; need that could no longer be met in the assisted living facility. Persons with dementia 59
74 who had medical instability (Sloan et al., 2005), resisted care (Gruber-Baldini, Boustani, & Sloane et al., 2004) or had challenging behaviour leading to caregiver distress (Yaffe et al., 2002) were also difficult to care for outside of a nursing home. The Centre for Excellence in Assisted Living presented finding from the national Nursing Home Survey (NNHS, 2004) that compared the demographic and clinical characteristics of assisted living and nursing home clients in the USA. The demographic characteristics of the two populations were very similar in terms of mean age, gender distribution and marital status. Heart disease and dementia were more common in nursing homes, but the proportion of persons with many other medical conditions such as stroke, diabetes or COPD were similar. Mental health conditions such as schizophrenia and bipolar disorders were more common among persons living in nursing homes, although rates of depression were similar. Assisted living clients were better able to manage their daily care requiring less assistance than nursing home client with activities of daily living such as bathing, dressing, toileting, transferring, or eating. Generally speaking persons in nursing homes could not take care of themselves because of: a physical, emotional, or mental condition, functional dependence in daily tasks such as toileting or eating, the absence of a caregiver or presence of behaviors that were difficult for family to manage such as wandering, or the need for extensive medical care as would require daily attention or monitoring by an RN (Rose, de Benedictis, Russsell et al., 2008). Although persons who reside in long-term care facilities tend to be a more impaired population than those in supportive housing, there will be cases where a long term care 60
75 clients may have lighter care needs than a supportive housing client. Some overlap may be appropriate, for example, a long term care resident may be less impaired than a supportive housing client in one domain, but more impaired in another. In communities without supportive housing, lighter care clients may be prematurely admitted to a long term care facility if their needs can no longer be met at home. This may occur for example when a family caregiver passes away. Inappropriate care placement decisions may also occur due to lenient admission and discharge criteria. Some care placement decisions can be very difficult depending on the needs of the senior. A severally impaired senior without an informal support network may require nursing home placement, while a cognitively and functionally intact senior with a spouse and 2 children may be able to be cared for at home. Decision making around care setting placement is further complicated by persons with care needs that place them at the margins of care (Challis & Hughes, 2002; Figure 6). Margins of care exist between many care settings, and this figure somewhat simplifies the challenges of placing these clients. Persons at the margin of care may be able to have their care needs met in one or more care settings. For example, Figure 6 places SH between home care and LTC and depicts a margin of care between HC and SH and between SH and LTC. This indicates that the most impaired HC client and least impaired SH client may have very similar care needs and that the most impaired SH client and the least impaired LTC client may also share similar profiles. From a policy perspective, resource availability may be of particular importance to margin of care clients. Persons at the margin of care between HC and SH may benefit from an increase in formal and/or informal support in order to prevent 61
76 the need to transition to SH. Persons at the margin of care between SH and LTC may need an increase in resources in order to prevent the need to transition to LTC. This chapter will explore decision making practices in the MH LHIN and also provide a decision support algorithm to facilitate evidence informed decisions making in the future. Figure 6 represents a schematic of what policy makes (and others) may believe to be the relationship of supportive housing with other sectors. They may believe that supportive housing provides care to a more impaired population than the CCAC system and to a less impaired population than those cared for in a LTC home. They may also be thinking of movement through the continuum of care as occurring in this linear fashion from home with CCAC support to SH and then to LTC. These assumptions will be explored in this chapter using data from the continuum of care in the Mississauga-Halton LHIN. 62

77 Figure 6: Schematic representation of the continuum of care Home without Services Home with CSA or CCAC Services Supportive Housing Long Term Care Complex Continuing Care Margins of care 3.2 Methods Samples Supportive Housing Data were collected from 11 of the 12 supportive housing sites in the MH LHIN: Participation House, Ontario March of Dimes, Links2Care, Halton Independent Living, Peel Senior Link, India Rainbow Community Services, Halton Region Supportive Housing, Oakville Senior Citizens Residence, Cheshire Homes Streetsville, Nucleus Independent Living, and Forum Italia. A final sample size of 367 interrai CHA assessments were completed with SH clients. Of the 367 clients who were assessed with the interrai CHA, 255 triggered the need for a Functional Supplement, and 49 triggered the need for a Mental Health Supplement. About one third (108) did not trigger the need for either supplement and therefore completed only the core interrai CHA assessment. 63
78 Home Care Data were obtained from the MH LHIN CCAC, including current long stay home care clients residing in the community (n=2,267), CCAC clients in a hospital setting being assessed to determine discharge placement (n=172), and CCAC clients residing in the community on a wait list for LTC (n=129). In addition, RAI-HC data collected from a healthy sample of 357 seniors from Newfoundland were used to validate the decision support algorithm Long Term Care Data were obtained from six early adopter LTC sites (n=832). The RAI 2.0 was not mandated for use in LTC at the time of this study, so these six sites chose to voluntarily collect RAI 2.0 data as part of their normal clinical practice. The six sites that provided data were: Erin Mills Lodge Nursing Home, Labdara Lithuanian Nursing Home, Specialty Care Mississauga, Villa Forum Nursing Home, Yee Hong Centre for Geriatric Care, and Leisureworld Caregiving Centre Streetsville Complex Continuing Care Data were obtained from all three CCC sites in the MH LHIN all of which collect RAI 2.0 data as part of normal clinical practice: Halton Healthcare Services, Credit Valley Hospital, and Trillium Health Centre provide a total sample size of
79 3.2.2 Measures Measures to be used in this chapter are the interrai CHA data collected from seniors residing in SH in the MH LHIN, as well as home care data collected using the RAI HC and both LTC and CCC data collected using the RAI 2.0. In addition to the interrai assessment instruments, a Staff Rating Form was developed to elicit input from staff members about the appropriateness of each client s current care setting. The Staff Rating Form is described in detail in section and a copy provided in (Appendix B) Staff Rating Form The purpose of the Staff Rating Form is to examine the appropriate care setting for the sampled individuals, based on staff member`s subjective assessments. There is no goldstandard measure for this type of assessment and therefore this form was developed, in consultation with clinicians from all four care settings in the MH LHIN, to obtain convergent opinions on care placement practice and decisions making. Staff members, identified by case managers to be familiar with the SH client, were asked to indicate the client s current care setting and then to indicate the most appropriate care setting for that person. Most appropriate setting could be the client s current setting or either a more or less intensive setting. Staff members were asked to then speculate as to what would be the most appropriate care setting for that client in one month s time, and in six month s time, based in their professional opinion. Staff members were given a list of barriers to the client 65
80 transitioning to that most appropriate care setting and asked to select as many barriers as were relevant. A list of support services that might be required to transition to a less intensive care setting, were provided and staff members were asked to select any that were relevant as well as to estimate the hours/weeks of that service that would be required Data Collection CCACs and CCC hospitals/units collect RAI HC and RAI 2.0 data, respectively, as part of normal clinical practice. The six LTC facilities that participated in this project also collect RAI 2.0 data as part of normal clinical practice, although not yet mandated to do so. The University of Waterloo receives a regular cut of an anonymized version (all identifier removed) of all RAI HC and the RAI 2.0 data through a data sharing agreement between the Canadian Institutes for Health Information (CIHI), and interrai, represented by researcher at the University of Waterloo. Since the interrai CHA is not mandated for use in SH, the UW research team provided training to staff members and ongoing support in collecting primary data at SH sites in the MH LHIN. In addition to collecting RAI data, a one page Staff Rating Form was also completed by staff members that were identified as being familiar with the client. Training and ongoing support was provided to clinicians in all care settings as to how to complete the Staff Rating Form. A two page instruction sheet was also provided. Staff members were asked to complete the Staff Rating Form as close in time to the client s interrai assessment as possible. For the purposes of this project, the University of Waterloo research team 66
81 requested an extra cut of the interrai data collected as close in time as possible to the Staff Rating Form, to be sent to the University from CCAC, LTC, and CCC sites. Paper copies of the interrai CHA and the Staff Rating Form were sent to all SH sites. The Staff Rating Form was sent to all LTC, CCC and the MH LHIN CCAC. An information letter was provided for all SH clients and informed consent to participate in the study obtained. It was unnecessary to complete individual informed consent from HC, LTC, and CCC clients because data were collected as part of normal clinical practice and a data sharing agreement existing between the sites, CIHI and the University of Waterloo through Dr. John P. Hirdes and interrai. Moreover, the completion of the Staff Rating Form did not require client participation, but rather relied on the knowledge of staff members about the needs of their client. Ethics clearance was obtained through the University of Waterloo Research Ethics Board and a copy provided to all sites who participated in the study. Paper copies of the interrai CHA were scanned into a computer using Teleform and then secured in locked cabinets on a secure floor of the University of Waterloo. The data from CCACs, LTC, and CCC were sent to the University electronically. Electronic data were stored on a secure server and password protected. All data obtained for this study were de-identified through the removal of personal identifiers before being sent to the University of Waterloo. 67
82 Research Objectives In collaboration with clinicians in the MH LHIN the following three research objectives were developed: 1. To describe the profiles of the clients currently residing in SH, HC, LTC and CCC. 2. To examine the appropriate service environment for the sampled individuals. 3. To develop a decision support algorithm to support clinicians in care placement decisions. 3.3 Results Descriptive Statistics This section will meet the first project objective by describing the profiles of the clients currently residing in SH, HC, LTC and CCC in the Mississauga Halton LHIN. Table 7 provides information on: demographic characteristics, living arrangements, cognitive status, communication, sensory measures, mood and behaviour, psychosocial measures, ADLs, IADLs, medical diagnoses, health conditions, lifestyle, preventive health measures, use of the hospital and emergency department, and scale scores. The columns in Table 7 present data collected using the interrai CHA in SH units. CHA All provides the profile of all assessed SH clients. CHA Only provides the profile of SH clients who did not trigger the need for either supplement to be completed. CHA Func. and CHA MH are the profiles of person who had a functional supplement or a 68
83 mental health supplement completed, respectively. Home care data are presented for long stay home care clients residing in the community (CCAC comm.), persons in the community on the wait lit for LTC (CCAC Wt. Lst.) and CCAC clients residing in a hospital (CCAC Hosp.). LTC and CCC data are also shown. N/A indicates that an item cannot be calculated because it was unavailable on that particular interrai assessment. Where response sets were not identical across instruments, minor adaptations were carefully made in order to be able to compare across care settings Descriptive Statistics, by care setting Table 7 shows descriptive statistics for SH clients with CCAC, LTC and CCC descriptive data provided for comparison purposes. These tables also provide data for subpopulations within SH. The CHA only column represents the lighter care SH clients, those who did not trigger the need for either supplement. This group is 78.7 years of age on average; most are female (79.6%), not married (94.6%) and speak English as their primary language (83.3%). They tend to live alone (92.6%), have no cognitive impairment (92.6%), and enjoy psychosocial activities. Most are independent in ADL, with 22.2% needing assistance with bathing. With the exception of housework and shopping, most are independent in their IADLs as well. Medical conditions include Diabetes (25.0%), Cancer (15.7%), and CVA (11.1%). About one third have daily pain and one in five have 69
84 experienced a recent fall. One in ten (10.2%) had at least one recent admission to hospital and 11.1% had at least one emergency room visit in the past 90 days. In comparison with the CHA only group, SH clients who triggered the need for a functional supplement (CHA+ Func) are a younger population on average (mean age=60.0), 65.9% are female, 16.9% married, and 72.9% speak English as their primary language. Fewer live alone (67.8%), about one third (34.9%) have borderline to mild cognitive impairment, almost all (92.9%) need assistance with bathing, half also need assistance with personal hygiene. 70
85 Table 7: Socio-demographic and clinical characteristics of participants in the Mississauga- Halton LHIN project, by care setting CHA Only CHA+ Func. CHA+ MH CHA ALL CCAC Wt. Lst. CCAC Com. CCAC Hosp. LTC CCC SAMPLE SIZE Demographics Age : Less than or greater Gender: Female Marital Status: Married Language - English N/A - French N/A - Other N/A Living Situation Lives alone N/A N/A Lives in private home/apartment/rented room N/A N/A Resided in Nursing Home last 5 years N/A N/A Cognitive Status Short Term Memory - Impaired Dependent For Decision-Making Cognitive Decline Prev. 90 Days *CPS Communication Difficulty Making Self Understood Difficulty Understanding Others Sensory Any Visual Impairment Any Hearing Impairment Visual and Hearing Impairment Mood and Behavioural Patterns Withdrawal from activities of interest Reduced Social Interaction Depression Rating Scale Self-report: - Little interest or pleasure N/A N/A N/A N/A N/A - Anxious, restless, uneasy N/A N/A N/A N/A N/A - Sad, depressed, hopeless N/A N/A N/A N/A N/A Psychosocial Strengths: Participation in activities of interest N/A N/A N/A N/A N/A Visit with social relation / family N/A N/A N/A Strong and Supportive Family Relationship N/A N/A N/A N/A N/A Other contact (telephone/ ) N/A N/A N/A Limitations (in last 3 days): Openly expresses conflict/anger w family/friends Fearful of family member/acquaintance N/A N/A Neglected, abused, mistreated N/A N/A Alone 8 hours or more during day N/A N/A N/A N/A N/A 71
86 CHA Only CHA+ Func. CHA+ MH CHA ALL CCAC Wt Lst CCAC Com CCAC Hosp. LTC CCC SAMPLE SIZE *ADL (NOT independent, including set-up help) Locomotion In Home Personal hygiene Bathing ADL Functional Decline Self Reliance Index: Not self reliant *IADL Performance (NOT independent, including set-up help) Meal Preparation N/A N/A N/A Ordinary Housework N/A N/A N/A Managing Finances N/A N/A N/A Managing Medications N/A N/A N/A Phone Use N/A N/A N/A Shopping N/A N/A N/A Transportation N/A N/A N/A IADL Summary N/A N/A N/A N/A N/A N/A Physical Activity Out of house/building less than every day N/A N/A Driving Drove in last 90 days N/A N/A N/A N/A N/A If drove, suggestion of stopping/limiting driving N/A N/A N/A N/A N/A Selected Diagnoses Diabetes CVA/Stroke Alzheimer s/other Dementia Emphysema/COPD/asthma Cancer Congestive Heart Failure Health Conditions 1 or more falls last 90 days Chest Pain Delusions/Hallucinations Shortness of Breath Fatigue: moderate or greater N/A N/A N/A N/A N/A Daily Pain Poor Self-Rated Health N/A N/A *CHESS Lifestyle Potential Drinking Problem N/A N/A Daily smoking N/A N/A Events.0 1+ Hospital Admits Emergency Visits *MAPLe N/A N/A *IADL=Instrumental activities of daily living, ADL=Activities of daily living, CHESS=Changes in health end-stage disease, signs and symptoms MAPLe=Method of assigning priority Levels. 72
87 IADL assistance is required in many domains, 71.0% need assistance with meals, 92.2% with housework, and 58.8% with shopping. The prevalence of health conditions and diagnoses are similar to the CHA only group. Hospital admissions (16.9%) and emergency room visits (16.1%) are more prevalent in this group. SH clients who triggered the need for a mental health supplement are different from the other groups in terms of mental health markers. For example, 65.3% have possible depression, and about half have reduced social interaction and have withdrawn from activities of interest. Many (73.5%) self-report feeling anxious, restless or uneasy, 65.3% self-report feeling sad, depressed, or hopeless. About half (51.0%) openly express anger or conflict with family or friends, 14.3% have a potential drinking problem and 20.4% smoke daily. MAPLe scores are highest in this group with 42.9% having a MAPLe score of high or very high (4 or 5). CCAC clients are much more likely to be married than SH clients (42.1% vs. 13.9%) and much less likely to live alone (20.8% vs. 74.1%). CCAC community clients show many similarities with SH functional supplement clients with a few key exceptions: a small proportion of CCAC community clients show mood and behavioral challenges, express conflict with family, or have shortness of breath. A higher proportion of CCAC community clients have ADL decline, need assistance with IADLs, have medical diagnoses, have daily pain, and a higher proportion have been admitted to hospital or visited an emergency room in the past 90 days. 73
88 The LTC population is the oldest group with a mean age of 85 years, 93.0% being 75 years of age or older. Memory impairment, cognitive impairment, ADL impairment, and visual impairment are more common than in SH or home care clients. About two thirds have a diagnosis of Dementia or Alzheimer s disease, and 80.0% of clients score a high or very high (4 or 5) on the MAPLe algorithm. CCC clients have the highest proportion of men (58.1%) of all the care settings as well as the highest proportion of persons with CVA/stroke (34.1%). Almost half (48.0%) have been admitted to a hospital in the past 90 days and 40.9% have visited the emergency room. Compared to all other care settings in the table, CCC clients have the highest proportion of clients with a MAPLe score of 4 or 5 (83.1%) Descriptive data from the Staff Rating Form, by care setting This section will meet the second project objective by examining the perceived appropriate service environment for the sampled individuals using data from the Staff Rating Form (Appendix B). Table 8 presents the descriptive data for the staff rating form, by care setting. The Staff Rating Form data are provided for SH clients, communitydwelling CCAC clients (some on the wait list for LTC), LTC clients, Acute ALC clients and CCC who have and those who have not been designated ALC, alternative level of care. Table 9 provides descriptive data, by care setting, for the support services needed for a person to make a transition to a less intensive care setting. 74
89 Table 8: Percentage distribution of staff ratings on most appropriate care settings, by care setting Underlined numbers:% of clients who are appropriately placed SAMPLE SIZE Lowest level of care that could appropriately address this person s needs TODAY (% of clients) SH CCAC Wt. Lst. CCAC LTC CCC ALC CCC Home with no services Home with community support services (excluding CCAC services) Home with home care (provided by a CCAC) Supportive housing Retirement home Group home / Mental health residence Rehabilitation hospital / unit Convalescent care in long term care home Long term care home Complex continuing care hospital/unit In-patient psychiatry Palliative care / Hospice care Acute Hospital Lowest level of care that could appropriately address this person s needs 30 DAYS from now (% of clients) Home with no services Home with community support services (excluding CCAC services) Home with home care (provided by a CCAC) Supportive housing Retirement home Group home / Mental health residence Rehabilitation hospital / unit Convalescent care in long term care home Long term care home Complex continuing care hospital/unit In-patient psychiatry Palliative care / Hospice care Lowest level of care that could appropriately address this person s needs 6 MONTHS from now (% of clients) Home with no services Home with community support services (excl. CCAC services) Home with home care (provided by a CCAC) Supportive housing Retirement home Group home / Mental health residence Rehabilitation hospital / unit Convalescent care in long term care home Long term care home Complex continuing care hospital/unit In-patient psychiatry Palliative care / Hospice care Acute Hospital Acute ALC 75
90 SH CCAC Wt. Lst. CCAC LTC CCC ALC CCC Acute ALC SAMPLE SIZE Person would be admitted in his/her current condition, to the his/her present care setting (% of clients) Yes No - requires a less intensive care setting No - requires a more intensive care setting No Response Barriers preventing the person from making a transition today to a less intensive care setting (will not add to 100%) No home to move back to Need for barrier free environment Lack of adequate informal support Financial limitations (e.g., can t afford retirement housing) Severity of ADL impairment Severity of medical problems Lack of adequate services Waiting list for needed services Severity of cognitive impairment Severity of psychiatric symptoms Lack of supportive housing units Family pressure to go into long term care Underlined numbers show percentage of clients who are appropriately placed 76
91 Table 8 presents the data collected, by care setting, on what staff perceived to be the most appropriate care placement. Staff indicated that in all four main care settings, that the majority of clients were currently placed in their most appropriate care setting (numbers underlined): in SH 80.1%, in CCAC 81.0%, in LTC 87.0% and in CCC 77.1% were appropriately placed. An additional 4.0% may be considered appropriately placed in CCC since rehabilitation occurs there. While the majority of people are believed to be appropriately placed in the setting that can best meet their need today, many are inappropriately placed in either a too intensive or not intensive enough setting to meet their needs. For example, among the 321 current SH clients, 8.1% could be at home if they had CCAC services, and 9.0% could be at home with community support services. According to staff members, 0.9% of SH clients are not having their needs met in SH and require a LTC placement. Of the clients whose most appropriate care setting is a SH unit, 80.1% are in SH currently, 2.9% are living in the community and on a wait list for LTC, 2.0% are at home receiving CCAC home care services, 1.0% are in LTC, and 1.1% are residing in an acute care hospital and have been designated as an ALC client. The second and third sections of Table 8 shows the same information as is found in the first section, but for 30 days and 6 months respectively, from the date of completion of the Staff Rating Form. This question asks staff members to consider appropriate placement of the client in the future. One month in the future, staff members indicate that fewer clients 77
92 in all care settings will be appropriately placed, 80.1% drops to 77.9% among current SH clients; six months later there is another drop to 76.9%. A clear trend emerges among CCAC clients when considering the appropriateness of their current placement in the future. Today, staff members indicated that 14.1% of current CCAC clients (home and on a wait lists) are most appropriate for LTC. However, 30 days from now this percentage increased to 26.9%, and 6 months from now 68.9% of current CCAC clients will be most appropriate for LTC. Further exploration of the characteristics of these clients revealed a clear trajectory of decline. More than half of CCAC clients, whom staff indicated were most appropriate for LTC, had experienced decline in self-sufficiency (53.9%) and/or ADL decline (60.3%) in the past 90 days. A decline in decision making (41%), worsening bladder incontinence (19.2%), a decline in social activities (35.4%) and declining mood (18.0%) were also common among these clients. Finally, this table presents the barriers to a client transitioning to a less intensive care setting. Among SH clients, their severity of medical problems and severity of ADL impairment were commonly reported barriers to transitioning home. The need for barrier free living space and cognitive impairment were also important barrier for 29.9% and 32.1% of SH clients, respectively. The second half of table 8 provides more condensed information on appropriate placement. Again, the majority (82.9%) of SH clients are appropriately placed, according to staff members. This leaves 10.9% needing a less intensive care setting and 5.9% needing a more intensive care setting. This finding will be further explored in section where logistic regression methods will be used to determine what variables predict staff members 78
93 indicating that a SH client should be in either a less intensive or a more intensive care setting. Table 10 provides a summary of the findings in the first section of table 8 with a focus on SH. The most appropriate care setting to meet the client s current need is collapsed into supportive housing, less intensive (than SH) or more intensive (than SH). The less intensive care setting category includes settings considered to be less intensive than a SH setting: home with no services, home with community support services (excluding CCAC services), and home with home care (provided by a CCAC). The supportive housing category includes: supportive housing and group home / mental health residence. The more intensive care setting category includes all settings considered to be more intensive than a SH setting: retirement home, rehabilitation hospital / unit, convalescent care in LTC, LTC, CCC, in-patient psychiatry, palliative care / hospice care, acute hospital. For persons currently residing in SH, 80.1% are appropriately placed while 17.1% need a less intensive setting such as returning home and 2.8% need a more intensive care setting such as LTC. Of those on the wait list for LTC, staff members indicated that 2.9% do not need LTC but rather would best be placed in SH. Among long stay home care clients, 2.0% would be best placed in a SH unit rather than remain in their own home. Less than 3% of current LTC clients and less than 1% of ALC CCC clients would be more appropriate for SH than for their current care setting. Only 1.1% of Acute ALC clients would be appropriately placed in SH. 79
94 3.3.2 Logistic Regression Model Predicting Staff Ratings of Appropriate Care Settings The Staff Rating Form was completed by clinicians who were identified as being familiar with the client. When staff members were asked to indicate the most appropriate setting for each client, they were not asked which RAI items or scale scores they considered when making their decision. This section will use logistic regression to determine the client characteristics that are associated with staff members decision making process around eligibility for and discharge from SH. A series of conventional binary logistic regression models were used to differentiate the subgroups of persons deemed most appropriate for home care, supportive housing, and long-term care settings. The method used here is similar to the approach used by Fries et al. (2002) to develop the MI-CHPICE decisions support algorithm. While the CATMOD procedure of SAS does permit the use of a minimal response variable (Stokes, Davis & Koch, 1995) it has many drawbacks compared with the more current and more widely used logistic procedure, including inability to deal with continuous independent variables and need to manually calculate odds ratios. Therefore, Fries et al. (2002), so-called `peel the onion` approach was used to differentiate subsets of dependent variables before proposing a combined method of predicting placement in the different service settings considered here.. 80
95 Table 9: Staff ratings of support services needed for persons to make a transition to a less intensive care setting, by current care setting SH CCAC Wt. Lst. CCAC LTC CCC ALC SAMPLE SIZE Level of support services needed for person to make a transition to a less intensive care setting today (% of clients) Personal support (PSW) Less than weekly hours/week hours/week hours/week N/A Homemaking services Less than weekly hours/week hours/week hours/week N/A Respite care Less than weekly hours/week hours/week hours/week N/A Mental health services Yes No N/A Rehabilitation services Less than weekly days/week N/A Social work Less than weekly day/week days/week N/A Transportation services Less than weekly round-trips/week round-trips/week round-trips/week N/A Meal preparation / Congregate meals / Meals on Wheels Less than weekly meals/week meals/week meals/week N/A CCC Acute ALC 81
96 Most Appropriate Care Setting Table 10: Summary of staff rating form results Current Care Setting SH CCAC Wait List CCAC Community LTC CCC (ALC*) CCC (Not ALC*) Acute ALC Less Intensive (than SH) 17.1% 70.3% 91.0% 2.0% 2.2% 0.0% 4.4% SH 80.1% 2.9% 2.0% 2.9% 0.7% 0.0% 1.1% More Intensive (than SH) 2.8% 27.3% 7.0% 95.1% 97.1% 100.0% 94.5% * ALC indicates that a client has been designated as an Alternate Level of Care client 82
97 The first logistic regression model will address the client characteristics associated with staff members indicating that a client needs care in SH rather than care in their own home. The second model will address the client characteristics associated with staff members indicating that a person care needs are to intensive for SH and instead indicate the need for LTC placement. Candidate variables for the logistic regression equations included any variables that are found to be significant at the bivariate level (using chi-square analysis), and/or were noted as clinically important during the project focus groups Logistic regression model for differentiating home care and supportive housing Logistic regression was used to estimate the model predicting appropriateness for SH as compared to appropriateness to receive care at home. Table 11 provides the list of candidate variables for the logistic regression model. It shows the significance of each variable at the bivariate level, with the dependent variable. A total of 1,686 clients were included in this analysis; 399 (23.7%) were identified as most appropriate for SH and 1,287 (76.3%) were identified as most appropriate for a care setting that was less intensive than SH (home care with or without support). 83
98 Table 11: Candidate variables for predicting staff ratings of being most appropriate for SH (as compared to most appropriate for a less intensive care setting such as home care) Variable Response Set Point Estimate Significance Marital Status Diagnosis of Dementia Locomotion (indoors) Bladder Continence Shortness of Breath Gender Delusions Chest Pain Age IADL Capacity Scale Current Care Setting Married Never Married/Divorced/ Separated/ Widowed No Yes Independent Dependent Continent/Continent with catheter/usually Continent/Occasionally Incontinent Frequently Incontinent or Incontinent No Yes Male Female No Yes No Yes Less than 75 yrs 75+ years or 6 SH HC LTC or CCC 1.00 (ref.) 5.12( ) p < (ref.) 2.26( ) < (ref.) 1.11( ) p = (ref.) p= ( ) 1.00 (ref.) 1.73( ) p< (ref.) 1.32( ) p= (ref.) 3.34( ) p= (ref.) 1.44( ) p< (ref.) 1.26( ) p= (ref.) 1.65( ) p< (ref.) 0.06( ) p< ( ) p<
99 Table 11 shows that a diagnosis of dementia, dependence in locomotion, frequent or complete bladder incontinence, shortness of breath, being female, having delusions, having chest pain, being older (75 years+), having severe IADL impairment and currently residing in LTC or CCC were significantly associated with an increased odds of being identified as being most appropriate for SH at the bivariate level. Having a spouse was significant and protective, as was currently residing at home receiving HC services. Based on the findings from the bivariate analysis, a logistic regression model was developed. Table 12 presents the final multivariate model. The overall fit of the logistic regression model measured by the c-statistic is very good at Seniors who had high levels of impairment in their capacity to perform IADLs had about twice (2.01) the odds of being identified as being most appropriate for SH compared with those with lower IADL impairment. Persons with a diagnosis of Dementia had 1.93 times greater odds of being identified as most appropriate for SH, and those who were 75 years of age or older had a 3.55 times greater odds. Never having been married, or having been divorced, separated or widowed (compared with being married) was associated with 3.25 the odds of being identified as being most appropriate for SH. Being identified as most appropriate for SH was much less likely if the client currently resided at home (PE=0.04, p<.0001). Currently residing in LTC or CCC had no significant influence on the odds of being identified as most appropriate for SH. Interactions between these variables were tested but were found to be non-significant. 85
100 Table 12: Final logistic regression model for staff ratings of being most appropriate for SH (as compared to most appropriate to remain at home) Variable Response Set Point Estimate Significance Marital Status IADL Capacity Scale Diagnosis of Dementia Age Current Care Setting c=0.87 Married Never Married/Divorced/ Separated/ Widowed or 6 No Yes Less than 75 yrs 75+ years SH Home Care LTC or CCC 1.00 (ref.) 3.25( ) p< (ref.) 2.06( ) p< (ref.) 1.93( ) p= (ref.) 3.55( ) p< (ref.) 0.04( ) p< ( ) NS 86
101 Logistic regression model for differentiating supportive housing and a more intensive care setting Logistic regression was next used to estimate the model predicting appropriateness for SH as compared with appropriateness for a more intensive care setting (such as LTC). Table 13 provides the list of candidate variables and their significance at the bivariate level. A total of 1,093 clients were included in this analysis, 399 (36.5 %) were identified as most appropriate for SH and 694 (63.5%) were identified as most appropriate for a care setting that was more intensive than SH. Table 13 presents the variables that were significantly associated at the bivariate level with increased odds of being identified as being most appropriate for LTC. The odds are all above one indicating that higher levels of impairment are associated with being considered more appropriate for LTC than for SH. Having had a decline in ADLs, being frequently or completely bladder incontinent, having mild to very severe cognitive impairment, having a diagnosis of Alzheimer s Disease or Dementia, being 75 years of age or older, having had a stroke, having possible depression, and being dependent in locomotion or bathing are significantly associated, at the bivariate level, with an increased odds of being identified as being most appropriate for LTC. Based on the findings from the bivariate analysis, a logistic regression model was developed. Table 14 presents the results of the final multivariate model. The overall fit of the logistic regression model measured by the c-statistic is very good at Mild to very 87
102 severe cognitive impairment is associated with a 7.63 increase in the odds of being identified as being most appropriate for LTC, as opposed to most appropriate for SH. Having decline in ADLs was associated with having 2.33 times the odds, being frequently or completely bladder incontinent with having 6.51 times the odds, and being 75 years of age or older with having 1.71 times the odds. Being female was protective, with females having half the odds of being identified as being more appropriate for LTC than for SH A Decision Algorithm for Supportive Housing (DASH) Using the logistic regression (Allison, 2000) as a building block, a Decision Algorithm for Supportive Housing [DASH; see Figure 8] was created using data from the MH LHIN. It was validated using a provincial sample of HC, LTC and SH clients. This decision tree predicts current placement decisions in the MH LHIN. The variables determined to predict admission to SH and to predict discharge from SH (Figure 7) were used in the development of the decisions tree model. The decisions tree is designed as a decision support instrument to aid clinicians in care placement decisions. It places clients into one of 6 branches designating appropriate placement in either HC (HC a or b), SH (a, b, or c) or LTC. 88
103 Table 13: Candidate variables for predicting staff ratings of being most appropriate for a more intensive care setting than SH (such as LTC) Variable Response Set Point Estimate Significance ADL Decline Bladder Continence Cognitive Performance Scale Alzheimer s Disease or Dementia Age Stroke Depression Rating Scale Locomotion (indoors) Bathing No Yes Continent/Continent with catheter/usually Continent/Occasionally Incontinent Frequently Incontinent or Incontinent Intact/Borderline Intact Mild-Very Severe Impairment No Yes Less than 75 yrs 75+ years No Yes No Depressive Symptoms Possible Depression Independent Dependant Independent Dependant 1.00 (ref.) 2.42( ) p < (ref.) 7.38( ) p < (ref.) 8.00( ) p < (ref.) 6.68( ) p < (ref.) 1.74( ) p < (ref.) 2.25( ) p < (ref.) 4.16( ) p < (ref.) 1.79( ) p < (ref.) 4.33( ) p <
104 Table 14: Final logistic regression model for staff rating of being most appropriate for a more intensive care setting than SH (such as LTC) Variable Response Set Point Estimate Significance Cognitive Performance Scale ADL Decline Bladder Continence c=0.86 Age Gender Intact/Borderline Intact Mild-Very Severe Impairment No Yes Continent/Continent with catheter/usually Continent/Occasionally Incontinent Frequently Incontinent or Incontinent Less than 75 yrs 75+ years Male Female 1.00(ref.) 7.63( ) p < (ref.) 2.33( ) p = (ref.) 6.51( ) p< (ref.) 1.71( ) p= (ref.) 0.50( ) p=
105 Figure 7: Schematic summary of variables associated with admission to and discharge from SH No Spouse Severe IADL impairment Diagnosis of Dementia 75 years of age or older Home Supportive Housing Mild to very severe cognitive impairment Decline in ADL Frequent or complete Bladder Incontinence 75 years of age or older Male LTC 91
106 Figure 7 shows a schematic depicting a summary of the logistic regression finding. It shows the variables that are associated with staff ratings of a fit for admission to SH from home and for discharge from SH to LTC. Decision tree analysis (Neville, 1999) is a statistical procedure embedded in the SAS Enterprise Miner program. It is a useful analytic tool that provides a visual interface to develop a tree or decision model by dividing a data set into meaningful groups using a sequence of decision or splitting rules. There are two main decisions tree techniques: the CHAID (Chi-squared automatic interaction detector and the CART (classification and regression trees). The CHAID (Kass, 1980) tests for interactions in the data set and allows for multilevel splits. It looks for discrete groups (of clients) within the data set and based on their responses on explanatory varibales, CHAID attempts to predict the effect on the dependent variable. CART (Breiman et al., 1984) splits on variables that can differentiate individuals on the dependent variable, but it only splits at a binary level at each node. There are three main criteria that are used to decide how best to split at a given node. They are: gini reduction, entropy reduction, and chi-square. The Gini coefficient measures variability in categorical data. A higher score indicates a higher level of diversity but less purity in a given node or split on the tree. The Gini coefficient looks for characteristics in the population that would clearly distinguish one group form another (e.g. all persons with incontinence belong in the LTC group, while all persons with a spouse belong at home). Entropy measures variability for categorical variables and can estimate the likelihood ratio for a particular outcome (appropriateness for a given care setting in this example). Breiman 92
107 (1996) found that when designing a decisions tree that will only allow for binary splits (not multi-level) that the entropy method selects variables that split more evenly while the gini methods favours variables that result in a more one-sided split that clearly favours the larger target. The chi-squared method uses the chi-square test to determine splits. Comparisons are made between expected and observed values. The entropy and gini reduction methods are not suggested when considering multilevel splits since there is no adjustment made for degrees of freedom. The chi-square method was selected and both binary and multi-level splits were considered in developing the DASH. Decisions tree analysis can manage both nominal and ordinal variables. Therefore HC, SH and LTC were all included in the outcome measure without needing to artificially assume an ordinal relationship. Creation of a predication model is the purpose of this exercise but is not, as many expect, an automated process using enterprise minor. The first step was to explore associations between variables using logistic regression to inform potential variables for inclusion in the decision tree analysis. Including too many variables in the analysis may lead to spurious relationships being found. A key step in decisions tree analysis is to decide on the first split. Enterprise miner provides an ordered list of associated variables from the strongest to weakest association with the outcome of interest (care setting). This is a key decision in the analysis process because the first split in the tree has substantial influence on future splits. In this case, the first split was made to distinguish person with informal resources from those without, resources being defined as the presence of a spouse. This decision was based on the strength of the association as well 93
108 as informed by the literature, conceptual model and focus groups. The points at which further splits take place are called nodes. Again, using the chi-square technique and allowing multi-level and binary splits, Enterprise Miner provides a list of variables associated with the outcome of interest. This list, however, is now filtered by the previous split decisions. In the case of the DASH, the MAPLe algorithm was most highly associated with care setting among persons with a spouse. Among persons without a spouse, MAPLe was not significant, but rather the split was chosen based on a CPS score (intact/borderline intact versus mild-severe impairment). Among persons who are cognitively intact/borderline intact, the next split was made between those independent in IADL and those who are highly dependent on others. Bladder incontinence was the variable best able to distinguished appropriateness of care setting among persons with at least mild cognitive impairment. Next, the DASH algorithm was independently validated against a provincial sample of data from across the care continuum to ensure that results were not only a reflection of care decisions in the MH LHIN. Results were consistent with the literature and conceptual framework indicating the important of the availably of an informal caregiver when making care placement decisions. Having a spouse helps seniors to remain out of LTC but does not necessarily guarantee that a client will be able to stay in their own home especially if they have higher care needs. Clients who have a spouse and a low to moderate MAPLe score are most appropriately placed at home with CCAC services (DASH branch HC(a)). If a spouse 94
109 is present but the client has a high or very high MAPLe score, SH is the most appropriate care setting (DASH branch SH(a)). When a spouse is not present, clients have fewer resources to support them in the community. When the client is cognitively intact or borderline intact, and has no more than moderate impairment in their IADL, he/she may be able to cope without the support of a spouse and are therefore most appropriately cared for at home (DASH branch HC(b)). However, being cognitively intact/borderline intact but unable to perform IADLs independently, requires placement in SH (DASH branch SH(b)). 95
110 Figure 8: Decision tree predicting current care setting in the MH LHIN Setting HC, SH,LTC Spouse No Spouse Maple 1,2,3 Maple 4,5 CPS 0 or 1 CPS 2+ HC (a) SH (a) IADL Capacity 0-4 IADL Capacity 5,6 No Bladder Incontinence Bladder Incontinence* HC (b) SH (b) SH (c) LTC * Freq or complete bladder incontinence 96
111 Persons with mild to very severe cognitive impairment, require support in order to remain in the community. If the persons has bladder control most of the time, he/she are best cared for in a SH unit (DASH branch SH(c)). However, if he/she is frequently or completely incontinent, LTC placement is necessary (DASH branch LTC). Table 15 shows the DASH distribution for HC, SH and LTC clients in both the MH LHIN (abbreviated MH ) derivation sample and the Provincial validation sample (abbreviated Prov ). In addition, the table shows the results from a healthy sample of seniors from Newfoundland (abbreviated Nfld. ) who were assessed with the RAI HC. The combination of clinical characteristics of persons in DASH branches HC a and b were determined to be predictive of appropriate placement at home with home care services. DASH branches SH a,b and c were predictive of SH. DASH branch LTC was predictive of appropriate placement in a LTC facility. More than half (54.8%) of all HC clients in the derivation data set were in the HC a or b DASH branches. HC clients were much more likely than both SH and LTC client (6.4x and 6.6x, respectively) to have a spouse and a MAPLe score of 1-3 (HC (a)). About one quarter of current HC clients (25.8%) are appropriate for SH based on their high MAPLe score or an inability to complete IADLs independently (branch SH(a) and SH(b), respectively). Most (61.8%) SH clients in the MH LHIN are appropriately placed in SH based on the DASH. SH clients are 3.4x more likely than HC clients to have no major cognitive impairment but need assistance with IADLs (branch SH (b)). Of all LTC clients in the MH 97
112 LHIN, 46.8% were found in branch 6. LTC clients are 6.7x more likely than HC clients and 8.8x more likely than SH clients to have at last a mild cognitive impairment and frequent bladder incontinence (branch LTC). The Provincial data sets used to validate the DASH found similar patterns for HC and LTC clients as found in the MH LHIN data sets. The SH validation data set was slightly less predictive, suggesting that the MH LHIN s SH clients may be somewhat a-typical of SH clients in the province as a whole. This may also reflect the smaller sample sizes available in SH as compared with HC and LTC in Ontario. Finally, the Newfoundland data set provided evidence for the validity of the DASH by determining that 96.6% of pre-defined healthy clients were found in branches HC (a) or HC (b) on the DASH algorithm indicating the home to be the most appropriate care setting. 98
113 Table 15: Distribution of decision tree algorithm for clients in both the derivation and the validation samples DASH Branch Setting HC (a) HC (b) SH (a) SH (b) SH (c) LTC MH Prov. MH Prov. MH Prov. MH Prov. MH Prov. MH Prov. Nfld. Well elderly N/A 27.7 N/A 68.9 N/A 0.0 N/A 2.2 N/A 1.1 N/A 0.0 HC SH LTC * 21.3* N/A* N/A* * Calculations based on the CPS score only. IADL Capacity cannot be calculated for LTC clients. 99
114 3.4 Discussion The purpose of this chapter was to develop a decision support algorithm to support clinicians with care placement decisions. In order to develop evidence-informed support instruments, this chapter began with a detailed profile of persons in the MH LHIN currently residing in SH, HC, LTC and CCC. In addition, subjective data were collect using a staff rating form as a means of establishing convergent opinions on variables of importance to clinicians in making care placement decisions; logistic regression analysis determined the characteristics of clients that were associated with these decisions. One major challenge in determining for whom SH is most appropriate, is the absence of a standardized assessment instrument in the SH sector. The MH LHIN partnered with the University of Waterloo to test the utility of the interrai CHA in SH sites. Therefore, this pilot project provided the opportunity to use evidence to inform decision making around eligibility and discharge criteria for SH rather than relying on an arbitrary decision making process. As depicted in the margin of care schematic (Figure 6), it is to be expected that there will be some overlaps in the profiles of clients across the care system. SH does not provide care to clients with unique care needs. Rather, persons being cared for in SH units may appear very similar to person being cared for at home or perhaps in a LTC facility. Person with similar care needs reside across the care continuum. These care placement decisions made have been appropriate at the time they were made. For example, a person with mild cognitive impairment and moderate ADL impairment, who was dependent on others for 100
115 IADL support, may have been placed in a LTC home due to unavailable resources. With no family support and not enough income to pay for IADL care, this may have been the only option, especially prior to the availability of SH as a care placement option. Persons with similar care needs who reside across care continuum may have similar care needs in one domain, such as ADL, but have very different care needs in another domain. For example a person with ADL impairment could be cared for at home, in SH or in LTC, but the addition of a cognitive impairment would likely warrant LTC placement especially in the absence of a family caregiver. Figure 6 provided a schematic of an overly simplified conceptualization of the continuum of care and one which policy makers may assume to be the reality. For example, the schematic showed home care clients to be a less impaired population than SH clients. The findings from the Mississauga-Halton LHIN in fact disproved their belief. Supportive housing was actually provided to a very light care population who tended to be less impaired than persons receiving support at home from a CCAC. Moreover, many more overlaps were found in the characteristics of clients across the care continuum, not just those between HC and SH and between SH and LTC. The interrelationships between care settings across the continuum of the types of services provided and characteristics of clients/residents is much more complex than policy makers may understand it to be. While some overlap in the care needs of clients across the continuum is expected, some overlap is a result of the absence of a standardized assessment instrument for SH, and arbitrary decision making around eligibility and discharge. For example, in the MH LHIN, 101
116 39% of SH clients had a MAPLe score of 1 or 2. This indicates low priority needs and a very low risk of causing caregiver distress, as well as a very low risk for admission to LTC. This population has no ADL impairment, no more than a borderline cognitive impairment, no behaviour disturbance (see Figure 11) and as such, represents a population that generally speaking, should be cared for in their own home, not in a SH unit. There may be a small proportion of person with a MAPLe score of 1 or 2 who may need SH care. These individuals may be in need of care in areas not assessed with the MAPLe algorithm. But this proportion should not reach anything near 39% of a SH case mix. This broad eligibility process has resulted in SH units being blocked from those with most complex care needs who might otherwise be admitted to a LTC home. The descriptive analyses clearly show a need to adapt eligibility criteria in the MH LHIN. Determining for whom SH is most appropriate involves consideration of not only the needs of clients but the resources available in SH to meet those needs. SH has been explored as an alternative care setting to LTC and as an alternative placement for person in hospital designated Alternative Level of Care (ALC) i.e. those blocking beds in the hospital while they await LTC placement. This hypothesis has some merit but policy makers need to be careful about substituting one form of care for another. For example, persons in ALC or LTC beds tend to have higher level of cognitive impairment, functional impairment and more medical conditions than are typically found among SH clients. Some ALC and LTC clients could be transferred to a SH unit, but SH, as it is resourced today, is certainly not a replacement for LTC or a means to solve the ALC challenge in Ontario. Increasing the 102
117 resources available in SH to care for more impaired clients is a viable option. However, caution is warranted since changes made to one sector may have drastic impacts across the health care continuum. Providing care to person with high resource intensive needs in SH, may result in an increase in the complexity of clients that are admitted to LTC facility, thereby requiring an increase in LTC resources as well. When staff members were asked to rate the appropriateness of SH to meet the care needs of clients with whom they were familiar, the majority of clients were judged to be appropriately placed. In the absence of clear eligibility and discharge criteria, staff members judgments on appropriate placement were based both on the care needs of the client (cognition and functional ability) and the resources available to meet those needs in SH. Interestingly, persons currently residing in a SH unit were more likely to be judged as appropriate for SH as compared with person currently residing at home. This may be an accurate assumption, but may also perpetuate poor care placement decisions if clinicians have a tendency to assume the current care setting of a client to be his/her most appropriate care setting. For example, it was very rare for clinicians to select SH as an appropriate setting for persons not currently residing in a SH unit. Differences in clinician ratings of appropriateness for SH may reflect, at least in part, the lack of a precise definition of SH. The definition of SH varies so widely that clinicians likely differ in what they consider to be SH. Therefore they may have very different pictures in mind when they indicate a client to be best cared for in a SH unit. Moreover, placement decisions are probably based on a combination of objective measures of function 103
118 and idiosyncratic, situational considerations that the clinician may take into account for each client. Recent client deterioration may result in a decision to relocate the client to LTC. Rather than assuming recent decline will result in a trajectory of decline requiring LTC placement, clinicians may wish to consider more carefully the reason for this decline with the goal of improving functioning and keeping the client at home, where possible. In addition, there may be some items or behaviours that in themselves might influence clinical decisions around placement, such as a case of wandering or a serious diagnosis. Due to the rarity of these behaviours they may not appear significant in a model. Moreover, clinicians are likely to make individually-based decisions which may result in two clients with similar clinical characteristics being placed in different care settings. Clinical input is and should be a key component of care placement decisions. However, these decisions must not be made arbitrarily and consistency is needed to ensure equity. A decision support algorithm was developed in this chapter to help inform decision making around care placement, rather than to automate the process in the MH LHIN. The DASH defined three profiles of persons most appropriate for SH: The first is a person with a spouse and who has a high or very high priority designation based on the MAPLe score (see Figure 11). The second is a person without a spouse and who is cognitively intact (or borderline intact) and highly dependent on others to person IADL. This third is a person without a spouse and who has cognitive impairment but no bladder incontinence. Of these three groupings, the second is the most common by far The other two groups are much less frequently found in SH for two main reasons: Group one is less commonly found in SH as 104
119 compared with group 2 because of the very strong association between presence of a spouse and being able to remain in one s own home. Group three is less commonly found in SH as compared with group 2 because of the current eligibility criteria for SH in the MH LHIN specifying that a SH must be able to direct their own care, i.e. have minimal cognitive impairment. These DASH score findings have implications for policy decisions. First, providing support to informal caregivers will reduce the need for SH and for LTC. Support may be provided in the form of respite or by providing CCAC services to substitute for informal care and reduce caregiver distress. Secondly, removing IADL support from the services provided by CCACs may have been a cost effective decisions, but the DASH score clearly indicates that among cognitively intact individual without a spouse, dependence on others for IADL support is the threshold for the need to leave ones own home and move into SH. IADL support, housework and meal preparation in particular, must be made available at a reasonable cost to persons in the home without informal care. Finally, a bladder incontinence program should be put in place in SH building to help keep persons with mild cognitive impairment out of LTC for as long as possible. The DASH score results indicate that persons who have no more than a moderate MAPLe score and have a spouse, have both care needs that are too light and adequate resources available in the community to remain at home. The DASH score also indicates that cognitively impaired persons, especially those with frequent incontinence, cannot have their needs met in SH and may be appropriately placed in LTC. It is important to keep in 105
120 mind that for the purpose of policy around eligibility to and discharge from SH, that the DASH score has been designed as a decision support instrument and not an automated means by which to determine these criteria. Care placement decisions are inherently valuebased and should take into account needs and resources, but also consider client and family preference as well as seek clinical expertise and advice. In this chapter a decision support algorithm was developed to help inform care placement decisions in the MH LHIN. The combination of client need and resources availability was established in terms of using cross-sectional data to identify for whom SH is most appropriate in the MH LHIN. Chapter 4 will use longitudinal, province-wide data, to explore changes in the appropriateness of SH to meet the care needs of clients over time. 106
121 CHAPTER 4: Longitudinal analysis of CCAC residential care clients: Changes in client fit with supportive housing and factors associated with decline in quality of life. The purpose of this chapter will be to explore the capacity of SH to meet the changing care needs of clients. A longitudinal sample of provincial RAI-HC data will be used for these analyses. The appropriateness of SH over time will be explored in terms of client changes in: DASH score, clinical characteristics, resource availability and quality of life. 4.1 Introduction It is important to make evidence-informed decisions on the most appropriate care setting in which to meet an individual s care needs (Lavis et al., 2005). Inappropriate placements can be detrimental to the health and well-being of the individual, as well as costly to informal caregivers and the health care system as a whole (e.g. Spillman & Long, 2009; Knight, Lutzky, & Macofsky-Urban, 1993). Not only must careful decisions be made around initial placement, but clients must be monitored over time and regularly assessed to ensure the ongoing appropriateness of the care setting to meet their needs. The newly developed Decision Algorithm for Supportive Housing (DASH) can be used to inform initial placement decisions and also to monitor ongoing appropriateness of this placement decision. 107
122 SH may cease to be the most appropriate care setting for an individual if there is a change in fit between the client and their care setting over time. A change in fit may occur if the needs of the individual and the resources available to him/her, become unbalanced. As described in the conceptual framework (Rockwood et al.,1994), the fit of a client with a given care setting is based on finding a balance between the clinical characteristics of the individual, his or her care needs, and the resources available to meet those needs. These resources include both formal care and informal support. Persons residing at home, or in a LTC facility, may experience a change in fit such that SH becomes the most appropriate care setting in which to have their needs met. If a person is no longer an appropriate fit for their care setting (Zimmerman et al., 2002) a transition or relocation may be necessary. Seniors experience many transitions in their lives including the birth of grandchildren, retirement, change in income, moving to a new house, death of a spouse, death of friends, or health decline (Wilmoth, 2000). Transitions are challenging for most, but when the transition involves moving to a new location, particularly out of necessity, seniors with complex care needs may be particularly vulnerable both physically and psychologically (Coleman, 2003). Seniors may relocate from the community to an institution, from an institution back to the community, or between communities settings/ between institutional settings. The decision to relocate a client to a more appropriate care setting should be weighed carefully against the risk for potential harm that the transfer itself may cause (Coleman, 2003). Some transitions may be urgent and unplanned, leaving the client and their family 108
123 unprepared (Coleman & Berenson, 2004). Others however, may have adequate time in which to prepare for the transition to the new care setting. There is evidence to suggest that providing transitional care, defined as: a set of action defined to ensure the coordination and continuity of health care as patients transfer between different locations (Coleman and Boult, 2003) reduces the risk of adverse outcomes associated with relocation such as an increase in ER visits, re-hospitalization, or mortality (e.g. Murtaugh & Litke, 2002; Coleman, Parry, Chalmers & Min, 2006; Hirdes and Brown, 1996). Transitional care should include: actively involving clients and family in decision-making (Coleman and Boult, 2003), and improving/facilitating communication between the health care professionals at the client s current care setting and the health care professional at the client s future care setting (Anderson and Helms,1995). Transitional care may be of particular importance to persons at higher risk of adverse outcomes such as the frail elderly (Castle, 2001). One such adverse outcome is a reduction in quality of life. Given the risks associated with relocation to a new care setting, it is important to note that a decline in health may not necessitate relocation. In terms of finding a balance between care needs and resources, if care needs increase the balance is maintained if resources increase as well. One common example is providing care to persons with early stage Alzheimer s disease. The diagnosis of Alzheimer s may be a strong trigger for the families to consider relocation to either SH or LTC. Abusive or difficult behaviors such as resisting care (Gruber-Baldini, Boustani, & Sloane et al., 2004; Yaffe et al., 2002) increase the likelihood of this relocation. Caregiver may not have the resources to care for a person 109
124 with dementia as their cognition declines. To date, most SH sites do not have these resources either. As persons with dementia declines, most moved from SH to LTC due to increasing care needs, cognitive decline, falls, and wandering; need that could no longer be met in the assisted living facility (Koptez, 2000). SH requires an increase in resources if it is to support person with moderate to severe cognitive impairment. It is well recognized that the health of an individual includes not only meeting physical health care needs, but also meeting emotional, social and psychological needs. Quality of life has been defined as a concept that involves the dimensions of physical, social and psychological functioning and well-being (Cipher & Clifford, 2004). Quality of life is a multidimensional construct (e.g. Mitchell and Kemp, 2000) that may be influenced by somatic factors such as pain, by emotional factors such as mood, and by psycho-social factors such as relationships with friends and family. Quality of life is a more subjective measure of health than whether a person has a broken hip or a diagnosis of diabetes. It is also more difficult to define objectively and to measure and monitor over time. SH has the potential to provide an environment that fosters a high quality of life. Fry (2000) found that being autonomous, independent, and being able to make choices about one s own living arrangements and medical interventions, were cited by seniors as important to their quality of life. Having opportunities to be social engaged, and having contact with family and loved ones outside of the SH building were also found to be strong predicators of quality of life (Mitchell & Kemp, 2000). Regardless of the care setting in which a senior resides, quality of life is an important consideration and should be 110
125 carefully monitored. Leaving a depressed client untreated shows as poor quality of care as not treating a fracture or provided medication for a diagnosed condition. SH clients may experience a decline over time in their health and well-being, increasing their resource needs. This chapter will determine the particular clinical characteristics of SH clients that are associated with a decline in quality of life, with the purpose of informing care planning in SH. A decline in some areas of functioning may inform the need for relocation either from SH to a LTC home, or from receiving care at home to relocation to SH. This chapter will identify these characteristics and explore alternatives to relocation. 4.2 Methodology Samples The sample for this chapter is clients who resided in a residential care setting (including SH). These clients were identified by the cc5 item on the RAI HC which distinguishes the CCAC(RC) clients (cc5=3) from the regular community dwelling long stay home care clients who reside at home. A sample of data collected between 2006 and 2008 was used for these analyses. Of the total cases with longitudinal data (N=122,913), a subset was included in the analysis if they had at least two RAI HC assessments within the time period and if they were identified as CCAC(RC) clients on both assessments. About one third of the clients in this longitudinal data set were assessed at least twice reducing the sample size to 43,771. Less than 10% of RAI HC clients are typically 111
126 residential care clients (including SH). This sample had 3,256 (7.4%) CCAC(RC) clients at time 1 and 3,195 (7.3%) at time 2. Analyses were completed with a final sub-sample of 2,724 CCAC(RC) clients who had longitudinal data and were identified as being a CCAC(RC) client on both assessments Analytic Methods The distribution of the DASH will be calculated at both time 1 and time 2 to determine the percentage of clients appropriately placed in their residential care setting at each time period. Changes in the DASH score across time will then be calculated. All combinations will be explored. Changes between branches may indicate a change in status from appropriate placement to need for either a more intensive care setting (e.g. change from branch LTC to SH (c) indicating need for LTC), or a less intensive care setting (e.g. change from branch SH (a) to HC (a) indicating need for HC). A change in DASH score may also indicate continued appropriate placement in the residential care setting with a change in clinical characteristics (e.g. change from branch SH (b) to SH (a) indicating improvement in cognition). QoL among residential care clients (including SH) will also be explored in this chapter. The prevalence and trajectories of three quality of life measures, one psycho-social (social isolation), one emotional (mood), and one somatic (pain) will be explored. Prevalence of poor QoL will be calculated for each QoL measure at time 1(t1) and time 2(t2). The proportion of concordant and discordant pairs will also be determined. 112
127 Concordant pairs indicate either good QoL at both t1 and t2 or poor QoL at both times. Discordant pairs indicate improvement or decline in QoL. QoL will be measured using pre-defined binary coding as defined by interrai s Home Care Quality Indictors (CIHI,2009) as follows: CCAC(RC) clients will be defined as socially isolated if either, they are alone for long periods of time/all of the time and indicate that they feel lonely, or if they have had a decline in their social activities in the past 90 days and indicate they are distressed about this decline. CCAC (RC) clients will be defined as having a poor quality of life in terms of pain if they have daily pain and if that pain is either severe/horrible or if the client indicates that the intensity of the pain is disrupting their usual activity. Finally, CCAC (RC) clients will be defined as having a poor quality of life in terms of mood if they have a feeling of sadness or being depressed and if they experience two or more of the following moods/behaviours: persistent anger with self/others, repetitive health complaints, sad or worried facial expression, recurrent crying or tearfulness, withdrawal from activities of interest, or unintended weight loss. Finally, logistic regression will be used to determine the variables that are associated with decline in QoL at the bivariate level. The final logistic regression model will include variables that may be clinically significant and found to be significant at the bivariate level. 113
128 4.3 Results Appropriateness of care setting placement over time Table 16 shows the DASH branch distribution among CCAC(RC) client at t1 and at t2 individually. Defining appropriate placement based on the decision support tree, at t1 67.5% (n=1839) of CCAC(RC) clients were appropriately placed in their residential care setting (including SH). At t2, 63.4% (n=1726) were appropriately placed. Of those inappropriately placed in their residential care setting, about one in six (17.9% at t1 and 16.1% at t2) were most appropriate for HC. A smaller proportion (14.7%) was most appropriate for LTC at t1 and a higher proportion (20.5%) was most appropriate for LTC at t2. When considering the appropriateness of the residential care setting over time (Table 17), as defined by the DASH, the majority (56.9%) of CCAC(RC) clients were appropriately placed in their residential care setting at initial assessment and at follow-up. About one quarter of CCAC(RC) clients (26.1%) were potentially inappropriately placed at initial assessment and at follow-up. The appropriateness of placement changed for the remaining 17.0% of clients. About one in ten (10.6%) were appropriate for SH at t1 but not at t2. A few (6.4%) became appropriate for SH by t2 having been inappropriate at t1. Table 17 provides a summary of all possible changes across time. The DASH however is designed in such a way that several different combinations of clinical characteristics/resource availability may result in the same conclusion about the client s most appropriate care setting. Therefore, further analyses were required to determine the 114
129 specific changes in client characteristics/resource availability that took place. Table 18 provides the cross-tabulations for the DASH branch number at t1 by t2. DASH score at t1 was significantly associated with DASH score at t2. The diagonal numbers show the percentage of clients with the same branch number at t1as at t2. Most (88.0%) of branch LTC clients, LTC appropriate clients with no spouse, CPS 2+ and frequent bladder incontinence, remained branch LTC clients at time 2. Branch HC (b) clients were the most likely to change branches over time with only 67.2% remaining without a spouse, a CPS score of 0 or 1 and low to moderate IADL impairment. Numbers above or below the diagonal provide the percentage of clients whose DASH score at t1 was different from their DASH score at t2. An asterisk was placed in cells that contained fewer than 3% of clients. About one in five (18.5%) clients with a spouse, had an increase in their MAPLe score from a 1,2 or 3 to a 4 or 5 and 12.7% had a decrease in their MAPLe score from a 4or 5 to a 1, 2 or 3. Among clients with no spouse and a CPS of 0 or 1, 17.9% experienced a decline in their capacity to perform IADLs and 7.5% experienced improvement in IADLs. Finally, among clients with no spouse and a CPS score of at least 2, an increase in bladder incontinence occurred among 14.6% of clients while an improvement in bladder incontinence occurred among 10% of clients. Resource availability (spouse), tended to remain the same over time, while changes in the clinical characteristics of client were observed. For example, very few clients who had a DASH score of HC(a) or SH(a) at t1, changed to a DASH score of HC(b),SH(b), 115
130 SH(c) or LTC at t2, or visa-versa. This change would have required a spouse to pass away or a client to get remarried in order to have a spouse become present. Some clients improved while other declined over time, but the majority remained in the same branch of the DASH over approximately a one year period. 116
131 Table 16: DASH branch number for CCAC(RC) clients at two time intervals Distribution of CCAC (RC) clients DASH Branch Time 1 Time 2 Number HC (a) 7.2 (195) 6.4 (175) SH (a) * 6.6 (181)* 6.9 (187)* HC (b) 10.7 (290) 9.7 (265) SH (b)* 22.9 (625)* 20.0 (545)* SH (c)* 37.9 (1033)* 36.5 (994)* LTC 14.7 (400) 20.5 (558) *Appropriate placement in SH 117
132 Most appropriate care setting at Time 1 Table 17: Longitudinal changes in appropriateness of client care setting % of CCAC(RC) clients Most appropriate care setting at Time 2 HC SH LTC HC SH LTC * HC=Home Care, SH=CCAC(RC) clients including supportive housing, LTC=Long-Term Care 118
133 Branch on DASH at t1 Table 18: Changes in DASH score over time Branch on DASH at t (HC)a (SH)a (HC)b (SH)b (SH)c (LTC) 1 (HC)a 2 (SH)a 3 (HC)b 4 (SH)b 5 (SH)c 6 (LTC) * * * * * * * * * * * * * * * * * * * * * * Row percents < 3.0% 119
134 4.3.2 Quality of Life Table 19 shows the percentage of clients with poor QoL at t1 and at t2 as well as change or consistency over time for each of the three measures of QoL. Overall, the majority (between 72.1% and 86.5%) of CCAC(RC) clients had a good QoL at t1 that remained at t2. At t1, pain was the most prevalent (22.2%, N=604) QoL problem followed by social isolation (13.8%, N=376) and poor mood (9.1%, N=249). A similar proportion of client improved in QoL as declined with the exception of social isolation where 4.1% declined but 6.8% showed improvement Logistic Regression Model Predicting Decline in QoL Logistic regression was used to estimate the model predicting a decline in the QoL of CCAC(RC) clients. Table 20 provides the list of candidate variables for the logistic regression model. It shows the significance of each variable at the bivariate level. The dependent variable is coded as 1 if the client experienced a decline in their quality of life between their first and last second assessments as measured by one or more of: a decline in mood, an increase in social isolation or an increase in pain. A total of 2,724 clients were included in this analysis of which 344 (12.6%) experienced a decline in their quality of life. 120
135 Table 19: Changes in quality of life measures over time among CCAC(RC) clients Presence of poor QoL Change in QoL % (n) Pain Social Isolation Mood Pain Social Isolation Mood Pain Social Isolation Mood Pain Social Isolation Mood Time 1 Status Time 2 Status Yes No Improvement No Yes Decline Yes Yes No Change No No No Change 6.8 (185) 6.8 (184) 4.7 (128) 5.7 (156) 4.1 (110) 4.3 (118) 15.4 (419) 7.1 (192) 4.4 (121) 72.1 (1964) 82.2 (2238) 86.5 (2357) 121
136 Candidate variables were informed by the literature and considered for inclusion in the final model if significant at the bivariate level. Table 20 shows the variables that were significantly associated with a decline in QoL at the bivariate level. Having one or more falls in the previous 90 days, self-reporting being in poor health, experiencing a flare-up of a chronic problem, believing themselves to be capable of increased functional independence (or their caregiver believing this to be the case), and being fearful of a family member (although a rare event) are significantly associated, at the bivariate level, with an increased odds of declining in QoL. Variables that the literature suggested may be significantly associated with decline in QoL, but were found to be non-significant were: age, marital status, gender, decline in hearing and/or vision, problem with short-term memory, bladder or bowel incontinence, decline in cognition or ADLs or self-reliance. Based on the findings from the bivariate analysis, a logistic regression model was developed. Table 21 shows the results of the final multivariate model. The overall fit of the logistic regression model measured by the C-Statistic is moderate at One or more falls in the previous 90 days is associated with a 1.31 increase in the odds of experiencing a decline in QoL. Self-reporting poor health was associated with having 1.44 times the odds, a caregiver believing the client is capable of increased functional independence with having 1.84 times the odds, and being fearful of a family member (although a rare event as indicated by the wide confidence intervals),with having 4.52 times the odds. 122
137 The DASH score was not a significant predictor of a decline in QoL overall. However, compared to persons deemed most appropriate for supportive housing (according to the DASH), persons deemed most appropriate for home care had 1.44 times the odds (CI= ) of experiencing a decline in quality of life in terms of an increase in pain. The final logistic model (Table 21) predicting decline in QoL was stratified by the DASH score in order to determine whether the factors predicting decline in QoL were consistent across DASH scores. Substantial differences were found. Where the DASH score indicated appropriate placement in LTC, experiencing a fall was the only variable found to be a significant predictor of a decline in QoL (OR= 3.05, CI ). Where the DASH score indicated appropriate placement in home care, a Caregiver believing the client to be capable of increased functional independence, was the only variable found to be a significant predictor of a decline in QoL (OR= 2.12, CI ). This belief by the caregiver was also a significant predictor of decline in QoL among those deemed most appropriate for SH (OR=1.97, CI ) along with poor self-reported health (OR=1.54, CI ) 123
138 Table 20: Candidate variables for predicting decline in the QoL of CCAC(RC) clients Variable Response Set Point Estimate Significance Fall Client says he/she is in poor health Client experiencing flareup of chronic problem Client believes he/she is capable of increased function independence Caregiver believes client is capable of increased function independence Fearful of family member None 1+ No Yes No Yes No Yes No Yes No Yes 1.00 (ref.) 1.37( ) p = (ref.) 1.50( ) p = (ref.) 1.64( ) p = (ref) 1.52( ) p = (ref) 1.94( ) p < (ref) 4.18 ( ) p =
139 Table 21: Final logistic regression model predicting decline in the QoL of CCAC(RC) clients Variable Response Set Point Estimate Significance Fall Client says they are in poor health Caregiver believes client is capable of increased function independence Fearful of family member None 1+ No Yes No Yes No Yes 1.00 (ref.) 1.31( ) p = (ref.) 1.44( ) p = (ref) 1.84( ) p = (ref) 4.52 ( ) p =
140 4.4 Discussion This chapter explored the capacity of SH to meet the changing care needs of clients. It began with a longitudinal analysis of the fit between needs and resources of clients, as informed by the DASH, and was followed by descriptive analysis of the QoL of SH clients and the variables associated with a decline in QoL over time. Over a one year period, the majority of SH clients remained appropriately placed based on the DASH score. This result may indicate that the care needs of SH clients and the resources available in SH, remained the same over time. Alternatively, the care needs of SH clients may have declined over the year, but an increase in resources may have been able to compensate. For example, incontinence programs may have been put in place to help care for person with cognitive impairment would otherwise have required a discharge to LTC. Small changes such as an incontinence program, can make the difference between being able to remain in a SH unit and needing a more intensive care setting like LTC. However, it is unlikely, and inadvisable to use SH as an alternative to LTC for persons with very severe impairment. SH as it is resourced today, can provide care to mild or even moderately cognitively impaired person, but not a person with severe impairment. SH relies on the client s ability to direct their own care and manage basic activities of daily living such a making decisions to keep themselves safe. SH is not designed to care for person requiring 24/7 care to ensure their QoL, safety and well-being. This level of resources would require a different model of 126
141 SH and likely more funding to support persons with more intensive care needs. The cost effectiveness of this model would need to also be considered. This chapter determined that the care needs of SH clients may improve over a one year time period. For example, improvement in IADL function was observed, as well as a decrease in the MAPLe score. These improvements may reflect an appropriate decision around care placement. Persons appropriately admitted to SH may be improving in their functioning as a result of receiving the care they require. Moreover, many SH clients experience an increase in their QoL reflecting the role SH has to play in not only meeting the health care needs of client but also managing health and well-being. The care needs of SH clients may also decline over a one year period. Declines in cognitive functioning and/or continence are common among SH clients and are the reason for many discharges to LTC. This finding should informs both discharge and admission practices in SH. Clients admitted to SH who are better off in LTC risk a short term stay in their SH unit necessitating a relocation which can put the client at risk. Moreover, if care needs cannot be met in the SH unit, clients may be more likely to experience a health event resulting in hospitalization or an emergency room visit. Clinicians should consider the care needs of clients at the time of admission assessment but also use their clinical judgment to consider the health trajectories of clients. At the time of assessment for admission to SH, clients expected to improve in functioning may require short term support in their own home rather than admission to a SH unit. Clients expected to decline in functioning, may require extra supports within SH or may require placement in LTC. 127
142 Change in a client s DASH branch over time does not necessarily indicate a change in appropriateness of the residential care setting, but rather may reflect a change in clinical characteristics or resource availability. These changes may require a change in care planning but not indicate a need for relocation. The majority of clients did not change DASH score over a one year time period, providing evidence for longitudinal consistency in appropriateness of placement decisions. However, many clients did change DASH score which may have implications for relocations and availability of SH units in the future. For example, over a one year time period, 1 in 10 LTC clients, close to 1 in 5 HC clients with a spouse and almost one third of HC clients without a spouse, experienced a change in their resource availability and/or clinical characteristics that led to a DASH score indicating their most appropriate care setting to be SH. This represents a significant number of individuals and proportion of seniors who may not be appropriate for SH today but one year from now may require a SH unit. This provides some evidence for the need to expand SH in Ontario to meet today s needs and the growing need for SH. Evidence- informed decisions around care placement may also leave LTC beds available for the 1 in 5 SH clients that the DASH estimates may need a LTC bed within one year. Place of residence (HC, SH or LTC) was not found to be a statistically significant predictor of QoL. There is evidence to suggest that QoL is a multidimensional construct, difficult to define and to measure. Individual-level variables such a temperament, may be a stronger predictor of QoL than the place in which a person resides. This assumes a base level of quality of care. Poor quality of care in any care setting is expected to be associated 128
143 with poor QoL. As such, SH has a role to play in QoL in terms of providing quality care and a quality home in which to reside. The inter RAI assessment instruments have built in Clinical Assessment Protocols (CAPs) that flag areas of potential concern including those that apply to quality of life. However, many aspects of QoL may be outside of the control of SH care providers. Every effort however should be made to monitor QoL and intervene where possible. Interventions into the somatic and psychological aspects of QoL (i.e. pain and mood) may be more easily addressed than the social aspects of QoL. Opportunities for social engagement should be made available but seniors must be left to choose whether or not they wish to participate. Social engagement may be a more critical aspect of QoL to some than to others. When care planning around QoL, SH clinicians should consider intervening where possible in areas of health and well-being that have been shown to be associated with decline in QoL. For example, falls may be reduced by installing grab bars in the bathroom and limit tripping hazard such as area rugs. This small change may reduce the fear of falling, which in term may increase social engagement and reduce the risk of decline in QoL. Another example is to consider including the client s family in the care planning process. A family member believing the client to be capable of more functional independence has been shown to be associated with poor QoL. Including family members in the care plan may provide the opportunity for conversation between family members and the clinician and the chance for questions to be asked and clarification made. 129
144 A change in the appropriateness of SH to meet the care needs of a client, may warrant a discharge to LTC. The interrai data provides the means to capture longitudinal trends in the data and determine both the proportion of SH clients who are discharged to LTC, and the characteristics of those clients. These analyses will determine for whom SH is most appropriate by identifying the clinical characteristics of clients who are discharged to LTC because their care needs have exceeded the threshold for care being provided in SH. 130
145 CHAPTER 5: Time to event analyses among CCAC residential care clients: Factors associated with time to discharge to LTC and death The purpose of this chapter will be to determine the rate of, and factors associated with, discharge from supportive housing to a long-term-care (LTC) facility. This will inform the role of supportive housing in the continuum of care in terms of the degree to which it serves as an alternative care setting to LTC for seniors. Moreover, longitudinal analyses, using RAI-HC data, will identify SH clients who may be at a particularly high risk of discharge to LTC. 5.1 Introduction In chapter 4, it was determined that the majority of SH clients who receive CCAC support, have a good quality of life as measured by levels of pain, social isolation and mood. Although a good quality of life tends to be maintained over time, being free of pain, being socially engaged, and having a positive mood, does not necessarily equate to having one s health care needs met. Moreover, the care setting in which a senior resides was not found to be significantly associated with their QoL. This may be a positive finding, suggesting that a good QoL can be achieved in any care setting whether at home, in a SH unit, or in a LTC facility. 131
146 The Aging at Home Strategy in Ontario (MOHLTC, 2007b) aims to help seniors to remain living in the community for as long as possible. For those who are unable to remain at home, relocation to SH and assistance from a CCACs, as required, may help to delay or prevent admission to a LTC facility. However, it is unrealistic to expect SH to be a permanent alternative to LTC for all seniors. As it is resourced today, SH is unlikely to be able to provide quality care to all seniors indefinitely (Hawes, Phillips, & Rose et al., 2003). LTC may be the most appropriate setting for some seniors who can no longer remain at home due for example to cognitive decline and the absence of an informal caregiver, or perhaps the need for more skilled care(buhr, Kuchibhatla, & Clipp,2006). Moreover, some current SH clients may eventually be appropriately discharged to LTC. A discharge from SH to LTC should not necessarily be considered an adverse outcome for all clients, but neither should it be an assumed eventual outcome for all clients. Phillips, Hawes, Spry, and Rose (2000), found that the majority of seniors (98%) thought of assisted living as their final destination; however, in reality, one in five assisted living residents who participated in the study had left the assisted living facility prior to the follow-up. In further research by Phillips and colleagues, it was found that the majority of those who left the assisted living residence did so because their needs had increased and they required more care than assisted living was able to provide (Phillips et al., 2003). Hawes, Phillips, Rose, Holan, and Sheman (2003) also found that a person could not necessarily expect to remain in an assisted living facility until the end of his/her life. Cognitive decline, behaviours such as resisting care or wandering, or requiring assistance with transfers, often 132
147 led to discharge from assisted living. These studies show a discrepancy between client expectations and actualities. Stone and Reinhard (2007) found that seniors themselves were unclear as to their trajectory of care. Some assumed SH to be a stepping stone on the way to LTC while others saw SH as the final care setting in which they would reside. This latter group did not intend to ever enter a nursing home and expected to reside at the SH site until the end of their lives. This uncertainty demonstrates the need for clarification around the role of SH in the continuum of care. The MOHLTC (MOHLTC, 2007a) states that SH services are designed for those who need minimal or moderate care in order to remain living independently. This suggests that the services provided in SH, should prevent institutionalization. This assumes that persons in SH are at a high risk for institutionalization and that the resources are available in SH buildings to delay or prevent this inevitable discharge. Analyses in chapters 2 and 3 showed that not all SH clients are at a high risk for institutionalization and that many LTC clients have care needs that are too complex to be met in a SH building. SH may be able to prevent or delay institutionalization for some of its clients, but likely not all. Determining the salient variables in predicting time to LTC admission can inform resource planning, eligibility and discharge criteria and care planning. It can also provide insight into whether SH, with the help of a CCAC, may be a stepping stone on the way to LTC for most clients, or whether SH may be a relatively more permanent residence for seniors who can no longer remain in their own homes. 133
148 There have been numerous studies to date on the variables associated with admission to a LTC facility. Clinical characteristics have been found to be strong predictors of admission to a LTC facility, as well as the resources available to support a person in the community. For example, a person with substantial impairment may be provided with sufficient care outside of a LTC facility, if there are resources in place to provide this care. This often includes both the specialized care provided by formal home care services, such as nursing, as well as day-to-day support provided by family and friends, termed informal care (Houde, 2010). Living alone substantially increases one s risk of institutionalization due to the absence of another person to aid in day to day task (Friedman et al., 2005). Moreover, the loss of a spouse has been found to increase the risk of institutionalization for the client threefold in the first month following the death (Nihtilä & Martikainen, 2008). The presence of a spouse may be of particular importance to men who experienced a 70% increased risk of institutionalization as compared to women who experienced a 29% increased risk associated with living alone (Nihtilä,2008). This finding may represent a cohort effect associated with a more traditional gender role. Formal home care provides support to seniors whose need for care can be scheduled, such as a bath twice per week, a morning meal, or assistance with dressing each morning. Unscheduled tasks and many instrumental activities of daily living, such as household cleaning and shopping, are often the responsibility of the informal support network. While providing care to a loved one may be a rewarding task, it may also be very stressful. The 134
149 physical and emotional strain and potential financial hardship associated with providing care have been found to be associated with caregiver distress, a major predictor of institutionalization (e.g. Spillman & Long, 2009; Knight, Lutzky, & Macofsky-Urban, 1993). Providing care for a family member, neighbour or close friend can be a very fulfilling and rewarding task (Cohen, 2002; Grbich et al., 2001). In some cases, however, providing care may also be challenging and caregivers experience distress. Caregiver distress has consequences for the home care client, the informal care provider, and the health care system as a whole ( Cousineau et al, 2003; Mackenzie et al.,,c.s.,2009; Cohen- Mansfield,J. et al.,2009). As a result of distress, caregivers may be unable to continue in their role. If there is no other family member or friend to assume the caregiving, the senior is more likely to require admission to a residential care facility, such as a long-term care or nursing home (Cohen-Mansfield,J. et al.,2009). Initiatives to reduce caregiver burden have the potential to reduce inappropriate or premature admission to residential care (Spillman et al., 2000). Many clinical characteristics have also been found to increase the likelihood of institutionalization. The functional status of the individual has been found to be a strong correlate including: dependence in activities of daily living (Gaugler et al., 2007), cognitive functioning (Luppa, 2010), and dependence on other for assistance with IADLs (Friedman et al, 2005). The presence of chronic conditions such as Parkinson s disease, or Dementia, as well as acute conditions such as a stroke or hip fracture (Nihtilä, 2008) are also key 135
150 variables. Social/emotional variables such as depression (Harris & Cooper, 2006), and the absence of social support have also found to be a strong predictor of admission to a LTC facility (Bharucha et al., 2004). And finally, some studies report low self-reported health to be a strong predictor (Luppa, 2010) suggesting that seniors may have an accurate insight into their own health status (Lundberg & Manderbacka, 1996). Some variables may be strong predictors of discharge to LTC, but may be unable to be altered, such as age or gender. Others may be able to be altered but not without an increase in resources. If LHINs wish to keep SH clients out of LTC beds for a longer period of time, they may need to increase the resourcing to SH sites or increase CCAC services within SH sites. In order to help inform appropriate LTC placement, this chapter will determine the socio-demographic and clinical characteristics of current SH clients that are associated with LTC admission. Specifically, this chapter will determine the variables that influence the number of days a SH client can expect to remain in their SH unit, before being discharged to LTC. In addition, this chapter will determine the characteristics of clients that are associated with time to death because mortality is a competing risk for institutionalization and because it is an important adverse outcome in its own right. 136
151 5.2 Methodology Samples As determined in Chapter 2, clients who receive care from a CCAC are a more impaired population on average than SH clients who do not receive CCAC services. Therefore, it would be expected that a higher proportion of CCAC(RC) clients as compared with No-CCAC(SH) clients, would be discharged to LTC or die within a one year period. However, there is minimal longitudinal data for No-CCAC(SH) clients, so the analyses in this chapter will use RAI-HC data which will assess time to event outcomes for the CCAC(RC) clients only. Of the 306,953 RAI-HC assessments available, 18,784 were identified as persons receiving CCAC services in a residential setting, including supportive housing, and will therefore be included in the analysis in this chapter Data Sources The OACCAC Administrative Database will provide the discharge/death information for each client. The OACCAC database provides the date of death for both clients who died while in a hospital (within 14 days of admittance) and for clients who died while residing in a residential care setting in the community. The dependent variable in the model time to death will include both clients who died in a hospital and those who died while in their residential care setting in the community. The OACCAC database also provides the date on which a client was discharged to a LTC home. It provides a date for discharge to any LTC home, as well as a date for discharge to the client s preferred and final 137
152 LTC home. Time to discharge to LTC will predict discharge from SH rather than the final placement in the LTC home of the client s choice. Discharge from SH is more likely to reflect client characteristics while placement in the LTC home of choice is more likely to reflect bed availability and other non-client specific resourcing within the LHIN. For clients who were discharged from SH directly to their preferred LTC home, the date at which the discharge occurred will count as an event in the analysis. However, for clients who have an initial discharge to a LTC home and then a subsequent transfer to the client s preferred LTC home, the initial discharge date will count as the event for the purpose of the survival analysis (Allison,1995). The discharge/death data were linked to the RAI HC data set using a unique identifier (first 7 digits of the health card number). Gender and birth date were also used to ensure accurate matching. To be included in the analysis, clients must appear in the RAI HC data set between and in the OACCAC discharge database, be receiving CCAC services in a residential care setting (including SH, i.e.cc5=3), and have been admitted to CCAC services. Non-admits will be excluded because they cannot by definition have a discharge date. The RAI HC data will be sorted in a descending order so that the client s last assessment will be used as the unique assessment. Finally, all clients will be considered right censored if they have not experienced the event within one year of their last RAI HC assessment. Other time intervals were considered, but the one year time interval was ultimately chosen to allow for more events to have occurred. However, longer time period 138
153 brings into question whether we can reasonably assume that a client s clinical characteristics at the time of assessment can be considered predictive of the event of interest. Survival analysis includes all clients at risk of the event in the denominator. As time passes the denominator decreases since clients will experience the event and then by definition no longer be at risk of experiencing the event since the events chosen here, LTC or death can only occur once. The hazard ratio, or instantaneous (approximate) risk of the event occurring, will be calculated and reported Analytic Methods Survival models establish how a hazard (or risk) of an outcome of interest, such as discharge to a LTC facility, changes over time at a baseline level of a given covariate (for example, the baseline risk of discharge to LTC among persons in a residential care setting). The model can then be used to describe how this hazard changes as a result of various explanatory variables such as differences in risk of discharge to long term care among persons with mild as compared to high levels of cognitive impairment. A combination of explanatory variables may provide the most accurate estimation of time to event. The survival model is always an estimation of time-to-event recognizing the complexities of determining the exact time at which an individual will experience an event. A more precise level of accuracy can be achieved by careful consideration of the inclusion or exclusion of explanatory variables including appropriate thresholds for ordinal data, multi-colinearity and achieving parsimony. 139
154 Proportional hazards models are one class of survival models. They do not require a- priori judgments on the hazards function. They relate time to an event occurring to one or more explanatory variables, such as age, or functional impairment. They measure the effect of a unit increase in each covariate in relation to the risk of the event of interest. Cantor (1997) uses the example of drugs. Taking one pill each day may halve one s risk of a stroke occurring (event of interest) while taking two pills may reduce the risk even further. Other less commonly used survival models, such as the accelerated failure time model are parametric and require that a probability distribution be specified ahead of time. For the current survival model, bivariate analyses will be used to determine the variables on the RAI HC that are significantly associated with time to discharge to LTC and what variables predict time to death, among CCAC(RC) clients. Variables that are significant at the bivariate level and /or variables that are clinically significant will be considered for inclusion in the multivariate model which will use survival analysis to predict time to event. A separate model will be developed for each outcome of interest. The model fit statistic and the global null hypothesis test will be used to determine whether the model with the covariate and the model with no covariate are significantly different from one another. A likelihood ratio with a p-value of <.05 will be used when determining significance. Proc Lifetest will be used to plot a survival curve (estimated survivor distribution by time) without any covariates. The survival curve will provide an illustration of the proportion of clients who experience the outcome of interest over a one year time period. 140
155 For example, the curve will show the proportion of CCAC(RC) client who have been admitted to LTC after 200 days, or determine the number of days after admission to SH by which 25% of clients have been discharged to LTC. The survival curve will also be used to illustrate the relationship between each potential covariate and the outcome of interest. For example, if CPS is expected to be an important predictor of LTC admission, the survival curve will be plotted predicting LTC admission for clients at each level of the CPS. This will provide a similar plot as described above but with 7 curves (CPS scores of 0-6) on the same graph. If the CPS is a salient variable, the curves will not overlap and a higher proportion of cognitively impaired clients, at a given point in time, would likely be discharged to LTC as compared with cognitively intact clients, for example. The survival curve will also help to inform the need to collapse categories. The log-rank test (Mantel-Haenszel test) will be used to compare the hazard function between groups (e.g. between clients at various levels of the CPS; Allison,1995). This statistical test will determine whether visual differences between groups are statistically significant. Much like a chi-square test, log-rank tests do not indicate where differences lie (between group 1 and 2 or between group 1 and 3 for example), but rather indicate overall differences between the groups. Multivariate models will be developed using Proc TPHREG. Variables that were determined to be statistically significant at the bivariate level will be considered for inclusion in the multivariate model. Parsimony will be achieved while also including 141
156 variables found to be statistically significant. A time to event interval of one year was be chosen for both clinical and statistic purposes. The one year time interval allows each person included in the data set to have an equal opportunity to experience the outcome of interest (death or a nursing home admission) within a one year time period. Clinically, it is useful information to know whether a client may be at a high risk for discharge to LTC within the relatively near future. If clinicians are made aware of persons at high risk for LTC placement, steps can be taken to help reduce that risk, or arrangements can be made to help the transition to be as seamless as possible. Information that provides risk for discharge to LTC several years over prolonged time periods is less useful clinically and of less immediate concern to the individual and his or her family. From a statistical perspective, one year provides enough time in which to experience the event (death or discharge to LTC) before being right censored, among a group whose baseline hazard for LTC is somewhat low. The proportional hazard assumption will be tested by running each variable by time as an interaction term. Non-significance of the interaction term means the assumption has not been violated (Allison,1995) 5.3 Results The RAI HC data set had a sample size of 383,666 unique assessments. Of these assessments, 306,953 remained when the RAI HC was matched with the OACCAC database. Each client in the combined data set had either experienced the event and 142
157 therefore had a date of death or date of admission to LTC, or did not experience the event and was therefore right-censored one year after their last assessment date. Of the 306,953 unique assessments, 18,784 were identified using the CC5=3 item as being a CCAC(RC) client. Of the 18,784 CCAC(RC) clients, 3,857(20.5%) were admitted to a LTC home within one year. Most (N=3,306; 85.7%) were placed in the first available LTC home while only 551(14.3%) were discharged to their final preferred LTC home. The mean number of days to LTC admission from last assessment was (SD=81.7) and the median, being a more accurate measure, was 82 days. Of the 18,784 CCAC(RC) clients, 2,229 (11.9%) died within one year. Most (N=1,750; 78.5%) died while residing in a residential care setting in the community while only 479 (21.5%) died while in the hospital. The mean number of days to death was days (SD=87.3) from last assessment and the median was 89 days. The Kaplan-Meier estimator is the most commonly used method for estimating survivor functions and was used to calculate the survivor distribution shown in Figure 9 and 10 for time to LTC admission and time to death, respectively. Using figure 10, for example, the estimated probability that a client will not yet have been discharged to LTC at day 50 is 92.3%, ( i.e. 7.7% of CCAC(RC) clients in this sample have been discharged to LTC at day 50). A smaller proportion of CCAC(RC) clients have died as compared to the proportion who have been discharged to LTC at a the same point in time. For example, at 50 days 95.7% have not yet died, leaving only 4.3% who have died by day
158 Having plotted the KM curve for each event independent of any client covariates at the time of assessment, bivariate analyses were performed for each outcome of interest in order to determine candidate variables for the final multivariate model. Table 22 present the variables that are associated with time to discharge to LTC at the bivariate level. The parameter estimate (PE) indicates the direction of the relationship and the standard error of the PE is also provided. 144
159 Figure 9: Survivor distribution function: Days to discharge to LTC among CCAC(RC) clients days_to_discharge Legend: Product-Limit Estimate Curve Censored Observations 145
160 Figure 10: Survivor distribution function: Days to discharge to death among CCAC(RC) clients days_to_discharge Legend: Product-Limit Estimate Curve Censored Observations 146
161 The hazard ratio and 95% confidence intervals (CI) are provided as well as the significance value. The model fit statistic and the global null hypothesis test (not shown) confirm that the model with each covariate is different from the model without the covariates. At the bivariate level (see Table 22a and 22b), having bladder incontinence, being dependent on the Self-Reliance Index (SRI), living alone, having more cognitive impairment on the CPS, being more impaired in IADL, having had one or more falls in the previous 90 days, being female, being older, having a higher MAPLe score and being more frail/unstable as measured by the CHESS scale and DASH score are each individually associated with risk of time to LTC admission. The MAPLe algorithm is the strongest predictor of time to admission to LTC. Compared with clients who have a MAPLe score of low or mild (1 or 2), clients with a moderate score have 2.45 the hazard rate of being admitted to LTC. Clients with a high or very high MAPLe score have 3.42 and 4.67 times the hazard rate, respectively, of being admitted to LTC. The MAPLe score is a highly significant (p<.0001) covariate and clients with different MAPLe scores can expect to have different trajectories in terms of time to LTC admission, with high scores being associated with fewer days to admission. The DASH score is also highly significant. Persons determined to be most appropriate for SH have 1.95 the hazard rate, of person determined to be most appropriate for HC, of being admitted to LTC; the hazard rate is 2.90 for persons most appropriate for LTC as compared with appropriate for HC. The MAPLe algorithm and CHESS scales measure very different constructs but are individually good predictors of time to LTC admission. The hazard ratio for each was 147
162 calculated as well as the hazard ratio for the CHESS scale stratified by each level of MAPLe. Significant differences in the hazard ratios increase with each increment increase in the CHESS scale. This pattern remains at each interval of the MAPLe score with the exception of a MAPLe score of 1 or 2. At this level of the MAPLe score, the CHESS scale does not make any significant distinctions. Table 23 presents the final multivariate model for predicting time to discharge to LTC among CCAC(RC) clients. Higher MAPLe scores, more IADL impairment, cognitive impairment, older age, higher levels of incontinence and the DASH score, were included in the final multivariate model. Age is the strongest predictor in the model with those aged 85 years of age or older having an instantaneous risk of discharge to LTC that is 2.88 times higher than that of persons less than 65 years of age. The MAPLe algorithm is also a strong predictor. Persons at very high risk for adverse outcome (MAPLe score of 5) have an instantaneous risk of discharge to LTC that is 2.15 times higher than that of persons at low risk for adverse outcomes (Maple score of 1 or 2). Persons determined to be most appropriate for SH, based on the DASH, have a hazard ratio of 1.20, indicating a 20% higher instantaneous risk of discharge to LTC than persons determined to be most appropriate for HC. 148
163 Table 22a: Candidate variables for a model predicting time to LTC admission (1 year) among persons receiving CCAC services in their residential care setting, including SH Continence SRI 0 1 Living Alone No Yes CPS IADL Capacity Falls 0 1+ Gender Male Female Age < MAPLe CHESS DASH Score HC (score of 1 or 3) SH (score of 2,4 or 5) LTC (score of 6) Bivariate Analysis Predicting Time to LTC Admission Variable PE(SE) Hazard Ratio(CI) Sig (0.04) 0.55(0.04) (0.09) (0.05) (0.07) 0.78(0.05) 1.10(0.05) (0.05) 1.16(0.06) (0.03) (0.04) (0.11) 1.06(0.08) 1.07(0.08) (0.09) 1.23(0.09) 1.54(0.09) (0.04) 0.65(0.04) 0.76(0.05) (0.06) 1.06(0.06) 1.00 ref ( ) 1.73 ( ) 1.00 ref. 2.19( ) 1.00 ref ( ) 1.00 ref. 1.41( ) 2.19 ( ) 3.00 ( ) 1.00 ref. 2.16( ) 3.19( ) 1.00 ref. 1.30( ) 1.00 ref ( ) 1.00 ref. 1.91( ) 2.80 ( ) 2.92 ( ) 1.00 ref ( ) 3.42 ( ) 4.67 ( ) 1.00 ref ( ) 1.92 ( ) 2.13 ( ) 1.00 ref. 1.95( ) 2.90( ) - p <.0001 p < p < p < p <.0001 p <.0001 p < p <.0001 p < p < p = p <.0001 p <.0001 p < p <.0001 p <.0001 p < p <.0001 p <.0001 p < p <.0001 p <
164 Table 22b: Candidate variables for survival model predicting time to LTC admission (1 year) among persons receiving CCAC services in their residential care setting, including SH (continued from Table 22a) CHESS, stratified by MAPLe MAPLe = 1-2 CHESS MAPLe = 3 CHESS MAPLe = 4 CHESS MAPLe = 5 CHESS Variable PE(SE) Hazard Ratio(CI) Sig (0.19) 0.36(0.23) -0.43(0.59) (0.08) 0.53(0.08) 0.65(0.10) (0.07) 0.56(0.07) 0.63(0.09) (0.09) 0.54(0.09) 0.57(0.10) 1.00 ref ( ) 1.40( ) 0.65( ) 1.00 ref ( ) 1.70 ( ) 1.92( ) 1.00 ref. 1.35( ) 1.75 ( ) 1.88( ) 1.00 ref ( ) 1.71( ) 1.77( ) - NS NS NS - p =.005 p <.0001 p < p <.0001 p <.0001 p < p =.0002 p <.0001 p <
165 Table 23: Final survival model predicting time to event (LTC admission within one year) among clients receiving CCAC services in their residential care setting, including SH Final Model Predicting Time to LTC Admission Variable PE(SE) Hazard Ratio(CI) Sig. MAPLe IADL Capacity Age < Continence CPS DASH HC (Score 1 or 3) SH (Score 2, 4 or 5) LTC (Score 6) (0.11) 0.58(0.12) 0.77(0.12) (0.07) 0.57(0.07) (0.10) 1.04(0.08) 1.06(0.08) (0.04) 0.26(0.04) (0.07) 0.44(0.07) 0.59(0.08) (0.08) 0.24(0.09) 1.00 ref. 1.55( ) 1.79( ) 2.15( ) ( ) 1.78( ) 1.00 ref. 2.02( ) 2.83( ) 2.88( ) 1.00 ref. 1.19( ) 1.30( ) 1.00 ref. 1.27( ) 1.55( ) 1.81( ) 1.00 ref. 1.20( ) 1.38( ) - p <.0001 p <.0001 p < p <.0001 p < p <.0001 p <.0001 p < p <.0001 p < p =.0006 p <.0001 p < p = 0.02 p =
166 Table 24 presents the variables that are associated with time to death at the bivariate level. Again, the parameter estimate(pe), standard error (SE), hazard ratio(hr) and 95% confidence intervals (CI) are shown as well as the significance value. The model fit statistic and the global null hypothesis test (not shown) confirm that the model with each covariate is different from the model without the covariates. At the bivariate level, higher levels of frailty/health instability (the CHESS scale), self-reporting being in poor health, more ADL impairment (higher ADL Hierarchy score), decline in ADL in the past 90 days, more admissions to the hospital with an overnight stay within the prior 90 days, being male and being older are each individually associated with an increased risk of time to death. CHESS is the strongest predictor. An increased HR for death occurs with each increment increase in the client s CHESS scale score. Compared with clients who have no health instability (CHESS=0), clients with high levels of health instability (CHESS= 4 or 5) have a HR of Note that clients who are older have a higher hazard for both LTC admission and for death. Table 25 presents the final multivariate model for predicting time to death among CCAC(RC) clients. Higher CHESS scores, self-reported poor health, higher ADL Hierarchy scores, more admissions to the hospital, being male and being older were included in the final multivariate model. Age is the strongest predictor in the model with those aged 85 years of age or older having an instantaneous risk of death than is 4.15 time high that of those less than 65 years of age. All variables are highly significant (p<.0001) with the 152
167 exception of the HR between clients with a CHESS score of 1 as compared with a CHESS score of 2, where the p value is
168 Table 24: Candidate variables for survival model predicting time to death (1 year) among persons receiving CCAC services in their residential care setting, including SH Bivariate Analysis Predicting time to Death Variable PE(SE) Hazard Ratio(CI) Sig. CHESS Self-Report Poor Health No Yes ADL Hierarchy ADL Decline N Y Number of times in hospital Gender Male Female Age < DASH Score HC (score of 1 or 3) SH (score of 2,4 or 5) LTC (score of 6) (0.06) 0.60(0.06) 1.09(0.07) 1.80(0.09) (0.06) (0.05) 0.71(0.06) 1.35(0.07) (0.04) (0.05) 0.82(0.09) (0.05) (0.15) 0.89(0.12) 1.31(0.11) (0.06) 0.51(0.07) 1.00 ref ( ) 1.81 ( ) 2.97 ( ) 6.03( ) 1.00 ref ( ) 1.00 ref. 1.47( ) 2.04( ) 3.85 ( ) 1.00 ref ( ) 1.00 ref. 1.62( ) 2.27( ) 1.00 ref ( ) 1.00 ref ( ) 2.44 ( ) 3.71 ( ) 1.00 ref. 1.27( ) 1.67( ) - p <.0001 p <.0001 p <.0001 p < p < p <.0001 p <.0001 p < p < p <.0001 p < p = p <.0001 p <.0001 p < p= P <
169 Table 25: Final survival model predicting time to event (death within one year) among clients receiving CCAC services in their residential care setting, including SH Final Model Predicting time to Death Variable PE(SE) Hazard Ratio(CI) Sig. CHESS Self-Report Poor Health No Yes ADL Hierarchy Number of times in hospital Gender Male Female Age < (0.06) 0.28(0.07) 0.64(0.08) 1.26(0.10) (0.06) (0.05) 0.57(0.06) 1.32(0.08) (0.05) 0.67(0.10) (0.05) (0.15) 0.99(0.12) 1.42(0.12) 1.00 ref. 1.17( ) 1.33( ) 1.91( ) 3.52( ) 1.00 ref. 1.29( ) 1.00 ref. 1.29( ) 1.77( ) 3.74( ) 1.00 ref. 1.42( ) 1.94( ) 1.00 ref. 0.73( ) 1.00 ref. 2.41( ) 2.72( ) 4.15( ) - p = 0.02 p <.0001 p <.0001 p < p < p <.0001 p <.0001 p < p <.0001 p < p < p <.0001 p <.0001 p <
170 5.4 Discussion The expressed goal of care for many CCAC(RC) clients is to remain independent and out of a LTC facility. SH may have a role to play in helping to keep seniors out of LTC beds until they can no longer be cared for in the community. The challenge is to determine which clinical characteristics put a SH client at a particularly high risk for admission to LTC and then to ascertain whether the resources are available, with the help of CCACs where necessary, to meet those care needs. The literature indicates that many seniors consider their move from home to a SH unit as their final relocation. Others think of SH as a temporary stepping stone with LTC being the inevitable final placement (Stone and Reinhard, 2007). The number of years that a person spends in a residential care unit (including SH), before being discharged to LTC, is likely determined by a combination of client-level characteristics both at admission and over time, and the residential care setting policies around discharge. Clients who are prematurely admitted to a SH unit, for example, may remain in the unit for longer, while those admitted with pre-existing health conditions, may spend only a short period of time in their unit before being discharged to LTC. Moreover, one SH client may be discharged to LTC, while another client with similar clinical characteristics may be allowed to remain in their SH unit as a result of inconsistent discharge criteria between SH buildings or between LHINs. Of course there are also those who will die while residing in SH, never having been discharged to LTC. 156
171 This chapter used survival analysis methods to determine the proportion of CCAC(RC) clients who were discharged from SH to a LTC home and the proportion of CCAC(RC) client who died within one year. Time to event data were used to estimate a predictive model for each event of interest dependent on a number of significant covariates. Within one year, about 1 in 5 CCAC(RC) clients were discharged to LTC; however, time-to-discharge varied substantially as a function of five key covariates. Identifying the clinical characteristics that influence time to discharge can have major implications for SH policy. One implication is the prioritization of limited resources for current CCAC(RC) clients. With limited resources being available, SH may wish to allocate those resources to those at highest risk for LTC admission including bringing in CCAC services. The MAPLe algorithm was designed to prioritize clients and was found to be an important covariate among CCAC(RC) client with higher scores indicating high risk for LTC. The DASH score was also found to be an important covariate. The DASH score provides clinicians with insight into the most appropriate care setting for their current SH clients. Clients who are determined to be most appropriate for LTC based on the DASH score, may require more support or more specialized care in order to remain in their SH unit. For example, they may require an incontinence program or care in a more condition-specific SH building such as for those with cognitive impairment. Another implication is in evidence-based decisions around developing eligibility criteria for SH. For example, cognitive impairment substantially increases a person s risk of LTC placement. If SH is unable to provide care to clients who cannot direct their own care 157
172 due to having a mild to severe cognitive impairment, then eligibility criteria may need to exclude these client from admission. Using the DASH score, for example, persons who are most appropriate for LTC may then be ineligible for admission to a SH unit. Transitions are unpleasant and potentially dangerous for seniors. Eligibility criteria may wish to exclude persons from SH who are expected to require LTC placement within a very short time period of time. A final implication is around individual care planning. Identifying the variables that put a person at risk for LTC may reveal domains in which clinicians can intervene. For example, more independence in IADLs and better bladder control may be achieved through clinical interventions and may in turn reduce the need for discharge to LTC. The interrai assessment instruments have embedded Clinical Assessment Protocols (CAPs) that flag areas of concern and can assist clinicians in individual care planning (Morris, et al., 2010). It is important to note that while identifying the clinical characteristics that influence time to discharge is important, not all characteristics can be altered. Care must be taken to avoid discriminating against those who are at higher risk for LTC admission, such as older clients. While age in itself increases the risk of LTC admission, it is the combination of age and clinical characteristics that is the stronger predictor. Prediction models determine the variables that increase risk of an event, but models cannot measure all variables of importance nor predict with certainly the outcome of any individual client. Clinical characteristics coupled with system-level variables determine care placement decisions. Need for LTC for example, does not ensure that a LTC bed is available. 158
173 SH has been labeled as an alternative to LTC by many in the hopes of having found a way to cope with long wait lists and a declining number of LTC beds. However, discharge to LTC should not be considered a failure, necessarily, of the CCAC in providing quality care to the client in their residential care setting. In fact, bringing in CCAC services to a SH building to support the highest risk clients may help to keep those clients out of LTC for longer. Analyses in this chapter determined that persons with a combination of clinical characteristics and resource availability that made them most appropriate for SH (based on the DASH score) had a higher risk for discharge to LTC than persons determined to be most appropriate to remain at home. This likely reflects the increased risk of discharge to LTC among persons who do not have a family caregiver to provide daily scheduled and unscheduled support. The DASH algorithm clearly shows a divide between clients with a spouse and those without a spouse in terms of appropriate care setting placement. Discharge to LTC may be an inevitable occurrence for many CCAC(RC) clients, and the eventual discharge to LTC may be appropriate in order to provide quality care. As SH is resourced today, few individual will be able to remain in SH indefinitely. SH is not able to prevent increasing age, decline in health as a result of a chronic degenerate disease, or an accidental fall, for example. Finally about 1 in 10 CCAC(RC) clients can expect to die while in their residential care setting, before being discharged to LTC. Likelihood of death is age dependent, but having controlled for age and gender, analyses found 4 key covariates that influence time to 159
174 death. Again, eligibility criteria for SH need to take into account the clinical characteristics of clients for whom SH would be the most appropriate are setting. If a SH building is able to access palliative services through CCACs, then it may be appropriate to accept client who are frail, self report poor health, have severe ADL impairments and have had numerous recent visits to a hospital. The body of literature on client preferences around place of death indicates that the majority prefer to die at home (e.g. Hays, Galinos, & Palmer, 2001). The question remains as to whether SH is considered by clients to be a preferred place of death. The amount of time that the person has spent in the SH unit may in part determine whether he/she identify the unit as home. Persons near the end of life may be very resource intensive and SH may be unable to provide them with care. CCAC support is likely to be required if clients at a high risk for death are admitted to a SH unit. The DASH is a significant predictor of time to death, but is no longer significant when other variables are controlled for. This is an expected outcome given the predictive strength of age, CHESS scale score and ADL impairment. As longitudinal data begins to be collected with the interrai CHA is SH sites, future research will be able to determine the variables that predict time to discharge to LTC and time to death among more typical SH clients. It is expected that SH clients who do not receive CCAC services will be much less likely to be admitted to LTC or to die in a one year period. A longer time interval may be needed in order to allow for more events to occur among this lighter care SH population. Future research may also wish to explore time- 160
175 dependent covariates to determine for example whether a decline in a particular health domain better predicts the outcome of interest. 161
176 CHAPTER 6: Discussion The overall goal of Ontario s Aging at Home Strategy (MOHLTC, 2007b) is to sustain the health care system as the population ages by identifying current and innovative solutions to support seniors in the community. This includes: matching the needs of seniors with appropriate local support services, helping seniors to avoid premature admission to Long-Term-Care (LTC) facilities, supporting family caregivers, and expanding existing community support services, such as supportive housing (SH). This strategy is a clear indication that the Ontario government recognizes the advantages of providing care to seniors in the community and is willing to fund research on the best related strategies. In Ontario, many seniors are able to remain at home, receiving care from family members, friends, and neighbours. Seniors with more complex care needs may be eligible for in-home care from a Community Care Access Centre (CCAC) that provides support with activities of daily living (ADL) or may pay out of pocket for support with instrumental activities of daily living (IADL) from a Community Support Agency (CSA). Traditionally, the focus of the Canada Health Act was on curative care, such as the care provided in hospitals and by physicians. More recently, there has been a shift to a more holistic focus on health care, including proactive health and wellness. The majority of seniors prefer to remain at home where they can maintain their independence, and there is evidence to suggest that providing care to seniors at home may be cost effective (Miller & Weissert, 2007). 162
177 Romanow (2002) recommended including some home care services as medically necessary under the Canada Health Act, including post-acute services and rehabilitation, inhome mental health and palliative care. This shift that took place in Ontario s home care system in 1997 under the CCAC reflected a similar philosophy, with priority given to clients in need of medically necessary services, such as nursing, palliative, and rehabilitation services. As a result, many social home care services fell outside the CCAC mandate, leaving seniors to acquire homemaking and other IADL support from CSAs (Jones, 2007). With a decline in home care services and a changing demographic that may lead to a decline in the availability of family support, seniors in Ontario have been left with few alternatives to LTC facility placement as their health deteriorates. High-income seniors may have more alternatives, such as living in a retirement home or hiring a live-in care provider. However, for most seniors, these alternatives are too expensive. As the population ages, there has been a groundswell of interest in SH as an alternative care setting. Evidenceinformed decisions are needed to help shape SH so that it can help to address many health care system concerns. This dissertation s focus was to determine for whom SH is most appropriate. The following research questions were addressed in order to facilitate evidenceinformed decision making in this rapidly emerging, but poorly understood, sector of the health care continuum. 1. What are the socio-demographic and clinical characteristics of persons currently residing in SH units in Ontario? 163
178 2. How do the profiles of current SH clients differ from the profiles of persons residing in a LTC facility, in a complex continuing care (CCC) unit or hospital, or at home receiving CCAC support? 3. How do the needs of supportive housing client change? 4. What factors are associated with discharge from SH to a LTC facility? The answers to these questions have clear implications for research, clinical practice and health system policy. 6.1 Policy Implications For research Until recently, SH was a care setting in the continuum of care with no available standardized, reliable, valid assessment instrument. In Ontario, this sector relied on homegrown assessment instruments with little-to-no research supporting them, making it impossible to describe who was accessing their services compared with other sectors. Arbitrary decisions around eligibility and discharge criteria for SH have led to the inappropriate placement of clients and confusion over the role SH is to play in the continuum of care. Analyses in this dissertation have clearly indicated the need for a standardized assessment instrument in the SH sector. The interrai Community Health Assessment (inter RAI CHA), is part of a suite of already-mandated assessment instruments 164
179 in Ontario in the home care, LTC, CCC and mental health sectors. It is also part of a new suite of interrai assessment instruments used across Canada and in many countries around the world. The interrai instruments share a common language, conceptual basis and clinical emphasis, and common core elements that allow for apples-to-apples comparisons across the health care continuum. The interrai CHA is a modular instrument with a core set of items and four available supplements. This reduces assessment burden and enables clinicians to target subgroups based on the need for a more detailed assessment. Moreover, interrai is committed to ongoing research on this instrument and its related applications. The community support sector, including SH, is now in the process of implementing the interrai CHA across Ontario. The interrai CHA provides the information needed for clinicians to make evidenceinformed decisions. However, researchers need to ensure that their research is timely and of importance to clinicians. This dissertation focused on research questions informed through a thorough literature review and consultations with clinical specialists from across the health care continuum. In particular, the partnerships between the University of Waterloo and the Mississauga-Halton local health integration network (LHIN), provided the opportunity for research with strong stakeholder input. Focus groups with clinicians from across the continuum, help to identify questions that needed to be addressed around SH policy and identified variables of clinical importance when determining for whom SH is most appropriate. 165
180 Two major challenges were observed in the SH literature. The first is the inconsistency in terminology. In the literature synonymous terms used for SH include assisted living, retirement housing and affordable seniors housing. Assisted living involves the provision of care to a much more impaired population than is found in SH. Retirement homes provide care to higher-income seniors, and affordable seniors housing provides care to persons in financial need with less consideration of health care needs. Therefore, these terms are not synonymous and researchers should be careful to define their population of interest clearly. This will reduce confusion around definitions and the profiles of seniors residing in care settings across the care continuum. The second challenge is the dearth of studies on the longitudinal outcome of SH clients. Cross-sectional research is important, but determining for whom SH is most appropriate requires a measure of longitudinal outcomes. The role of SH in the continuum of care should be based in part by movement into and discharge from SH. These transitions, and the client characteristics and resource availability associated with them, can only be determined through longitudinal data. This dissertation provides information to support eligibility and discharge decision making and determines the variables associated with time to LTC facilities. Researchers may wish to focus future research on other outcomes of importance, such as movement from LTC facilities back to SH, or discharge from SH to hospitals or back into the community. Finally, Bernabei and colleagues (2009) noted the challenge of informing best care practice for seniors based on research and evidence that have tended to exclude seniors from their studies. The interrai instruments have a role to play in providing comprehensive data 166
181 from seniors, on multiple health domains to inform care placement decisions that take into account the many medical and functional complexities of an aging population For clinical practice Focus groups with clinicians in the Mississauga-Halton LHIN from the HC and LTC sectors revealed a lack of awareness of SH as an alternative care setting for seniors. Clinicians indicated that they understood SH to be for persons with a low income or mental health challenges. This was indeed the traditional definition of SH; however, clinicians have not been made aware of the new model of SH as a place to provide care to seniors. This lack of awareness may be contributing to inappropriate placement decisions. CCAC case managers, who determine when clients can no longer remain at home, may place the clients on an LTC waiting list if the managers are unaware of SH as an alternative. Consultation with clinicians during this dissertation process, clearly indicated the need for education into the profiles of persons who would be most appropriately placed in a SH unit. This lack of awareness, combined with a lack of data and evidence, is resulting in arbitrary and inconsistent decisions on the criteria for admission to and discharge from SH. To ensure equity across LHINs and the appropriate placement of seniors, these decisions must be evidence-informed. This dissertation is a first step towards the development of a culture of evidence-informed decision making in the community support sector. The clinical community identifies client-centred care as an important priority. This type of care focuses on the unique needs of the individual. The analyses in this dissertation 167
182 showed that SH clients receive care from multiple community support providers, including the following: on-site care providers, ADL support from a CCAC, and/or IADL support from one or more CSAs. Communication and the sharing of client information, where appropriate, facilitates client-centred care by minimizing assessment burden and extending the circle of care to include all the community support sectors providing care to the individual. The interrai instruments, specifically the interrai scale scores and CAPs, facilitate this process by providing a common language that care sectors can use to communicate with each other. In chapter 3, a decisions algorithm for supportive housing (DASH) was developed using data from the Mississauga-Halton Local Health Integration Network and then validated using a provincial sample of data from clients across the care continuum in Ontario. Analyses for this algorithm identified the availability of an informal caregiver as a key determinant of seniors ability to have their needs met at home. CCACs provide scheduled visits to support seniors at home. However, many seniors have less predictable care needs and require support for short periods of time throughout the day. For example, a CCAC care provider may visit twice a week to help with bathing, or once daily to change a dressing, but assistance with meal preparation, medication management, household tasks, and shopping are left to informal caregivers. In the absence of an informal caregiver, the inability to complete these IADL tasks was identified as a reason for seniors to relocate from their homes. Cognitive functioning was also identified by the DASH as a key predictor of relocating from one s own home to a more intensive care setting. The DASH algorithm was 168
183 not designed to automate decisions around care placement in Ontario, but rather to inform care placement decisions. The development of the DASH began with consultations with clinicians from across the health care continuum. These consultations, along with a comprehensive literature review, helped to inform the variables to consider in the development of the DASH. The longitudinal analysis in chapter 4 of a change in fit revealed that about 20% of current SH clients may be inappropriately placed (about 600 people in Ontario). Moreover, about 2% (or 4000) people in the community are currently appropriate candidates for supportive housing placement. Close to 2000 people currently in LTC beds were also found to be more appropriate for a supportive housing setting. This sheds light on the potential for shifts at the health care system level to ensure that care is being provided in the most appropriate (and least intensive) care setting that can meet a client s care needs. The DASH is a useful tool for decision making in Ontario and clinicians should be encouraged to make use of this algorithm to make evidence-informed placement decisions for their clients. The DASH functions, however, in the context of health system policies. Where supportive housing fits in the continuum of care and the role it is to play is very much dependent on those policy decisions. These policy decisions are jurisdiction-specific. There are some similarities in health policy across Canada including universal care and some form of home support. Further research is required to explore the utility of the DASH algorithm in other jurisdictions both in Canada outside of Ontario, and internationally. There is some evidence to suggest that the items in the DASH score are common predictors of care 169
184 placement decisions: items such as family influences, cognitive and physically functioning. Moreover, the MAPLe algorithm has stood up to internationally scrutiny. The availability of census level interrai data across the care continuum outside of Canada would allow for a similar algorithm to be developed in the USA, for example, to determine the variables that would distinguish a home care, from an assisted living client from a nursing home resident. One final consideration when exploring the generalizability of the DASH in jurisdictions outside of Ontario is around terminology. A nursing home and a long-term care facility are not identical in policy or client mix nor are assisted living and supportive housing clients. Similarly, the home care system in the USA is not directly comparable to the home care system in Canada, or any given province within Canada. Caution is warranted when taking the DASH outside of Ontario, but within Ontario, the DASH algorithm has been carefully developed with input from clinicians and is recommended for use by clinicians to inform placement decisions. In chapter 5 the clinical characteristics of SH clients that are associated with an increased risk of death, LTC admission or decline in quality of life (QoL) were identified. These results provide clinicians with the evidence they require to be better able to predict who may be at an increased risk of these adverse outcomes, and intervene where possible. For example, providing respite or other support to reduce the risk of caregiver burnout and providing IADL support to clients may reduce the need for relocation from home to SH. As well, an incontinence program for persons with mild cognitive impairment may reduce the need for relocation from SH to a LTC facility. 170
185 6.1.3 For health system policy This research provided the opportunity to inform policy decisions related to a developing part of the health care continuum. The Aging at Home Strategy indicated the need for innovative solutions to provide the support needed to help seniors live independently in the community. SH is one such innovation and has the potential to address many of the Aging at Home Strategy goals, including helping to avoid premature admission to LTC facilities. The key to effectively managing the health care system as the population ages is to make evidence-informed decisions around care placement. SH is not a new health care silo, but rather it is now part of the continuum of care. The health care system should strive to provide seamless care to seniors, whether they are receiving care from multiple sectors simultaneously or transitioning between care sectors. Decisions must be made that ensure that the right clients are admitted to SH at the right time, and that discharges take place when needs can no longer be adequately met. As previously mentioned, an integrated health information system, such as the one provided by the interrai assessment instruments, is essential to making evidence-informed decisions and enabling the use of a common language across the continuum of care. The Decision Algorithm for Supportive Housing (SH) can help to inform care placement decisions across the continuum of care. It was developed using data from three interrai assessment instruments, the interrai CHA in supportive housing, the RAI HC in 171
186 home care and the RAI 2.0 in long-term care. The DASH is a strong predictor of current placement decisions in Ontario. There is also preliminary evidence to suggest its utility longitudinally to inform admission and discharge criteria. Care placement decisions should always take resources availability into account as well as the clinical characteristics and need of the individual client. The strongest predictor of appropriate placement in LTC as compared with either HC or SH was the presence of a spouse, a proxy for the availability of an informal caregiver. The MAPLe algorithm is a strong predictor of institutionalization (Hirdes, Poss, & Curtin-Telegdi, 2008) and is widely used in the field for clinical and placement decision making. The MAPLe does not include resource availability in its algorithm to inform care placement decisions. In the DASH algorithm, after presence of a spouse, the MAPLe was the variable that best distinguished between appropriateness for HC versus SH. The DASH strongly indicates that persons with a MAPLe score of no more than moderate priority may stay at home as long as there is caregiver to provide assistance. In the absence of a caregiver, CCACs support may be required to prevent institutionalization, especially among MAPLe=3 clients. In the absence of a spouse, the CPS score (one aspect of the MAPLe), rather than the MAPLe algorithm is the strongest distinguishing variable. Cognitive functioning has been shown throughout this research to be a very important factor in care placement decisions. Eligibility criteria for SH tends to exclude persons with cognitive impairment. This is an appropriate decision given that SH is not currently resourced to care for persons who are 172
187 cognitively impaired. However, the DASH indicates that among person with mild-severe cognitive impairment, bladder incontinence is the driver of LTC placement. Relatively minor changes made in SH, such as a toileting program among persons with moderate cognitive impairment, may reduce relocation from SH to LTC. Dependence in IADLs is a strong predictor of the need to relocate from one s home to a SH unit among persons without a spouse. CCACs are available to provide scheduled ADL support to persons residing at home or in a residential care setting such as SH, but IADL support, which is often less scheduled care, is often provided by a spouse. CCACs do not provide housework and shopping but their role in IADLs should be to notice dependence in these IADL tasks and make a referral to a community support agency. This may decrease the number of seniors who have to leave their own homes because they are unable to vacuum or grocery shop. It is important to keep in mind that for the purpose of policy around eligibility to and discharge from SH, that the DASH score has been designed as a decision support instrument and not an automated means by which to determine these criteria. Care placement decisions should always take clinical expertise and advice into account. Placement decisions are inherently value-based and should take into account current as well as expected future needs and resources, while also considering client and family preference. One unintended consequence of the DASH algorithm is that the tightening of eligibility to supportive housing may constrain access for persons who have legitimate needs not addressed by DASH. In addition to promoting an evidence-based culture across the 173
188 health care system, innovative solutions are needed to support seniors who may now be ineligible for SH. As a result, lighter care clients and those who may have previously been admitted to a SH site due primarily to low-income, rather than high care needs, may no longer be eligible. Persons with light care needs who have a low income and do not have a spouse may be at a particular disadvantage. Other community supports should be explored in order to provide support to these seniors. For example, relocating to a naturally occurring retirement community such as a neighbourhood with other senior or a seniors housing complex may provide these lighter needs clients with an informal support system. CCACs can also provide referrals to community support agencies and volunteer agencies to provide support. Light care clients are not without need, but the evidence shows that SH is not the most appropriate setting in which to provide them with support. Light needs clients tend to be at a low risk for adverse outcomes such as LTC placement and the role of SH should be to support those at moderate to high risk of LTC placement if we are to make a costeffective policy argument for its utility in the continuum of care. Considerations also need to be made for persons who have care needs that exceeded those that can be cared for in a SH setting. SH, as it is resourced today, is not able to provide care to the majority of LTC clients. Long wait lists and challenges in how best to deal with bed-blockers in hospitals, cannot be solved simply by increasing the number of SH units in Ontario. Persons in LTC facilities or awaiting LTC placement, tend to have much more complex care needs than persons residing in SH units, particularly in terms of cognitive functioning. One possible innovation is to design SH for persons with Alzheimer s disease 174
189 or other dementias. Designing SH for subpopulations, such as those with cognitive impairments, may be cost effective. Health care professionals with particular expertise could provide on-site care and potentially reduce the need for relocation to a LTC facility. However, there is evidence to suggest that individuals and their families find conditionspecific care to be isolating. Another innovative solution is to take advantage of a naturally occurring retirement community (NORC) (Hunt, 1980). NORCs are naturally occurring clusters of seniors, as might be found in an apartment complex located near amenities. NORCs limit the need to relocate seniors from their homes to SH, instead bringing SH services to the NORC. This has been shown to be a cost-effective alternative. Housing policy makers should consider exploring NORCs in their area before considering building new apartments to be designated as SH buildings. Depending on the needs of residents, however, SH may be premature. Offering SH services in a building where residents are, for the most part, not yet in need of those services, would not be cost effective. It is important to identify those at risk for relocation and target services carefully. In many ways, NORCs are ideal settings for SH services, both in terms of helping to reduce anticipatory relocation fears of residents (Carpenter et al., 2007) while providing services to help them age in place and avoiding unnecessary costs associated with adapting a seniors apartment complex. Finally, another innovative solution to supporting seniors in the community is to explore partnerships between previously unrelated sectors such as housing and support services. Oswald and Wahl (2004) noted the importance of interdisciplinary research in 175
190 understanding the relationship between these two disciplines. MacDonald, Remus, & Laing (1994) noted that the relationship between health and housing, especially for seniors, has not been well recognized by policy makers. Sheehan (1995) stated that organizations that support seniors must make housing a policy priority. As has been found in SH, the servicehousing interface presents some challenges when considering eligibility and discharge criteria. These criteria may be based on the housing or health service needs of the senior, or a combination of both. A senior with a low income who primarily requires housing, recreational opportunities and transportation to appointments, is best placed in low-income seniors housing, not SH. Also, many seniors sell their home before moving to a SH unit. While this provides the financial means to pay rent, should the health status of the client improve, there is no home for the client to move back to. Finally, SH units are often shared by a husband and wife, only one of whom may be in need of SH services. A decline in the health of one spouse may lead to discharge to LTC, while the other spouse has a need for housing but not for support services. This blocks a unit for a person who is in need of SH services, but the spouse who is well may have nowhere else to live due to having sold his/her home. 6.2 Methodological limitations and challenges A few methodological challenges warrant consideration when interpreting the results of this dissertation. First, census level data are collected in Ontario, from both long stay home care clients, using the RAI-Home Care (RAI-HC) and from complex continuing care 176
191 clients, using the RAI-Minimum Data Set (RAI 2.0). The RAI 2.0 has recently been mandated for use in LTC and the interrai CHA has recently been mandated for use in the community support sector in Ontario, but at the time of data collection for this research, neither the LTC nor SH sectors in Ontario had a mandated assessment instrument. LTC homes that provide RAI 2.0 data may differ from those who do not collect the data voluntarily. Similarly, in SH, sites that chose to participate and collect interrai CHA data likely differ from those who chose not to participate. Also, SH clients who were assessed may have been chosen because they were ready and willing, possibly healthier, or more cognitively intact that those that staff members chose not to assess. This may have led to an overestimation of the health and well-being of SH clients. Secondary analysis of the RAI- HC, and RAI 2.0 provided large sample sizes and census level data, but limited the research to the data element collected as part of normal clinical practice. As a result, a proxy (cc5=3) measures was used to identify person receiving CCAC support in a supportive housing setting. Second, the interrai CHA is part of the new interrai suite of assessments. The HC, LTC and complex continuing care sectors continue to use older versions of the interrai assessment instrument, the RAI-HC and RAI 2.0. Consequently, when making comparison across the care continuum, for individual items, there were a few differences in item response sets. Collapsing categories was sometimes necessary in order to make comparisons between the characteristics of clients in different care settings. For example, the new suite include having a partner or significant other as a response set under marital status. The 177
192 older instruments do not have this option, so in order to compare across sectors partner or significant other was combined with married. These changes were minor and are not expected to have made any significant differences to the findings. Third, there has been comparatively little longitudinal data collected in the SH sector using the interrai CHA data. In order to explore the longitudinal outcomes of SH clients, it was necessary to use a proxy item on the RAI-HC, the item indicating the client resides in assisted living, board and care or a group home. Consequently the variables found to be predictive of time to LTC and decline in quality of life, are those significant among SH clients with CCAC services. This is a small and more impaired sub-population of the more typical SH client. Further research will be needed to determine whether these variables are also associated with adverse outcome among the more typical SH client. Fourth, it was not always possible to collect the interrai assessment data and the staff rating form data on the same day. Therefore, time sensitive questions on the staff rating form may have been in reference to slightly outdated interrai data. Also, not all clients had a staff rating form completed, so possible sampling biases may have been introduced such as selecting those less clinically complex to assess, therefore under-estimating impairment. The staff rating form was developed to enlist staff input around care placement decisions, in an attempt to determine a convergence of opinions on how decisions are being made. While the information is valuable, we should keep in mind that it is opinion based, and that the staff rating form was not tested for reliability or validity. 178
193 Finally, large sample sizes provide the power with which to detect small differences; however, when informing clinical practice around care placement decisions, it is important to consider not only statistical significance, but also clinical significance. Statistical significance refers to whether or not the results of a statistical test meet some accepted criterion level. For example, social scientists we use a p-value as a measure of statistical significance. If the p-value is less than 0.05, an alpha value suggested by R.A Fisher, we conclude that there is a statistically significant difference. We aim to minimize the likelihood of making a Type 1 error, finding a significant difference where one does not exist, i.e. finding a significant difference by chance alone. A p-value of 0.05 leaves a probability that in a set of 20 trials, a significant difference will be found once, by chance, or that you can be 95% certain that a difference found is a true difference. This alpha level is somewhat arbitrary and the researcher can choose to be more conservative and require a higher threshold for statistical significance such as p < Statistical significance is a function of the magnitude of the effect, but can also be a function of sample size, or the reliability of the instrument. Moreover, a statistically significant result may lack clinical significance. Clinical significance refers to a useful or practical meaning for the client or clinician. For example, a 1 point scale score change over a one year time period may be statistically significant, but may make no practical difference to the health and well-being of the client and so would not be clinically significant. It is important to consider both statistical and clinical significance when conducting research with people. The results of a statistical test that holds no practical meaning to 179
194 clients may be disregarded by clinicians. Researchers should partner with clinicians in a process of knowledge exchange to ensure that the right questions are being asked and answered. Knowledge translation should focus on presenting data in a manner that is comprehensible to the audience. When using large data sets, where most variables are significant predictors, clinicians may provide valuable guidance as to which of the statistically significant variables should be included in a predictive model. While clinical input should be respected and considered, situation may arise where clinicians may be intervening to help their clients based on commonly accepted practice rather than established evidence. Statistics may reveal new issues to consider or disprove a commonly accepted practice. However, there may be merit to long standing practices and clinical judgment may not always be easily measurable. Care should be taken to consider possible imperfections in measurement and data analysis as well. Strong statistical models may be able to account for most, but not all of the variance in a particular domain. The variance that is unaccounted for may include variables that are not being measured by the instrument. For example, when predicting admission to LTC, resources availability in the community and client preference are important variables but are not measured. Moreover, variables may be less valid or reliable in a given setting, the skills of a clinician in obtaining the data may vary, or the properties of the items themselves may make some tests less valid than one might hope (Streiner,1993). A statistical model should be considered one piece of the puzzle rather than a completely prescriptive finding. Clinical judgment should be taken into account while taking 180
195 care not to allow poor practice decisions to continue were data evidence can provide better options. A healthy skepticism and respect for both statistics and clinical significance is imperative. Having noted these methodological challenges and limitation the following is a list of clear recommendations based on the finding of this dissertation: 6.3 Recommendations Based on the findings in this dissertation, the following is a list of recommendations that clinicians, policy makers and researchers may wish to consider: Add an item to the interrai CHA that indicates whether a SH client is receiving CCAC services Add an item to the RAI-HC that indicates whether a CCAC client is residing in a SH unit Encourage the community support sector (HC, SH, and CSAs) to work together to provide client-centred care. For example, limit assessment burden where possible for the client, provide continuity of care, and enable access to CCAC services within SH if necessary to prevent or delay discharge to an LTC facility. Focus on the importance of equity. Make sure SH services are available in all LHINs and ensure that persons have equal access to these services. 181
196 Support informal caregivers to keep seniors at home for longer. For example, provide additional CCAC hours to informal caregivers who care for a senior with complex care needs. Increase resources in SH in health domains that have been identified as putting clients at a high risk for LTC. For example, develop incontinence programs for those with mild cognitive impairment. Measure and monitor the quality of life of clients. The role of SH should not only be to prevent institutionalization but also to ensure a high quality of life. Develop evidence-informed eligibility and discharge criteria for SH that takes into account current resource availability. Use evidence to inform care placement decisions, limiting the need for disruptive and potentially dangerous relocation. Consider using the Decisions Algorithm for Supportive Housing (DASH) score as a clinical support instrument to guide decisions making around care placement. Mandate the interrai CHA as the assessment instrument for SH that will facilitate effective communication with other community sectors such as CCACs who share clients. An assessment instrument will allow the SH sector to assess the needs, strengths and preferences of its client today and in the future. This data can help inform care planning, provide comprehensive scale scores in multiple health domains, and inform resource allocation. 182
197 6.4 Future direction for research on supportive housing A number of important questions around SH remain outside of the scope of the current research but warrant consideration for areas of future research. During the data collection process, a number of challenges arose. One key challenge was the sharing of data between the various community agencies from which seniors received supportive services. In some Local Health Integration Networks (LHINs), sharing of information was common place while in other LHINs, CCAC and SH assessments remained separate and the sharing of client information was rare. Privacy of information is of the utmost importance; however, providing client-centred care is also important. Assessing a client with the RAI-HC and the interrai CHA may be necessary if a lot of time has passed or if the client has experienced a major medical change requiring a reassessment. However, there may also be opportunities to share RAI data between sectors, reducing assessment burden and the need to request similar information from the client more than once within a short period of time. Sharing of data between sectors is of the utmost importance when clients are receive care from more than one sector but also as clients transition to a new care sector. This process of data sharing would be simplified if the SH sector had a mandated assessment instrument that was part of the already establish common assessment system in home care and LTC in Ontario. The current dissertation has demonstrated the utility of the interrai CHA for use in assessing SH clients. Further research should explore the interrai CHA in community support agencies, recognising the potential overlap in services and the number of 183
198 clients shared between community support agencies, supportive housing and home care, in Ontario. The current research determined the characteristics of client that were associated with discharge from SH to LTC. There is also potential to discharge a client from a more intensive care setting back to the community. Further research may be able to determine the characteristics of a LTC client or a hospital client that may be associated with positive health trajectories if relocated to a SH setting. This relocation may necessitate changes in resourcing to SH however, in order to care for clients with more intensive care needs. Even so, SH may be a cost-effective alternative, to keeping a lighter care client in LTC or to keeping a hospital-based client in a hospital bed when they no longer require acute care. The cost-effectiveness literature on community support for seniors has focused on comparing the cost of providing care to seniors in LTC with providing services at home. The main methodological challenge in this body of literature is how to account for the cost of informal support in the home. Some studies ignore this cost, other use replacement wages. Another key discussion point in this body of literature, focuses on which services are cost-effective and whether these services reduce the risk of discharge to LTC. Future research should explore the cost-effectiveness of SH in terms of segregated SH (e.g. for person with Alzheimer s disease) versus general purpose SH, and whether to provide care on-site or rely on CCACs and CSAs to care for SH clients. The cost of renting a SH unit, the number of fee-for-service options, co-payments, and the package of services 184
199 offered to clients, are other cost consideration for future research. Cost-effectiveness should include comparisons of cost between SH and LTC but also between SH and HC. Finally, Canada is only one of many countries that are experiencing population aging. Other countries may provide valuable benchmarking opportunities around housing option and policies for seniors. The continuing care retirement community is one such example from the USA, naturally occurring retirement communities, and the growing evidence around agefriendly communities are other areas to explore. Effective management of the health care system will help to ensure that population aging does not overwhelm our capacity to provide support to our seniors. This dissertation has attempted to address and propose solutions to some of the key issues involved in supporting seniors in the care setting that can best meet their needs. It is hoped that this dissertation will inspire further thought and research in this growing area. 185
200 References Alberta s Supportive Living Framework (2007). Retrieved April 28, 2008, from ont.ca/content.aspx?enterpriseid=5&languageid=1&menuid=5 Allison, P.D. Survival Analysis Using SAS: A Practical Guide, SAS Publishing: Allison, P.D. Logistic Regression Using the SAS System: Theory and Application, SAS Publishing:2001. Altman, I. & Low, S.M. (1992). Place Attachment: Human Behavior and Environment. New York, Springer Press. Assisted living Registrar of British Columbia (2004) Assisted living: Information for applicants. Retrieved June 23, 2008, from Assisted Living Federation of America (2009) Accessed July 11, 2010 at: Default.asp Baker, P.M., & Prince, M.J. (1990). Supportive housing preferences among the elderly. The Journal of Housing for the Elderly, 7 (10), Retrieved August, 20, 2008 from 186
201 com/store /toc /J081v07n01_TOC.pdf?sid=B4RN2 MW8QAD19JPL9E6AX7T9QK0JAT6A& Ball, M. M., Whittington, F. J., Perkins, M. M., Hollingsworth, C., King, S. V., & Combs, B. L. (2000). Quality of life in assisted living facilities: Viewpoints of residents. The Journal of Applied Gerontology, 19(3), Ball, M. M., Perkins, M. M., Whittington, F. J., Connell, B. R., Hollingsworth, C., King, S. V., et al. (2004). Managing decline in assisted living: The key to aging in place. The Journals of Gerontology Series B: Psychological Sciences and Social Sciences, 59(4), S Barer, M.L., Evans, R.G., & Hertzman, C. (1995). Avalanche or glacier? Health care and the demographic rhetoric. Canadian Journal on Aging, 14, Berg, K., Finne-Soveri, H., Gray, L., Henrard, J.C., Hirdes, J.P., Ikegami, N, et al. (2009). Relationship between interrai HC and the ICF: Opportunity for operationalizin IACF. BMC Health Services Research, 9,
202 Bernabei, R., Gray, L., Hirdes, J.P., Xiaomei,P., Henrard, J.C., Jonsson, P.V. et al. (2009). Implications of global population aging for health and health care. Geriatric Medicine and Gerontology, 6, Bernabei,R., Landi,F., Onder,G., Liperoti,R. & Gambassi,G. (2008). Second and Third Generation Assessment Instruments: The Birth of Standardization in Geriatric Care. Journal of Gerontology: Medical Sciences, 63A(3), Brandi, J. M., Kelley-Gillespie, N., Liese, L. H., & Farley, O. W. (2004). Nursing home vs. assisted living: The environmental effect on quality of life. Journal of Housing for the Elderly, 18(1), Breiman, L, Friedman, J. H., Olshen, R. A., & Stone, C. J. (1984), Classification and regression trees, Monterey, CA: Wadsworth & Brooks/Cole Advanced Books & Software. Burrows, A., Morris J.N., Simon S, Hirdes J.P., Phillips, C. (2000). Development of a Minimum Data Set-based Depression Rating Scale for Use in Nursing Homes. Age and Aging 29(2): Canadian Home Care Association (2008). Portraits of home care in Canada. 188
203 Canadian Institute for Health Information (2007). Public sector expenditures and utilization of home care services in Canada: Exploring the data. Retrieved April, 20, 2009 from E&cw_topic=730&cw_rel=AR_1648_E Canadian Mortgage and Housing Corporation (2000a). Supportive housing for seniors: Distinct housing needs series. Retrieved August, 20, 2008 from /init.do?language=en&shop=z01en&areaid= &productid= Canadian Mortgage and Housing Corporation (2000b). Research Highlights: Supportive housing for seniors. Retrieved April 15, 2008, from Canadian Mortgage and Housing Corporation (2005). A legal framework for supportive housing for seniors: Options for Canadian policy makers. Retrieved April 15, 2008, from &productID= Castle, N.G. (2001). Relocation of the elderly. Medical Care Research and Review, 58(3)
204 Centre for excellence in assisted living (2007). How does a Nursing Home differ from an Assisted Living Facility or a Continuing Care Retirement Community? Accessed July 10, 2010 at: Chappell, N. & Blandford, A. (1991). Informal and Formal Care: Exploring the Complementarity. Ageing and Society, 11, Chappell, N. L., Dlitt, B. H., Hollander, M. J., Miller, J. A., & McWilliam, C. (2004). Comparative costs of home care and residential care. The Gerontologist, 44(3), Coleman, E.A. (2003). Falling through the cracks: Challenges and opportunities for improving transitional care for persons with continuous complex care needs. Journal of the American Geriatrics Society, 51(4), Coleman, E.A., & Berenson, R.A. (2004). Lost in transition: Challenges and opportunities for improving the quality of transitional care. Annals of Internal Medicine,140, Coleman, E.A. & Boult, C. (2003) Improving the quality of transitional care for persons with complex care needs. Journal of the American Geriatrics Society, 51(4),
205 Coleman, E.A., Parry, C., Chalmers, S., & Min, Sung-Joon (2006). The care transitions intervention: Results of a randomized controlled trial. Archive of Internal Medicine, 166, Community Care Access Centre (2007). Accessed April Canadian Research Network for Care in the Community (2006). In Focus Factsheet: Supportive housing. Retrieved April 25, 2008, from SupportiveHousingOct4Intemplate.pdf Carpenter, B.D., Edwards, D.F., Pickard, J.G., Palmer, J.L., Stark, S., Neufeld, P.S., et al. (2007). Anticipating relocation: Concerns about moving among NORC residents. Journal of Gerontological Social Work, 49(1/2), Challis, D. & Hughes, J. (2002). Frail old people at the margins of care: Some recent research findings. British Journal of Psychiatry, 180, Chappell, N. L., Dlitt, B.H., Hollander, M. J., Miller, J.A., & McWilliam,C. (2004). Comparative costs of home care and residential care. The Gerontologist, 44(3),
206 Canadian Institute for Health Information (2009). Home Care Reporting System RAI-HC Output Specifications: Cipher,D.J. and Clifford, P.A. (2004) Dementia, pain, depression, behavioral disturbances, and ADLs: Toward a comprehensive conceptualization of quality of life in long-term care. International Journal of Geriatric Psychiatry, 19(8), Cooper-Marcus, C. (1995). House as a mirror of self exploring the deeper meaning of home. Berkley CA. Conari Press. Cuba, L., & Hummon, D. M. (1993). A place to call home: Identification with dwelling, community, and region. The Sociological Quarterly, 34(1), Cutchin, M. P. (2005). Spaces for inquiry into the role of place for older people's care. Journal of Clinical Nursing, 14(8B), Cutchin, M. P., Owen, S. V., & Chang, P. F. (2003). Becoming "at home" in assisted living residences: Exploring place integration processes. The Journals of Gerontology Series B, Psychological Sciences and Social Sciences, 58(4), S234-S
207 Cutler, L. J. (2007). Physical environments of assisted living: Research needs and challenges. The Gerontologist, 47(3), Dalby, D.M., Sellors, J.W., Fraser, J.D., Fraser, C., van Ineveld, C., & Howard,M. (2000). Effect of preventive home visits by a nurse on the outcomes of frail elderly people in the community: A randomized controlled trial. Canadian Medical Association Journal, 162(4), Demiris, G. et al., (2006). Facilitating interdisciplinary design specification of smart homes for aging in place, University of Missouri IOS report, accessed Jul 10, 2010: files/papers/demiris/facilitating%20interdisciplinary%20design% 20specification%20of%20smart%20homes%20for%20aging%20in.pdf Despres, C. (1991). The meaning of home: Literature review and direction for future research and theoretical development. Journal of Architectural and Planning Research, 8(2), Dyck, I., Kontos, P., Angus, J., & McKeever, P. (2005). The home as a site for long-term care: Meanings and management of bodies and spaces. Health & Place, 11(2),
208 Fakhoury,W.H.K., Murray,A., Shepherd,G., Priebe,S. (2002). Research in supported housing, Social Psychiatry and Psychiatric Epidemiology, 37(7), Fries B.E, Simon S.E, Morris J.N, Flodstrom C, Bookstein F.L. (2001) Pain in US Nursing Homes: Validating a Pain Scale for the Minimum Data Set. The Gerontologist 41(2): Fries,B.E., Shugarman, L.R., Morris, J.M., Simon, S.E., & James, M. (2002). A screening system for Michigan s home- and community-based long-term care programs, The Gerontologist, 42(4), Fonda, S. J., Clipp, E. C., & Maddox, G. L. (2002). Patterns in functioning among residents of an affordable assisted living housing facility. The Gerontologist, 42(2), Fry, P. S. (2000). Whose quality of life is it anyway? Why not ask seniors to tell us about it? International Journal of Aging & Human Development, 50(4), Frytak, J. R., Kane, R. A., Finch, M. D., Kane, R. L., & Maude-Griffin, R. (2001). Outcome trajectories for assisted living and nursing facility residents in Oregon. Health Services Research, 36,
209 Gallagher, L. P., & Truglio-Londrigan, M. (2004). Community support: Older adults' perceptions. Clinical Nursing Research, 13(1), Gaugler, J. E., & Kahn, R. L. (2007). Families and assisted living. The Gerontologist, 47(3), Golant, S. M. (2004). Do impaired older persons with health care needs occupy U.S. assisted living facilities? An analysis of six national studies. The Journals of Gerontology Series B: Psychological Sciences and Social Sciences, 59(2), S68-S79. Goldscheider, F.K., & Lawton, L. (1998). Family experiences and the erosion of support for intergenerational co-residence. Journal of Marriage and the Family, 60, Gruber-Baldini, A.L, Boustani, M., Sloane, P.D., & Zimmerman, S. (2004). Behavioral Symptoms in Residential Care/Assisted Living Facilities: Prevalence, Risk Factors, and Medication Management. Journal of American Geriatrics Society, 52(10), Guiliani,M.V. (1991). Towards an analysis of mental representation of attachment to the home. Journal of Architectural and Planning Research, 8(2), Haas, W.H., & Serow, W.J. (1993) Amenity retirement migration process: A model and preliminary evidence. The Gerontologist, 33,
210 Harris,Y. Cooper, J.K. (2006). Depressive Symptoms in Older People Predict Nursing Home Admission, Journal of the American Geriatrics Society, 54(4), Hawes, C., & Phillips, C. D. (2007). Defining quality in assisted living: Comparing apples, oranges, and broccoli. The Gerontologist, 47(3), Hawes, C., Phillips, C. D., Rose, M., Holan, S., & Sherman, M. (2003). A national survey of assisted living facilities. The Gerontologist, 43(6), Hawes, C., & Phillips, C.D. (2007). Defining Quality in Assisted Living: Comparing Apples, Oranges, and Broccoli. The Gerontologist, 47 (suppl 1), Hays, J. C. (2002). Living arrangements and health status in later life: A review of recent literature. Public Health Nursing, 19(2), Hays, J.C., Galanos, A.N., Palmer, T.A. et al. (2001). Preference for place of death in a continuing care retirement community. Gerontologist 41 (13), Health Canada (2002). Canada Health Act Overview (2002). Retrieved April 19, 2008, from _care-soinsbk4_e.html 196
211 Health Service Utilization and Research Commission(2000). The Impact of preventive home care and seniors housing on health outcomes. Summary report #14. Retrieved June 15, 2008, from TpF6CY00PDBIzBf0QfLQk UwK4QBZaJuyk8aZKCxz+Q== Hébert,R., Guilbault, J., Desrosiers, J., & Dubuc,N. (2001). The functional autonomy measurement system (SMAF): A clinical-based instrument for measuring disabilities and handicaps in older people. Journal of the Canadian Geriatric Society, 1, Hernandez, M. (2007). Assisted living and residential care in Oregon: Two decades of state policy, supply, and Medicaid participation trends. The Gerontologist, 47(3), Hernandez, M. & Newcomer, R. (2007). Assisted living and special populations: What do we know about differences in use and potential access barriers? The Gerontologist, 47(3), Hirdes, J.P. (2006). Addressing the health needs of frail elderly people: Ontario's experience with an integrated health information system. Age and Aging, 35(4),
212 Hirdes, J.P., & Brown, K.S. (1996). A survival analysis of institutional relocation in a chronic care hospital. Canadian Journal on Aging, 15(4), Hirdes, J.P., Frijters, D., Teare, G. (2003) The MDS CHESS Scale: A New Measure to Predict Mortality in the Institutionalized Elderly. Journal of the American Geriatrics Society 51(1): Hirdes, J.P., Ljunggren, G., Morris, M.N., Frijters, D.H.M., Finne-Soveri, H., Gray,L. et al. (2009). Reliability of the interrai suite of assessment instruments: A 12 country study of an integrated health information system. BMC Health Services Research, 8, Hirdes, J.P., Poss, J.W., & Curtin-Telegdi, N. (2008) The Method for Assigning Priority Levels (MAPLe): A new decision-support system for allocating home care resources. Bio Medical Central Medicine, 6, Hollander, M.J., Miller, JA., MacAdams, M., Chappell, N., & Pedlar, D. (2009). Increasing value for money in the Canadian health care system. Healthcare Quarterly, 12(1), Hollander,M. & Tessaro, A. (2001). Evaluation of the maintenance and preventive model of home care. Retrieved April 2, 2008, from downloads/ preventivehomecarereport.pdf. 198
213 Hunt, M.E. (1991). The design of supportive environments for older people. Journal of Housing for the Elderly, 9(1/2), Iwarsson, S., Wahl, H. W., Nygren, C., Oswald, F., Sixsmith, A., Sixsmith, J., et al. (2007). Importance of the home environment for healthy aging: Conceptual and methodological background of the European ENABLE-AGE project. The Gerontologist, 47(1), Jones, A. (2007). The role of supportive housing for low-income seniors in Ontario. Canadian Policy Research Network Research Report. Retrieved April 3, 2008, from shscorp.ca/ content/research/resources/docscprn _Allison_Jones_ FinalReport.pdf Jones, A. (2007). The role of supportive housing for low-income seniors in Ontario. Canadian Policy Research Network Research Report. Retrieved April 3, 2008, from shscorp.ca/ content/research/resources/docscprn _Allison_Jones_ FinalReport.pdf Joseph, A.E., & Chalmers, A.I. (1995). Growing old in place: A view from rural New Zealand. Health and Place, 1(2),
214 Kahana, E., Lovegreen, L., Kahana, B. and Kahana, M. (2003) Person, environment, and person-environment fit as influences on residential satisfaction of elders. Environment and Behavior, 35(3), Kane, R. A., Chan, J., & Kane, R. L. (2007). Assisted living literature through May 2004: Taking stock. The Gerontologist, 47(3), Kane, R. A., Wilson, K. B., & Spector, W. (2007). Developing a research agenda for assisted living. The Gerontologist, 47(3), Kane, R. L., & Mach, J. R. (2007). Improving health care for assisted living residents. The Gerontologist, 47(3), Karlawish, J.H.T., Casarett, D., Klocinski, J. & Clark, C.M. (2001). The Relationship Between Caregivers' Global Ratings of Alzheimer's Disease Patients' Quality of Life, Disease Severity, and the Caregiving Experience. Journal of the American Geriatrics Society, 49 (8),
215 Kelsey, L.G., Laditka, S.B., & Laditka, J.N. (2010) Caregiver Perspectives on Transitions to Assisted Living and Memory Care, American Journal of Alzheimers Disease and Other Dementia, 25(3), Kissam, S., Gifford, D. R., Mor, V., & Patry, G. (2003). Admission and continued-stay criteria for assisted living facilities. Journal of the American Geriatrics Society, 51(11), Kontos, P.C. (1998). Resisting institutionalization: Constructing old age and negotiating home. Journal of Aging Studies, 12(2), Knight,B.G., Lutzky,S.M.,& Macofsky-Urban,F. (1993).A Meta-analytic Review of Interventions for Caregiver Distress: Recommendations for Future Research. The Gerontologist 33 (2), Koptez, S. et al. (2000). Characteristics and outcomes of dementia residents in an assisted living facility. International Journal of Geriatric Psychiatry, 15(7), Krout, J.A., Moen,P., Holmes, H.H., Oggins,J. & Bowen,N. (2002). Reasons for relocation to a continuing care retirement community. Journal of Applied Gerontology, 21,
216 Landi, F., Tua, E., Onder, G., Carrara, B., Sgadari, A., Rinaldi, C., Gambassi,G., Lattanzio, F., & Bernabei, R. (2000). Minimum Data Set for Home Care: A Valid Instrument to Assess Frail Older People Living in the Community. Medical Care, 38(12), Langa, K. M., Chernew, M. E., Kabeto, M. U., & Katz, S. J. (2001). The explosion in paid home health care in the 1990s: Who received the additional services? Medical Care, 39(2), Lavis et al. (2005). Towards systematic reviews that inform health care management and policy-making. Journal of Health Services Research & Policy, 10, Lawton, M. P. (1985). The Elderly in Context: Perspectives from Environmental Psychology and Gerontology. Environment and Behavior, 17(4), Lundberg, O., & Manderbacka, K. (1996). Assessing reliability of a measure of self-rated health. Scandinavian Journal of Social Medicine, 24(3), Luppa, M., Luck,T., Weyerer,S., König,H., Brähler,E., & Riedel-Heller,S.G. (2010). Prediction of institutionalization in the elderly. A systematic review. Age and Ageing, 39(1), MacDonald, M., Remus,G., & Laing, G. (1994). The link between housing and health in the elderly. Journal of Gerontological Nursing, 20(7),
217 Mackenzie C.S. et al., (2009) et al., Associations Between Psychological Distress, Learning, and Memory in Spouse Caregivers of Older Adults, Journals of Gerontology Series B-Psychological Sciences & Social Sciences, 64(6), Masotti, P.J., Fick, R., Johnson, A., & MacLeod, S. (2006). Healthy naturally occurring retirement communities: A low-cost approach to facilitation health aging. American Journal of Public Health, 96(7), Miller,E.A. & Weissert, W.G. (2007). Predicting elderly people s risk for nursing home placement, hospitalization, functional impairment, and mortality: A synthesis. Medical Care Research and Review, 57(3), Ministry of Health and Long Term Care (1994). Long-term care act. Retrieved October 8, 2008, from Ministry of Health and Long Term Care (2002). Comparing residential care options. Retrieved April 20, 2008, from program/ltc/16_options. html 203
218 Ministry of Health and Long Term Care (2007a). McGuinty Government Transforming Community Living to Help Seniors Live Independently at Home. Retrieved October 8, 2008, from aug/nr_ html Ministry of Health and Long Term Care (2007b). Ontario s aging at home strategy. Retrieved April 19, 2008, from program/ltc/ 33_ontario_ strategy.html Ministry of Health and Long Term Care (2007c). Local Health Integration Networks. Retrieved April 13, 2008, from /lhin_mn.html Ministry of Health and Long Term Care (2007d). Supportive housing. Retrieved April 12, 2008, from program/ltc/13_ housing.html Ministry of Health and Long Term Care (2007e). Overview of care options. Retrieved April 18, 2008, from /ltc/3_overview.html 204
219 Mitchell, J. M., & Kemp, B. J. (2000). Quality of life in assisted living homes: A multidimensional analysis. The Journals of Gerontology Series B: Psychological Sciences and Social Sciences, 55(2), P117-P127. Morris JN, Fries BE, Mehr DR, Hawes C, Philips C, Mor V, Lipsitz L. (1994) MDS Cognitive Performance Scale. Journal of Gerontology: Medical Sciences, 49 (4), M174- M182. Morris JN, Fries BE, Morris SA. (1999) Scaling ADLs within the MDS. Journals of Gerontology: Medical Sciences, 54(11), M546-M553. Morris, J. et al. (2010) interrai Clinical Assessment Protocols (CAPs) for Use with Community and Long-Term Care Assessment Instruments, Homewood & Hebrew Senior Life. Murtaugh, C.M., & Litke, A. (2002). Transitions Through Postacute and Long-Term Care Settings: Patterns of Use and Outcomes for a National Cohort of Elders. Medical Care, 40(3),
220 Neville, P.G. (1999) SAS Institute, Accessed July 10, 2010 at: Decision %20Trees%20for% 20Predictive%20Modeling %20%28Neville%29.pdf Nihtilä,E. (2008). Why older people living with a spouse are less likely to be institutionalized: The role of socioeconomic factors and health characteristics. Scandinavian Journal of Public Health, 36(1), Nihtilä, E. & Martikainen, P. (2008). Institutionalization of Older Adults After the Death of a Spouse. American Journal of Public Health, 98(7), Nihtilä,E.K., Martikainen2,P.T., Koskinen,S.V.P., Reunanen3,A.R., Noro,A.M., & Häkkinen, U.T. (2008). Chronic conditions and the risk of long-term institutionalization among older people. The European Journal of Public Health,18(1), Nishita, C. M., Wilber, K. H., Matsumoto, S., & Schnelle, J. F. (2008). Transitioning residents from nursing facilities to community living: Who wants to leave? Journal of the American Geriatrics Society, 56(1), 1-7. Ontario Community Support Association (2004). About OCSA. Retrieved April 20, 2008, from 206
221 Oswald, F., & Wahl, H. W. (2004). Housing and health in later life. Reviews on Environmental Health, 19(3-4), Oswald, F., Wahl, H. W., Schilling, O., Nygren, C., Fange, A., Sixsmith, A., et al. (2007). Relationships between housing and healthy aging in very old age. The Gerontologist, 47(1), Patterson, C., & Chambers, L. W. (1995). Preventive health care. Lancet, 345(8965), Phillips, C.D., Hawes,C., Spry, K., & Rose, M. (2000). Residents leaving assisted living: Descriptive and analytic results from a national survey. Retrieved September 4, 2008, from daltcp/reports/alresid.htm Phillips, C. D., Munoz, Y., Sherman, M., Rose, M., Spector, W., & Hawes, C. (2003). Effects of facility characteristics on departures from assisted living: Results from a national study. The Gerontologist, 43(5), Pine,P.P., & Pine, V.R. (2002). Naturally occurring retirement community-support service program: An example of devolution. Journal of Aging and Social Policy, 14(3/4),
222 Pruchno, R. A., & Rose, M. S. (2000). The effect of long-term care environments on health outcomes. The Gerontologist, 40(4), RAI Home Care (RAI-HC) Manual, Canadian Version, Second Edition, October 2002 Rockwood,K., Fox, R.A., Stolee, P., Robertson, D., & Beattie,B.L. (1994). Frailty in elderly people: An evolving concept. Journal of the Canadian Medical Association, 150(4), Romanow, R.J. (2002). Home Care the Next Essential Service. Retrieved April 11, 2008, from Chapter_8.pdf Rose, A., de Benedictis, T., Russell,D., & White,M. (2008). A Guide to Nursing Homes Accessed July 15, 2010 at: facilities.htm. Rossen, E.K. & Knafl, K.A. (2007). Women s well-being after relocation to independent living communities. Western Journal of Nursing Research, 29,
223 Sands, L.P., Ferreira, P., Stewart, A.L., Brod, M. & Yaffe, K. (2004). What explains differences between dementia patients and their caregivers ratings of patients quality of life? The American Journal of Geriatric Psychiatry, 12(3), Schaie, K.W., Werner-Wahl,H. Mollenkopf, H., & Oswald, F. (2003). Aging Independently: Living Arrangements and Mobility. Retrieved May 12, 2008, from Segall, A. & Chappell, N.L. (2000) Health and health care in Canada. Toronto: Prentice Hall Press Sergeant, J.F. & Ekerdt, D.J. (2008). Motives for residential mobility in later life: Post-move perspectives of elders and family members. International Journal on Aging and Human Development, 66 (2), Sheehan (1995). Bringing together housing and aging services: The experience of area agencies on aging. Journal of Aging & Social Policy, 7(2), Sixsmith, J. (1986). The meaning of home: an exploratory study of environmental experience. Journal of Environmental Psychology, 6(4),
224 Sixsmith A.J. & Sixsmith J.A. (1991). Transitions in home experience in later life. Journal of Architectural and Planning Research, 8(3), Sloan, F.A., Shayne, M.W., Conover, C.J. (1995). Continuing care retirement communities: Prospects for reducing institutional long-term care. Journal of Health Politics, Policy and Law, 20(10), Sloane, P.D., (2005). Health and Functional Outcomes and Health Care Utilization of Persons with Dementia in Residential Care and Assisted Living Facilities: Comparison With Nursing Homes, The Gerontologist, 45 (s1), Smider, N. A., Essex, M. J., & Ryff, C. D. (1996). Adaptation to community relocation: The interactive influence of psychological resources and contextual factors. Psychology and Aging, 11(2), Social Data Research: in partnership with CMHC and Health Canada. (2006). Searchable database of supportive housing for seniors in Canada. Research Highlight, Socio-economic Series , accessed Jul 10, 2010: CMHC_Searchable_ Database_for_Supportive_Housing_ pdf 210
225 Somerville, P. (1991). The social construction of home. Journal of Architectural and Planning Research, 14(3), Spillman, B.C. & Pezzin, L.E. (2000). Potential and active family caregivers: Changing networks and the 'sandwich generation'. The Milbank Quarterly, 78(3), Spillman, B.C., & Long,S.K. (2009) Does High Caregiver Stress Predict Nursing Home Entry? Inquiry 46,(2), Statistics Canada (1996). Disability-free life expectancy. Retrieved August 20, 2008, from Statistics Canada (2006a). A portrait of seniors in Canada. Retrieved April 10, 2008, from Statistics Canada (2006b). Portrait of the Canadian population in 2006, by age and sex. Retrieved April 9, 2008, from /analysis/ agesex/index.cfm Stefanacci, R. G., & Podrazik, P. M. (2005). Assisted living facilities: Optimizing outcomes. Journal of the American Geriatrics Society, 53(3),
226 Stokes, M.E., Davis, C.A., Koch, G.G. Categorical data analysis using the SAS system, NC:USA, Stone, R. I., & Reinhard, S. C. (2007). The place of assisted living in long-term care and related service systems. The Gerontologist, 47(3), Streiner, D. (1993). A checklist for evaluating the usefulness of rating scales. Canadian Journal of Psychiatry, 38(2) Stuck, A.E., Egger,M., Hammer,A., et al. (2002) Home visits to prevent nursing home admission and functional decline in elderly people: Systematic review and meta-regression analysis. JAMA, 287(8), Thomas,C.P., & Payne, S.M.C. (1998). Home Alone: Unmet Need for Formal Support Services Among Home Health Clients, Home Healthcare Quarterly, 17(2), Thompson, L. G. (2000). Clear goals, solid evidence, integrated systems, realistic roles. Healthcare Papers, 1(4),
227 van Bilsen, P. M., Hamers, J. P., Groot, W., & Spreeuwenberg, C. (2006). Demand of elderly people for residential care: An exploratory study. BioMed Central: Health Services Research, 6 (39), 1-9. van Haastregt, J. C., Diederiks, J. P., van Rossum, E., de Witte, L. P., & Crebolder, H. F. (2000). Effects of preventive home visits to elderly people living in the community: Systematic review. British Medical Journal: Clinical Research Ed., 320(7237), van Rossum, E., Frederiks, C.M., Philipsen, H., Portengen,K., Wiskerke, J., & Knipschild,P. (1993). Effects of preventive home visits to elderly people. British Medical Journal, 307 (6895), Wahl, H. W., & Weisman, G. D. (2003). Environmental gerontology at the beginning of the new millennium: Reflections on its historical, empirical, and theoretical development. The Gerontologist, 43(5), Weissert, W., Chernew, M., & Hirth, R. (2003). Titrating versus targeting home care services to frail elderly clients: An application of agency theory and cost-benefit analysis to home care policy. Journal of Aging and Health, 15(1),
228 Weissert, W.G., & Hedrick, S.C. (1994). Lessons learned from research on effects of community-based long-term care. Journal of the American Geriatric Society, 42, Weissert, W. G., Lesnick, T., Musliner, M., & Foley, K. A. (1997). Cost savings from home and community-based services: Arizona's capitated Medicaid long-term care program. Journal of Health Politics, Policy and Law, 22(6), Wiseman. R.F. (1980). Why older people move: Theoretical issues. Research on Aging, 2, Wilmoth, J.M. (2000). Unbalanced social exchanges and living arrangement transitions among older adults. The Gerontological Society of America, 40(1), Yaffe et al., (2002). Patient and Caregiver Characteristics and Nursing Home Placement in Patients With Dementia, JAMA, 287, Young, H. M. (1998). Moving to congregate housing: The last chosen home. Journal of Aging Studies, 12(2), Zimmerman, S., & Sloane, P. D. (2007). Definition and classification of assisted living. The Gerontologist, 47(3),
229 Zimmerman, S., Sloane, P. D., Eckert, J. K., Gruber-Baldini, A. L., Morgan, L. A., Hebel, J. R., et al. (2005). How good is assisted living? Findings and implications from an outcomes study. The Journals of Gerontology Series B: Psychological Sciences and Social Sciences, 60(4), S Zimmerman et al., (2002). Assisted Living and Nursing Homes: Apples and Oranges? The Gerontologist, 43 (suppl 2),
230 Appendix A: interrai CHA data collected, by LHIN MOHLTC LHIN Identification Number LHIN Abbrev. interrai CHA sites, by LHIN (as of August 31,2009) Data Source 1 Erie St Clair Erie South Essex Community Council, Leamington Primary Care Project 2 South West SW Town and Country, Clinton Primary Care Project 3 Cambridge Home Support Primary Care Project Waterloo WW Luthervillage, Waterloo Primary Care Project Wellington St. Joseph s Health Centre, Guelph Primary Care Project 4 Hamilton Niagara Heidehof Supportive Housing, St HNHB Haldimand Brant Catherine s Primary Care Project 5 Central West CenW N/A N/A 6 Mississauga Halton MH Alzheimer s Society, Peel Joyce Scott Non-Profit Homes, Milton Links2Care Halton Independent Living Participation House Ontario March of Dimes Peel Senior Link India Rainbow Community Services Halton Region Supportive Housing Oakville Senior Citizens Residence Cheshire Homes, Streetsville Nucleus Independent Living Forum Italia Research Grade Software Primary Care Project MH LHIN Project MH LHIN Project MH LHIN Project MH LHIN Project MH LHIN Project MH LHIN Project MH LHIN Project MH LHIN Project MH LHIN Project MH LHIN Project MH LHIN Project 7 Toronto Central TC 8 Central Cen 9 Central East CenE West Toronto Services Community Care East York Baycrest Centre for Geriatric Care CHATS, Aurora York Public Health, Richmond Hill Services for Seniors, St Clair Scarbourough Support Services for the Elderly Community Care City of Kawartha Lakes Research Grade Software Primary Care Project Primary Care Project Primary Care Project Primary Care Project Research Grade Software Primary Care Project Primary Care Project 10 South East SE N/A N/A 11 Champlain Champ N/A N/A 12 North Simcoe Muskoka Simco Helping Hands, Orillia Primary Care Project 13 North East NE Cassellholme, North Bay Research Grade Software 14 North West (NW) NW NW Community Service for Seniors 216 Research Grade Software
231 Appendix B: Staff Rating Form * note: interrai CHA, RAI-HC, and RAI 2.0 removed due to copyright. 217
232 218
233 Appendix C: Staff Rating Form Care Setting Definitions Home with no services Any house, condominium, or apartment in the community, whether owned or rented by the person or another party. Any rented room, for example a resident hotel, whether rented by the person or another person. Also included in this category are retirement communities and individual homes for the elderly or disabled. Home with community support services (excluding CCAC services) Community Support services help maintain safety and independence while living at home. Services are delivered either in the home or in different locations around the community. Organizations that provide these services can be either non-profit corporations or private companies. Community-based services include adult day programs, meal programs, and hospice care. Home with home care (provided by CCAC) Home care services provide a range of health care and support services for eligible residents who have acute, chronic, palliative or rehabilitative health care needs. These services are designed to complement and supplement, but not replace, the efforts of individuals to care for themselves with the assistance of family, friends and community. In-home services, for eligible clients, include home care nursing, rehabilitation, home support and palliative care. 219
234 Supportive Housing Supportive Housing provides 24/7 practical assistance with essential activities of daily living that one cannot perform due to permanent physical limitations or impairments. Supportive Housing is defined as 3 core support activities, including: personal support, attendant care and homemaking. Retirement Home A non-institutional community residential setting that integrates a shared living environment with varying degrees of supportive services of the following types: supervision, home health, homemaker, personal care, meal service, transportation, etc. Group Home / Mental health residence A setting that provides services to persons with physical and intellectual disabilities. Typically, people live in group settings with 24-hour staff presence, but are encouraged to be independent and active as possible. Rehabilitation hospital/unit Rehabilitation is a goal-oriented and often time-limited process, which enables individuals with impairment, activity limitations and participation restrictions to identify and reach their optimal physical, mental, and/or social function level through a client-focused partnership 220
235 with family, providers and the community. Rehab services vary in intensity with inpatient rehab the most intensive and slow stream rehab of lower intensity. Convalescent Care / Restore Program in long term care home Care provided to patients who are clinically stable, do not meet acute care criteria, who have a defined and stable treatment plan, but who require clinical and medical services to transition from acute care to home. They have slower functional restoration than other levels of care, lower tolerance for therapy, and have the functional complexity of multiple health conditions. The goal of convalescent care is for patients to return to a home environment. Long term care home LTC facilities provide 24-hour professional nursing care and supervision in a protective, supportive environment for clients with significant health issues who have complex care needs and require a secure housing/care environment to live safely and with dignity. Complex continuing care hospital/unit Complex Continuing Care is a specialized program of care providing programs for medically complex patients whose condition requires a hospital stay, regular onsite physician care and assessment, and active care management by specialized multidisciplinary teams. The initial plan of care is for patients to achieve functional improvement 221
236 under active interdisciplinary team management, including frequent medical supervision, and transition to a lower care needs environment and or return to their home environment. In-patient psychiatry A hospital caring for persons with psychiatric illness that is separate from other in-patient facilities, such as an acute, rehabilitation, or complex continuing care hospital. Palliative care / Hospice care A hospice facility (or unit within a facility providing more than general care) provides persons who have a terminal illness with a prognosis of less than 6 months to live. The goal of hospice care is to provide comfort and quality of life while assisting the person and family. It targets pain and symptom relief without including the use of life-prolonging treatments. Acute hospital (non-psychiatric) An acute care hospital primarily provides the diagnosis and treatment of acute medical disorders. Examples include general hospitals and specialty hospitals. This category does not include psychiatric wards, psychiatric hospitals, or rehabilitation hospitals. 222
237 Appendix D: Glossary of Terms Acronym/Short Forms Term Description Scale scores embedded in RAI assessment instruments CPS Cognitive Performance Scale A measure of cognitive functioning ADL Activities of daily living A measure of ability to perform ADL IADL Instrumental activities of daily living A measure of ability to perform instrumental ADL DRS Depression Rating Scale A measure of depressive symptoms SRI Self Reliance Index A measure of ability to functional independently MAPLe Method of Assigning Priority Levels A measure that predicts risk of adverse outcomes. CHESS Changes in end-stage disease, and signs and symptoms A measure of risk for serious decline, instability and frailty. CAP Clinical Assessment Protocol Red flags to focus clinician on areas of possible concern for their client Agency acronyms/short forms MOHLTC Ministry of Health and Long Term Care The overall governing body for health care in Canada. LHIN Local Health Integration Network Established by the MOHLTC in April LHINs are responsible for planning, funding and managing health services in their region. There are 14 LHINs in Ontario. MH LHIN Mississauga-Halton Local Health Integration Network One of 14 LHINs located in the Mississauga-Halton area. CMHC Canadian Mortgage and Housing Canada s national housing agency CIHI Corporation Canadian Institute for Health Information 223 A not-for-profit organization that provides health-related data analysis for the purpose of research, tracking, and evidence based decisions making. OACCAC Ontario Association of Community Care Access Centres A not-for-profit corporation representing the 14 CCACs. CCAC Community Care Access Centre Assess persons for eligibility for home care services, admission to LTC and other health support services in Ontario. CCAC(RC) Community Care Access Centre (Residential Care) A subpopulation of CCAC clients who receive care in a residential care setting, including but not limited to supportive housing No CCAC (SH) No Community Care Access Centre Supportive housing clients who do not
238 (supportive housing) receive CCAC services in their residential care unit Acronym Term Description Care Settings acronyms/short forms CSA Community Support Agency Agencies that provide specific services (e.g. meal delivery, transportation to appointments) to clients; may be fee-forservice. HC Home Care Health care services provided in a client s own home. Accessed through a CCAC. SH Supportive Housing A combination of support services and a place of residence. LTC Long Term Care Designed for those who need intensive care and the availability of support 24/7. CCC Complex Continuing Care Provides care for those with medically complex and specialized needs. Assessment Instruments acronyms/short forms interrai CHA interrai Community Health Assessment Part of the suite of newly developed interrai assessment instruments. Designed for use in SH, and with persons receiving CSA services. Modular instrument designed to reduce assessment burden. RAI HC RAI Home Care Mandated for use in Ontario to assess persons receiving home care services for 60+ days. RAI 2.0 Minimum Data Set 2.0 (for LTC and CCC) Mandated for use in Ontario to assess persons receiving care in a CCC hospital/unit and soon to be mandated for use in LTC. 224

239 Appendix E: interrai Assessment Scale Scores 225
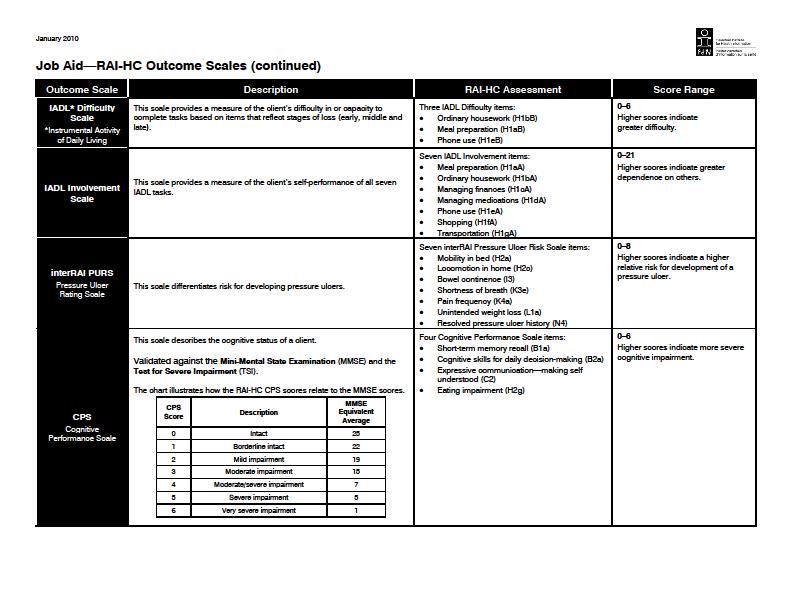
240 226

241 Figure 11: Schematic representation of the MAPLe algorithm 227
242 Appendix F: Clinical Assessment Protocols CAP Name Abbrev. Trigger Options Abusive Relationships cabuse Triggered Level 1- moderate risk Triggered Level 2- high risk Physical Activities Promotion cpactiv Triggered - potential for improvement Instrumental Activities of Daily ciadl Triggered - potential for improvement Living *Activities of Daily Living cadl Triggered Level 1 - prevent decline Triggered Level 2 - facilitate improvement Triggered - both problem(s) with home and individual frailty *Home Environment cenvrio Optimization *Institutional Risk crisk Triggered Cognitive Loss ccognit Triggered Level 1 monitor for risk of cognitive decline Triggered Level 2 - prevent decline *Delirium cdelir Triggered Communication ccommun Triggered Level 1 potential for improvement Triggered Level 2 risk of decline Mood cmood Triggered Level 1- medium risk Triggered Level 2- high risk *Behaviour cbehav Triggered Level 1- prevent almost daily behaviour Triggered Level 2- reduce daily behaviour Informal Support cbritsu Triggered Social Relationships csocfunc Triggered Falls cfalls Triggered Level 1- medium risk Triggered Level 2 - high risk Pain cpain Triggered Level 1 - medium priority Triggered Level 2 - high priority *Pressure Ulcer cpulcer Triggered Level 1 - has stage 2 ulcer or greater Triggered Level 2 - risk of developing stage 2 ulcer Triggered Level 3 - has stage 1 ulcer Cardio-Respiratory ccardio Triggered Dehydration cdehyd Triggered Level 1 - low level Triggered Level 2 - high level *Feeding Tube cfeedtb Triggered Level 1 - some residual cognitive ability Triggered Level 2 - absence of cognitive ability **Prevention cpreven Triggered Level 1 - recent physician visit Triggered Level 2 no recent physician visit *Appropriate Medication cdrug Triggered **Tobacco and Alcohol Use cadd Triggered Urinary Incontinence curin Not Triggered Level 1 - Poor decision making Not Triggered Level 2 - Continent at baseline Triggered Level 1 - Prevent decline Triggered Level 2 - Facilitate improvement *Bowel Incontinence cbowel Triggered Level 1 - risk of decline Triggered Level 2 - facilitate improvement * Only available for CCAC(RC) clients **Only available for No-CCAC(SH) clients. 228
 11. Champlain (Champ) 5. Central West(CenW) 12. North Simcoe Muskoka (Simco) 6. Mississauga Halton (MH) 13. North East (NE) 7. Toronto Central(TC) 14.")
243 Appendix G: Local Health Integration Networks (LHINs) in Ontario 1. Erie St. Clair (Erie) 8. Central(Cen) 2. South West (SW) 9. Central East(CenE) 3. Waterloo Wellington (WW) 10. South East (SE) 4. Hamilton Niagara Haldimand Brant (HNHB) 11. Champlain (Champ) 5. Central West(CenW) 12. North Simcoe Muskoka (Simco) 6. Mississauga Halton (MH) 13. North East (NE) 7. Toronto Central(TC) 14. North West (NW) Source: 229

244 Appendix H: Services provided by CCAC, CSAs and SH in Ontario CCAC Visiting Health Professional Nurse Physiotherapists Occupational therapists Social workers Speech-language pathologists Dietician Referral Personal Care and Support Personal hygiene e.g. bathing Transferring Dressing Assistance with eating Assistance with toileting Supportive Housing Community Support Services Homemaking Menu planning and meal preparation Shopping Light house cleaning and laundry Paying bills or banking Community Support Services Security Transportation Meal services Caregiver Respite and Support Volunteer Hospice Social and recreational services Home maintenance and repair Referral/access services from other agency Services provided Figure 12: Services provided by CCAC, CSAs and Supportive Housing in Ontario (Adapted from MOHLTC, 2007e: Seniors Care: Overview of Care Options) 230
The Use of interrai scales- ways of summarizing interrai data
 The Use of interrai scales- ways of summarizing interrai data Katherine Berg PhD PT Chair, Department of Physical Therapy Chair, Graduate Department of Rehabilitation Science University of Toronto K Berg
interrai Assessment Instruments as Part of Health and Social Service Information Systems
 interrai Assessment Instruments as Part of Health and Social Service Information Systems John P. Hirdes, Ph.D. Ontario Home Care Research and Knowledge Exchange Chair & Professor, Dept of Health Studies
Long-Stay Alternate Level of Care in Ontario Mental Health Beds
 Health System Reconfiguration Long-Stay Alternate Level of Care in Ontario Mental Health Beds PREPARED BY: Jerrica Little, BA John P. Hirdes, PhD FCAHS School of Public Health and Health Systems University
Evaluation of data quality of interrai assessments in home and community care
 Hogeveen et al. BMC Medical Informatics and Decision Making (2017) 17:150 DOI 10.1186/s12911-017-0547-9 RESEARCH ARTICLE Open Access Evaluation of data quality of interrai assessments in home and community
Facility-Based Continuing Care in Canada, An Emerging Portrait of the Continuum
 Facility-Based Continuing Care in Canada, 2004 2005 An Emerging Portrait of the Continuum C o n t i n u i n g C a r e R e p o r t i n g S y s t e m ( C C R S ) All rights reserved. No part of this publication
Assisted Living Services for High Risk Seniors Policy, 2011 An updated supportive housing program for frail or cognitively impaired seniors
 Assisted Living Services for High Risk Seniors Policy, 2011 An updated supportive housing program for frail or cognitively impaired seniors January 2011 (as updated September 2012) Ministry of Health and
Recent Trends Among Ontario Long Stay Home Care Patients and Long Term Care Residents
 Recent Trends Among Ontario Long Stay Home Care Patients and Long Term Care Residents Jeff Poss, PhD Associate Adjunct Professor, School of Public Health and Health Systems and Health Services Research
CARING FOR OUR SENIORS. PEI review of the continuum of care for Island seniors
 CARING FOR OUR SENIORS PEI review of the continuum of care for Island seniors August 25, 2016 TABLE OF CONTENTS EXECUTIVE SUMMARY... 3 1.0 INTRODUCTION... 6 2.0 APPROACH AND METHODS... 7 2.1 Literature
2006 Strategy Evaluation
 Continuing Care 2006 Strategy Evaluation Executive Summary June 2015 Introduction In May 2006, the Department of Health and Wellness (DHW) released the Continuing Care Strategy entitled Shaping the Future
2018 Canadian interrai Conference May 14 17, 2018 CALGARY, ALBERTA CONFERENCE AT A GLANCE HOSTED BY
 2018 Canadian interrai Conference May 14 17, 2018 CALGARY, ALBERTA www.canadianinterrai.org CONFERENCE AT A GLANCE HOSTED BY 2018 CANADIAN interrai CONFERENCE MONDAY, MAY 14 8:30 am - 11:30 am Site Visits
Measuring Quality of Life in LTC: interrai Self-reported Quality of Life Survey for Long Term Care Facilities
 1 Measuring Quality of Life in LTC: interrai Self-reported Quality of Life Survey for Long Term Care Facilities John P. Hirdes, Ph.D., FCAHS Micaela Jantzi, M.Sc. Jenn Bucek, M.Sc. Nancy Curtin Telegdi,
LEVELS OF CARE FRAMEWORK
 LEVELS OF CARE FRAMEWORK DISCUSSION PAPER July 2016 INTRODUCTION In Patients First: A Roadmap to Strengthen Home and Community Care, May 2015, the Ontario Ministry of Health and Long-Term Care stated its
ALLOCATION MODEL INFORMING THE DISTRIBUTION OF AGING AT HOME FUNDS AT THE CENTRAL EAST LOCAL HEALTH INTEGRATION NETWORK
 POPULATION BASED ALLOCATION MODEL INFORMING THE DISTRIBUTION OF AGING AT HOME FUNDS AT THE CENTRAL EAST LOCAL HEALTH INTEGRATION NETWORK May 27, 2009 Prepared by the Centre for Research in Healthcare Engineering
From Clinician. to Cabinet: The Use of Health Information Across the Continuum
 From Clinician to Cabinet: The Use of Health Information Across the Continuum Better care. Improved quality and safety. More effective allocation of resources. Organizations in Canada that deliver mental
Self Report Quality of Life
 Self Report Quality of Life John N. Morris, PhD, MSW IFAR, Hebrew SeniorLife, Boston June 2010 Key Policy Question: How can we improve the lives of persons receiving services in a program? Keys to Quality
Aging in Place: Do Older Americans Act Title III Services Reach Those Most Likely to Enter Nursing Homes? Nursing Home Predictors
 T I M E L Y I N F O R M A T I O N F R O M M A T H E M A T I C A Improving public well-being by conducting high quality, objective research and surveys JULY 2010 Number 1 Helping Vulnerable Seniors Thrive
Waterloo Wellington Community Care Access Centre. Community Needs Assessment
 Waterloo Wellington Community Care Access Centre Community Needs Assessment Table of Contents 1. Geography & Demographics 2. Socio-Economic Status & Population Health Community Needs Assessment 3. Community
Towards Aging at Home
 Balance of Care: Towards Aging at Home Paul Williams, Janet Lum, Kerry Kuluski, Frances Morton, Allie Peckham, Jillian Watkins Presented to CIHR Team in Community Care & Health Human Resources 2009 Symposium,
Canada s Health Care System and Frailty
 Canada s Health Care System and Frailty Frances Morton-Chang, PhD. Post-Doctoral Fellow, IHPME, UofT CIHR Summer Program on Aging May 6, 2016 w w w. i h p m e. u t o r o n t o. c a 2 Objectives Provide
GERIATRIC SERVICES CAPACITY ASSESSMENT DOMAIN 4 ALTERNATE LIVING ARRANGEMENTS
 GERIATRIC SERVICES CAPACITY ASSESSMENT DOMAIN 4 ALTERNATE LIVING ARRANGEMENTS Table of Contents Introduction... 2 Purpose... 2 Serving Senior Medicare-Medicaid Enrollees... 2 How to Use This Tool... 2
Using the InterRAI Data Visualisation
 Using the InterRAI Data Visualisation Contents Page 1: Home Page... 2 Page 2: Summary... 3 Page 3: Demographics... 4 Page 4: Disease Diagnosis... 6 Page 5: Outcome Scales... 10 Page 6: Clinical Assessment
ehealth Ireland Ecosystem members of the ECHAlliance International Ecosystem Network
 ehealth Ireland Ecosystem members of the ECHAlliance International Ecosystem Network The Single Assessment Tool (SAT): A National Clinical Information System to Support Older Persons Care Dr. Natalie Vereker,
The Weight of The Evidence on the Cost- Effectiveness of Home Care and Integrated Care
 The Weight of The Evidence on the Cost- Effectiveness of Home Care and Integrated Care Presented to: Making a World of Difference Conference South West Community Care Access Centre Presented by: Marcus
Health Quality Ontario
 Health Quality Ontario The provincial advisor on the quality of health care in Ontario November 2015 LTC Indicator Review Report: The review and selection of indicators for long-term care public reporting
Canadian Hospital Experiences Survey Frequently Asked Questions
 January 2014 Canadian Hospital Experiences Survey Frequently Asked Questions Canadian Hospital Experiences Survey Project Questions 1. What is the Canadian Hospital Experiences Survey? 2. Why is CIHI leading
Residential aged care funding reform
 Residential aged care funding reform Professor Kathy Eagar Australian Health Services Research Institute (AHSRI) National Aged Care Alliance 23 May 2017, Melbourne Overview Methodology Key issues 5 options
The South West Regional Wound Care Program (SWRWCP): A Collaborative Approach to Wound Care
: A Collaborative Approach to Wound Care") The South West Regional Wound Care Program (SWRWCP): A Collaborative Approach to Wound Care 2017 OACCAC Conference June 15, 2017 #OACON17 I @OACCAC I @SWRWCP Disclosures None Objectives By the conclusion
The South West Regional Wound Care Program (SWRWCP): A Collaborative Approach to Wound Care 2017 OACCAC Conference June 15, 2017 #OACON17 I @OACCAC I @SWRWCP Disclosures None Objectives By the conclusion
Executive Summary. This Project
 Executive Summary The Health Care Financing Administration (HCFA) has had a long-term commitment to work towards implementation of a per-episode prospective payment approach for Medicare home health services,
Improving Quality at Toronto Central LHIN. 2012/13 Year in Review
 Improving Quality at Toronto Central LHIN 2012/13 Year in Review Quality is an integral part of Toronto Central (TC) LHIN s Integrated Health Services Plan 2013-16, reflected in the goal, Better Health
Canadian - Health Outcomes for Better Information and Care (C-HOBIC)
") Canadian - Health Outcomes for Better Information and Care (C-HOBIC) Kathryn Hannah, Executive Project Lead Peggy White, National Project Director NDNQI 4 th Annual Conference January 2010 1 Objectives
Canadian - Health Outcomes for Better Information and Care (C-HOBIC) Kathryn Hannah, Executive Project Lead Peggy White, National Project Director NDNQI 4 th Annual Conference January 2010 1 Objectives
NOVA SCOTIA DEPARTMENT OF HEALTH AND WELLNESS RISK MITIGATION - CONTINUING CARE BRANCH. Caregiver Benefit Program Policy
 NOVA SCOTIA DEPARTMENT OF HEALTH AND WELLNESS RISK MITIGATION - CONTINUING CARE BRANCH Subject: Caregiver Benefit Program Policy Original Approved Date; July 27, 2009 Revised Dates: December 7. 2010/ 0ctober
Transforming Health Care For Seniors in the Mississauga Halton LHIN Right care, right time, right setting, right cost
 Transforming Health Care For Seniors in the Mississauga Halton LHIN Right care, right time, right setting, right cost Narendra Shah COO MH LHIN September 29, 2010 1 Implications of Alternate Level of Care
An Overview of Ohio s In-Home Service Program For Older People (PASSPORT)
") An Overview of Ohio s In-Home Service Program For Older People (PASSPORT) Shahla Mehdizadeh Robert Applebaum Scripps Gerontology Center Miami University May 2005 This report was produced by Lisa Grant
An Overview of Ohio s In-Home Service Program For Older People (PASSPORT) Shahla Mehdizadeh Robert Applebaum Scripps Gerontology Center Miami University May 2005 This report was produced by Lisa Grant
Carers Checklist. An outcome measure for people with dementia and their carers. Claire Hodgson Irene Higginson Peter Jefferys
 Carers Checklist An outcome measure for people with dementia and their carers Claire Hodgson Irene Higginson Peter Jefferys Contents CARERS CHECKLIST - USER GUIDE 1 OUTCOME ASSESSMENT 1.1 Measuring outcomes
Complex Needs Working Group Report. Improving Home Care and Community Services for Individuals with Intellectual Disabilities and Complex Care Needs
 Complex Needs Working Group Report Improving Home Care and Community Services for Individuals with Intellectual Disabilities and Complex Care Needs June 8, 2017 Contents Executive Summary... 3 1 Introduction
A REVIEW OF NURSING HOME RESIDENT CHARACTERISTICS IN OHIO: TRACKING CHANGES FROM
 A REVIEW OF NURSING HOME RESIDENT CHARACTERISTICS IN OHIO: TRACKING CHANGES FROM 1994-2004 Shahla Mehdizadeh Robert Applebaum Scripps Gerontology Center Miami University March 2005 This report was funded
DEPARTMENT OF COMMUNITY SERVICES. Services for Persons with Disabilities
 DEPARTMENT OF COMMUNITY SERVICES Services for Persons with Disabilities Alternative Family Support Program Policy Effective: July 28, 2006 Table of Contents Section 1. Introduction Page 2 Section 2. Eligibility
Time for Transformative Change: CARP Submission to the Advisory Panel on Healthcare Innovation
 Time for Transformative Change: CARP Submission to the Advisory Panel on Healthcare Innovation Healthcare remains the highest priority for Canadians and a more immediate focus as we age. The mandate of
Volunteers and Donors in Arts and Culture Organizations in Canada in 2013
 Volunteers and Donors in Arts and Culture Organizations in Canada in 2013 Vol. 13 No. 3 Prepared by Kelly Hill Hill Strategies Research Inc., February 2016 ISBN 978-1-926674-40-7; Statistical Insights
FUNCTIONAL DISABILITY AND INFORMAL CARE FOR OLDER ADULTS IN MEXICO
 FUNCTIONAL DISABILITY AND INFORMAL CARE FOR OLDER ADULTS IN MEXICO Mariana López-Ortega National Institute of Geriatrics, Mexico Flavia C. D. Andrade Dept. of Kinesiology and Community Health, University
Environmental Scan of Ontario s Behavioural Support Transition Units (BSTUs)
") Environmental Scan of Ontario s Behavioural Support Transition Units (BSTUs) Report Created by the Behavioural Support Transition Unit (BSTU) Collaborative Part of Ontario s Best Practice Exchange June
Environmental Scan of Ontario s Behavioural Support Transition Units (BSTUs) Report Created by the Behavioural Support Transition Unit (BSTU) Collaborative Part of Ontario s Best Practice Exchange June
Read Only and Continuation Notes - User Guide
 https://midland.interrai.health.nz/momentum/mapplogin.aspx Read Only and Continuation Notes - User Guide Introduction to InterRAI Getting Started The first step is to email: interrai@waikatodhb.health.nz
Periodic Health Examinations: A Rapid Economic Analysis
 Periodic Health Examinations: A Rapid Economic Analysis Health Quality Ontario July 2013 Periodic Health Examinations: A Cost Analysis. July 2013; pp. 1 16. Suggested Citation This report should be cited
Home and Community Care at the Champlain LHIN Towards a person-centred health care system
 Home and Community Care at the Champlain LHIN Towards a person-centred health care system Presenter: Kevin Babulic Director, Champlain LHIN - Home and Community Care Outline Who is the Champlain LHIN-Home
Developing ABF in mental health services: time is running out!
 Developing ABF in mental health services: time is running out! Joe Scuteri (Managing Director) Health Informatics Conference 2012 Tuesday 31 st July, 2012 The ABF Health Reform From 2014/15 the Commonwealth
Rapid Recovery Therapy Program. GTA Rehab Network Best Practices Day 2017 Joan DeBruyn & Helen Janzen
 Rapid Recovery Therapy Program GTA Rehab Network Best Practices Day 2017 Joan DeBruyn & Helen Janzen $1 Million Photo credit: Physi-med.org Agenda About the Program Description of the Rapid Recovery Therapy
Caregiving: Health Effects, Treatments, and Future Directions
 Caregiving: Health Effects, Treatments, and Future Directions Richard Schulz, PhD Distinguished Service Professor of Psychiatry and Director, University Center for Social and Urban Research University
Do-not-Resuscitate/Do-not- Hospitalize Orders in Nursing Homes: Are they being done and do they make a Difference?
 Do-not-Resuscitate/Do-not- Hospitalize Orders in Nursing Homes: Are they being done and do they make a Difference? Peter Tanuseputro MHSc (CH&E), MD, CCFP, FRCPC (PHPM) Mathieu Chalifoux MSc Acknowledgements
Elder Services/Programs
 Note: The following applies to Tufts Medicare Preferred HMO and Tufts Health Plan Senior Options members. Program Eligibility/Program Information Possible Services Standard State Home Respite Home Community
Midlife and Older Americans with Disabilities: Who Gets Help?
 Midlife and Older Americans with Disabilities: Who Gets Help? A Chartbook Public Policy Institute by Enid Kassner and Robert W. Bectel Acknowledgements Many individuals were instrumental in bringing this
Advance Care Planning: Goals of Care - Calgary Zone
 Advance Care Planning: Goals of Care - Calgary Zone LOOKING BACK AND MOVING FORWARD PRESENTERS: BEV BERG, COORDINATOR CHANDRA VIG, EDUCATION CONSULTANT TRACY LYNN WITYK-MARTIN, QUALITY IMPROVEMENT SPECIALIST
Quality Improvement Plan (QIP) Narrative for Health Care Organizations in Ontario
 Narrative for Health Care Organizations in Ontario") Quality Improvement Plan (QIP) Narrative for Health Care Organizations in Ontario 3/16/2016 This document is intended to provide health care organizations in Ontario with guidance as to how they can develop
Quality Improvement Plan (QIP) Narrative for Health Care Organizations in Ontario 3/16/2016 This document is intended to provide health care organizations in Ontario with guidance as to how they can develop
Health. Business Plan to Accountability Statement
 Health Business Plan 1997-1998 to 1999-2000 Accountability Statement This Business Plan for the three years commencing April 1, 1997 was prepared under my direction in accordance with the Government Accountability
Looking Back and Looking Forward. A Sneak Peek for the 2018/19 Home Care quality improvement plans (QIPs)
") Looking Back and Looking Forward A Sneak Peek for the 2018/19 Home Care quality improvement plans (QIPs) DANYAL MARTIN LAURIE DUNN NOVEMBER 20, 2017 Learning Objectives Share learnings from the 2017/18
Looking Back and Looking Forward A Sneak Peek for the 2018/19 Home Care quality improvement plans (QIPs) DANYAL MARTIN LAURIE DUNN NOVEMBER 20, 2017 Learning Objectives Share learnings from the 2017/18
LONG TERM CARE LONG TERM CARE 2005 SERVICE STRATEGY BUSINESS PLAN
 TABLE OF CONTENTS A. Background A.1 Preparing the Service Strategy Business Plan... 1 A.2 Key Contacts... 1 A.3 Additional Information... 1 B. Description of Current Services B.1 Program Location Map...
FACTS and TRENDS The Assisted Living Sourcebook 2001
 FACTS and TRENDS The Assisted Living Sourcebook 2001 Facts and Trends is a product of the National Center for Assisted Living s Health Services Research and Evaluation Group Prepared by Kevin Kraditor,
The Centers for Medicare & Medicaid Services (CMS) strives to make information available to all. Nevertheless, portions of our files including
 strives to make information available to all. Nevertheless, portions of our files including") The Centers for Medicare & Medicaid Services (CMS) strives to make information available to all. Nevertheless, portions of our files including charts, tables, and graphics may be difficult to read using
The Centers for Medicare & Medicaid Services (CMS) strives to make information available to all. Nevertheless, portions of our files including charts, tables, and graphics may be difficult to read using
Nucleus Mobile Supports for Daily Living for Seniors
 Nucleus Mobile Supports for Daily Living for Seniors Partner in the Regional Mississauga Halton LHIN Supports for Daily Living Program Presented at OCSA October 19, 2017 by Carole Beauvais The History
Family Caregivers in dementia. Dr Roland Ikuta MD, FRCP Geriatric Medicine
 Family Caregivers in dementia Dr Roland Ikuta MD, FRCP Geriatric Medicine Caregivers The strongest determinant of the outcome of patients with dementia is the quality of their caregivers. What will we
ANCIEN THE SUPPLY OF INFORMAL CARE IN EUROPE
 ANCIEN Assessing Needs of Care in European Nations European Network of Economic Policy Research Institutes THE SUPPLY OF INFORMAL CARE IN EUROPE LINDA PICKARD WITH AN APPENDIX BY SERGI JIMÉNEZ-MARTIN,
Sub-region Geography Data Analysis
 Region Sub-region Geography Data Analysis 1 DEMOGRAPHICS Total Population (2013) 135,972 128,573 Puslinch 7399 # Seniors (65+) 18,669 17,205 Puslinch 1,464 % Seniors (65+) 13.7% 13.4% Puslinch 19.8% %
Sub-region Geography Data Analysis
 Guelph-Puslinch Sub-region Geography Data Analysis 1 DEMOGRAPHICS Total Population (2013) 135,972 Guelph 128,573 Puslinch 7399 # Seniors (65+) 18,669 Guelph 17,205 Puslinch 1,464 % Seniors (65+) 13.7%
Revised: November 2005 Regulation of Health and Human Services Facilities
 Revised: November 2005 Regulation of Health and Human Services Facilities This guidebook provides an overview of state regulation of residential facilities that provide support services for their residents.
Affirming the Value of the Resident Assessment Instrument: Minimum Data Set Version 2.0 for Nursing Home Decision-Making and Quality Improvement
 Healthcare 2015, 3, 659-665; doi:10.3390/healthcare3030659 Article OPEN ACCESS healthcare ISSN 2227-9032 www.mdpi.com/journal/healthcare Affirming the Value of the Resident Assessment Instrument: Minimum
Alberta First Nations Continuing Care Needs Assessment - Health and Home Care Program Staff Survey -
 Alberta First Nations Continuing Care Needs Assessment p. 1 Alberta First Nations Continuing Care Needs Assessment - Health and Home Care Program Staff Survey - Definition of Terms Continuing Care: As
Access to Health Care Services in Canada, 2003
 Access to Health Care Services in Canada, 2003 by Claudia Sanmartin, François Gendron, Jean-Marie Berthelot and Kellie Murphy Health Analysis and Measurement Group Statistics Canada Statistics Canada Health
Better at Home. 3 Ways to Improve Home and Community Care in Ontario. Recommendations to meet the changing needs of clients
 Better at Home 3 Ways to Improve Home and Community Care in Ontario Recommendations to meet the changing needs of clients Ontario Community Support Association 2018 Contents Introduction 01 Impacting clients,
BruyÈre centre for learning, research and innovation in long-term care
 BruyÈre centre for learning, research and innovation in long-term care Increase the knowledge and skills of our workforce Enhance the quality of care provided to LTC residents Assist in shaping the LTC
Kerry Hoffman, RN. Bachelor of Science, Graduate Diploma (Education), Diploma of Health Science (Nursing), Master of Nursing.
, Diploma of Health Science (Nursing), Master of Nursing.") A comparison of decision-making by expert and novice nurses in the clinical setting, monitoring patient haemodynamic status post Abdominal Aortic Aneurysm surgery Kerry Hoffman, RN. Bachelor of Science,
A comparison of decision-making by expert and novice nurses in the clinical setting, monitoring patient haemodynamic status post Abdominal Aortic Aneurysm surgery Kerry Hoffman, RN. Bachelor of Science,
Long-Term Services & Supports Feasibility Policy Note
 Long-Term Services and Supports Feasibility Study Department of Political Science, College of Social Sciences University of Hawai i - Mānoa Policy Note 7 Long-Term Services & Supports Feasibility Policy
Trends in Family Caregiving and Why It Matters
 Trends in Family Caregiving and Why It Matters Brenda C. Spillman The Urban Institute Purpose Provide an overview of trends in disability and informal caregiving Type of disability accommodation Type of
Common Caregiver Public Policy Initiatives: Support for caregivers, support for health system
 Common Caregiver Public Policy Initiatives: Support for caregivers, support for health system A caregiver is anyone who provides unpaid care and support at home, in the community or in a care facility
UNDERSTANDING DETERMINANTS OF OUTCOMES IN COMPLEX CONTINUING CARE
 UNDERSTANDING DETERMINANTS OF OUTCOMES IN COMPLEX CONTINUING CARE FINAL REPORT DECEMBER 2008 CO PRINCIPAL INVESTIGATORS 1, 5, 6 Ann E. Tourangeau RN PhD Katherine McGilton RN PhD 2, 6 CO INVESTIGATORS
Nursing Practice In Rural and Remote Ontario: An Analysis of CIHI s Nursing Database
 Nursing Practice In Rural and Remote Ontario: An Analysis of CIHI s Nursing Database www.ruralnursing.unbc.ca Highlights In the period between 2003 and 2010, the regulated nursing workforce in Ontario
Disparities in Primary Health Care Experiences Among Canadians With Ambulatory Care Sensitive Conditions
 March 2012 Disparities in Primary Health Care Experiences Among Canadians With Ambulatory Care Sensitive Conditions Highlights This report uses the 2008 Canadian Survey of Experiences With Primary Health
Health Links: Meeting the needs of Ontario s high needs users. Presentation to the Canadian Institute for Health Information January 27, 2016
 Health Links: Meeting the needs of Ontario s high needs users Presentation to the Canadian Institute for Health Information January 27, 2016 Agenda Items Health Links: Overview and successes to date Critical
Prince Edward Island s Healthy Aging Strategy
 Prince Edward Island s Healthy Aging Strategy February 2009 Department of Health ONE ISLAND COMMUNITY ONE ISLAND FUTURE ONE ISLAND HEALTH SYSTEM Prince Edward Island s Healthy Aging Strategy For more information
Access to Health Care Services in Canada, 2001
 Access to Health Care Services in Canada, 2001 by Claudia Sanmartin, Christian Houle, Jean-Marie Berthelot and Kathleen White Health Analysis and Measurement Group Statistics Canada Statistics Canada Health
Meeting Future Need Through Specialization in LTC Homes
 Meeting Future Need Through Specialization in LTC Homes CLRI Conference November 9, 2015 Presenters: Amy Porteous and Zsófia Orosz Presenter Disclosure 2 Research Team: Amy Porteous, Bruyère Continuing
DA: November 29, Centers for Medicare and Medicaid Services National PACE Association
 DA: November 29, 2017 TO: FR: RE: Centers for Medicare and Medicaid Services National PACE Association NPA Comments to CMS on Development, Implementation, and Maintenance of Quality Measures for the Programs
Dual Eligibles: Medicaid s Role in Filling Medicare s Gaps
 I S S U E P A P E R kaiser commission on medicaid and the uninsured March 2004 Dual Eligibles: Medicaid s Role in Filling Medicare s Gaps In 2000, over 7 million people were dual eligibles, low-income
Health and Long-Term Care Use Patterns for Ohio s Dual Eligible Population Experiencing Chronic Disability
 Health and Long-Term Care Use Patterns for Ohio s Dual Eligible Population Experiencing Chronic Disability Shahla A. Mehdizadeh, Ph.D. 1 Robert A. Applebaum, Ph.D. 2 Gregg Warshaw, M.D. 3 Jane K. Straker,
FY17 LONG TERM CARE RISK ADJUSTMENT
 HEALTH WEALTH CAREER FY17 LONG TERM CARE RISK ADJUSTMENT STATE OF NEW YORK DEPARTMENT OF HEALTH September 21, 2016 Presenter Denise Blank Ron Ogborne FY17 LTC RISK ADJUSTMENT AGENDA Highlight changes made
Predicting use of Nurse Care Coordination by Patients in a Health Care Home
 Predicting use of Nurse Care Coordination by Patients in a Health Care Home Catherine E. Vanderboom PhD, RN Clinical Nurse Researcher Mayo Clinic Rochester, MN USA 3 rd Annual ICHNO Conference Chicago,
MDS 3.0: What Leadership Needs to Know
 MDS 3.0: What Leadership Needs to Know especially prepared for CANPFA Ann Spenard RN, MSN History of the MDS and RAI Process The Resident Assessment Instrument (RAI) was part of a set of reforms enacted
Full-time Equivalents and Financial Costs Associated with Absenteeism, Overtime, and Involuntary Part-time Employment in the Nursing Profession
 Full-time Equivalents and Financial Costs Associated with Absenteeism, Overtime, and Involuntary Part-time Employment in the Nursing Profession A Report prepared for the Canadian Nursing Advisory Committee
FRENCH LANGUAGE HEALTH SERVICES STRATEGY
 FRENCH LANGUAGE HEALTH SERVICES STRATEGY 2016-2019 Table of Contents I. Introduction... 4 Partners... 4 A. Champlain LHIN IHSP... 4 B. South East LHIN IHSP... 5 C. Réseau Strategic Planning... 5 II. Goal
THE PITTSBURGH REGIONAL CAREGIVERS SURVEY
 THE PITTSBURGH REGIONAL CAREGIVERS SURVEY S U M M A R Y R E P O R T E X E C U T I V E S U M M A R Y Nearly 18 million informal caregivers in the United States provide care and support to older adults who
Behavioural Supports Ontario (BSO)
") Behavioural Supports Ontario (BSO) What does it mean for you? Laurie Fox HNHB BSO Project Implementation Lead Hamilton Health Sciences With I am who I am, so help me continue to be me Dana Vladescu, Manager,
Behavioural Supports Ontario (BSO) What does it mean for you? Laurie Fox HNHB BSO Project Implementation Lead Hamilton Health Sciences With I am who I am, so help me continue to be me Dana Vladescu, Manager,
Ontario Mental Health Reporting System
 Ontario Mental Health Reporting System Data Quality Documentation 2016 2017 All rights reserved. The contents of this publication may be reproduced unaltered, in whole or in part and by any means, solely
Health Quality Ontario
 Health Quality Ontario The provincial advisor on the quality of health care in Ontario November 15, 2016 Under Pressure: Emergency department performance in Ontario Technical Appendix Table of Contents
Medicare: This subset aligns with the requirements defined by CMS and is for the review of Medicare and Medicare Advantage beneficiaries
 InterQual Level of Care Criteria Subacute & SNF Criteria Review Process Introduction InterQual Level of Care Criteria support determining the appropriateness of admission, continued stay, and discharge
transitions in care what we heard
 transitions in care what we heard Early in 2018, Health Quality Ontario asked Ontarians a simple question: what affected your transition from hospital to home? Good and bad. Big and small. We wanted to
ADULT LONG-TERM CARE SERVICES
 ADULT LONG-TERM CARE SERVICES Long-term care is a broad range of supportive medical, personal, and social services needed by people who are unable to meet their basic living needs for an extended period
Critical Review: What effect do group intervention programs have on the quality of life of caregivers of survivors of stroke?
 Critical Review: What effect do group intervention programs have on the quality of life of caregivers of survivors of stroke? Stephanie Yallin M.Cl.Sc (SLP) Candidate University of Western Ontario: School
UNDERSTANDING CAREGIVER BURDEN AND HOSPITAL USE AMONG OLDER HOME CARE RECIPIENTS IN NOVA SCOTIA. Ashley Chisholm
 UNDERSTANDING CAREGIVER BURDEN AND HOSPITAL USE AMONG OLDER HOME CARE RECIPIENTS IN NOVA SCOTIA by Ashley Chisholm Submitted in partial fulfillment of the requirements for the degree of Master of Science
Workload Models. Hospitalist Consulting Solutions White Paper Series
 Hospitalist Consulting Solutions White Paper Series Workload Models Author Vandad Yousefi MD CCFP Senior partner Hospitalist Consulting Solutions 1905-763 Bay St Toronto ON M5G 2R3 1 Hospitalist Consulting
PROGRAM EVALUATION GRANT AWARD 2006 GOAL SETTING AND CAFAS EVALUATION Program Evaluation Grant #
 1 Program Description: PROGRAM EVALUATION GRANT AWARD 2006 GOAL SETTING AND CAFAS EVALUATION Program Evaluation Grant # 162606-051 As a non-profit Children s Mental Health Center with a long history of
Examining Variation in Access to Long-term Home Care Services for Ontario Seniors
 Examining Variation in Access to Long-term Home Care Services for Ontario Seniors By Erin Elizabeth Patterson A thesis submitted in conformity with the requirements for the degree of Doctor of Philosophy