E. Network Special Projects/Studies
|
|
|
- Karen Smith
- 6 years ago
- Views:
Transcription
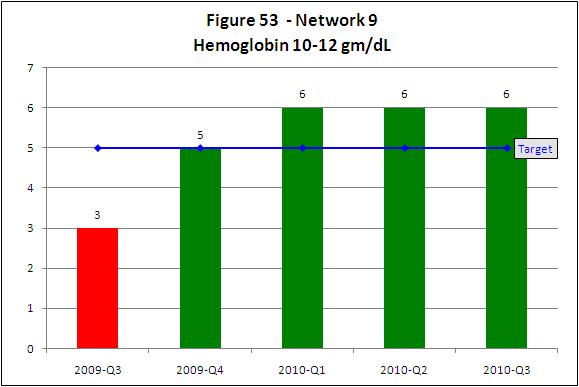
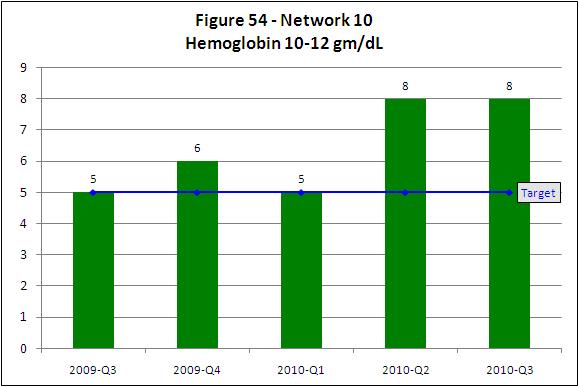
1 E. Network Special Projects/Studies Projects completed during 2010 included the following activities Anemia Management QIP The following activities were designed as components of the quality improvement project to increase the percentage of patients in the target zone (10-12 gm/dl) for hemoglobin. Nine dialysis facilities in Network 9 and nine facilities in Network 10 were included in this QIP as part of the CPM project of the Quality Improvement Work Plan (QIWP). This QIP addressed the problem of a continuing low percentage of patients within the hemoglobin target range of gm/dl as defined in the erythropoietin product literature, KDOQI guidelines, and recommendations by CMS. This project addressed the lack of understanding within facilities of the differences between individual hemoglobin variability and population variability. In order to achieve the maximum percentage of patients within the newly identified target range of gm/dl facilities need to achieve mean hemoglobin of 11.0 gm/dl. In order to maximize the percentage of patients within the target, facilities need to avoid a situation where they will over correct for hemoglobin values outside the target range by too frequently altering the ESA dose in the mistaken belief that they can eliminate all patients either above 12.0 or below 10.0 gm/dl. Networks 9 and 10 determined the 95% confidence interval (CI) around the percentage of patients within the target range so that facilities could judge how well they were performing in comparison to the Network adjusting for facility size. Based on the analysis of 22,000 individual hemoglobin measurements in December 2003, for the average dialysis facility, 55.9% of patients can be expected to fall within the target range in any one month period. This value is based on facilities achieving mean hemoglobin of 11.0 gm/dl. In May 2009, staff and MRB members conducted a root cause analysis. Based on information provided in the RCA and the expertise of MRB members, five barriers were identified to reaching goal: 1. Lack of awareness and understanding of the new FDA hemoglobin target range of gm/dl. 2. Failure to adapt ESA and iron dosing algorithms to new hemoglobin target range.
2 3. Lack of awareness that based on the underlying distribution of the hemoglobin concentration in the population (all patients in the Network), one can reasonably expect to see specific percentages outside the target range and that this is dependent on facility size. 4. Impact of stops and holds of ESA doses vs. dosage reductions on variability within facilities. 5. Contribution of hospitalizations to increased variability resulting in an increased proportion of patients outside the target range. The intervention included all of the following: 1. Facilities were notified that they have been identified for inclusion in the project. 2. With the help of Network staff facility staff conducted an RCA to identify barriers to increasing the percent of patients in the hemoglobin target zone. Interventions designed to address each barrier included: a. The medical director and anemia management nurse at each participating facility received four resources: - FDA Statement on ESAs along with revised Network 9/10 goal for Anemia Management - Facility specific anemia data report based on 2008 Elab data with regional comparatives - The Table of Expected Hemoglobin Rates and instructions for use - MRB Recommendations to Medical Directors on achieving hemoglobin targets b. The anemia management nurse received an excel spreadsheet that can be used to track monthly hemoglobin, ESA dose, TSAT, ferritin, iron dose, and hospitalizations. This spreadsheet allows the intervention facilities to calculate monthly average hemoglobin and the variability of this hemoglobin, percentage of patients within the target range as well as the percentage of patients both above 12 gm/dl and below 10 gm/dl. c. The medical director and anemia nurse were asked to determine if the percentages that they observed were similar to what they should expect using the Table of Expected Hemoglobin Rates. d. The anemia management nurse was asked to provide facility anemia management protocols to the Network (ESA and iron dosing algorithms). e. The MRB evaluated the facility ESA dosing algorithm using a tool written in Matlab. (This tool tests the robustness of the ESA algorithm by dosing 80 simulated patients). Additionally, using this Matlab tool provides a
3 determination of what hemoglobin the facility should target using their ESA algorithm. This provides a comparison of the results of this process to ESA algorithms from facilities that are performing well. f. The MRB evaluated the results of Matlab simulation for each facility along with their protocols for ESA and iron dosing in order to make recommendation for improvement. g. Anemia management nurses provided QAPI minutes to the Network quarterly for review of activities/changes related to anemia management process. h. The Network provided one on one technical support for changes to anemia management protocol. Goals and timeline for the Anemia Management QIP were: To increase the percentage of patients in targeted facilities with hemoglobin gm/dl to at least the Network 9/10 mean by March 31, Network 9 - at least five out of the nine intervention facilities will increase the percentage of patients with hemoglobin gm/dl to at least 57.5% by March 31, Network 10 - at least five out of the nine intervention facilities will increase the percentage of patients with hemoglobin gm/dl to at least 55.9% by March 31, Results: The Anemia Management QIP was successful in both Networks 9 and 10. Both Networks met the goal that was set for March 2010 and sustained improvement through September Figure 53 and Figure 54 display the results of this project at the end of the project, March 2010 and for six months after (September 2010) for Network 9 and Network 10.
4
5 Phosphorus Management QIP - The following activities were designed as components of the quality improvement project to increase the percentage of patients in the target zone ( gm/dl) for phosphorus. Sixteen dialysis facilities in Network 9 and 13 facilities in Network 10 were included in this QIP as part of the Network Specific project of the Quality Improvement Work Plan (QIWP). Phosphorus control is defined as serum phosphorus between 3.5 and 5.5 mg/dl. High serum phosphorus levels are associated with increased morbidity and mortality. Hyperphosphatemia also is involved in causing atherosclerotic heart disease, secondary hyperparathyroidism, and bone disease in renal patients. A quality improvement project was developed aimed at increasing the serum phosphorus percentage in the mg/dl range in dialysis patients using an educational program to reduce dietary intake of phosphate additives. The results of testing the proposed educational program were reported by Sullivan et al. in JAMA in February 2009 (JAMA. 2009; 301(6): ). The amount of phosphorus in the American diet has increased considerably, primarily from phosphorus-containing additives in convenience and ready to eat foods. Education regarding high phosphorus foods is a key component of hyperphosphatemia management, but the use of hidden phosphorus additives may make it difficult for patients and dietitians to estimate phosphorus content of foods. It has been suggested that hyperphosphatemia is a nutritional barrier to preventing renal bone disease and cardiovascular mortality and that an intervention focusing on phosphate containing food additives has great potential. In May 2009, the MRB conducted a root cause analysis. Based on the experience and discussion of the MRB membership, reasons for increased phosphorus were identified: Most of the public at large as well as dialysis patients are unaware of phosphorus additives in fast and processed foods. There is an increase in eating fast foods due to convenience and economics. Phosphorus is unseen and tasteless so patients are unaware of its presence in foods. Due to increased phosphorus intake patients can be prescribed many binders which can be cost prohibitive.
6 Dietitians have a larger number of patients to follow and educate with no specific tools or resources to assist in the education. The following barriers to controlled phosphorus were identified: 1) Patients are not aware of phosphorus additives in foods 2) There is a high reliance on fast foods and convenience food items 3) Insufficient RD time to adequately educate patients with inadequate educational materials available 4) Phosphate binder non-adherence due to large doses and inability to afford binders The design and methodology of this QIP was modeled after a project design reported in JAMA 2009;301(6): This project translates the method of a successful research intervention as described in the literature (JAMA) into clinical practice. It also provides the dietitian with educational tools to assist the patient with making appropriate and healthy food choices. Facility dieticians received the following for their own use: - A report detailing the percentage of patients with phosphorus greater than 5.5 mg/dl based on the th quarter lab data. Facility dieticians received the following materials to provide to patients: - label reading instructions - pocket magnifier to assist in reading fine print on nutrition labels - list of phosphate additives to avoid - lists of fast foods to avoid and recommended alternative fast foods In the course of two educational sessions, dietitians instructed patients on how to read nutrition facts panels and ingredient lists to determine if foods contain phosphate additives. Dietitians determined which fast food restaurants are used by each patient and provided lists of additive-containing and additive-free (and appropriate for renal diet) foods at the restaurant. Patients were advised and encouraged to select phosphorus additive-free menu items at supermarkets and restaurants. All participating facilities took part in the following interventions: 1. Dietitians were trained in the project methodology via an in-person training session held in a central location within the Network 9/10 region.
7 2. Dietitians provided the Network with a list of patient names and patient serum phosphorus levels for the current month as baseline. 3. The following interventions took place during the six month project period: a. Patients received education materials describing: - phosphorus additives and their effect on the phosphorus content of foods; - a listing of common phosphorus additives; - a pocket magnifier; - fast food restaurant-specific handouts listing additive-containing foods to avoid and additive-free foods that are reasonable to include in the renal diet. The educational materials and educational sessions with the dietitian informed the patients of the hidden phosphorus additives. Patients were educated on how to use the tools provided to identify the hidden phosphorus additives in fast foods and grocery stores in order to make more appropriate food choices. b. Patients were instructed to use the materials when shopping or eating out to avoid phosphorous additives. Using the educational materials provided, dietitians instructed patients on the following: - The phosphorus content of foods (naturally occurring and phosphorusbased food additives) - How to read labels to identify presence of phosphorus-based food additives - The phosphorus content and additives in fast food menu items - How to limit foods containing naturally occurring phosphates, avoid foods containing phosphorus-based food additives, and alter fast food purchases (if applicable) c. Providing the QIP educational materials to the RD gave them the resources to efficiently educate the patient on phosphorus additives. Conference calls were held with the participating facility dietitians to troubleshoot and answer questions and provide an update of new research or data on the topic of phosphorus-based additives. These calls were used to promote ongoing motivation and enthusiasm for the project. d. By educating the patient on hidden phosphorus additives, and giving patients tools to identify those additives, serum phosphorus levels should decrease and in turn the large doses of phosphate binders would be decreased alleviating the affordability factor.
8 4. During months one and three participating facilities sent to the Network patientspecific barriers to phosphorus control (i.e., nursing home/institutional resident, unable to purchase phosphorus binders, patient refused education, patient unable to be educated); date patient educated; dietitian-assessed level of patient interest rated using Likert scale (highly interested, moderately interested, slightly interested, not at all interested) by the last day of the month. 5. Each month all facilities sent the Network patient identified serum phosphorus levels by the 15th of the following month. Facility dietitians were expected to work with Network staff to review facility-level and patient-level data monthly to track progress toward goal. 6. Every other month conference calls were held with the participating facility dietitians to troubleshoot and answer questions and provide an update of new research or data on the topic of phosphorus-based additives. These calls were used to promote ongoing motivation and enthusiasm for the project. Throughout the duration of the project, facility dietitians reinforced with patients the information contained in educational materials, address shopping and eating habits, and answer questions. The Network staff assisted the dietitians in changing techniques and/or developing other actions to improve phosphorus control. Goals and timeline for the Phosphorus Management QIP were: To increase the percentage of patients within participating facilities with serum phosphorus between 3.5 and 5.5 mg/dl by at least five percent by March Network 9 (Ohio) - At least nine of 16 participating facilities will increase the percentage of patients with serum phosphorus between mg/dl by at least five percent by March Network 10 (Illinois) - At least seven of 13 participating facilities will increase the percentage of patients with serum phosphorus between mg/dl by at least five percent by March Results: The Phosphorus Management QIP was successful in both Networks 9 and 10. Both Networks met the goal that was set for March 2010 and sustained improvement through September 2010.

 for Network 9 and")
9 Figure 55 and Figure 56 display the results of this project at the end of the project, March 2010 and for six months after (September 2010) for Network 9 and Network 10.
10 Hemodialysis Adequacy QIP: The following activities were designed as components of the quality improvement project to increase the percentage of patients with Kt/V 1.2. There were twelve dialysis facilities in Network 9/10 (Network 9 = 10 and Network 10 = 2) that were included in this QIP as part of the Facility Specific project of the Quality Improvement Work Plan (QIWP). Hemodialysis adequacy is defined as Kt/V 1.2. In the 4 th quarter 2008, 92% of patients in Network 9/10 had a three month reported mean Kt/V 1.2. Ten dialysis facilities in Network 9 and two dialysis facilities in Network 10 had dialysis adequacy rates below the MRB threshold of two standard deviations below the Network mean (83.6% Kt/V) raising concerns of inappropriate patient care. In May 2009, staff and MRB members conducted a root cause analysis. The root cause analysis identified two barriers prevalent in the 12 underperforming facilities: Lack of a quality assessment and performance improvement (QAPI) process to track facility adequacy rates in Kt/V. Lack of policies and algorithms to monitor and adjust processes of care to improve the percentage of patients with Kt/V 1.2. Telephone conversations with nurse managers at targeted facilities confirmed the lack of a structured QAPI program, lack of data collection and analysis initiatives, and lack of structured policies, processes, and/or algorithms to improve adequacy. The facilities could not make improvements in adequacy because they did not regularly review this measure. The project design for this QIP included: 1. Providing quality improvement tools to facilities in the QIP for tracking and analyzing data 2. Collecting data from facilities monthly and reported facility specific data to facilities quarterly 3. Creating best practice models that compare process measures of high performing facilities with that of QIP participants 4. Providing one on one technical support from Network staff as needed 5. Collecting facility action plans 6. Conducting calls with facility medical director & staff, Network staff and MRB physicians
11 Head nurses and medical directors of participating facilities were expected to work with Network staff to review facility-level and patient-level data monthly to track progress toward goal. Facilities were asked to submit adequacy QAPI plans/minutes quarterly. Specific intervention activities included: The medical director and head nurse were directed to the Hemodialysis Adequacy Template on the Network s Web site. The recipients were asked to complete a Facility Barriers to Adequate Dialysis Questionnaire and submit to the Network. Network QI staff reviewed the results of the questionnaire to determine facility specific barriers and work with the facilities to develop action plans to address facility specific barriers. Medical directors and head nurses were asked to develop an action plan using the tools provided, including facility adequacy policies/procedures to be included in dialysis adequacy QAPI project. Nurse Managers received technical assistance as needed from Network staff assisting in identifying barriers, developing action plans, and completing dialysis adequacy QAPI minutes. Medical directors and head nurses received tools to address adequacy protocols and patient adherence issues. Goals and timeline for the Hemodialysis Adequacy QIP were: 20% of the twelve targeted facilities in Network 9/10 will improve to 92% of patients with adequate dialysis every quarter (60% by March 2010). 60% of the twelve targeted facilities in Network 9/10 will meet or exceed the Network average of 92% of patients with adequate dialysis by March Results: The Hemodialysis Adequacy QIP was successful. The goal that was set for March 2010 was met and sustained improvement through September Figure 57 and Figure 58 display the results of this project relating to the above goals at the end of the project, March 2010 and for six months after (September 2010).


12 Quality Improvement Work Plan. During 2010, a Quality Improvement Work Plan (QIWP) was developed with the oversight of the MRB and the Board of Trustees. The
13 QIWP described proposed quality improvement projects for the remainder of 2010 through the end of the contract year in The purpose of the QIWP was to describe quality improvement projects (QIP) designed to attain Network goals in these areas: 1. Fistula First 2. Phosphorus Management Phase 2 3. Improving Influenza Immunization Rates 4. Catheter Reduction For each QIP, the following topic areas were defined: Project Description Background/Justification Root Cause Analysis (RCA) Barriers Identified from RCA Goal for Change Numerator/Denominator Measurement & Frequency Threshold for Action Population Inclusion/Exclusion Criteria Project Design & Methodology Interventions Effectiveness & Sustainability Contacts References Fistula First QIP - The following activities were designed as components of the quality improvement project to attain Fistula First goals and is part of the Quality Improvement Work Plan (QIWP) for the Fistula First initiative. The Task 1.a QIP is based on information provided to the Medical Review Board on April 28, 2010 including: 1. A RCA that was conducted in May 2009 for the QIWP. 2. A second RCA that was completed in October 2009 in response to a PIP for not meeting March 2009 CMS prevalent fistula goal. 3. Staff and MRB members conducted a third root cause analysis in January 2010 because Network 9 was not on track to meet the CMS goal by March Each RCA included the analysis of: The number of facilities included for intervention
14 Fistula First dashboard data Network 9 and 10 facility size comparison Network 9 and 10 fistula placed to maturation rate comparison QIP participant RCAs and action plans January 2010 facility fistula data reporting reconciliation The root cause analysis identified three primary barriers to Network wide improvement of prevalent fistula rates: Too few facilities participating in interventions Too few one on one interventions between Network staff and facility staff with larger number of patients The non-intervention group will not achieve rates that move the Network toward goal The root cause analysis identified three primary barriers in facility systems to the improvement of prevalent fistula rates: Fistula are being placed but not used Facilities lack monitoring processes for maturing fistula and maintenance processes for those fistula being used Facilities lack auditing processes to ensure accurate data for reporting vascular access In order to assure a sufficient number of facilities are identified to participate and that those facilities have the greatest opportunity for success, we will identify two intervention groups with different focuses: 1. Placement and Assessment of Fistula Intervention - facilities with at least 30 patients and fistula rates below 55% (poor performing facilities) will submit to the Network a facility-specific root cause analysis and an action plan that will be updated quarterly. Network 9 = 63 facilities Network 10 = 23 facilities 2. Promising Stars Focus Group - facilities with at least 30 patients and fistula rates between 55-62% (early adopters) will receive a 3Ps Vascular Access Management Handbook. These facilities will be asked to utilize at least one new tool and/or process from the handbook and report to the Network quarterly on the improvements made through the use of the handbook. Network 9 = 71 facilities
15 Network 10 = 46 facilities There is a third group that is discussed in the Facility Specific Quality Assessment and Improvement Project area (Catheter Reduction QIP). This project, Catheter Out/Fistula In: Targeting Catheter Reduction to Increase AV Fistula Rate (Catheter Reduction QIP), while not in the Fistula First QIP specifically, does increase the number of facilities that will be focusing on vascular access management and, in turn, will assist in increasing the Network-wide AV fistula rates. Network 9 = 132 facilities Network 10 = 60 facilities This AV fistula rate improvement project incorporated an eight-step project model in the two interventions, Placement and Assessment of Fistula and Promising Stars Focus Group. The eight steps include: 1. Statistical analysis to identify facilities in need of intervention (facilities with outcomes that were below 55% prevalent fistulas) and facilities that need extra attention to continue improving fistula rates (facilities with outcomes between 55-62% prevalent fistulas). 2. Conducting root cause analysis with targeted facilities to discover barriers to improvement at the facility level. 3. Requiring action plans that align with facility QAPI projects addressing barriers from each facility targeted for intervention. 4. Providing conference calls for QIP participants and learning sessions for targeted facilities on topics identified through the RCA. 5. Collecting facility specific data through the fistula first dashboard and providing participating facilities with data feedback reports monthly. 6. Identifying benchmark facilities (defined as those facilities with either a fistula rate at goal or increasing by at least one percentage point per quarter) and sharing tools and resources with participating facilities. 7. Increasing the number of facility site visits and individual facility conference calls for poor performers. 8. Analysis of facility specific data monthly to determine which facilities are successfully achieving QIP goals and which facilities are in need of additional intervention. These interventions combined with an aggressive approach to data feedback in the nonintervention facilities was used as the project design for this QIP. The following interventions have been developed:
16 Placement and Assessment of Fistula Intervention (<55%): Tasks that were conducted for the place and monitor fistula intervention: Facility medical directors, nurse managers, and administrators received an introductory letter outlining their poor performance and an overview of the project. Facility staff submitted to the Network a RCA to identify barriers to improving fistula rates in their facility. Facility staff submitted to the Network an action plan detailing the steps to be taken to improve fistula rates in their facility. Facility staff submitted to the Network updated action plans at least quarterly. Network staff evaluated the RCA and action plan and provided technical support as needed on an individual facility basis. The project is being conducted over a nine month period with activities that include: Evaluation of facilities monthly prevalent fistula rate increase (goal 0.33 percentage point) and feedback reports to facilities. Facility site visits or conference calls for participants that are not meeting the monthly/quarterly goals. Evaluation of project progress through the assessment of the facility vascular access management action plan. Additionally, the intervention includes the following educational activities: Month 2 Facilities attend a QAPI/Vascular Access Management Best Practice WebEx. Month 3/5 -Facilities attend Vascular Access Management Learning Session based on preventing catheters, placing and using fistula, and preserving fistula. Month 7 - Facilities attend Vascular Access Management WebEx describing best practice. Figure 59 and Figure 60 display the results of the Placement and Assessment of Fistula project in the Fistula First project at the end of the year, December 2010 for Network 9 & Network 10.
17
18 Catheter Out/Fistula In: Targeting Catheter Reduction to Increase AV Fistula Rate: This project, Catheter Out/Fistula In: Targeting Catheter Reduction to Increase AV Fistula Rate (Catheter Reduction QIP), while not in the Fistula First QIP specifically, does increase the number of facilities that will be focusing on vascular access management and, in turn, will assist in increasing the Network-wide AV fistula rates. See specific interventions discussed in the Facility Specific Quality Assessment and Improvement Project area (Catheter Reduction QIP). Figure 61 and Figure 62 display the AV fistula rate results of the Catheter Out/Fistula In project (Catheter Reduction QIP) in the Fistula First project at the end of the year, December 2010 for Network 9 & Network 10.
19 Promising Stars Focus Group Intervention (55-62%): Tasks that were conducted for the Promising Stars intervention: Facility medical directors, nurse managers, and administrators received an introductory letter outlining their participation in this project and an overview of the project. Facility staff attended a kickoff WebEx describing the intervention project. Facility staff chose at least one new tool and/or process from the 3Ps Vascular Access Management Handbook. Facility staff reported to the Network which tool they are using and is reporting quarterly on the improvements made through the use of the handbook. Network staff will evaluate the tools selected with improvements made and provided technical support as needed. The project is being conducted over a nine month period with activities that include: Evaluation of facilities monthly prevalent fistula rate increase (goal 0.33 percentage point) and feedback reports to facilities. Facility conference calls for participants that are not meeting the monthly/quarterly goals. Evaluation of project progress through the reporting of the use of the handbook.
20 Additionally, the intervention includes the following educational activities: Month 2 Facilities attend a QAPI/Vascular Access Management Best Practice WebEx. Month 3/5 -Facilities attend Vascular Access Management Learning Session based on preventing catheters, placing and using fistula, and preserving fistula. Month 7 - Facilities attend Vascular Access Management WebEx describing best practice. This group was started in September 2010 giving it six months to achieve goal after the start of the interventions. Figure 63 and Figure 64 display the results of the Rising Stars Focus Group project in the Fistula First project at the end of the year, December 2010 for Network 9 & Network 10.
21 Network Wide Intervention: Network 9/10 provides education, tools, and resources to address the identified barriers to facility systems improving prevalent fistula rates. There are 206 facilities in Network 9 and 73 facilities in Network 10 that are not participating in the previous described interventions. These facilities either have fistula rates >62% and/or have patient populations of less than 30. These facilities received the resources and tools listed below as part of the Network wide intervention. Each facility medical director and vascular access coordinator in Networks 9 and 10 is receiving: 1. A monthly outcomes feedback report including: Prevalent fistula rates compared to region, state, Network, and US A facility fistula rate ranking Graphs displaying one year s worth of prevalent fistula in use, catheter with fistula maturing, catheter <90 days, and catheter >90 days rates 2. Bi-monthly electronic newsletter including: Information on tools for changing facility processes Important aspects of a successful QAPI program 3. Notification/invitation to educational programs:
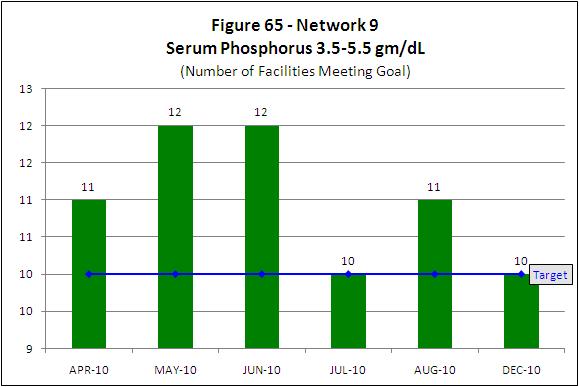
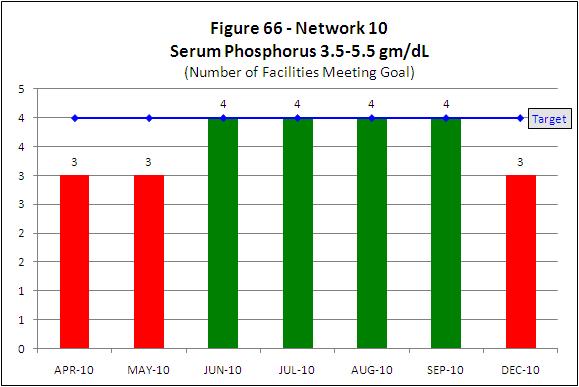
22 One QAPI/Vascular Access Management Best Practice WebEx One Vascular Access Management Learning Session providing tools and resources on o preventing catheters, o placing and using fistula, o and preserving fistula One Vascular Access Management WebEx describing best practice 4. The 3Ps Vascular Access Management Handbook housing resources, tools, and best practices regarding: preventing catheters placing and using fistula preserving fistula Goals and timeline for the Fistula First QIP were: Network 9: to increase the percentage of prevalent patients with a fistula by one percentage point each quarter for an increase of at least 3.0 percentage points to reach 54.1% by March Network 10: to increase the percentage of prevalent patients with a fistula by one percentage point each quarter for an increase of at least 2.4 percentage points to reach 56.6% by March Phosphorus Management QIP (Phase 2I) The following activities were designed as components of the quality improvement project to increase the percentage of patients in the target zone ( gm/dl) for phosphorus. This project is a continuation of the QIP. Phase 2 objectives include: 1) increase the number of facilities for intervention within this difficult area of patient care 2) increase the number of facilities to spread the information provided about hidden phosphorus 3) evaluate the sustainability for Phase 1 participants 4) evaluate the continued effectiveness of the educational initiative on a different group Sixteen dialysis facilities in Network 9 and 6 facilities in Network 10 were included in this QIP as part of the CPM project of the Quality Improvement Work Plan (QIWP).
23 Phosphorus control is defined as serum phosphorus between 3.5 and 5.5 mg/dl. High serum phosphorus levels are associated with increased morbidity and mortality. Hyperphosphatemia also is involved in causing atherosclerotic heart disease, secondary hyperparathyroidism, and bone disease in renal patients. A quality improvement project was developed aimed at increasing the serum phosphorus percentage in the mg/dl range in dialysis patients using an educational program to reduce dietary intake of phosphate additives. The results of testing the proposed educational program were reported by Sullivan et al. in JAMA in February 2009 (JAMA. 2009;301(6): ). The amount of phosphorus in the American diet has increased considerably, primarily from phosphorus-containing additives in convenience and ready to eat foods. Education regarding high phosphorus foods is a key component of hyperphosphatemia management, but the use of hidden phosphorus additives may make it difficult for patients and dietitians to estimate phosphorus content of foods. It has been suggested that hyperphosphatemia is a nutritional barrier to preventing renal bone disease and cardiovascular mortality and that an intervention focusing on phosphate containing food additives has great potential. The original root cause analysis was completed in May In May 2010, the MRB reviewed phosphorus data from the th quarter Elab data collection and discussed continuing the project for the QIWP. The MRB s root cause analysis in 2010 included the following information: 1. An analysis of 2009 October, November, December facility-specific phosphorus data provided through the Elab project (4 th quarter lab data collection) revealed that Networks 9 and 10 had only a mid-range percentage of patients with a serum phosphorus between 3.5 and 5.5 mg/dl (50.8% of patients in Network 9 and 51.8% of patients in Network 10). 2. The members discussed reasons for increased phosphorus after being introduced to the information presented in the JAMA article. (JAMA. 2009;301(6): ) The following barriers to controlled phosphorus were identified: 1) Patients are not aware of phosphorus additives in foods 2) There is a high reliance on fast foods and convenience food items
24 3) Insufficient RD time to adequately educate patients with inadequate educational materials available 4) Phosphate binder non-adherence due to large doses and inability to afford binders The QIP design/methodology includes all facility patients, with both controlled (as defined ranging 3.5 mg/dl to 5.5 mg/dl) and uncontrolled serum phosphorus. Therefore, instead of proposing an outcome measure of reducing mean facility phosphorus, we propose an outcome measure evaluating the percentage of patients in the facility with serum phosphorus within the acceptable range. Given that this is a quality improvement design, there is reason to believe that patients with controlled serum phosphorus levels will benefit from education about hidden phosphorus additives. Dietitians are expected to educate patients on phosphorus control as part of the normal dietician scope of practice, however education is not provided uniformly to patients or across facilities. This project translates the method of a successful research intervention as described in the literature (JAMA) into clinical practice. It also provides the dietitian with sound educational tools to assist the patient with making appropriate and healthy food choices. Facility interdisciplinary members received a report detailing the percentage of patients with phosphorus greater than 5.5 mg/dl based on the th quarter lab data. This report compares the facility phosphorus data to that of their state, Network, and the US. Facility dieticians received the following materials for dietitians to provide to patients: label reading instructions pocket magnifier list of phosphate additives to avoid lists of fast foods to avoid and recommended alternative fast foods In the course of two educational sessions (Session I by the end of May 2010 and Session II by the end of July 2010), dietitians will instruct patients on how to read nutrition facts panels and ingredient lists to determine if foods contain phosphate additives. Dietitians will determine which fast food restaurants are used by each patient and provide lists of additive-containing and additive-free (and appropriate for renal diet) foods at the
25 restaurant. Patients will be advised and encouraged to select phosphorus additive-free menu items at supermarket/restaurant. All participating facilities are taking part in the following interventions during the six month project period: 1. Dietitians were trained in the project methodology via WebEx training session in March Dietitians provided the Network with a list of patient names and patient serum phosphorus levels for March 2010 as baseline. 3. Patients received education materials describing: phosphorus additives and their effect on the phosphorus content of foods; a listing of common phosphorus additives; a pocket magnifier; fast food restaurant-specific handouts listing additive-containing foods to avoid and additive-free foods that are reasonable to include in the renal diet. 4. Patients will be educated on how to use the tools provided to identify the hidden phosphorus additives in fast foods and grocery stores in order to make more appropriate food choices. 5. Patients will be instructed to use the materials when shopping or eating out to avoid phosphorous additives. Using patient materials provided, dietitians will provide patients with education regarding: The phosphorus content of foods (naturally occurring and phosphorus-based food additives) How to read labels to identify presence of phosphorus-based food additives The phosphorus content and additives in fast food menu items Advice to limit foods containing naturally occurring phosphates, avoid foods containing phosphorus-based food additives, and alter fast food purchases (if applicable) 6. Conference calls were held with the participating facility dietitians to troubleshoot and answer questions and provide an update of new research or data on the topic of phosphorus-based additives. These calls will be used to promote ongoing motivation and enthusiasm for the project. 7. During months 1 and 3 participating facilities were sent (to the Network) patientspecific barriers to phosphorus control (nursing home/institutional resident, unable to purchase phosphorus binders, patient refused education, patient unable to be educated); date patient educated; dietitian-assessed level of patient interest rated using Likert scale (highly interested, moderately interested, slightly interested, not at all interested) by the last day of the month.
26 8. Each month all facilities send to the Network patient de-identified serum phosphorus levels by the 15th of the following month. Facility dietitians are expected to work with Network staff to review facility-level and patient-level data monthly to track progress toward goal. 9. Throughout the duration of the project, facility dietitians are reinforcing with patients the information contained in educational materials, addressing shopping and eating habits, and answering questions. 10. The Network staff assisted the dietitians in changing techniques and/or developing other actions to improve phosphorus control. Goals and timeline for the Phosphorus Management (Phase II) QIP were: To increase the percentage of patients within participating facilities with serum phosphorus between 3.5 and 5.5 mg/dl by at least five percent in the six months from April 2010 to September 2010 and sustain improvement through March Network 9 - At least ten of sixteen participating facilities will increase the percentage of patients with serum phosphorus between mg/dl by at least 5% in the six months from April 2010 to September 2010 and sustain improvement through March Network 10 - At least four of six participating facilities will increase the percentage of patients with serum phosphorus between mg/dl by at least 5% in the six months from April 2010 to September 2010 and sustain improvement through March Figure 65 and Figure 66 display the results of the Phosphorus Management (Phase II) project at the end of the year, December 2010 for Network 9 and Network 10.
27
28 Improving Influenza Immunization Rates QIP - The following activities were designed as components of the quality improvement project to monitor and improve dialysis patient influenza immunization rates. At least 90% of the facilities in Network 9 and Network 10 will participate in this QIP as part of the Network Specific project of the Quality Improvement Work Plan (QIWP). On average, 1 out of 5 Americans suffer from influenza each year. Approximately 226,000 people in the US are hospitalized, and an average of 36,000 die from influenza and its complications every year. Anyone can catch the flu. Some influenza infections will cause lost work and school days, but for those at highest risk of suffering from complications, the results can be more severe. The best way to help prevent influenza is with an annual influenza vaccination. Vaccination is important for all Americans; however influenza immunization rates in the highest-risk groups fall far short of public health goals every year. Groups at higher risk of influenza infection or complications include: People 50 years of age and older Children 6 months-18 years of age Pregnant women People of any age with certain chronic medical conditions, such as asthma, chronic obstructive pulmonary disease (COPD), heart disease, diabetes, and others Residents of long-term care facilities and nursing homes Complications from influenza most often occur among people over 65 years of age. The best way to reduce the effects of influenza is through annual vaccination. Influenza vaccines are safe and effective. Although mild side effects from flu shots are possible, such as fever, aches, and redness, soreness or swelling where the shot was given, a person cannot get the flu from the vaccine. Hemodialysis patients are at risk for infection because the dialysis process requires invasive vascular access for prolonged periods. The chronic outpatient setting creates an environment where multiple patients receive dialysis concurrently, and there are repeated opportunities for person-to-person transmission of infectious agents, directly or indirectly via contaminated devices, equipment and supplies, environmental surfaces or the hands of health care workers.
29 Furthermore, dialysis patients are immunosuppressed requiring more frequent hospitalizations and surgery, which increase opportunities for exposure to infections. The goal for the Centers for Medicare & Medicaid Services (CMS) Healthy People 2010 initiative is that 90% of adults will receive an annual Influenza vaccination. The new Conditions for Coverage require promotion of an immunization program for Influenza vaccine. Only 64.2% of ESRD patients in the US were vaccinated in These clinical concerns present an opportunity for improvement. In May 2010, the MRB discussed at length the need for a QIP related to improving dialysis patient influenza immunization. The MRB conducted a root cause analysis to identify reasons for patients not being vaccinated for influenza based on the experience and discussion of the MRB membership and on the results of a similar QIP conducted in Network 4. The MRB identified several areas contributing to low immunization rates: 1. Lack of Medical Director/nephrologist involvement 2. Lack of education 3. Lack of staff time 4. Lack of QAPI tools for tracking immunizations 5. Belief that influenza vaccine causes the flu The following barriers to dialysis patient influenza vaccination were identified: Non-engaged Medical Director/nephrologists do not support a facility immunization program Lack of staff and patient education Facility unable/unwilling to commit personnel time to project Need for vaccination tracking tools and specific QAPI program for influenza immunization Disparity in immunization rates for certain racial and ethnic groups and the elderly Negative patient perceptions regarding the vaccine are that it could cause influenza or has significant side effects The project used interventions and strategies based on information learned from a previous Network 4 immunization QIP. Network 4 used the Vaccination Toolkit developed by the Forum of ESRD Networks MAC and it will serve as the basis for technical assistance in this QIP. We will also utilize immunization education information researched and collected from the CDC through Networks 4, 9 & 10 quality improvement staff.
30 The flu immunization QIP interventions timeline is as follows: August/September 2010: 1. A facility 2009 flu vaccination rate assessment scan was derived from a scan used by Network 4 and sent to all providers. 2. At the same time, influenza vaccination tools were distributed Network-wide. The tools include: An ed Link to the MAC Vaccination Toolkit Immunization Data Collection Tool Vaccination Myth Busters Immunization Internet Resources Immunization Action Coalition Resources CDC Resources CDC Guidelines for Vaccinating Kidney Dialysis Patients Patient Education Posters & Brochures Immunization Declination Form October 2010: 1. Facilities that did not return the 2009 flu vaccination rate assessment scan received the scan again to be considered for inclusion in the project. October/November 2010: 1. A follow-up facility assessment scan was sent to participating facilities asking How will you change to make improvements 2. Pertinent 2010 flu season information was sent to facilities as available from CDC and other resources. 3. A report comparing the facility 2009 reported vaccination rate to the US and facility 2008 rate from the CMS 2010 Dialysis Facility Report was sent. November 2010: 1. Facilities were invited to attend a flu immunization WebEx in November March 2011: 1. A facility 2010 flu vaccination rate assessment scan (re-measurement) will be obtained to assess if the goal was reached and to assess the effectiveness of the project and practice change for flu season 2011.

31 Goals and timeline for the improving influenza immunization rates QIP were: 60% of the participating facilities will increase the percentage of patients receiving the influenza vaccine by at least 5% from the 2009 flu season 2010 flu season. At least 90% return the 2009 flu vaccination rate assessment scans by Jan 2011 (15%/Month Aug-Jan) Figure 67 and Figure 68 display the results of the rate of return for the 2009 flu vaccination rate assessment scans at the end of the year, December 2009 for Network 9 and Network 10.

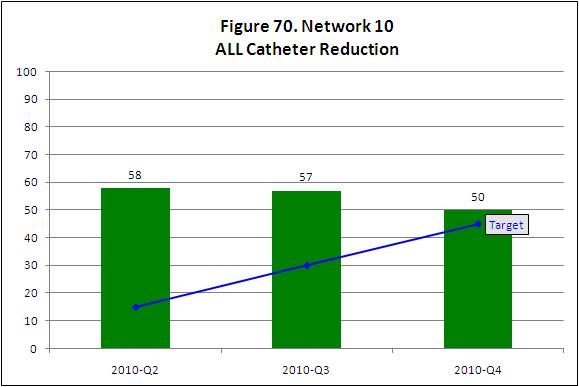
32 Catheter Reduction QIP: The following activities were designed as components of the quality improvement project to decrease facility catheter rates and increase facility AV fistula rates. Participating facilities had an ALL catheter rate of >27%, a prevalent fistula rate of <55%, and 30 patients for March Network 9 will have 132 facilities participating and Network 10 will have 60 facilities participating in this QIP as part of the Facility Specific project of the Quality Improvement Work Plan (QIWP). High catheter use for dialysis is associated with increased infection, clotting, morbidity, mortality, hospitalization, and cost. KDOQI guidelines recommends: that a fistula be placed at least 6 months before the anticipated start of HD treatments, that <10% of prevalent patients should be dialyzing with a catheter only for >90 days, and that a fistula maturation program should be in place to evaluate the maturing access no later than 6 weeks after access placement and to detect early access dysfunction, particularly delays in maturation.
33 A facility that has a large percentage of patients with catheters (counting all types) points to inadequate processes in place for ensuring all patients have an AVF. This poses the potential for providing suboptimal patient care. Catheter reduction is being targeted by two Large Dialysis Organizations (LDO), the national Fistula First Breakthrough Initiative through Change Concept #7 AVF Placement in Patients with Catheters Where Indicated, and was developed as a QI toolkit through the Forum of ESRD Networks MAC. Coordinating this QIP with these efforts increases the likelihood of spreading a consistent message to dialysis providers and ultimately achieving goals. Staff and MRB members conducted a root cause analysis that included the following: 1. An analysis of March 2010 Fistula First Dashboard data. 132 hemodialysis facilities in Network 9 have a patient population of at least 30 and >27% of their prevalent patient population dialyzing with a catheter 60 hemodialysis facilities in Network 10 have a patient population of at least 30 and >27% of their prevalent patient population dialyzing with a catheter these same facilities also had a prevalent patient fistula rate <55% 2. Review of 79 facility action plans from facilities that identified increased catheters as a cause for poor AV fistula outcomes. Action plans revealed that the dialysis facilities: did not have a tracking mechanism or data collection tool established for patients with catheters did not have catheter to fistula pathways that would assist with vascular access management did not have a non-maturing AV fistula algorithm in place to ensure timely referral for intervention 3. Review of past QIP interventions and results to determine if the approaches could be effective. The root cause analysis identified three barriers to successfully decreasing catheters: 1. Lack of a quality assessment and performance improvement (QAPI) process to collect and track patient catheter rates. 2. Lack of a facility specific root cause analysis within their QAPI process to identify reasons for increased catheter rates. 3. Lack of policies and algorithms to monitor and adjust processes of care to improve vascular
34 The project design for this QIP includes: 1. Providing quality improvement tools to facilities in the QIP for tracking and analyzing data 2. Providing educational WebEx s and learning sessions 3. Collecting data from facilities monthly and reporting facility specific data to facilities quarterly 4. Creating best practice models that compare process measures of high performing facilities with that of QIP participants 5. Providing one on one technical support from Network staff as needed 6. Collecting facility action plans 7. Conducting calls with facility medical director & staff, Network staff and MRB physicians as necessary Head nurses and medical directors of participating facilities are expected to work with Network staff to review facility-level data monthly to track progress toward goal. Facility staff submitted catheter reduction QAPI plans quarterly or more often as requested. Specific intervention activities included: 1. Medical directors and nurse managers completed a 5 Whys Root Cause Analysis form and submitted to the Network. 2. Medical directors and nurse managers completed a catheter reduction action plan and submitted to the Network. 3. Medical directors and nurse managers submitted updates to the catheter reduction QAPI plans quarterly or more often as requested. 4. Medical directors and nurse managers received technical assistance as needed from Network staff assisting in identifying barriers, developing action plans, and utilizing tools and resources as needed. Additionally, the intervention included the following educational activities and resources: 1. Month 2 Facilities attend a QAPI/Vascular Access Management Best Practice WebEx 2. Month 3/5 -Facilities attend Vascular Access Management Learning Session based on preventing catheters, placing and using fistula, and preserving fistula 3. Month 7 - Facilities attend Vascular Access Management WebEx describing best practice 4. The 3Ps Vascular Access Management Handbook housing resources, tools, and best practices regarding:

35 preventing catheters placing and using fistula preserving fistula Goals and timeline for the Catheter Reduction QIP were: At least 60% of targeted facilities will decrease the number of patients with a catheter by 20% by March Figure 69 and Figure 70 display the results of the Catheter Reduction project at the end of the year, December 2010 for Network 9 and Network 10.
36
D. Fistula First (FF) Initiative.
 Initiative.") D. Fistula First (FF) Initiative. The development of Quality Improvement Projects (QIP) is mandated in the ESRD Network contracts with CMS. The QIPs are developed and directed by the MRB, then reviewed,
D. Fistula First (FF) Initiative. The development of Quality Improvement Projects (QIP) is mandated in the ESRD Network contracts with CMS. The QIPs are developed and directed by the MRB, then reviewed,
SUMMARY OF THE MEDICARE END-STAGE RENAL DISESASE PY 2014 AND PY 2015 QUALITY INCENTIVE PROGRAM PROPOSED RULE
 SUMMARY OF THE MEDICARE END-STAGE RENAL DISESASE PY 2014 AND PY 2015 QUALITY INCENTIVE PROGRAM PROPOSED RULE On July 2, 2012, the Centers for Medicare and Medicaid Services (CMS) issued a Proposed Rule
Quality Assessment & Performance. CMS Conditions for Coverage
 Quality Assessment & Performance Improvement Meeting Condition 494.110 Of CMS Conditions for Coverage Raynel Kinney, RN,CNN,CPHQ QI Director Mary Ann Webb, RN, MSN, CNN QI Coordinator Cindy Miller, RN,
For Dialysis Facilities
 The QIP Newsletter For Dialysis Facilities Inside this issue: What does the QIP 2 Measure? What has Changed? 3 QIP Measures 3 Clinical measure 3-5 focus Measures that 6-7 Matter Reporting measure 8 focus
DETAIL SPECIFICATION. Description. Numerator. Denominator. Exclusions. Minimum Data Reported to NHSN
 Rule of Record: Calendar Year (CY) 2017 ESRD Prospective Payment System (PPS) Final Rule (2016) Infection Monitoring: National Healthcare Safety Network (NHSN) Bloodstream Infection in Hemodialysis Patients
Dialysis facility characteristics and services
 Dialysis facility characteristics and services Dialysis Facility Compare provides the following information on dialysis facilities: Scroll and on the table to view all data. Rotate screen for better viewing.
Infection Monitoring: National Healthcare Safety Network (NHSN) Bloodstream Infection in Hemodialysis Patients Clinical Measure
 Bloodstream Infection in Hemodialysis Patients Clinical Measure") Rule of Record: Calendar Year (CY) 2017 ESRD Prospective Payment System (PPS) Final Rule (2016) Infection Monitoring: National Healthcare Safety Network (NHSN) Bloodstream Infection in Hemodialysis Patients
Rule of Record: Calendar Year (CY) 2017 ESRD Prospective Payment System (PPS) Final Rule (2016) Infection Monitoring: National Healthcare Safety Network (NHSN) Bloodstream Infection in Hemodialysis Patients
CMS Proposed Rule Summary: ESRD PPS for CY 2017; ESRD QIP for PYs 2018, 2019, and 2020; AKI; and CEC Model
 CMS Proposed Rule Summary: ESRD PPS for CY 2017; ESRD QIP for PYs 2018, 2019, and 2020; AKI; and CEC Model On June 24, 2016, the Centers for Medicare & Medicaid Services (CMS) released a proposed rule
HOME DIALYSIS REIMBURSEMENT AND POLICY. Tonya L. Saffer, MPH Senior Health Policy Director National Kidney Foundation
 HOME DIALYSIS REIMBURSEMENT AND POLICY Tonya L. Saffer, MPH Senior Health Policy Director National Kidney Foundation Objectives Understand the changing dynamics of use of home dialysis Know the different
Disclosures Nothing to disclose
 Joseph Scaletta, MPH, RN, CIC Director, KDHE Healthcare-Associated Infections Program Kay Brown, BS, CSSGB Quality Improvement Director, Heartland Kidney Network Joseph M. Scaletta, MPH, RN, CIC Disclosures
Congress extended Medicare coverage in
 Promoting Quality of Care for ESRD Patients: The Role of the ESRD Networks Jenna Krisher and Stephen Pastan The 18 End Stage Renal Disease (ESRD) Networks were established by Congress to oversee the care
ESRD National Coordinating Center (NCC) Fistula First Catheter Last Learning and Action Network. October 22, 2015
 Fistula First Catheter Last Learning and Action Network. October 22, 2015") ESRD National Coordinating Center (NCC) Fistula First Catheter Last Learning and Action Network October 22, 2015 Objectives for Today The participants will be able to: 1. List 3 of the 6 components of
ESRD National Coordinating Center (NCC) Fistula First Catheter Last Learning and Action Network October 22, 2015 Objectives for Today The participants will be able to: 1. List 3 of the 6 components of
30 E. 33rd Street New York, NY Tel Fax
 National Kidney Foundation Summary of the 2016 ESRD PPS and 2017-2019 QIP Final Rule. On Thursday, October 29, the Centers for Medicare & Medicaid Services (CMS) released the final Medicare Program; End-Stage
Renal. Outreach. Living with Renal Failure. by Della Major. Summer 2013
 LIVING WITH RENAL FAILURE PAGE 1. 5 DIAMOND PROGRAM PAGE 2 QUALITY OF LIFE PAGE 5 Renal Summer 2013 Outreach Living with Renal Failure by Della Major I t all started in 2005, when I was told that I had
ASN Dialysis Advisory Group ASN DIALYSIS CURRICULUM
 ASN Dialysis Advisory Group ASN DIALYSIS CURRICULUM 0 ASN Dialysis Curriculum The Role of Medical Directors David B. Van Wyck, MD DaVita, Inc. 1 Disclosures DaVita, Inc Employee and stockholder Affymax
FISTULA FIRST: PAST, PRESENT AND FUTURE. Jay Wish, MD Nephrology Clinical Consultant Fistula First Breakthrough Initiative
 FISTULA FIRST: PAST, PRESENT AND FUTURE Jay Wish, MD Nephrology Clinical Consultant Fistula First Breakthrough Initiative Jay Wish, MD: Disclosures No disclosures with regard to this presentation Wear
ESRD Network 13: 2017 Performance Guidance
 ESRD Network 13: 2017 Performance Guidance This material was prepared by HSAG: ESRD Network 13, under contract with the Centers for Medicare & Medicaid Services (CMS), an agency of the U.S. Department
2014 QAPI Plan for [Facility Name]
![2014 QAPI Plan for [Facility Name]](/thumbs/74/70066237.jpg "2014 QAPI Plan for [Facility Name]") presented by: Quality Leadership for Long-Term Care 2014 QAPI Plan for [Facility Name] Vision A vision statement is sometimes called a picture of your organization in the future; it is your inspiration
presented by: Quality Leadership for Long-Term Care 2014 QAPI Plan for [Facility Name] Vision A vision statement is sometimes called a picture of your organization in the future; it is your inspiration
Expanding Your Pharmacist Team
 CALIFORNIA QUALITY COLLABORATIVE CHANGE PACKAGE Expanding Your Pharmacist Team Improving Medication Adherence and Beyond August 2017 TABLE OF CONTENTS Introduction and Purpose 1 The CQC Approach to Addressing
Malnutrition Quality Improvement Opportunities for the District Hospital Leadership Forum. May 2015 avalere.com
 Malnutrition Quality Improvement Opportunities for the District Hospital Leadership Forum May 2015 avalere.com Malnutrition Has a Significant Impact on Patient Outcomes MALNUTRITION IS ASSOCIATED WITH
Check-Plan-Do-Check-Act-Cycle
 Adequacy of hemodialysis 1 Adequacy of Hemodialysis Introduction Providing adequate hemodialysis treatment is dependent on numerous factors ranging from type of dialyzer used to appropriate length of treatment
Managing Your Patient Population: How do you measure up?
 Managing Your Patient Population: How do you measure up? Paul M. Palevsky, M.D. Chief, Renal Section VA Pittsburgh Healthcare System Professor of Medicine University of Pittsburgh School of Medicine Ben
Vascular Access Best Practice Sharing Stories
 Welcome to our Webinar: Presenters: Cindy Miller, RN - The Renal Network Raynel Wilson, RN - The Renal Network Vascular Access Best Practice Sharing Stories Shane Perry - The Renal Network Sue Kirschbaum,
NQF-Endorsed Measures for Renal Conditions,
 NQF-Endorsed Measures for Renal Conditions, 2015-2017 TECHNICAL REPORT February 2017 This report is funded by the Department of Health and Human Services under contract HHSM-500-2012-00009I Task Order
KCER Patient SME Guide
 KCER Patient SME Guide An Introduction to Being a National Kidney Community Emergency Response (KCER) Patient and Family Engagement Learning and Action Network (N-K-PFE-LAN) Patient Subject Matter Expert
American Nephrology Nurses Association Comments on CMS 2015 ESRD Prospective Payment System and Quality Incentive Program
 American Nephrology Nurses Association Comments on CMS 2015 ESRD Prospective Payment System and Quality Incentive Program CY 2015 ESRD PPS System Proposed Rule ANNA Comments CY 2015 ESRD PPS System Final
Fiscal Year 2017 (10/01/16-9/30/17) ESRD CORE SURVEY DATA WORKSHEET
 ESRD CORE SURVEY DATA WORKSHEET") Facility: Date: CCN: Surveyor: Use of this worksheet: The data elements that must be reviewed for a survey will change over time due to the dynamic nature of data pertaining to the care and clinical outcomes
Facility: Date: CCN: Surveyor: Use of this worksheet: The data elements that must be reviewed for a survey will change over time due to the dynamic nature of data pertaining to the care and clinical outcomes
2018 Increase Rate of Patients Dialyzing at Home Using the 7-Step Process Quality Improvement Activity (QIA)
") 2018 Increase Rate of Patients Dialyzing at Home Using the 7-Step Process Quality Improvement Activity (QIA) Donna DeBello, RN Quality Improvement Director Health Services Advisory Group (HSAG): End Stage
2018 Increase Rate of Patients Dialyzing at Home Using the 7-Step Process Quality Improvement Activity (QIA) Donna DeBello, RN Quality Improvement Director Health Services Advisory Group (HSAG): End Stage
Guide to the Quarterly Dialysis Facility Compare Preview for January 2018 Report: Overview, Methodology, and Interpretation
 Guide to the Quarterly Dialysis Facility Compare Preview for January 2018 Report: Overview, Methodology, and Interpretation October 2017 Table of Contents I. PURPOSE OF THIS GUIDE AND THE QUARTERLY DIALYSIS
Cardiovascular Disease Prevention and Control: Interventions Engaging Community Health Workers
 Cardiovascular Disease Prevention and Control: Interventions Engaging Community Health Workers Community Preventive Services Task Force Finding and Rationale Statement Ratified March 2015 Table of Contents
The Heart and Vascular Disease Management Program
 Element A: Program Content The Heart and Vascular Disease Management Program GHC-SCW is committed to helping members, and their practitioners, manage chronic illness by providing tools and resources to
Calendar Year 2014 Medicare Physician Fee Schedule Final Rule
 Calendar Year 2014 Medicare Physician Fee Schedule Final Rule Non-Facility Cap After receiving many negative comments on this issue from physician groups, along with the House GOP Doctors Caucus letter
Specialty Care Approaches to Accountable Care: A Panel Discussion. Allen R. Nissenson, MD, FACP Chief Medical Officer, DaVita
 Specialty Care Approaches to Accountable Care: A Panel Discussion Allen R. Nissenson, MD, FACP Chief Medical Officer, DaVita 1 Panel Lara M. Khouri, MBA, MPH VP, Health System Development and Integration,
Reducing Infections and Improving Engagement St. Luke's Nephrology Associates. Contact Information: Robert Gayner, M.D., FASN
 BEST PRACTICES Vascular Access and CLABSI Reduction Reducing Infections and Improving Engagement St. Luke's Nephrology Associates Contact Information: Robert Gayner, M.D., FASN St. Luke's Nephrology Associates
EVOLENT HEALTH, LLC Diabetes Program Description 2018
 EVOLENT HEALTH, LLC Diabetes Program Description 2018 1 Evolent Health Diabetes Program Description 2018 Table of Contents Section Page Number I. Introduction... 3 II. Program Scope... 3 III. Program Goals...
Keenan Pharmacy Care Management (KPCM)
") Keenan Pharmacy Care Management (KPCM) This program is an exclusive to KPS clients as an additional layer of pharmacy benefit management by engaging physicians and members directly to ensure that the best
Keenan Pharmacy Care Management (KPCM) This program is an exclusive to KPS clients as an additional layer of pharmacy benefit management by engaging physicians and members directly to ensure that the best
IPRO ESRD Network of the South Atlantic HAI BSI/LTC QIA 2018 Kickoff Webinar
 IPRO ESRD Network of the South Atlantic HAI BSI/LTC QIA 2018 Kickoff Webinar February 7, 2018 Welcome/Opening Remarks Jeanine Pilgrim, Quality Improvement Director Housekeeping Reminders All phone lines
Catheter Reduction Toolkit Developed by the Forum of ESRD Networks Medical Advisory Council (MAC)
") 2009 [CATHETER REDUCTION TOOLKIT] June 1, 2009 I Catheter Reduction Toolkit Developed by the Forum of ESRD Networks Medical Advisory Council (MAC) The Forum MAC has developed a series of QAPI toolkits
2009 [CATHETER REDUCTION TOOLKIT] June 1, 2009 I Catheter Reduction Toolkit Developed by the Forum of ESRD Networks Medical Advisory Council (MAC) The Forum MAC has developed a series of QAPI toolkits
Our Journey Towards Patient Self- Management: The Patient Experience. Presented by: Dr Janet Roscoe Paulette Lewis Pat Taylor Clint Gunn
 Our Journey Towards Patient Self- Management: The Patient Experience Presented by: Dr Janet Roscoe Paulette Lewis Pat Taylor Clint Gunn Objectives To share our experiences in the development of patient
Medical Nutrition Therapy (MNT): Billing, Codes and Need at Adelante Healthcare
: Billing, Codes and Need at Adelante Healthcare") Medical Nutrition Therapy (MNT): Billing, Codes and Need at Adelante Healthcare An investigation of Medical Nutrition Therapy (MNT) billing requirements and handling By Melissa Brito Phillips Beth Israel
Medical Nutrition Therapy (MNT): Billing, Codes and Need at Adelante Healthcare An investigation of Medical Nutrition Therapy (MNT) billing requirements and handling By Melissa Brito Phillips Beth Israel
COMMUNITY HEALTH NEEDS ASSESSMENT HINDS, RANKIN, MADISON COUNTIES STATE OF MISSISSIPPI
 COMMUNITY HEALTH NEEDS ASSESSMENT HINDS, RANKIN, MADISON COUNTIES STATE OF MISSISSIPPI Sample CHNA. This document is intended to be used as a reference only. Some information and data has been altered
For Dialysis Facilities
 The QIP Newsletter For Dialysis Facilities Summer 2017 Volume 3 What is the QIP? How does the QIP affect me? Inside this issue: What does the QIP Measure? Where Does the Data Come From? What are the QIP
Survey Protocol for Long Term Care Facilities
 Attachment B Survey Protocol for Long Term Care Facilities The provision of home dialysis treatments in a Long Term Care (LTC) facility place an increased burden on the LTC facility staff and may place
Health HAPPEN. Make. Prepare now to stay healthy during flu season. Inside
 Inside How to lower your blood pressure Make Health HAPPEN Quarter 3, 2017 www.myamerigroup.com/medicare Prepare now to stay healthy during flu season Influenza, also known as the flu, can make you feel
EVOLENT HEALTH, LLC. Heart Failure Program Description 2017
 EVOLENT HEALTH, LLC Heart Failure Program Description 2017 1 Evolent Health Heart Failure Program Description 2017 Table of Contents Section Page Number I. Introduction. 3 II. Program Scope. 3 III. Program
Vascular Access Planning Strategies to Reduce LTC Rates. May 3, 2018
 Vascular Access Planning Strategies to Reduce LTC Rates May 3, 2018 1 Welcome/Opening Remarks Jeanine Pilgrim, Quality Improvement Director IPRO ESRD Network Program Housekeeping Reminders All phone lines
Navigating The End-Stage Renal Disease (ESRD) Payment System
 Payment System") Navigating The End-Stage Renal Disease (ESRD) Payment System Navigating The End-Stage Renal Disease (ESRD) Payment System Mark A. Meier, MSW, LICSW Page 1 of 13 00:00:00 Mark A. Meier: Hello, my name is
Navigating The End-Stage Renal Disease (ESRD) Payment System Navigating The End-Stage Renal Disease (ESRD) Payment System Mark A. Meier, MSW, LICSW Page 1 of 13 00:00:00 Mark A. Meier: Hello, my name is
DPM Sampling, Study Design, and Calculation Methods. Table of Contents
 DPM Sampling, Study Design, and Calculation Methods Table of Contents DPM Sampling, Study Design, and Calculation Methods... 1 Facility Sample Frame DOPPS 4 (2009-2011)... 2 Facility Sample Frame DOPPS
Safety in Transitions from CKD to Dialysis. Lana Spencer, BScM, RN, CDN, MBA Corporate Administrator, Dialysis Clinic, Inc.
 Safety in Transitions from CKD to Dialysis Lana Spencer, BScM, RN, CDN, MBA Corporate Administrator, Dialysis Clinic, Inc. A renal community collaboration September 11-12, 2012 Transitions from CKD to
National Survey on Consumers Experiences With Patient Safety and Quality Information
 Summary and Chartpack The Kaiser Family Foundation/Agency for Healthcare Research and Quality/Harvard School of Public Health National Survey on Consumers Experiences With Patient Safety and Quality Information
Telemedicine: Solving the Root Causes for Preventable 30-day Readmissions in SNF Settings
 For Immediate Release: 05/11/18 Written By: Scott Whitaker Telemedicine: Solving the Root Causes for Preventable 30-day Readmissions in SNF Settings Outlining the Problem: Reducing preventable 30-day hospital
Collaborative Activation of Resources and Empowerment Services Building Programs to Fit Patients vs. Bending Patients to Fit Programs
 Organization: Solution Title: Calvert Memorial Hospital Calvert CARES: Collaborative Activation of Resources and Empowerment Services Building Programs to Fit Patients vs. Bending Patients to Fit Programs
CASE MANAGEMENT POLICY
 CASE MANAGEMENT POLICY Subject: Acuity Scale Determination Effective Date: March 21, 1996 Revised: October 25, 2007 Page 1 of 1 PURPOSE: To set a minimum standard across Cooperative agencies regarding
Patient Protection and Affordable Care Act Selected Prevention Provisions 11/19
 Patient Protection and Affordable Care Act Selected Prevention Provisions 11/19 Coverage of Preventive Health Services (Sec. 2708) Stipulates that a group health plan and a health insurance issuer offering
Wake Forest Baptist Health Lexington Medical Center. CHNA Implementation Strategy
 Wake Forest Baptist Health Lexington Medical Center CHNA Implementation Strategy Background Wake Forest Baptist Health - Lexington Medical Center (LMC) is committed to understanding, anticipating, assessing,
California Pacific Medical Center Outpatient Dialysis Transition Proposition Q Hearing San Francisco Health Commission September 7, 2010
 California Pacific Medical Center Outpatient Dialysis Transition Proposition Q Hearing San Francisco Health Commission September 7, 2010 Overview Presenter: Delvecchio Finley, FACHE Vice President,Operations
SPECIAL NEEDS PLAN (SNP) MODEL OF CARE TRAINING 2015
 MODEL OF CARE TRAINING 2015") SPECIAL NEEDS PLAN (SNP) MODEL OF CARE TRAINING 2015 Introduction This course is offered to meet the CMS regulatory requirements for Model of Care Training for our Special Needs Plan at Care Wisconsin.
SPECIAL NEEDS PLAN (SNP) MODEL OF CARE TRAINING 2015 Introduction This course is offered to meet the CMS regulatory requirements for Model of Care Training for our Special Needs Plan at Care Wisconsin.
Aldijana Avdić, BSN, RN, PBMS, CPHQ Assistant Director, Patient Safety and Privacy 1
 Aldijana Avdić, BSN, RN, PBMS, CPHQ Assistant Director, Patient Safety and Privacy 1 Program Definition The timely application of evidence-based medical and surgical concepts designed to maintain hemoglobin
Fistula First vs. Catheter Last. Lynda K. Ball, MSN, RN, CNN March 17, 2016
 Fistula First vs. Catheter Last Lynda K. Ball, MSN, RN, CNN March 17, 2016 National Vascular Access Improvement Initiative Better known as NVAII, sponsored by the Centers for Medicare & Medicaid Services
SERVICE SPECIFICATION 2 Vascular Access
 SERVICE SPECIFICATION 2 Vascular Access Table of Contents Page 1 Key Messages 1 2 Introduction & Background 2 3 Relevant Guidelines & Standards 2 4 Scope of Service 3 5 Interdependencies with other specialties
Falcon Quality Payment Program Checklist- 2017
 Falcon Quality Payment Program Checklist- 2017 DISCLAIMER: This material is provided for informational purposes only and should not be relied upon as legal or compliance advice. If legal advice or other
Healthcare Associated Infections (HAI) Quality Improvement Activity: Reducing Bloodstream Infections
 Quality Improvement Activity: Reducing Bloodstream Infections") Healthcare Associated Infections (HAI) Quality Improvement Activity: Reducing Bloodstream Infections Jeannette Shrift RN, MSN Quality Improvement Coordinator Presentation to Focus Facility Managers and
Healthcare Associated Infections (HAI) Quality Improvement Activity: Reducing Bloodstream Infections Jeannette Shrift RN, MSN Quality Improvement Coordinator Presentation to Focus Facility Managers and
Healthcare-Associated Infections (HAI) Quality Improvement Activity February Webinar
 Quality Improvement Activity February Webinar") Healthcare-Associated Infections (HAI) Quality Improvement Activity 2017 February Webinar AIM : Better Care for the Individual through Patient and Family Centered Care Patient Safety: Healthcare-associated
Healthcare-Associated Infections (HAI) Quality Improvement Activity 2017 February Webinar AIM : Better Care for the Individual through Patient and Family Centered Care Patient Safety: Healthcare-associated
Healthcare-Associated Infections (HAI) Quality Improvement Activity Project Kickoff Webinar
 Quality Improvement Activity Project Kickoff Webinar") Healthcare-Associated Infections (HAI) Quality Improvement Activity 2017 Project Kickoff Webinar QIP PY 2019 Final Measure Domain Weighting Domain Weight Measures/Measure Topics Weight (Domain) Safety
Healthcare-Associated Infections (HAI) Quality Improvement Activity 2017 Project Kickoff Webinar QIP PY 2019 Final Measure Domain Weighting Domain Weight Measures/Measure Topics Weight (Domain) Safety
Adverse Events: Thorough Analysis
 CMS TRANSPLANT PROGRAM QUALITY WEBINAR SERIES Adverse Events: Thorough Analysis James Ballard, MBA, CPHQ, CPPS, HACP Eileen Willey, MSN, BSN, RN, CPHQ, HACP QAPI Specialist/ Quality Surveyor Educators
Key Performance Indicators
 Regional Nephrology System (RNS) Chronic Disease Prevention and Management Key Performance Indicators 8/9 Fiscal Year End Report Version: 1. Date published: April 7th, 9 Created by: Ethel Doyle: RNS Interim
QAPI: Systematic Analysis and Systemic Action via Plan-Do-Study-Act Cycles. Objectives QAPI. Regulatory Phases
 QAPI: Systematic Analysis and Systemic Action via Plan-Do-Study-Act Cycles Emily Nelson and Diane Dohm MetaStar/Lake Superior Quality Innovation Network Objectives Obtain a high-level overview of QAPI
CMS ESRD Measures Manual
 Center for Clinical Standards and Quality CMS ESRD Measures Manual Version 1.0 May 6, 2016 Table of Contents 1. Introduction... 1 2. Measurement Information... 3 2.1 Vascular Access Type: Fistula...3 2.1.1
How To Make A Good Vascular Access Program Even Better. Thursday, April 14, Welcome to our Webinar: Presenters: Cindy Miller, RN
 Presenters: Cindy Miller, RN - The Renal Network Raynel Wilson, RN -The Renal Network -Julie Guss, RN -FMC Heart of Ohio Welcome to our Webinar: How To Make A Good Vascular Access Program Even Better -Heidi
2017 Catastrophic Care. Program Evaluation. Our mission is to improve the health and quality of life of our members
 2017 Catastrophic Care Program Evaluation Our mission is to improve the health and quality of life of our members 2017 Catastrophic Care Program Evaluation Table of Contents Program Purpose Page 1 Goals
-MRB Statements & Resources
 Medical Review Board Statement Right to Choose a Physician -MRB Statements & Resources Purpose As the quality management body representing ESRD Network 18, the Medical Review Board (MRB) would like you
Getting Ready for the Maryland Primary Care Program
 Getting Ready for the Maryland Primary Care Program Presentation to Maryland Academy of Nutrition and Dietetics March 19, 2018 Maryland Department of Health All-Payer Model: Performance to Date Performance
Patient Rights & Responsibilities
 Patient & ESRD Network 18 of Southern California presents this page of patient rights and responsibilities as an important part of your care. Observing them will contribute to more effective care and greater
Fistula Fast Fast Fast Track What to do en h th f e i fistula wasn t first
 Fistula Fast Track What to do when the fistula wasn t first Angela Schuler, RN Fox Valley Dialysis/Tri-cities Dialysis Welcome, Today we will: Describe processes used for early placement of AVF Discuss
2019 Quality Improvement Program Description Overview
 2019 Quality Improvement Program Description Overview Introduction Eon/Clear Spring s Quality Improvement (QI) program guides the company s activities to improve care and treatment for the member s we
AIM 2: BETTER HEALTH FOR THE ESRD POPULATION
 AIM 2: BETTER HEALTH FOR THE ESRD POPULATION The Population Health Innovation Pilot Project: Promote Appropriate Home Dialysis in Qualified Beneficiaries The 2013 redesign of the ESRD Network Program came
Network 15 Reducing Bloodstream Infections (BSIs) Quality Improvement Activity (QIA) for 2018 Orientation
 Quality Improvement Activity (QIA) for 2018 Orientation") Network 15 Reducing Bloodstream Infections (BSIs) Quality Improvement Activity (QIA) for 2018 Orientation Susan Moretti, BSN, RN Quality Improvement Nephrology Nurse Health Services Advisory Group (HSAG):
Network 15 Reducing Bloodstream Infections (BSIs) Quality Improvement Activity (QIA) for 2018 Orientation Susan Moretti, BSN, RN Quality Improvement Nephrology Nurse Health Services Advisory Group (HSAG):
The Home Hemodialysis
 The Home Hemodialysis Cannulation Assistance Program from concept to reality. Terri Chanda R.N., CNeph(C) Renal Improvement Lead The Credit Valley Hospital and Trillium Health Centre [Poll the audience
Approved by RPA Board 3/20/2009
 Approved by RPA Board 3/20/2009 RPA Position Paper on Dialysis Facility Medical Director Responsibilities Under the Revised CMS Conditions for Coverage for End-Stage Renal Disease Facilities Executive
DRAFT Complex and Chronic Care Improvement Program Template. (Not approved by CMS subject to continuing review process)
") DRAFT Complex and Chronic Care Improvement Program Template Performance Year 2017 (Not approved by CMS subject to continuing review process) 1 Page A. Introduction The Complex and Chronic Care Improvement
DRAFT Complex and Chronic Care Improvement Program Template Performance Year 2017 (Not approved by CMS subject to continuing review process) 1 Page A. Introduction The Complex and Chronic Care Improvement
INSTITUTIONAL/INSTITUTIONAL EQUIVALENT (I/IESNP) DUAL SPECIAL NEEDS PLAN (DSNP) CHRONIC SPECIAL NEEDS PLAN (LSNP)
 DUAL SPECIAL NEEDS PLAN (DSNP) CHRONIC SPECIAL NEEDS PLAN (LSNP)") SNP MODEL OF CARE ANNUAL EVALUATIONS FOR 2013 INSTITUTIONAL/INSTITUTIONAL EQUIVALENT (I/IESNP) DUAL SPECIAL NEEDS PLAN (DSNP) CHRONIC SPECIAL NEEDS PLAN (LSNP) 1 7 0 1 P O N C E D E L E O N B L V D, S
SNP MODEL OF CARE ANNUAL EVALUATIONS FOR 2013 INSTITUTIONAL/INSTITUTIONAL EQUIVALENT (I/IESNP) DUAL SPECIAL NEEDS PLAN (DSNP) CHRONIC SPECIAL NEEDS PLAN (LSNP) 1 7 0 1 P O N C E D E L E O N B L V D, S
1.01 Government Programs: CMS and Pay for Performance: Current Issues. CMS Regional Administrator March 2009
 1.01 Government Programs: CMS and Pay for Performance: Current Issues David Saÿen CMS Regional Administrator March 2009 Overview Why value-based purchasing? What demonstrations are underway? Hospital demonstrations
ESRD Network 11 Annual Report 2015
 ESRD Network 11 Annual Report 2015 Table of Contents Report Highlights... 3 Introduction... 5 CMS End Stage Renal Disease Network Organization Program... 5 Medicare Coverage for Individuals with ESRD...
Leveraging Your Facility s 5 Star Analysis to Improve Quality
 Leveraging Your Facility s 5 Star Analysis to Improve Quality DNS/DSW Conference November, 2016 Presented by: Kathy Pellatt, Senior Quality Improvement Analyst, LeadingAge NY Susan Chenail, Senior Quality
Impact of Implementing Designed Nursing Intervention Protocol on Clinical Outcome of Patient with Peptic Ulcer. Amal Mohamed Ahmad
 Impact of Implementing Designed Nursing Intervention Protocol on Clinical Outcome of Patient with Peptic Ulcer By Amal Mohamed Ahmad Assistant Professor, Medical-Surgical Nursing, Faculty of Nursing, Aswan
CMS ESRD Data Collection. Systems Overview. Jaya Bhargava, PhD, CPHQ Operations Director
 CMS ESRD Data Collection Systems Overview Jaya Bhargava, PhD, CPHQ Operations Director Relationship Between Dialysis Facility & The Network Under conditions for coverage, ESRD providers are required to
CMS TRANSPLANT PROGRAM QUALITY WEBINAR SERIES. James Ballard, MBA, CPHQ, CPPS, HACP Eileen Willey, MSN, BSN, RN, CPHQ, HACP
 CMS TRANSPLANT PROGRAM QUALITY WEBINAR SERIES Comprehensive Program and 5 Key Aspects James Ballard, MBA, CPHQ, CPPS, HACP Eileen Willey, MSN, BSN, RN, CPHQ, HACP QAPI Specialist/ Quality Surveyor Educators
EVOLENT HEALTH, LLC. Asthma Program Description 2018
 EVOLENT HEALTH, LLC Asthma Program Description 2018 1 Evolent Health Asthma Program Description 2018 Table of Contents Section Page Number I. Introduction... 3 II. Program Scope... 3 III. Program Goals...
CareMore Special Needs Plans Model of Care. Annual Evaluation 2015 Performance
 CareMore Special Needs Plans Model of Care Annual Evaluation 2015 Performance The Special Needs Plans (SNPs) Medicare SNPs are a type of Medicare Advantage Plan (like an HMO or PPO). Medicare SNPs limit
2016 Complex Case Management. Program Evaluation. Our mission is to improve the health and quality of life of our members
 2016 Complex Case Management Program Evaluation Our mission is to improve the health and quality of life of our members 2016 Complex Case Management Program Evaluation Table of Contents Program Purpose
Model of Care Scoring Guidelines CY October 8, 2015
 Model of Care Guidelines CY 2017 October 8, 2015 Table of Contents Model of Care Guidelines Table of Contents MOC 1: Description of SNP Population (General Population)... 1 MOC 2: Care Coordination...
Expression of Interest for Wound Care Project
 Expression of Interest for Wound Care Project November 11, 2016 Telewound Care EOI Page 1 of 12 Contents 1 Introduction... 3 2 Telewound Care Project Background... 4 2.1 Background... 4 2.2 Purpose...
The fully integrated laboratory ordering & reporting application
 The fully integrated laboratory ordering & reporting application Korus, our new patient-centered application, gives you Backed by clinical experts, designed to streamline your workflow Korus removes all
Cultural Transformation To Prevent Falls And Associated Injuries In A Tertiary Care Hospital p. 1
 Cultural Transformation To Prevent Falls And Associated Injuries In A Tertiary Care Hospital p. 1 2008 Pinnacle Award Application: Narrative Submission Cultural Transformation To Prevent Falls And Associated
PRISM Collaborative: Transforming the Future of Pharmacy PeRformance Improvement for Safe Medication Management
 PRISM Collaborative: Transforming the Future of Pharmacy PeRformance Improvement for Safe Medication Management Mission: To improve the health of the people of Connecticut through safe and effective medication
Maximizing the Power of Your Data. Peggy Connorton, MS, LNFA AHCA Director, Quality and LTC Trend Tracker
 Maximizing the Power of Your Data Peggy Connorton, MS, LNFA AHCA Director, Quality and LTC Trend Tracker Objectives Explore selected LTC Trend Tracker reports & features including: re-hospitalization,
South Carolina Rural Health Research Center
 Jan M. Eberth, PhD; Fozia Ajmal, PhD; Kevin Bennett, PhD; Janice C. Probst, PhD Key Findings ESRD Facility Characteristics by Rurality and Risk of Closure Rural dialysis facilities treat a low volume of
Network Agreement Packet
 ESRD NETWORK OF TEXAS, INC. Network Agreement Packet Forms to return: Facility Details and Primary Contacts Network Agreement Acknowledgment of Receipt Inside this packet: Goals and Objectives List of
REQUEST FOR PROPOSAL. Promoting physical activity and healthy eating to reduce the prevalence of obesity in Hawaii.
 REQUEST FOR PROPOSAL Promoting physical activity and healthy eating to reduce the prevalence of obesity in Hawaii. I. ABOUT THE HMSA FOUNDATION The HMSA Foundation s mission is to extend HMSA s commitment
2017 Quality Incentive Program (QIP) Quality Improvement Activity (QIA) Improving Kt/V Comprehensive Measure Score
 Quality Improvement Activity (QIA) Improving Kt/V Comprehensive Measure Score") 2017 Quality Incentive Program (QIP) Quality Improvement Activity (QIA) Improving Kt/V Comprehensive Measure Score Tish Lawson Team Leader February Kick Off Meeting Overview Facility Selection QIP-QIA
2017 Quality Incentive Program (QIP) Quality Improvement Activity (QIA) Improving Kt/V Comprehensive Measure Score Tish Lawson Team Leader February Kick Off Meeting Overview Facility Selection QIP-QIA