From Risk Scores to Impactability Scores:
|
|
|
- Marion McKinney
- 6 years ago
- Views:
Transcription

1 From Risk Scores to Impactability Scores: Innovations in Care Management Carlos T. Jackson, Ph.D. September 14, 2015
2 Outline Population Health What is Impactability? Complex Care Management Transitional Care Management

3 Population Health and Care Management Resources System Resources Population Needs
4
5 Using BIG Data to Make a Smarter First Pass Administrative data can never tell the whole story. However, in the context of managing a large, complex population, care managers need tools to help them narrow down the pool to those with the greatest likelihood of benefitting from their service. We are talking about using data for a smarter and more efficient first pass. Goal is to make best use of the scarce CM resource, and enable those personal care team-patient interactions to be more impactful. How you make that first pass is important: the goal is to find patients very likely to benefit from the intervention. And high risk is NOT the same thing as highly impactable.
, 4 used a total cost criteria (Ex: >$50K annual spend) 4 used a condition criteria (Ex: High risk diagnoses ) 8 used a utilization criteria (Ex: 2+ admits in past 6 mos ) 1 (CCNC) used")
6 Of the 20 programs interviewed: 15 used some formal risk score (Ex: HCC and LACE are most common off the shelf ; some use proprietary risk scores which aim to predict who will go to the hospital next), 4 used a total cost criteria (Ex: >$50K annual spend) 4 used a condition criteria (Ex: High risk diagnoses ) 8 used a utilization criteria (Ex: 2+ admits in past 6 mos ) 1 (CCNC) used Impactability Scores which take risk scores to the next level by applying them to real-world settings and measuring the observed impact from care management.
7 Key Discoveries: High Risk High Impactable
8 Difference Between Impactability and Risk Risk Scores: Predict the likelihood of a given event. However, typically only predict events/outcomes as part of usual care (i.e., if we didn t intervene, what might be expected to happen). Impactability Scores identify members who will benefit the most from a given intervention: There is strong evidence from our prior experience that a given intervention will result in a significant change in future cost and utilization. Requires controlled analyses to detect intervention impacts beyond regression to the mean. A good resource on this issue: Center for Healthcare Strategies (2009). Predictive Modeling: a Guide for State Medicaid Purchasers. 8


9 Cost Impactability vs. Risk Care Manager Intervenes Typical risk scores predict where a person is expected to be in the future. ] Impactability scores predict how much change can be expected when intervened. Time
10 Building Blocks for CCNC s HealthCare Analytics Rx Fill Data Inpatient Pattern ED Pattern Cost Trend Demographics Real-ti me ADT Feeds 3M Potentially Preventable Visits 3M Clinical Risk Groups CCNC s Real-World Care Management Experience, and analysis of outcomes
11 CCNC s Vast Experience Has Been Key to Identifying Opportunities Through CCNC s Care Management Information System, we are able to capture a variety of interventions delivered to a variety of patients Diverse population Diverse clinical complexity Diverse healthcare systems Diverse interventions CCNC also has the necessary volume to conduct these types of evaluations: 100,000+ receiving transitional care 100,000+ receiving complex care management Lots of opportunity for naturalistic experiments
12 The Pitfall of Targeting the Highest Risk Historically, care management efforts have been targeted at the highest risk. $0 $1K $2K $3K $4K $5K $6K $7K $8K $9K $10K $11K $12K $13K $14K $15K $16K $17K $18K $19K $20K Total Enrolled Population = Total costs for an individual
13 The Pitfall of Targeting the Highest Risk $0 $1K $2K $3K $4K $5K $6K $7K $8K $9K $10K $11K $12K $13K $14K $15K $16K $17K $18K $19K $20K Total Enrolled Population = Total costs for an individual
14 The Pitfall of Targeting the Highest Risk Risk Group #1 $0 $1K $2K $3K $4K $5K $6K $7K $8K $9K $10K $11K $12K $13K $14K $15K $16K $17K $18K $19K $20K Risk Group #2 $0 $1K $2K $3K $4K $5K $6K $7K $8K $9K $10K $11K $12K $13K $14K $15K $16K $17K $18K $19K $20K Risk Group #3 $0 $1K $2K $3K $4K $5K $6K $7K $8K $9K $10K $11K $12K $13K $14K $15K $16K $17K $18K $19K $20K Under conventional flagging methodology, all of these people might have been flagged; care management would likely have had minimal impact for most of them.

15 Identifying Previously Undiscovered Opportunities Risk Group #1 $0 $1K $2K $3K $4K $5K $6K $7K $8K $9K $10K $11K $12K $13K $14K $15K $16K $17K $18K $19K $20K Risk Group #2 $0 $1K $2K $3K $4K $5K $6K $7K $8K $9K $10K $11K $12K $13K $14K $15K $16K $17K $18K $19K $20K Risk Group #3 $0 $1K $2K $3K $4K $5K $6K $7K $8K $9K $10K $11K $12K $13K $14K $15K $16K $17K $18K $19K $20K = Potentially preventable hospital costs for an individual Takeaway points A risk -based model would target everybody in Risk Group #3 for care management because they have the greatest likelihood of incurring future spend/utilization. However, looking within individual risk groups, you see pockets of undiscovered opportunity, or impactability, for care management.


16 Care Management Impactability Score TM Score How Defined? What it means? Key Drivers Care Management Impactability Score TM A score from 0-1,000 reflecting likely cost saving, per month (over 6 months following care management); CCNC prioritizes patients with a CM Impactability Score above 200 Clinical characteristics and utilization patterns indicate a high likelihood of benefitting from care management. Claims-derived measures including: Above-Expected Potentially Preventable Hospital Costs: 3M Clinical Risk Groups 3M Potentially Preventable Flags Clinical Characteristics Utilization Patterns Demographics Take-aw ay points Prioritizing patients with a score of 200-1,000 flags less than 1% of the Medicaid population, but for these patients, we are confident that we can expect an average savings of $1,200 - $6,000 per patient receiving care management.


17 Conditions Themselves Don t Drive CM Impactability Select CRG's (for illustrative purposes) All Members Members w/ a CM Impactability Score TM = 200+ N N % Acute Lymphoid Leukemia Level % Asthma and Hypertension Level - 2 1, % COPD and Other Dominant Chronic Disease Level - 4 1, % Chronic Renal Failure - Diabetes - Other Dominant Chronic Disease Level % Congenital Quadriplegia, Diplegia or Hemiplegia Level - 2 1, % Congestive Heart Failure COPD - Other Dominant Chronic Disease Level % Congestive Heart Failure - Diabetes COPD Level % Diabetes and Asthma Level - 2 1, % Diabetes and Hypertension Level - 2 2, % Example: Two patients with advanced coronary artery disease and comorbidities, but very different impactability scores: Age 39 IP visits: 2 ED visits: 2 Costs above-expected: $0 Impactability Score= 228 Age 53 IP visits: 2 ED visits: 47 Only a small percentage within any clinical risk group is flagged as impactable Costs above-expected: $2,005 Impactability Score= 1,000
18 Methodology (Validation of CM Impactability Score TM ) Naturalistic Experiment Sample of 38,294 Non-dual Medicaid, CCNC-enrolled recipients with at least one prior ED or inpatient utilization: 23,455 Intervention patients who received some complex care management during FY ,839 historical Controls who did not receive care management Primary Outcome Measure Total Medicaid Spending During the 6-months after intervention, relative to spending during the 6-months prior to intervention Difference-in-difference approach comparing pre/post spend in control group
19 Total Sample = 38,294 CCNC Enrollees w/ history of inpatient and/or ED utilization Baseline spending among Random sample of 5,000 patients = $1,095 PMPM Mean number of ED = 2.8, IP = 0.4 5,000 Patients w/ highest CM Impactability Scores TM Baseline spending = $2,754 PMPM Mean number of ED = 10.1, IP = 1.0 5,000 highest Inpatient Utilizers Baseline spending = $4,024 PMPM Mean number of ED = 6.2, IP = 2.7 5,000 highest ED Superutilizers Baseline spending = $2,547 PMPM Mean number of ED = 13.8, IP = 1.0 NEXT The next slides will illustrate what happens to each of these populations when they receive care management versus not.
20 5,000 highest Inpatient Utilizers Baseline spending = $4,024 PMPM -$379 Net savings = $363 PMPM -$742
21 5,000 highest ED Superutilizers Baseline spending = $2,547 PMPM -$105 Net savings = $458 PMPM -$563
22 Total Sample = 38,294 CCNC Enrollees w/ history of inpatient and/or ED utilization Baseline spending among Random sample of 5,000 patients = $1,095 PMPM -$17 Net savings = $245 PMPM -$262
23 5,000 Patients w/ highest CM Impactability Scores TM Baseline spending = $2,754 PMPM $43 Net savings = $748 PMPM -$705


24 Summary Results from Complex Care Management $4,488 Estimated Savings Per Member Over 6 months $2,748 $2,178 $1,470 Impactability Inpatient Super-users ED Super-users Any prior IP or ED Visit Take-aw ay points The same investment in care managing 5,000 patients yields VERY different results depending on who you choose to manage.
25 Transitional Care Context
26 What about Impactability in the Context of Transitional Care? In general, we know Transitional Care (TC) works: Effectively reduces risk of future readmissions Effectively reduces risk of additional admissions Effect is long-lasting (differences still seen a year later) Effectively lowers future total cost of care Works better for some than others! Only about 25% of Medicaid discharges are likely to benefit meaningfully from a comprehensive TC care team support; Even within this 25% priority population, a smaller segment is most likely to benefit meaningfully from specific components that require higher resource intensity: home visit, pharmacist involvement, palliative care considerations, early outpatient follow-up A positive ROI from TC is highly dependent upon discerning and targeting the patients most likely to benefit.
27


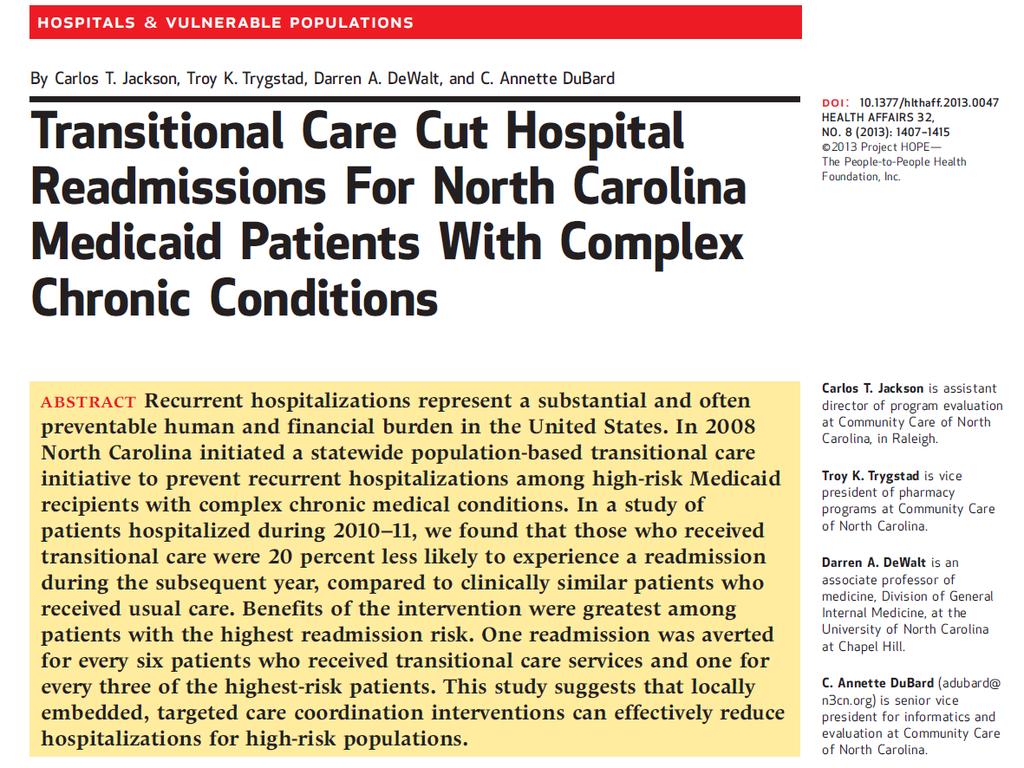
28 Proportion still out of the hospital Time to First Readmission for Patients Receiving Transitional Care Vs. Usual Care Among CCNC Transitional Care Priority Patients 1 Survival Function Takeaway points Patients with multiple chronic conditions, at high risk of readmission, will benefit greatly from transitional care. Effect is long-lasting Transitional Care Usual Care Months since discharge from the hospital Impactability


29 Proportion still out of the hospital Separating the Concepts of Risk and Impactability: Time to First Readmission for Patients Receiving Transitional Care Vs. Usual Care 1 Survival Function Takeaway points Not all patients benefit from transitional care intervention! Transitional Care Usual Care Months since discharge from the hospital
30
31
32 Lower is better Relative Likelihood of Being Readmitted Relative Impact of Different Face-to-Face Encounters on Reducing Readmissions Among TC Priority Patients Hospital Visit Only Practice Encounter Only Home Visit Lines represent the upper and lower confidence intervals; lines that cross 1.0 are considered not statistically significant.

33 Putting it into Action Real-time notification of care opportunities with care management priorities Other Flags to Inform Next Steps: Home Visit Priority Readmission risk >30% Palliative Care Priority High risk of mortality and preventable end-of-life spend Chronic Pain Priority Pattern of frequent narcotic fills and ED visits Risk of Drug Therapy Problem Risk of drug interaction, duplication, or adherence problems based on realtime medication data from multiple sources
34 Highest-Yield Care Management Opportunities (synopsis of 10+ years CCNC Experience) Transitional Care MUST be targeted toward patients with multiple chronic or catastrophic conditions to optimize ROI REQUIRES real-time notification of hospital admission/discharge; historical claims are most helpful for risk segmentation MOST EFFECTIVE as a community-level strategy with multidisciplinary care team approach Volume of Medicaid Hospital Discharges, by Patient Risk of 90-day Readmission Prioritized for High-Intensity TC support (home visit, pharmacist) NNT=3 Avg. savings $4,000 Prioritized for Lower-Intensity TC support NNT=6 Avg savings $1,000 >30% Risk 10-30% Risk <10% Risk * Reflects distribution of discharges after excluding deliveries and newborns
35 Validation of TC Impactability Score: Methodology We took a sample of ~60,000 Non-dual Medicaid recipients discharged from the hospital to their home during fiscal year 2011: We included all hospital discharges, excluding deliveries/newborns Then, we looked at what happened when looking at discharges in the top 25% for each approach: The 25% of discharges with the highest TC Impactability Scores Compared to: The 25% of discharges with the highest risk of an inpatient admission A validated risk model based on historical inpatient and pharmacy utilization The 25% of discharges with the highest Charlson Comorbidity Index A score denoting degree of clinical complexity and risk of mortality; often used to prioritize patients for transitional care management. Random 25% of discharges NEXT The next slides will illustrate what happens to each of these populations when they receive care management versus not.
36 25% w/ highest Admission Risk 5.6 averted readmissions per 100 patients receiving transitional care Readmissions (per 100 patients) in 6-Month Follow-up
37 25% w/ highest Charlson Comorbidity Index 5.9 averted readmissions per 100 patients receiving transitional care Readmissions (per 100 patients) in 6-Month Follow-up
38 25% of discharges (randomly chosen) 3.5 averted readmissions per 100 patients receiving transitional care Readmissions (per 100 patients) in 6-Month Follow-up
39 25% w/ highest TC Impactability Score TM 10.7 averted readmissions per 100 patients receiving transitional care Readmissions (per 100 patients) in 6-Month Follow-up
40 10.7 Averted Readmissions Per 100 Discharges Over 6 months "Impactability" "Admission Risk" Charlson Random Takeaway points The same investment in providing care transitions to 25% of the hospital discharges yields VERY different results depending on who you choose to manage.


41 $3,600 Estimated Savings Per Member Over 6 months $2,338 $2,552 $1,149 "Impactability" "Admission Risk" Charlson Random Takeaway points The same investment in providing care transitions to 25% of the hospital discharges yields VERY different results depending on who you choose to manage.


42 Special Case: Medicare Duals Group Percent Readmitted within 30 Days of Discharge Difference in Percent Readmitted Medicare Spend During the 6-Month Follow-up Period Difference in Medicare Spend Highest TC Impactability Score Highest HCC Score Control 38% $7,753 Intervention 24% -14% $6,015 -$1,738 Control 30% $6,603 Intervention 21% -9% $5,890 -$713 Source: ~2,000 inpatient discharges for Medicare Duals. Intervention was transitional care by a CCNC care manager that included a home visit for medication reconciliation. Control were patients that received no CCNC transitional care management. >Twofold Medicare Savings using TC Impactability Score vs. HCC Score as targeting strategy
43 CCNC s Transitional Care Impactability Scores TM : Real-world Applications
44 Cost vs. Savings So, far, we have only discussed the savings side of the equation. There is also a cost side. One of the advantages of CCNC s Impactability Scores TM is that they readily provide users with a measure of expected savings, equipping users with the ability to right-size their intervention to ensure a positive return on investment. CCNC has already made a significant investment in its infrastructure, thus minimizing the cost of the intervention for CCNC.
45 Impactability Scores and Resource Planning Impactability Score values represent expected average savings from defined intervention. For example, a patient with a CM Impactability Score TM of 300 is a patient for whom, if care managed, one could expect to achieve savings of $300 PMPM over the next 6 months, or $1,800 total Helpful for resource planning to optimize return on investment Example ROI Calculator Inputs Outputs Task category Minutes hourly salary/rate Cost Home Visit 90 $35 $73.56 Other Face to Face Encounters 65 $35 $16.77 Pharmacist 45 $60 $53.65 Non Face to Face Encounter BY a Care Manager 35 $35 $ Non Face to Face Encounter BY Non Clinician 30 $25 $44.61 Travel (in miles one-way) 50 $0.50 $50 Total $449 How much savings can you expect? High TC Low TC ED-Supers PPL TOTAL Patients ,598 Cost per patient $449 $146 $449 $399 Savings per patient $4,000 $1,500 $1,800 $1,400 ROI per patient $3,551 $1,354 $1,351 $1,001 ROI per Quarter $2,407,323 $744,599 $297,137 $150,094 $3,599,153
46 Case Example: Uninsured Population Hospitals incur substantial costs for delivering inpatient care to the uninsured, but it would be cost-prohibitive to provide transitional care to all uninsured patients. With intelligent targeting of the right patients, then the right amount of resources could be deployed to ensure a positive return on investment. Given typical readmission rates and avg. cost of hospital stay for uninsured, we can expect that 32 of 100 patients will be flagged for TC priority. TC for those 32 will prevent 5.3 readmissions and avert $44,000 of uncompensated care. Alternative targeting strategies would yield less savings. Approach Estimated cost savings from providing transitional care to 32 out of every 100 uninsured patients (depending on the targeting strategy used). CCNC s TC Impactability Score TM $43,990 Admission Risk Score $23,023 Charlson Comorbidity Index $24,256 Random $14,389
47 Case Example: Medicare Readmission Penalties If your current all-cause readmission rate is 18% and your aim is to bring that down to 14% (to avoid penalties), you would need to provide transitional care to just 20 of the highest impactable patients per 100 discharges. Number Needed to Treat using alternative targeting strategies: Approach For every 100 discharges, number needed to transition in order to reduce readmission rate by 4% (from 18% to 14%) CCNC s TC Impactability Score TM 20 Admission Risk Score 38 Charlson Comorbidity Index 36 Random 61
48 Building Blocks for CCNC s HealthCare Analytics Rx Fill Data Inpatient Pattern ED Pattern Cost Trend Demographics Realtime ADT Feeds 3M Potentially Preventable Visits 3M Clinical Risk Groups CCNC s Real-World Care Management Experience, and analysis of outcomes
49 Summary Population Health programs need tools to help them target patients for complex care management. Off-the-shelf risk scores are typically better than nothing at all for targeting patients most likely to benefit from either complex care management or transitional care management. Targeting the most impactable, however, can increase your return-oninvestment two-fold in most cases. Its many years of experience has equipped CCNC with the ability to know who those most impactable patients are which often aren t the highest risk patients. All interventions come with costs of implementation, and CCNC also has the experience necessary to right-size interventions so that the cost of delivering the intervention does not outweigh the expected benefit.
Healthcare IT and the Ecology of Medical Care: Leave No Doc Behind. Annette DuBard, MD, MPH Robert Eick, MD, MPH Marya Upchurch, MAC, MHA
 Healthcare IT and the Ecology of Medical Care: Leave No Doc Behind Annette DuBard, MD, MPH Robert Eick, MD, MPH Marya Upchurch, MAC, MHA The Ecology of Primary and Preventive Care For North Carolina Medicaid
Recommendations for Transitions of Care in North Carolina
 Recommendations for Transitions of Care in North Carolina FINAL REPORT June 30, 2014 Revised, July 31, 2014 Submitted to: North Carolina Office of Rural Health and Community Care 311 Ashe Avenue Raleigh,
Hot Spotter Report User Guide
 PATIENT-CENTERED CARE Hot Spotter Report User Guide Overview The Hot Spotter Report is designed to give providers and care team members a heads up when their attributed patients appear to be at risk for
Medicare Spending and Rehospitalization for Chronically Ill Medicare Beneficiaries: Home Health Use Compared to Other Post-Acute Care Settings
 Medicare Spending and Rehospitalization for Chronically Ill Medicare Beneficiaries: Home Health Use Compared to Other Post-Acute Care Settings May 11, 2009 Avalere Health LLC Avalere Health LLC The intersection
Medicare Spending and Rehospitalization for Chronically Ill Medicare Beneficiaries: Home Health Use Compared to Other Post-Acute Care Settings
 Medicare Spending and Rehospitalization for Chronically Ill Medicare Beneficiaries: Home Health Use Compared to Other Post-Acute Care Settings Executive Summary The Alliance for Home Health Quality and
Total Cost of Care Technical Appendix April 2015
 Total Cost of Care Technical Appendix April 2015 This technical appendix supplements the Spring 2015 adult and pediatric Clinic Comparison Reports released by the Oregon Health Care Quality Corporation
Deriving Value from a Health Information Exchange. HIMSS17 DA-CH Community Conference Healthix I New York I February 20, 2017
 Deriving Value from a Health Information Exchange HIMSS17 DA-CH Community Conference Healthix I New York I February 20, 2017 About Healthix About Healthix Hundreds of healthcare organizations at more than
Adopting Accountable Care An Implementation Guide for Physician Practices
 Adopting Accountable Care An Implementation Guide for Physician Practices EXECUTIVE SUMMARY November 2014 A resource developed by the ACO Learning Network www.acolearningnetwork.org Executive Summary Our
Keenan Pharmacy Care Management (KPCM)
") Keenan Pharmacy Care Management (KPCM) This program is an exclusive to KPS clients as an additional layer of pharmacy benefit management by engaging physicians and members directly to ensure that the best
Keenan Pharmacy Care Management (KPCM) This program is an exclusive to KPS clients as an additional layer of pharmacy benefit management by engaging physicians and members directly to ensure that the best
Comparison of Care in Hospital Outpatient Departments and Physician Offices
 Comparison of Care in Hospital Outpatient Departments and Physician Offices Final Report Prepared for: American Hospital Association February 2015 Berna Demiralp, PhD Delia Belausteguigoitia Qian Zhang,
medicaid commission on a n d t h e uninsured May 2009 Community Care of North Carolina: Putting Health Reform Ideas into Practice in Medicaid SUMMARY
 kaiser commission on medicaid SUMMARY a n d t h e uninsured Community Care of North Carolina: Putting Health Reform Ideas into Practice in Medicaid Why is Community Care of North Carolina (CCNC) of Interest?
Community Performance Report
 : Wenatchee Current Year: Q1 217 through Q4 217 Qualis Health Communities for Safer Transitions of Care Performance Report : Wenatchee Includes Data Through: Q4 217 Report Created: May 3, 218 Purpose of
Improving Service Delivery for Medicaid Clients Through Data Integration and Predictive Modeling
 Improving Service Delivery for Medicaid Clients Through Data Integration and Predictive Modeling Getty Images David Mancuso, PhD July 28, 2015 1 The Medicaid Environment Program costs are often driven
OptumRx: Measuring the financial advantage
 OptumRx: Measuring the financial advantage New study shows $11-16 PMPM medical savings when Optum care management and Optum pharmacy are provided together with medical benefits. Page 1 Synopsis Optum recently
An Overview of NCQA Relative Resource Use Measures. Today s Agenda
 An Overview of NCQA Relative Resource Use Measures Today s Agenda The need for measures of Resource Use Development and testing RRU measures Key features of NCQA RRU measures How NCQA calculates benchmarks
State FY2013 Hospital Pay-for-Performance (P4P) Guide
 Guide") State FY2013 Hospital Pay-for-Performance (P4P) Guide Table of Contents 1. Overview...2 2. Measures...2 3. SFY 2013 Timeline...2 4. Methodology...2 5. Data submission and validation...2 6. Communication,
State FY2013 Hospital Pay-for-Performance (P4P) Guide Table of Contents 1. Overview...2 2. Measures...2 3. SFY 2013 Timeline...2 4. Methodology...2 5. Data submission and validation...2 6. Communication,
TC911 SERVICE COORDINATION PROGRAM
 TC911 SERVICE COORDINATION PROGRAM ANALYSIS OF PROGRAM IMPACTS & SUSTAINABILITY CONDUCTED BY: Bill Wright, PhD Sarah Tran, MPH Jennifer Matson, MPH The Center for Outcomes Research & Education Providence
Turning Big Data Into Better Care
 Turning Big Data Into Better Care Dickson Advanced Analytics DA 2 Who is CHS and What is DA 2? 2 Who is CHS? Hospitals 42 Employees 62K Care Centers 900+ Physicians 3K Licensed Beds 7,800 Nurses 14K 3
Innovating Predictive Analytics Strengthening Data and Transfer Information at Point of Care to Improve Care Coordination
 Innovating Predictive Analytics Strengthening Data and Transfer Information at Point of Care to Improve Care Coordination November 15, 2017 RRHA Healthcare Innovations Conference Agenda Arnot Health Overview
3M Health Information Systems. 3M Clinical Risk Groups: Measuring risk, managing care
 3M Health Information Systems 3M Clinical Risk Groups: Measuring risk, managing care 3M Clinical Risk Groups: Measuring risk, managing care Overview The 3M Clinical Risk Groups (CRGs) are a population
Risk Adjusted Diagnosis Coding:
 Risk Adjusted Diagnosis Coding: Reporting ChronicDisease for Population Health Management Jeri Leong, R.N., CPC, CPC-H, CPMA, CPC-I Executive Director 1 Learning Objectives Explain the concept Medicare
Paying for Outcomes not Performance
 Paying for Outcomes not Performance 1 3M. All Rights Reserved. Norbert Goldfield, M.D. Medical Director 3M Health Information Systems, Inc. #Health Information Systems- Clinical Research Group Created
NGA Paper. Using Data to Better Serve the Most Complex Patients: Highlights from NGA s Intensive Work with Seven States
 NGA Paper Using Data to Better Serve the Most Complex Patients: Highlights from NGA s Intensive Work with Seven States Executive Summary Across the country, health care systems continue to grapple with
PRIMARY PARTNERS, LLC. Our Journey with the State HIE
 PRIMARY PARTNERS, LLC Our Journey with the State HIE About Us As a 2012 starter, Primary Partners was one of the 1 st Medicare ACO s in the country Our 2 nd Medicare ACO was formed in 2013 In late 2014
Tennessee Health Care Innovation Initiative
 Tennessee Health Care Innovation Initiative More information available at: http://www.tn.gov/hcfa/strategic.shtml State Innovation Model grant 2 1 State Innovation Model (SIM) funding Last week the Centers
Exhibit 1. Medicare Shared Savings Program: Year 1 Performance of Participating Accountable Care Organizations (2013)
") Exhibit 1. Medicare Shared Savings Program: Year 1 Performance of Participating Accountable Care Organizations (2013) 24 percent (52 ACOs) earned shared savings bonus 27 percent (60 ACOs) reduced spending,
Exhibit 1. Medicare Shared Savings Program: Year 1 Performance of Participating Accountable Care Organizations (2013) 24 percent (52 ACOs) earned shared savings bonus 27 percent (60 ACOs) reduced spending,
Disease Management at Anthem West Or: what have we learned in trying to design these programs?
 Disease Management at Anthem West Or: what have we learned in trying to design these programs? Lisa M. Latts, MD, MSPH Regional Medical Director May 12, 2003 Anthem Inc. Anthem Inc. Headquarters: Indianapolis
POPULATION HEALTH PLAYBOOK. Mark Wendling, MD Executive Director LVPHO/Valley Preferred 1
 POPULATION HEALTH PLAYBOOK Mark Wendling, MD Executive Director LVPHO/Valley Preferred www.populytics.com 1 Today s Agenda Outline LVHN, LVPHO and Populytics Overview Population Health Approach Population
ICRC Extended Study Hall Call Series: An Update on Using Medicare Data to Integrate Care for Medicare-Medicaid Enrollees
 ICRC Extended Study Hall Call Series: An Update on Using Medicare Data to Integrate Care for Medicare-Medicaid Enrollees December 3, 2012 For audio, dial: 1-800-273-7043; Passcode 596413 The Integrated
Advocate Cerner Partnership Creates Big Data Analytics for Population Health
 Advocate Cerner Partnership Creates Big Data Analytics for Population Health Tina Esposito, VP Center for Health Information Services Rishi Sikka, MD, Senior VP Clinical Operations Scottsdale Institute
Integrated Health System
 Integrated Health System Please note that the views expressed are those of the conference speakers and do not necessarily reflect the views of the American Hospital Association and Health Forum. Page 2
A Regional Payer/Provider Partnership to Reduce Readmissions The Bronx Collaborative Care Transitions Program: Outcomes and Lessons Learned
 A Regional Payer/Provider Partnership to Reduce Readmissions The Bronx Collaborative Care Transitions Program: Outcomes and Lessons Learned Stephen Rosenthal, MBA President and COO, Montefiore Care Management
Health and Long-Term Care Use Patterns for Ohio s Dual Eligible Population Experiencing Chronic Disability
 Health and Long-Term Care Use Patterns for Ohio s Dual Eligible Population Experiencing Chronic Disability Shahla A. Mehdizadeh, Ph.D. 1 Robert A. Applebaum, Ph.D. 2 Gregg Warshaw, M.D. 3 Jane K. Straker,
California s Health Homes Program
 California s Health Homes Program HPSM Network Webinar 9/05/18 Goals for Today: Health Homes Program overview CB-CME requirements Program readiness and implementation timeline Gather take-away questions
Evaluation of Pharmacy Delivery Models
 Evaluation of Pharmacy Delivery Models As Required By House Bill 1, 84th Legislature, Regular Session, 2015 (Article II, Health and Human Services Commission, Rider 83) Health and Human Services Commission
Clinical Webinar: Integrated Pharmacy
 Clinical Webinar: Integrated Pharmacy Benjamin Gross, Pharm D, MBA, BCPS, BCACP, CDE, BC ADM, ASH CHC Associate Professor Director of Residency Programs Lipscomb University College of Pharmacy Objectives
Community Discharge and Rehospitalization Outcome Measures (Fiscal Year 2011)
") Andrew Kramer, MD Ron Fish, MBA Sung-joon Min, PhD Providigm, LLC Community Discharge and Rehospitalization Outcome Measures (Fiscal Year 2011) A report by staff from Providigm, LLC, for the Medicare Payment
Andrew Kramer, MD Ron Fish, MBA Sung-joon Min, PhD Providigm, LLC Community Discharge and Rehospitalization Outcome Measures (Fiscal Year 2011) A report by staff from Providigm, LLC, for the Medicare Payment
The Pain or the Gain?
 The Pain or the Gain? Comprehensive Care Joint Replacement (CJR) Model DRG 469 (Major joint replacement with major complications) DRG 470 (Major joint without major complications or comorbidities) Actual
A Virtual Ward to prevent readmissions after hospital discharge
 A Virtual Ward to prevent readmissions after hospital discharge Irfan Dhalla MD MSc FRCPC Departments of Medicine and Health Policy, Management and Evaluation, University of Toronto Keenan Research Centre,
Predicting 30-day Readmissions is THRILing
 2016 CLINICAL INFORMATICS SYMPOSIUM - CONNECTING CARE THROUGH TECHNOLOGY - Predicting 30-day Readmissions is THRILing OUT OF AN OLD MODEL COMES A NEW Texas Health Resources 25 hospitals in North Texas
Community Care of North Carolina
 Community Care of North Carolina 2007 Community Care of North Carolina Mail Service Center 2009 Raleigh, NC 27699-2009 (919) 715-1453 www.communitycarenc.com Background Several networks in the Community
04/08/2015. Thinking Beyond the Hospital Walls: Readmission Reduction Strategies for Pharmacists. Pharmacist Objectives. Technician Objectives
 1 2 Thinking Beyond the Hospital Walls: Readmission Reduction Strategies for Pharmacists Stacey Zorska, Pharm.D., MHA Director of Pharmacy Services Southwest General Middleburg Heights, OH Pharmacist Objectives
Reforming Health Care with Savings to Pay for Better Health
 Reforming Health Care with Savings to Pay for Better Health Mark McClellan, MD PhD Director, Initiative on Health Care Value and Innovation Senior Fellow, Economic Studies October 2014 National Forum on
Utilizing a Pharmacist and Outpatient Pharmacy in Transitions of Care to Reduce Readmission Rates. Disclosures. Learning Objectives
 Utilizing a Pharmacist and Outpatient Pharmacy in Transitions of Care to Reduce Readmission Rates. Disclosures Rupal Mansukhani declares grant support from the Foundation for. Rupal Mansukhani, Pharm.D.
A Care Coordination Model for Value-Based Performance Programs
 A Care Coordination Model for Value-Based Performance Programs Richard S. Chung, MD Chief Clinical Officer APS Healthcare 8th National Pay for Performance (P4P) Summit February 20, 2013 Hyatt Regency Hotel,
Understanding Medi-Cal s High-Cost Populations
 Understanding Medi-Cal s High-Cost Populations June 2015 Created by the DHCS Research and Analytic Studies Certified Eligibles in Millions 14.0 12.0 10.0 8.0 6.0 4.0 2.0 0.0 Current Trends In Medi-Cal
Managing Patients with Multiple Chronic Conditions
 Best Practices Managing Patients with Multiple Chronic Conditions Dartmouth-Hitchcock Physicians Case Study Organization Profile Headquartered in Bedford, New Hampshire, Dartmouth-Hitchcock is a large
Preventable Readmissions
 Preventable Readmissions Strategy to reduce readmissions and increase quality needs to have the following elements A tool to identify preventable readmissions Payment incentives Public reporting Quality
Special Needs Plans (SNP) Model of Care (MOC) Initial and Annual Training
 Model of Care (MOC) Initial and Annual Training") Special Needs Plans (SNP) Model of Care (MOC) Initial and Annual Training 2018 Learning Objectives Program participants will be able to: List the three overall goals of the SNP Model of Care Describe the
Special Needs Plans (SNP) Model of Care (MOC) Initial and Annual Training 2018 Learning Objectives Program participants will be able to: List the three overall goals of the SNP Model of Care Describe the
BCBSM Physician Group Incentive Program
 BCBSM Physician Group Incentive Program Organized Systems of Care Initiatives Interpretive Guidelines 2012-2013 V. 4.0 Blue Cross Blue Shield of Michigan is a nonprofit corporation and independent licensee
The Role of Analytics in the Development of a Successful Readmissions Program
 The Role of Analytics in the Development of a Successful Readmissions Program Pierre Yong, MD, MPH Director, Quality Measurement & Value-Based Incentives Group Centers for Medicare & Medicaid Services
Episode Payment Models:
 Episode Payment Models: Cardiac Bundle Initiative HFMA Florida Chapter (North Florida) October 25, 2016 Robert Howey MBA, MHA, CPA Revenue Cycle Manager 2016 MFMER slide-1 Objective After the session,
PPS Performance and Outcome Measures: Additional Resources
 PPS Performance and Outcome Measures: PPS Performance and Outcome Measures: This document includes supplemental resources to the content on PPS Performance and Outcome Measures presented at the December
UnitedHealth Center for Health Reform & Modernization September 2014
 Health Reform & Modernization September 2014 2014 UnitedHealth Group. Any use, copying or distribution without written permission from UnitedHealth Group is prohibited. Overview Why Focus on Primary Care?
Medicaid Hospital Incentive Payments Calculations
 Medicaid Hospital Incentive Payments Calculations Note: This guidance is intended to assist hospitals and others in understanding Medicaid hospital incentive payment calculations. However, all hospitals
Improving Medicaid Chronic Disease Care and Controlling Costs. The Case for Medical Homes and Community Networks
 Improving Medicaid Chronic Disease Care and Controlling Costs The Case for Medical Homes and Community Networks L. Allen Dobson,Jr. MD FAAFP Chair -Board of Directors NC Community Care Networks, Inc HOME
Maternity Management. The best part? These are available to you at no additional cost. Intro
 Telligen provides the following services for Connecticut Carpenters members to help you better manage your health and enjoy a good quality of life. The programs include both Maternity Management and Condition
Payer s Perspective on Clinical Pathways and Value-based Care
 Payer s Perspective on Clinical Pathways and Value-based Care Faculty Stephen Perkins, MD Chief Medical Officer Commercial & Medicare Services UPMC Health Plan Pittsburgh, Pennsylvania perkinss@upmc.edu
paymentbasics The IPPS payment rates are intended to cover the costs that reasonably efficient providers would incur in furnishing highquality
 Hospital ACUTE inpatient services system basics Revised: October 2015 This document does not reflect proposed legislation or regulatory actions. 425 I Street, NW Suite 701 Washington, DC 20001 ph: 202-220-3700
SNF * Readmissions Bootcamp The SNF Readmission Penalty, Post-Acute Networks, and Community Collaboratives
 SNF * Readmissions Bootcamp The SNF Readmission Penalty, Post-Acute Networks, and Community Collaboratives Lindsay Holland, MHA Associate Director, Care Transitions Health Services Advisory Group (HSAG)
Comprehensive Medication Management (CMM) for Hypertension Patients: Driving Value and Sustainability
 for Hypertension Patients: Driving Value and Sustainability") Comprehensive Medication Management (CMM) for Hypertension Patients: Driving Value and Sustainability Steven W. Chen PharmD, FASHP, FCSHP, FNAP Associate Dean for Clinical Affairs chens@usc.edu, 323-206-0427
Comprehensive Medication Management (CMM) for Hypertension Patients: Driving Value and Sustainability Steven W. Chen PharmD, FASHP, FCSHP, FNAP Associate Dean for Clinical Affairs chens@usc.edu, 323-206-0427
State Policy Report #47. October Health Center Payment Reform: State Initiatives to Meet the Triple Aim. Introduction
 Health Center Payment Reform: State Initiatives to Meet the Triple Aim State Policy Report #47 October 2013 Introduction Policymakers at both the federal and state levels are focusing on how best to structure
Using Data for Proactive Patient Population Management
 Using Data for Proactive Patient Population Management Kate Lichtenberg, DO, MPH, FAAFP October 16, 2013 Topics Review population based care Understand the use of registries Harnessing the power of EHRs
2016 Complex Case Management. Program Evaluation. Our mission is to improve the health and quality of life of our members
 2016 Complex Case Management Program Evaluation Our mission is to improve the health and quality of life of our members 2016 Complex Case Management Program Evaluation Table of Contents Program Purpose
Oregon s Health System Transformation: The Coordinated Care Model. March 2014 Jeanene Smith MD, MPH Chief Medical Officer- Oregon Health Authority
 Oregon s Health System Transformation: The Coordinated Care Model March 2014 Jeanene Smith MD, MPH Chief Medical Officer- Oregon Health Authority The Challenges Oregon Faced Rising healthcare costs outpacing
Transforming Clinical Care: Why Optimization of Clinical Systems Can t Wait
 Transforming Clinical Care: Why Optimization of Clinical Systems Can t Wait A White Paper March 2016 Impact Advisors LLC 400 E. Diehl Road Suite 190 Naperville IL 60563 1-800-680-7570 Impact-Advisors.com
The Future of Post-Acute Care Under Value-Based Payment
 The Future of Post-Acute Care Under Value-Based Payment Robert Mechanic, MBA Brandeis University Northeast Home Health Leadership Summit January 22, 2015 Medicare Margins for Freestanding Home Health Agencies
The Drive Towards Value Based Care
 The Drive Towards Value Based Care Thursday, March 3, 2016 Michael Aratow, MD, FACEP Chief Medical Information Officer, San Mateo Medical Center Gaurav Nagrath, MBA, Sr. Strategist, Population Health Research
Webinar. Reducing Readmissions with BI and Analytics. 23 March 2018 Copyright 2016 AAJ Technologies All rights reserved.
 Webinar Reducing Readmissions with BI and Analytics Copyright Reducing 2016 Readmissions AAJ Technologies with BI and All rights Analytics reserved. www.aajtech.com Hospital Readmissions Michele Russell,
Use of Health Information Technology to Reduce Health Risk
 Use of Health Information Technology to Reduce Health Risk Sandra M. Foote Senior Advisor, Chronic Care Improvement Centers for Medicare & Medicaid Services September 9, 2005 The MHS Challenge Develop
Next Generation Physician Compensation Design in a Schizophrenic Payer Environment
 Next Generation Physician Compensation Design in a Schizophrenic Payer Environment Presented to: 2015 Spring Managed Care Forum Friday, April 24, 2015 Today s agenda Setting the Stage Why are we Here?
New York State s Ambitious DSRIP Program
 New York State s Ambitious DSRIP Program A Case Study Speaker: Denise Soffel, Ph.D., Principal May 28, 2015 Information Services Webinar HealthManagement.com HealthManagement.com HealthManagement.com HealthManagement.com
SoonerCare Health Management Program 2 nd National Predictive Modeling Summit. Washington, DC.
 SoonerCare Health Management Program 2 nd National Predictive Modeling Summit. Washington, DC. Lynn Puckett Oklahoma Health Care Authority Karl Weimer MEDai, Inc., An Elsevier Company 08/28/2008 1 Agenda
Publication Development Guide Patent Risk Assessment & Stratification
 OVERVIEW ACLC s Mission: Accelerate the adoption of a range of accountable care delivery models throughout the country ACLC s Vision: Create a comprehensive list of competencies that a risk bearing entity
Quality Based Impacts to Medicare Inpatient Payments
 Quality Based Impacts to Medicare Inpatient Payments Overview New Developments in Quality Based Reimbursement Recap of programs Hospital acquired conditions Readmission reduction program Value based purchasing
4/9/2016. The changing health care market THE CHANGING HEALTH CARE MARKET. CPAs & ADVISORS
 CPAs & ADVISORS experience support // ADVANCED PAYMENT MODELS: CJR Eric. M. Rogers MEd. RT(R) Managing Consultant The changing health care market THE CHANGING HEALTH CARE MARKET HHS goal of 30% of traditional
Innovative Ways of Achieving The Triple Aim: Lessons from a Rural Community Health System
 Innovative Ways of Achieving The Triple Aim: Lessons from a Rural Community Health System Roxanne Elliott, MS Policy Director FirstHealth of the Carolinas Goals For Today Review scope of project Integrate
Hospital Inpatient Quality Reporting (IQR) Program
 Program") Clinical Episode-Based Payment (CEBP) Measures Questions & Answers Moderator Candace Jackson, RN Project Lead, Hospital IQR Program Hospital Inpatient Value, Incentives, and Quality Reporting (VIQR) Outreach
Clinical Episode-Based Payment (CEBP) Measures Questions & Answers Moderator Candace Jackson, RN Project Lead, Hospital IQR Program Hospital Inpatient Value, Incentives, and Quality Reporting (VIQR) Outreach
Quality Outcomes and Data Collection
 Quality Outcomes and Data Collection Presented By: Joanne Jones Director, Clinical Consulting Services August 30, 2016 Quality Measurement in LTC CMS Nursing Home Compare 5 Star Rating System New measures
Session 74 PD, Innovative Uses of Risk Adjustment. Moderator: Joan C. Barrett, FSA, MAAA
 Session 74 PD, Innovative Uses of Risk Adjustment Moderator: Joan C. Barrett, FSA, MAAA Presenters: Jill S. Herbold, FSA, MAAA Robert Anders Larson, FSA, MAAA Erica Rode, ASA, MAAA SOA Antitrust Disclaimer
Objectives 2/23/2011. Crossing Paths Intersection of Risk Adjustment and Coding
 Crossing Paths Intersection of Risk Adjustment and Coding 1 Objectives Define an outcome Define risk adjustment Describe risk adjustment measurement Discuss interactive scenarios 2 What is an Outcome?
Dual Eligibles: Medicaid s Role in Filling Medicare s Gaps
 I S S U E P A P E R kaiser commission on medicaid and the uninsured March 2004 Dual Eligibles: Medicaid s Role in Filling Medicare s Gaps In 2000, over 7 million people were dual eligibles, low-income
Hospital Compare Quality Measures: 2008 National and Florida Results for Critical Access Hospitals
 Hospital Compare Quality Measures: National and Results for Critical Access Hospitals Michelle Casey, MS, Michele Burlew, MS, Ira Moscovice, PhD University of Minnesota Rural Health Research Center Introduction
THE HEALTH RESILIENCE PROGRAM
 THE HEALTH RESILIENCE PROGRAM A PROGRAM ASSESSMENT CONDUCTED BY: Keri Vartanian, PhD Sarah Tran, MPH Bill Wright, PhD Grace Li, PhD Megan Holtorf, MPH, CCRP Michael Levinson The Center for Outcomes Research
Programs and Procedures for Chronic and High Cost Conditions Related to the Early Retiree Reinsurance Program
 s and Procedures for Chronic and High Cost Conditions Related to the Early Retiree Reinsurance HealthPartners Disease and Case Management programs are targeted to those who have been identified with a
Analysis of 340B Disproportionate Share Hospital Services to Low- Income Patients
 Analysis of 340B Disproportionate Share Hospital Services to Low- Income Patients March 12, 2018 Prepared for: 340B Health Prepared by: L&M Policy Research, LLC 1743 Connecticut Ave NW, Suite 200 Washington,
STRATEGIES AND SOLUTIONS FOR REDUCING INAPPROPRIATE READMISSIONS
 WHITE PAPER STRATEGIES AND SOLUTIONS FOR REDUCING INAPPROPRIATE READMISSIONS This paper offers a two-pronged approach to lower readmission rates and avoid Federal penalties. Jasen W. Gundersen, M.D., M.B.A.,
Transitional Care Management. Marianne Durling, MHA, RHIA, CCS,CDIP, CPC,CPCO,CIC & Heather Greene, MBA, RHIA, CPC, CPMA
 Transitional Care Management Marianne Durling, MHA, RHIA, CCS,CDIP, CPC,CPCO,CIC & Heather Greene, MBA, RHIA, CPC, CPMA 2 Agenda Definitions Why Transitional Care TCM Overview TCM Model Case Study 3 Definitions
O U T C O M E. record-based. measures HOSPITAL RE-ADMISSION RATES: APPROACH TO DIAGNOSIS-BASED MEASURES FULL REPORT
 HOSPITAL RE-ADMISSION RATES: APPROACH TO DIAGNOSIS-BASED MEASURES FULL REPORT record-based O U Michael Goldacre, David Yeates, Susan Flynn and Alastair Mason National Centre for Health Outcomes Development
Describe the process for implementing an OP CDI program
 1 Outpatient CDI: The Marriage of MACRA and HCCs Marion Kruse, RN, MBA Founding Partner LYM Consulting Columbus, OH Learning Objectives At the completion of this educational activity, the learner will
THE ART OF DIAGNOSTIC CODING PART 1
 THE ART OF DIAGNOSTIC CODING PART 1 Judy Adams, RN, BSN, HCS-D, HCS-O June 14, 2013 2 Background Every health care setting has gone through similar changes in the need to code more thoroughly. We can learn
Using SAS Programing to Identify Super-utilizers and Improve Healthcare Services
 SESUG 2015 Paper 170-2015 Using SAS Programing to Identify Super-s and Improve Healthcare Services An-Tsun Huang, Department of Health Care Finance, Government of the District of Columbia ABSTRACT Super-s
Kathleen Kerr, BA Kerr Healthcare Analytics July 18, 2017
 Estimating the number of individuals eligible for SB1004 palliative care and appreciating baseline utilization patterns and costs toward the end of life Kathleen Kerr, BA Kerr Healthcare Analytics July
MTM Performance & Impact On Star Ratings 2016 & Beyond - OutcomesMTM Overview
 MTM Performance & Impact On Star Ratings 2016 & Beyond - OutcomesMTM Overview Today s Speaker Dan Rodriguez, RPh, BPharm Sr. Associate Network Performance OutcomesMTM Learning Objectives - Define Medication
September, James Misak, M.D. Linda Stokes, MSPH The MetroHealth System
 Better Health Greater Cleveland relies on the presenter to obtain all rights to use and display copyright-protected information. Anyone claiming a right or interest in or to any posted information should
Transitions of Care from a Community Perspective
 Transitions of Care from a Community Perspective ACMA Utah Chapter 2nd Annual Education Session Dr. Larry Garrett, PhD, MPH, BSN Sr. Project Manager, HealthInsight Presenting with the 5 I s Interactive
Health Homes in KanCare
 Health Homes in KanCare INTRODUCTION The term health home is unique to Medicaid Health homes are an option which states can choose to provide within their Medicaid programs A health home is not a building,
Generations Advantage Focus DC (HMO SNP) Diabetes Care Special Needs Plan GENERAL MODEL OF CARE (MOC) TRAINING
 Diabetes Care Special Needs Plan GENERAL MODEL OF CARE (MOC) TRAINING") Generations Advantage Focus DC (HMO SNP) Diabetes Care Special Needs Plan GENERAL MODEL OF CARE (MOC) TRAINING Through this training you will learn: What is a SNP? What is Martin s Point Generations Advantage
Generations Advantage Focus DC (HMO SNP) Diabetes Care Special Needs Plan GENERAL MODEL OF CARE (MOC) TRAINING Through this training you will learn: What is a SNP? What is Martin s Point Generations Advantage
Cloud Analytics As A Service
 Cloud Analytics As A Service Enabling Actionable Realtime Data Analytics July 13, 2016 Joanne White, CIO Mark Gerschutz, Director of IT Rick Crawford, Interface Architect Christine Wulff, RN, ED Analyst
PRISM Collaborative: Transforming the Future of Pharmacy PeRformance Improvement for Safe Medication Management
 PRISM Collaborative: Transforming the Future of Pharmacy PeRformance Improvement for Safe Medication Management Mission: To improve the health of the people of Connecticut through safe and effective medication