Final Recommendations on the Update Factors for FY 2017
|
|
|
- Ezra Burns
- 6 years ago
- Views:
Transcription
1 Final Recommendations on the Update Factors for FY 2017 June 8, 2016 Health Services Cost Review Commission 4160 Patterson Avenue Baltimore, Maryland (410) FAX: (410) This document represents the final revised recommendations as approved by the commission on June 8, 2016 (see revisions on pages 16-18).
2 Final Recommendations on the Update Factors for FY 2017 Table of Contents List of Abbreviations... 1 Introduction and Background... 2 Assessment... 3 Overview of Hospital Performance and Net Revenue Growth... 3 Calculation of the Update Factors for Revenue Categories Summary of Other Policies Impacting FY 2017 Revenues... 4 Components of Revenue Change Linked to Hospital Cost Drivers and Performance... 7 Components of Revenue Change that are Not Hospital Generated... 8 Medicare s Proposed National Rate Update for FFY Discussion of the FY 2017 Balanced Update PAU Savings Adjustment Investments in Care Coordination Market Shift Adjustment All-Payer Financial Test Medicare Financial Test Allowable Growth Stakeholder Input Recommendations Appendix I. Updating and Re-evaluating the Difference Statistic Methodology Appendix II. Comment Letters Attached... 25
3 Final Recommendations on the Update Factors for FY 2017 LIST OF ABBREVIATIONS ACA Affordable Care Act CMS Centers for Medicare & Medicaid Services CON Certif icate of need CY Calendar year FFS Fee-for-serv ice FFY Federal fiscal year FY Fiscal year GBR Global budget revenue HSCRC Health Services Cost Review Commission MHIP Maryland Health Insurance Plan PAU Potentially avoidable utilization RY Rate year TPR Total patient revenue UCC Uncom pensated care 1
4 INTRODUCTION AND BACKGROUND Final Recommendations on the Update Factors for FY 2017 The Maryland Health Services Cost Review Commission (HSCRC or Commission) has been setting hospital payment rates for all payers since As part of this process, the HSCRC updates hospitals rates and approved revenues on July 1 of each year to account for such factors as inflation, policy adjustments, and other adjustments related to performance and settlements from the prior year. On January 1, 2014, the Centers for Medicare & Medicaid Services (CMS) approved the implementation of a New All-Payer Model in Maryland. The All-Payer Model has a triple aim of promoting better care, better health, and lower costs for all Maryland patients. In contrast to Maryland s previous Medicare waiver that focused on controlling increases in Medicare inpatient payments per case, the New All-Payer Model focuses on controlling increases in total hospital revenue per capita. The Model established a cumulative annual limit on per capita growth of 3.58 percent and a Medicare savings target of $330 million over the initial five-year period of the Model. The update process needs to account for all sources of hospital revenue that will contribute to the growth of total Maryland hospital revenues for Maryland residents in order to meet the requirements of the New All-Payer Model and assure that the annual update will not result in a revenue increase beyond the 3.58 percent limit. In addition, the HSCRC needs to consider the effects of the update on the Model s $330 million Medicare savings requirement and the total hospital revenue that is set at risk for quality-based programs. While rates and global budgets are approved on a fiscal year basis, the New All-Payer Model revenue limits and Medicare savings are determined on a calendar year basis. Therefore, the HSCRC must account for both calendar year and fiscal year revenues in establishing the updates for the fiscal year. It is important to understand that the proposed updates incorporate both price and volume adjustments for revenues under global budgets. Thus, the proposed updates should not be compared to a rate update that does not control for volume changes. It is also important to view the revenue updates in the framework of gross and net revenue. During the past three years, the expansion of Medicaid and other Affordable Care Act (ACA) enrollment has reduced uncompensated care (UCC), resulting in the State reducing several revenue assessments. The associated rate reductions for UCC and assessment reductions implemented by HSCRC decrease gross revenues, but they do not decrease net revenues. Therefore, the net revenue increases during these periods are higher than gross revenue increases. There are three categories of hospital revenue under the New All-Payer Model. The first two categories are under the HSCRC s full rate-setting authority. The third category of hospital revenue includes hospitals where HSCRC sets rates, but Medicare does not pay on the basis of those rates. The three categories of hospital revenue are: 1. Hospitals/revenues under global budgets, including Global Budget Revenue (GBR) agreements and Total Patient Revenue (TPR) agreements for the 10 hospitals that were renewed on July 1, 2013, for their second three-year term. 2
5 Final Recommendations on the Update Factors for FY Hospital revenues that are not included under global budgets but are subject to rate regulation on an all-payer basis by the HSCRC, such as revenues for out-of-state residents at certain hospitals. 3. Hospital revenues for which the HSCRC sets the rates paid by non-governmental payers and purchasers, but where CMS has not waived Medicare's rate-setting authority to Maryland. This includes psychiatric hospitals and Mount Washington Pediatric Hospital. The purpose of this report is to present analyses and make recommendations for the update factors for fiscal year (FY) ASSESSMENT Overview of Hospital Performance and Net Revenue Growth Since the initiation of the All Payer Model effective January 1, 2014, Maryland hospitals in the aggregate have been provided revenue budgets that allow for investments in care coordination and other infrastructure to implement care improvement and population health initiatives. At the same time, hospitals have experienced increased profitability from regulated revenues. This improvement in financial condition can be credited, in large measure, to the success of hospitals in rapid adoption of global budget models, adoption of interventions that have moderated or decreased utilization, implementation of cost controls, and increases in revenues provided by the HSCRC for care coordination infrastructure. Additionally, actual inflation estimates have turned out to be lower than the amount provided in rate updates for the last two years. This higher inflation in rates has allowed for additional investments in care coordination and population health. For the final six months of FY 2014 (January through June of 2014), HSCRC staff estimates net regulated revenue growth of 0.91 percent, representing one-half of the growth reported in the hospitals 2014 annual filing data annualized for hospitals with changes in year-end submission dates. For FY 2015, net regulated revenue grew by 4.43 percent, also based on amounts reported in hospitals annual filings. For FY 2016 to date (through April 2016), net patient revenue growth, as reported on the interim unaudited FS schedules, was 4.02 percent. For RY 2017, the HSCRC staff is proposing a lower update, estimating a 2.80 percent growth in net revenues. This lower update uses a lower future inflation factor. It also reflects an incremental savings adjustment of 0.45 percent. When the Commission increased the update factor in RY 2016 for care coordination infrastructure, it laid out an expectation of future savings. To effectuate this moderation, staff proposed an increase in the savings adjustment for avoidable utilization of 0.45 percent over the prior 0.20 percent adjustment that was focused on readmissions. Hospitals have commented that the proposed net revenue growth allowed for RY 2017 is too low. However, the HSCRC staff believes that the proposed revenue growth is adequate but not excessive, especially in light of the CMS projection of 1.2 percent revenue growth per Medicare beneficiary estimated for calendar year (CY) 2016 and the estimated Medicare performance for CY 2015, as Maryland hospitals ended the year just under the national growth rate. Other 3
6 Final Recommendations on the Update Factors for FY 2017 commenters have indicated that staff should provide a lower update in light of the increase already in place for RY 2016, which extends into CY HSCRC staff does not agree with the need for further reductions at this time. We intend to closely monitor performance on a monthly basis. Calculation of the Update Factors for Revenue Categories 1-3 In this final recommendation, staff focused on the update factor for inflation/trend for hospitals or revenues in each of the three categories. Separate staff reports provide recommendations on UCC and potentially avoidable utilization (PAU) savings. The inflation/trend adjustment for Category 1 and Category 2 revenues starts by using the gross blended statistic of 2.49 percent growth, which was derived from combining 91.2 percent of Global Insight s First Quarter 2016 market basket growth of 2.60 percent with 8.80 percent of the capital growth estimate of 1.30 percent. For the global revenues, staff has determined that the correction factor to the First Quarter market basket growth estimate has averaged percent for the last three years. Staff is applying the correction factor in advance, in order to avoid overstatement of growth for FY For non-global revenues, staff applies the 0.50 percent reduction for productivity and a reduction of 0.75 percent for ACA adjustments that are equivalent to the amount used in Medicare s proposed inpatient prospective payment system update for FY As a result, the proposed inflation/trend adjustment would be as follows: Table 1. FY 2017 Proposed Rate Adjustments Global Revenues Non-Global Revenues Proposed Base Update 2.49% 2.49% Productivity Adjustment -0.50% ACA Adjustment -0.75% Average Correction Factor -0.56% Proposed Update 1.92% 1.24% For psychiatric hospitals and Mt. Washington Pediatric Hospital, staff turns to the proposed psychiatric facility update for Medicare. Medicare applies a 0.50 percent reduction for productivity and a 0.75 percent reduction for ACA savings mandates to a market basket update of 2.80 percent to derive a net amount of 1.55 percent. HSCRC staff recommends adopting the same factor and net adjustments for the Maryland psychiatric hospitals and Mt. Washington Pediatric Hospital. Summary of Other Policies Impacting FY 2017 Revenues The update factor is just one component of the adjustments to hospital global budgets for FY In considering the system-wide update for the All-Payer Model, staff sought balance 4
7 Final Recommendations on the Update Factors for FY 2017 among the following conditions: 1) meeting the requirements of the All-Payer Model agreement; 2) providing hospitals with the necessary resources to keep pace with changes in inflation and demographic changes; 3) ensuring that hospitals have adequate resources to invest in the care coordination and population health strategies necessary for long-term success under the All- Payer Model; and 4) incorporating the expectations of reduced avoidable utilization. Table 2 summarizes the net impact on global revenues of staff proposals for inflation, volume, PAU savings, UCC, and other adjustments. The proposed adjustments provide for estimated net revenue growth of 2.80 percent and per capita growth of 2.28 percent for FY 2017 before accounting for reductions in UCC and assessments. After accounting for those factors, the revenue growth is estimated at 2.16 percent with a corresponding per capita growth of 1.63 percent. Descriptions and policy considerations are discussed for each step in the text following the table. 5
8 Final Recommendations on the Update Factors for FY 2017 Table 2. Net Impact of Update Factors on Hospital Global Revenues, FY 2017 Balanced Update Model for Discussion Components of Revenue Change Linked to Hospital Cost Drivers/Performance Weighted Allowance Adjustment for Inflation 1.72% - Total Drug Cost Inflation for All Hospitals* 0.20% Gross Inflation Allowance A 1.92% Implementation for Partnership Grants B 0.25% Care Coordination -Rising Risk With Community Based Providers -Complex Patients With Regional Partnerships & Community Partners -Long Term Care & Post Acute C Adjustment for volume D 0.52% -Demographic Adjustment -Transfers -Categoricals Other adjustments (positive and negative) - Set Aside for Unknown Adjustments (Includes.10 Earmark**) E 0.50% - Workforce Support Program F 0.06% - Holy Cross Germantown G 0.07% - Non Hospital Cost Growth H 0.00% Net Other Adjustments I = Sum of E thru H 0.63% -Reverse prior year's PAU savings reduction J 0.60% -PAU Savings K -1.25% -Reversal of prior year quality incentives L -0.15% -Positive incentives & Negative scaling adjustments M 0.27% Net Quality and PAU Savings N = Sum of J thru M -0.53% Net increase attributable to hospitals O = Sum of A + B + C + D + I + N 2.80% Per Capita P = (1+O)/(1+0.52%) 2.27% Components of Revenue Offsets with Neutral Impact on Hosptial Finanical Statements -Uncompensated care reduction, net of differential Q -0.49% -Deficit Assessment R -0.15% Net decreases S = Q + R -0.64% Revenue growth, net of offsets T = O + S 2.16% Per capita revenue growth U = (1+V)/(1+0.52%) 1.63% * Provided Based on proportion of drug cost to total cost **Earmark 0.10 percent for new outpatient infusion and chemotherapy drugs 6
9 Final Recommendations on the Update Factors for FY 2017 Components of Revenue Change Linked to Hospital Cost Drivers and Performance Staff accounted for a number of factors that are linked to hospital costs and performance. These include: Adjustments for Volume: Staff proposes a 0.52 percent adjustment that is equal to the Maryland Department of Planning s estimate of population growth for CY In the previous year, staff used an estimate based on five-year population growth projections. For the last two years, the actual growth estimate has been lower than the forecast. As a result, staff proposes to use the most recent growth rate as a proxy for the 2017 growth estimate. Hospital-specific adjustments will vary based on changes in the demographics of each hospital s service area, as well as the portion of the adjustment set aside to account for growth in highly specialized services. Rising Cost of New Drugs: The rising cost drugs, particularly of new physicianadministered drugs in the outpatient setting, is a growing concern among hospitals, payers, and consumers. Not all hospitals provide these services, and some hospitals have a much larger proportion of costs devoted to these services. To address this situation, staff recommends earmarking 0.20 percent of the inflation allowance to fund increases in the cost of drugs and to provide this allowance to the portion of total hospital costs that were comprised of drug costs in FY Staff also proposes to earmark 0.10 percent of the set aside for unknown adjustments to fund a portion of the rising cost of new outpatient physician-administered drugs, which will be provided on a hospital-specific basis. Staff is currently working on the methodology for determining how this money will be allocated to the hospitals. This will require cost reporting and collection of actual cost and use data for 20 to 30 specific drugs that make up the majority of costs and cost growth for infusion and chemotherapy. The HSCRC staff expects to continue to refine the policies as it receive additional cost and use information. Implementation Grants: Last year, the Commission approved funding of up to 0.25 percent for infrastructure implementation proposals that would accelerate the implementation of care coordination efforts and provide for early reductions in avoidable utilization. The evaluation of these proposals took longer than anticipated, as staff needed to address concerns about the deployment of funds that had already been provided, as well as the concerns regarding the progression in reducing avoidable utilization. As a result, as these funds are awarded, they will increase the hospital revenues in FY 2017 rather than in FY 2016, as originally anticipated. Population Health Workforce Program: In December 2015, the Commission approved up to $10 million in FY 2017 hospital rates to be provided on a competitive basis to train and hire workers from geographic areas of high economic disparities and unemployment. The workers will focus on population health and community-based care interventions consistent with the All-Payer Model. 1 See 7
10 Final Recommendations on the Update Factors for FY 2017 Certificate of Need (CON) Adjustments: Holy Cross Germantown Hospital opened in the fall of The FY 2017 adjustment of 0.07 percent is the estimated increase of $12 million for FY Set-Aside for Unforeseen Adjustments: Staff recommends a 0.50 percent set-aside to fund unforeseen adjustments during the year. A similar allowance was made for both FY 2015 and FY As indicated above, staff proposes to earmark 0.10 of this amount for possible increases in the use of new outpatient chemotherapy and infusion drugs. Reversal of the Prior Year s PAU Savings Reduction and Quality Incentives: The total FY 2016 PAU savings and quality adjustments are restored to the base for FY 2017, with new adjustments to reflect the PAU savings reduction and quality incentives for FY PAU Savings Reduction and Scaling Adjustments: The FY 2017 PAU savings are continued, and an additional 0.65 percent savings is targeted for FY A recommendation on this item will be submitted to the Commission in a separate staff report and is discussed in additional detail later in this document. Preliminary estimates are provided for both positive and negative quality incentive programs, which have been changed so that they are no longer revenue neutral. Staff is working to finalize these figures. Components of Revenue Change that are Not Hospital Generated Several changes will decrease the revenues for FY These include: UCC Reductions: The proposed UCC reduction for FY 2017 will be percent. The amount in rates was 5.25 percent in FY 2016, and the proposed amount for FY 2017 is 4.76 percent. The FY 2017 policy is the subject of a separate recommendation to the Commission. Deficit Assessment: The legislature provided for a specific level of deficit assessment reduction for FY This line item reflects that reduction. While Table 2 computes the central provisions leading to a balanced update for the All-Payer Model overall, there are additional variables to consider such as one-time adjustments, as well as revenue and rate compliance adjustments and price leveling of revenue adjustments to account for annualization of rate and revenue changes made in the prior year. Medicare s Proposed National Rate Update for FFY 2017 CMS published proposed updates to the federal Medicare inpatient rates for federal fiscal year (FFY) 2017 in the Federal Register in mid-april. 2 These updates are summarized in the table below. These updates will not be finalized for several months and could change. The proposed 2 See Proposed-Rule-Home-Page-Items/FY2017-IPPS-Proposed-Rule- Regulations.html?DLPage=1&DLEntries=10&DLSort=0&DLSortDir=ascending. 8
11 Final Recommendations on the Update Factors for FY 2017 rule would increase rates by approximately 0.40 percent in FFY 2017 compared to FFY 2016, after accounting for inflation, disproportionate share reductions, outlier adjustments, and other adjustments required by law. The proposed rule includes an initial market basket update of 2.80 percent for those hospitals that were meaningful users of electronic health records in FFY 2015 and that submit data on quality measures, less a productivity cut of 0.50 percent and an additional market basket cut of 0.75 percent, as mandated by the ACA. This also reflects a proposed 1.50 percentage point reduction for documentation and coding required by the American Taxpayer Relief Act of 2012 and a proposed increase of approximately 0.80 percentage points to remove the adjustment to offset the estimated costs of the Two Midnight policy and address its effects in FFYs 2014 through Additionally, percent will be removed to account for the increase in a high cost outlier threshold. Disproportionate share payment reductions resulted in a decrease of percent from FFY Table 3. Medicare s Proposed Rate Updates for FFY 2017 Inpatient Outpatient Base Update Market Basket 2.80% 2.80% Productivity -0.50% -0.50% ACA -0.75% -0.75% Coding -1.50% Two Midnight Rule 0.80% 0.85% 1.55% Other Changes DSH -0.30% Outlier Adjustment -0.20% -0.50% Applying the inpatient assum ptions about m arket basket, productivity, and m andatory ACA outpatient savings, staff estim ates a 1.55 percen t Medicare outpatient update effective January This estimate is pending any adjustm ents that may be made when the proposed update to the federal Medicare outpatient rates get published. 0.4% 3 CMS reduced hospital rates for the implementation of the Two Midnight rule, based on an estimate that some patients that were being treated in observation would be admitted. Subsequently, this estimate was overturned. The adjustments noted above include one-time and prospective adjustments relative to this matter. 9
12 Final Recommendations on the Update Factors for FY 2017 Discussion of the FY 2017 Balanced Update The staff proposal increases the resources available to hospitals to account for rising inflation, population changes, and other factors, while providing savings for purchasers through a PAU savings adjustment. The proposed adjustments coupled with the ongoing incentives to reduce PAU inherent to the Model should allow the hospital industry to make additional investments while maintaining operating margins at reasonable levels. As discussed below, the proposed update falls within the financial parameters of the All-Payer Model agreement. PAU Savings Adjustment Maryland is now in its third year of the All-Payer Model. The Model is based on the expectation that an All-Payer approach and global or population-based budgets will result in more rapid changes in population health, care coordination, and other improvements, which in turn will result in reductions in avoidable utilization. To that end, the Commission approved budgets that did not offset Medicare s ACA and productivity adjustments, and provided infrastructure investment funding to support care coordination activities. For RYs 2015 and 2016, the HSCRC applied a PAU savings adjustment with an incremental revenue reduction averaging 0.20 percent to allocate and ensure savings for purchasers of care. This was calculated using predicted versus actual readmissions. Staff proposes an incremental increase in the PAU saving adjustment of 0.65 percent (an addition of 0.45 percent above the 0.20 in RY 2016, bringing the total adjustment to 1.25 percent). Staff also proposes to apply the adjustment based on the proportion of each hospital s revenue relative to admissions/observations that are classified as PAU, comprised of readmissions and admissions for ambulatory care sensitive conditions (measured by prevention quality indicators). This progression in approach is important to advance the Model objectives of ensuring savings from reducing avoidable utilization. This approach and its implications are more fully discussed in a separate staff recommendation. Investments in Care Coordination The HSCRC has provided funding for some initial investments in care coordination resources. Staff believes that several categories of investments and implementation are critical to the success of the Model. Multiple workgroups have identified the need to focus on high needs patients, complex patients, and patients with chronic conditions and other factors that place them at risk of requiring extensive resources. Of particular concern are Medicare patients, who have more extensive needs but fewer system supports. Additionally, there are several important major opportunities with post-acute and long-term care that are important to address. There is significant variation in post-acute care costs, and hospitals need to work with partners to address this variation. There are also potentially avoidable admissions and readmissions from post-acute and long-term care facilities. There are documented successes in reducing these avoidable admissions, both in Maryland and nationally. These improvements require partnerships and coordination among hospitals and long-term and post-acute care providers. For FY 2018, staff intends to evaluate an update that differentiates the levels of rates provided based on implementation progress in the following three areas: 10
13 Final Recommendations on the Update Factors for FY 2017 Care management for complex patients with regional partnerships and community partners Care coordination and chronic care improvement focused on rising risk patients with community partners Effective approaches to address post-acute and long term care opportunities As hospitals continue to implement these approaches in FY 2017, declines in utilization may free up resources to make additional investments (if there is not a corresponding increase in nonhospital costs). The HSCRC staff has been working on an amendment to the All-Payer Model to provide data and additional flexibility in implementing care redesign together with physicians and community-based partners. Implementation of the care redesign envisioned in the amendment may require additional investments in care coordination and care management interventions. Market Shift Adjustment The HSCRC staff discussed its intent to move market shift updates to a bi-annual process starting July 1, At this time, staff would like to consider moving the market shift adjustment to a quarterly adjustment that culminates in a final, year-end adjustment. Quarterly adjustments create some potential flaws, as shorter timeframes exacerbate the impact of small cells. While these will work themselves out over the course of the year, they may create different results as the quarters build on each other. Also, the importance of timeliness and accuracy of hospital data increases. Nevertheless, staff is reviewing market shift with requests for corridor relief, and requests for relief from hospitals that are experiencing increases in market shift. As such, staff requests comments on the advisability of quarterly market shift adjustments. All-Payer Financial Test The proposed balanced update keeps Maryland within the constraints of the Model s all-payer revenue test. Maryland s agreement with CMS limits annual growth rate for all-payer per capita revenues for Maryland residents at 3.58 percent. Compliance with this test is measured by comparing the cumulative growth in revenues from the CY 2013 base period to a ceiling calculated assuming annual per capita growth of 3.58 percent. This concept is illustrated in Table 4 below. As shown in the table, the maximum cumulative growth allowed through CY 2017 is percent. Table 4. Calculation of the Cumulative Allowable Growth in Per Capita All-Payer Revenue for Maryland Residents CY 2014 CY 2015 CY 2016 CY 2017 Cumulative Growth A B C D E = (1+A)*(1+B)*(1+C)*(1+D) Calculation of Revenue Cap 3.58% 3.58% 3.58% 3.58% 15.11% 11
14 Final Recommendations on the Update Factors for FY 2017 For the purpose of evaluating the impact of the recommended update factor on compliance with the all-payer revenue test, staff calculated the maximum cumulative growth that is allowable through the end of FY 2017 (the first 42 months of the waiver). As shown in Table 5, cumulative growth of percent is permitted through FY Staff projects actual cumulative growth through FY 2017 of 8.77 percent. This estimate reflects: Actual CY 2014 experience for January through June and actual FY 2015 experience; The assumption that hospitals will use the full charge capacity available through their global budgets for FY 2016; and The staff recommended update for FY Table 5 shows allowed growth in gross revenues. Staff has removed adjustments due to reductions in UCC and assessments that do not affect hospital s bottom lines for comparison to the maximum growth allowances. The actual and proposed revenue growth is well below the maximum levels. Table 5. Proposed Update and Compliance with the All-Payer Gross Revenue Test A B C D E = (1+A)*(1+B)*(1+C)*(1+D) Actual Actual Staff Est. Proposed Cumulative Jan- June 2014 FY 2015 FY 2016 FY 2017 Through FY 2017 Maximum Gross Revenue Growth Allowance 2.13% 4.26% 4.12% 4.12% 15.44% Revenue Growth for Period 0.90% 2.51% 2.94% 2.16% 8.77% Savings from UCC & Assessment Declines that do not Adversely Impact Hospital Bottom Line 1.09% 1.41% 0.64% 3.17% Revenue Growth with UCC & Assessment Savings Removed 0.90% 3.60% 4.35% 2.80% 12.13% Revenue Difference between Cap & Projection 3.31% Maximum Revenue Growth Allowance includes population estimates: FY15/CY %; FY16/CY % The figures in the table above are different than the net revenue figures reported at the beginning of this section of the report. The figure above does not reflect actual UCC or include other adjustments between gross and net revenues such as denials. They reflect adjustments to gross revenue budgets. Medicare Financial Test The second key financial test under the Model is to generate $330 million in Medicare fee-forservice (FFS) savings over five years. The savings for the five-year period were calculated assuming that Medicare FFS costs per Maryland beneficiary would grow about 0.50 percent per year slower than the national per beneficiary Medicare FFS costs after the first year. Year one of the demonstration generated approximately $116 million in Medicare savings. CY 2015 savings have not yet been audited, but current projections show an estimated savings of $135 million, bringing the two-year cumulative savings to just over $250 million. Cumulative savings are ahead of the required savings of $49.5 million for two years. However, there has been a shift toward greater utilization of non-hospital services in the state relative to national 12
15 Final Recommendations on the Update Factors for FY 2017 rates of growth, and Maryland is currently exceeding the national growth rate for the total cost of care by an estimated $60 million (which is a preliminary figure that is subject to change). When calculating savings on total cost of care, the two-year cumulative estimate is $213 million, still well above the required savings level. Maryland s All-Payer Model Agreement with CMS contains requirements relative to the total cost of care, including non-hospital cost increases. The purpose is to ensure that cost increases outside of hospitals do not undermine the Medicare savings that result from implementation of the All-Payer Model by hospitals. If Maryland exceeds the national growth rate by more than 0.90 percent in any year or exceeds the national growth rate in two consecutive years, it is required to provide an explanation of the increase and potentially provide for corrective action. Since staff estimates that the total cost of care growth exceeds the national growth for CY 2015, staff is focused on determining the causes of the increase. About half of the excess growth is in Medicare Part A services (skilled nursing facility, home health, and hospice), which are related to hospital services. The other half is in Part B services. Staff determined that the growth is primarily in professional fees and is making further assessments of the cause of these increases. Staff recommends maintaining the goal used in the RY 2015 and 2016 updates of growing Maryland hospital costs per beneficiary about 0.50 percent slower than the nation for RY Attainment of this goal will maintain any ongoing savings from prior periods and help achieve savings in the total cost of care, as well as provide evidence of continuing success of the model. A commitment to continue the success of the first two years is critical to building long-term support for Maryland s Model. Allowable Growth If the projections from the CMS Office of the Actuary for CYs 2016 and 2017 are correct, national Medicare per capita hospital spending will increase by 1.75 percent in FY The staff goal of limiting Maryland s Medicare per capita growth to 0.50 percentage points below the national rate results in a maximum allowable Medicare per capita growth of 1.25 percent. Since staff is concerned about the total cost of care requirements for Medicare in CY 2016, as previously explained, staff also measures the results against the CY 2016 projection of 1.20 percent growth. For the purpose of evaluating the maximum all-payer growth that will allow Maryland to meet the per capita Medicare FFS growth target, the Medicare target must be translated to an all-payer growth limit (Tables 6A and 6B). During deliberations on the FY 2015 update, a consultant to CareFirst developed a difference statistic that reflected that the historical increase in Medicare per capita spending was lower than all-payer per capita spending in Maryland. HSCRC used a difference statistic of 2.00 percent when calculating the comparisons for the Medicare target limit for FY However, the actual difference was lower for CY 2015, and as a result, the difference statistic was updated for FY This figure is added to the Medicare target to calculate an all-payer target. Using a blend of case-mix data from CY and experience data from CY , the difference statistic was calculated as a conservative projection of 0.89 percent. 13
16 Final Recommendations on the Update Factors for FY 2017 Using the revised difference statistic, staff calculates two different scenarios. Under the first scenario (Table 6A), the maximum all-payer per capita growth rate that will allow the state to realize the desired FY 2017 Medicare savings is 2.12 percent. The second scenario (Table 6B) shows a maximum all-payer per capita growth rate of 2.68 percent. Both scenarios are pictured below and fall within the all-payer guardrails. Table 6A. Scenario 1 Maximum All-Payer Increase that will still produce the Desired FY 2017 Medicare Savings Maximum Increase that Can Produce Medicare Savings Medicare Medicare Growth CY 2016 A 1.20% Savings Goal for FY 2017 B -0.50% Maximum growth rate that will achieve savings (A+B) C 0.70% Conversion to All-Payer Actual statistic between Medicare and All-Payer D 0.89% Conversion to All-Payer growth per resident (1+C)*(1+D)-1 E 1.60% Conversion to total All-Payer revenue growth (1+E)*(1+0.52%)-1 F 2.12% Table 6B. Scenario 2 Maximum All-Payer Increase that will still produce the Desired FY 2017 Medicare Savings Maximum Increase that Can Produce Medicare Savings Medicare Medicare Growth (CY CY 2017)/2 A 1.75% Savings Goal for FY 2017 B -0.50% Maximum Growth Rate that will Achieve Savings (A+B) C 1.25% Conversion to All-Payer Actual Statistic between Medicare and All-Payer D 0.89% Conversion to All-Payer Growth per Resident (1+C)*(1+D)-1 E 2.15% Conversion to Total All-Payer Revenue Growth (1+E)*(1+0.52%)-1 F 2.68% Note: National Medicare growth projection 1.2% for CY 2016 and 2.3% for CY 2017 from CMS Office of Actuary, February 2016 analysis. The staff recommended update will produce the desired savings if national actuarial projections are accurate; the difference statistic correctly translates the Medicare growth to all-payer growth (Tables 7A and 7B); and the carryover from the RY 2016 adjustment does not result in excessive growth. The allowance for unforeseen adjustments may be needed to offset excessive growth, if any, from the RY 2016 adjustments. 14
17 Final Recommendations on the Update Factors for FY 2017 Table 7A. Scenario 1 Comparison of Medicare Savings Requirements to Model Results Table 7B. Scenario 2 Comparison of Medicare Savings Requirements to Model Results Stakeholder Input All-Payer Maximum to Achieve Medicare Savings Modeled All- Payer Growth Difference Comparison to Modeled Requirements Revenue Growth 2.12% 2.16% 0.03% Per Capita Growth 1.60% 1.63% 0.03% All-Payer Maximum to Achieve Medicare Modeled All- Savings Payer Growth Difference Comparison to Modeled Requirements Revenue Growth 2.68% 2.16% -0.52% Per Capita Growth 2.15% 1.63% -0.52% HSCRC staff worked with the Payment Models Workgroup to review and provide input on the FY 2017 updates. Staff also received and reviewed comments on the final recommendation from CareFirst, the Maryland Hospital Association, and 20 member hospital or systems. CareFirst expressed support for the recommendation, but cautioned staff that approving a full update on July 1, 2017, could result in Maryland exceeding the total cost of care guardrail for the second year in a row, thus causing a triggering event for CMS. They recommended a lower adjustment in light of this possible outcome. The Maryland Hospital Association and its member hospitals expressed the need for a higher update factor and recommending the following: Allow for the full inflation amount of 2.49 percent without the correction factor applied. Decrease the expected PAU savings offset. Do not apply the ACA reduction of 0.75 percent to psychiatric and Mt. Washington Pediatric hospitals. Use part of the allowance for unforeseen adjustments to cover the costs of new outpatient physician-administered drugs. The Maryland Hospital Association and a number of member hospitals believe that the savings in the recommended update factor will make it difficult to move forward with all the momentum and investments that they have worked during the last two years of the Model. See Appendix II for all written comments on the staff recommendation for the FY 2017 update factors 15
18 RECOMMENDATIONS Final Recommendations on the Update Factors for FY 2017 The final recommendations of the HSCRC staff are as follows and are offered conditioned on the adoption of other policy recommendations of staff that affect the overall targets (including the PAU savings adjustment and the UCC reductions): 1. Update the three categories of hospitals and revenues as follows: a. Release the prospectively applied error correction factor of.56 percent for inflation to arrive at an approved RY 2017 balanced update for revenues under global budgets of 2.72 percent (net of offsets) as shown in revised Table 8, limiting the amount provided in the first six months to an increase of 2.16 percent by having a lower semi-annual target for the first half of the year and a higher semi-annual target for the second half of the year. b. In order to receive the additional inflation allowance, each hospital must agree charge no more than the mid-year target through the first half of the year. Each hospital must agree to: i. Monitor the growth Medicare s total cost of care and total hospital cost of care for its service area; ii. Work with CRISP, HSCRC, and MHA to obtain available information to support monitoring and implementation efforts; iii. Work with CRISP, HSCRC, and CMMI to obtain data for care redesign activities as soon as it is available; iv. Monitor the hospital s performance on PAUs for both Medicare and All Payers. v. Implement programs focused on complex and high needs patients with multiple chronic conditions, initially focusing on Medicare patients; vi. Work with CRISP to exchange information regarding care coordination resources aimed at reducing duplication of resources, ensuring more person centered approaches, and bringing additional information to bear at the point of care for the benefit of patients; vii. Increase efforts to work in partnership with physicians, post-acute and long term facilities, and other providers to create aligned approaches and incentives to improve care, health, and reduce avoidable utilization for the benefit of patients. Work with physicians with the goal of developing and enhancing value based approaches that are applied under MACRA; viii. Participate in the All Payer Model progression planning efforts 16
19 Final Recommendations on the Update Factors for FY 2017 c. Revenues that are not under global budgets but subject to the Medicare ratesetting waiver should increase by 1.24 percent. 2. Allocate 0.20 percent of the inflation allowance based on each hospital s proportion of drug costs to total costs. Additionally, earmark up to 0.10 of the allowance for unforeseen adjustments for increases in costs related to new outpatient physicianadministered drugs. 3. The Commission should continue to closely monitor performance targets for Medicare, including Medicare s growth in Total Cost of Care and Hospital Cost of Care per beneficiary. As always, the Commission has the authority to adjust rates as it deems necessary, consistent with the All Payer Model. a. Targets should be monitored both state-wide and on a hospital specific level. b. If corrections become necessary, the Commission should consider whether to make the corrections based on hospital specific performance. 4. In order to receive the full update for FY 18, hospitals will need to reduce Potentially Avoidable Utilization and any increases in Medicare s non-hospital costs resulting from implementation will need to be at least offset by reductions in Medicare s hospital costs. 5. The revenue update for psychiatric hospitals and Mt. Washington Pediatric Hospital will be consider at the next public Commission meeting. 17

20 Final Recommendations on the Update Factors for FY
21 Final Recommendations on the Update Factors for FY 2017 APPENDIX I. UPDATING AND RE-EVALUATING THE DIFFERENCE STATISTIC METHODOLOGY Calculating the Annual Update Allowance Under the Demonstration Updating and Reevaluating the Difference Statistic Methodology Jack Cook April 15,
22 Final Recommendations on the Update Factors for FY 2017 Executive Summary In a previous paper, Calculating the Annual Update Allowance under the Demonstration, we suggested a methodology for calculating the annual update so as to have the HSCRC be in compliance with both the All-Payer Waiver Test and the Medicare Waiver Test prescribed by the Demonstration. Each of the Waiver Tests prescribed a limit on the rate of growth in hospital payments calculated on a per capita basis. The All-Payer Waiver Test limits the annual growth in the hospitals charges for services to Maryland residents calculated on a per resident basis (the All-Payer Statistic). The Medicare Waiver Test limits the growth in all hospital payments for services to resident Medicare FFS beneficiaries calculated on a per beneficiary basis (the Medicare Statistic). The proposed methodology is formulated in terms of an estimate (the Difference Statistic) of the difference between the annual increase in the All-Payer Statistic and the annual increase in the Medicare Statistic. For example, if in 2015, the All-Payer Statistic had increased by, say, 2.58% and the Medicare Statistic by 1.53%, then the Difference Statistic for 2015 would be 1.05%. 1.05% = 2.58% % In the previous paper we estimated the Difference Statistic using five years of HSCRC claims data ( ), determined the average over the five years, 2.94%, and proposed the use of a conservative Difference Statistic of 2.0% for the purpose of deriving he Annual Update Allowance. The technical details of the suggested methodology require the use of a conservative Difference Statistic in order to provide reasonable assurance that both Waiver Tests will be met. This paper updates the calculation of the Difference Statistic using the HSCRC claims from 2011 to 2015 and an enhanced method of estimating the increase in the Medicare Statistic: the initial derivation of the Difference Statistic estimated the annual increase in the FFS beneficiaries based on the increase in the age 65+ population in Maryland; the updated estimates used the actual number of Part A and Part B beneficiaries weighted to create a single measure of the FFS beneficiaries residing in Maryland. The updated calculation resulted in an average Difference Statistic of 2.10 and a conservative Difference Statistic projection of However, it was noted that the Difference Statistic applicable to 2012 was unusually large (3.50) and that the four years of Difference Statistics used to calculate the average split between the first two years (2012 and 2013) preceding the term of the Demonstration and the second two years (2014 and 2015) being the first two years of the Demonstration. This split, for which there was no counterpart in the initial calculation of the Difference Statistics since the Demonstration hadn t begun, suggests that the updated calculation might be limited to the first two years of the Demonstration. Using the data from the first two years of the Demonstration, the Difference Statistic is 1.73% and a conservation projection is 1.0%. 20
23 Final Recommendations on the Update Factors for FY 2017 One would like to corroborate the estimates of the Difference Statistics derived from the HSCRC claims data by the use of Medicare payment data, preferably including out of state claims. These complete payment data from 2006 to 2012 are available from CMS and the Maryland hospital payments for Medicare services to resident FFS beneficiaries are available from 2013 to However, we have not been able to reconcile and unify these Medicare payment data in a credible way. Therefore, the corroboration that we have been able to carry out involves only the Maryland hospital payments from 2013 to For these years the average Difference Statistic was 1.80% and the conservatively projected Difference Statistic was.89%. These results therefore corroborate the Difference Statistic (1.73%) and the conservation projection (1.0%) derived from the HSCRC claims in the period Schedule 1: Maryland Hospital Charges per Resident The hospital charge data in columns 1 and 2 of Schedule 1 were derived from the HSCRC s case mix tapes for 2011 through 2015 by the HSCRC staff. Column 1 includes the hospital charges for all services and column 2 the hospital charges for services to Maryland residents. Column 3 computes the percentage of the hospital s total charges accounted for by services to Maryland residents. The uniformity of the column 3 percentages suggests that the coding of the residences of Maryland patients was done consistently throughout 2011 to Column 4 records the Maryland population; column 5 the hospital charges per Maryland resident (col 2/ col 4); and column 6 the annual rate of increase in the charges per resident. The annual increases in the hospital charges for services to Maryland residents is the first of the two statistics used to derive the Difference Statistic. Maryland Hospital Charges per Resident Annual Increases: Schedule 1 Hospital Charges (000,000 s) CY Total MD Residents % MD Res Claims 21 MD Population (000 s) MD Res Claims/ Capita Charge % Change from Prior Year 2011 $14,540.1 $13, ,844.2 $2, $15,017.5 $13, ,890.7 $2, $15,44.3 $14, ,936.0 $2, $15,741.2 $14, ,975.3 $2, $16,211.1 $14, ,006.4 $2,
24 Final Recommendations on the Update Factors for FY Schedule 2: Maryland Hospital Charges per Resident Medicare FFS Beneficiary The hospital charges in column 1 represent the charges of Maryland hospitals to Medicare FFS beneficiaries residing in Maryland. Column 2 reports the number of such beneficiaries; column 3 the hospital charges per beneficiary (column 1/ column 2); and column 4 records the annual percentage change in the hospital charges per FFS beneficiary. The annual percentage change in the hospital charges per FFS beneficiary are the second statistics used to derive the Difference Statistic. Maryland Hospital Charges per Resident Medicare FFS Beneficiaries Annual Increase Schedule 2 Year Hospital Charges Resident FFS Beneficiaries Charge/Beneficiary % (000,000 s) (000 s) Charge 2011 $4, $6, $5, $6, $5, $6, $5, $6, $5, $6, Schedule 3: The Difference Statistic and Variances Columns 1 and 2 record the hospital charges per resident for services to Maryland residents and the annual increases in such charges per resident from Schedule 1. Column 3 and 4 record the Maryland hospital charges per resident FFS beneficiary and the annual increase in these amounts from Schedule 2. Column 5 calculates the Difference Statistic in each year and the average 2.10 over the five years. Column 6 specifies for each year the absolute value of the difference between the particular year s Difference Statistic and the average. For example, in 2012, the variance in Column 6 is 1.40, the difference between the Difference Statistic (3.50) and the average Difference Statistic (2.10): 1.40= The conservative projection of the Difference Statistic based on the results of Schedule 3 is 1.24, the average Difference Statistic (2.10) minus the average variances (0.86): 1.24 =
25 Final Recommendations on the Update Factors for FY 2017 Schedule 3 The Difference Statistic and Variance Maryland Hospital Charge Data: Maryland Residents Year Chrg/Res % Change Chrgs/FFS % Change Diff Variance Beneficiary Statistic 2011 $2,279 - $6, $2, $6, $2, $6, $2, $6, $2, $6, Average Difference Statistic Avg Variance Discussion of Schedule 3 The statis tics on Schedu le 3 are derived from th e consistently accumulated claims data of th e HSCRC. However, these claims data for Medicare FFS beneficiaries residing in Maryland provide only an imperfect estimate of the statistic used in the Medicare Waiver Test (the total Medicare payments for hospital services to the resident FFS beneficiaries) because: The HSCRC claim s do not include the claim s for hospital services of resident FFS beneficiaries provided by out of state hospitals, and The claims do not reflect the variation in the payment to charge ratio for Medicare hospital services resulting from Medicare policies, including the Sequester In addition, the four ye ars of estimated Differe nce Statistics cover two periods in which the dynamics of hospital reimbursement in Maryland were very different. The first period ( ) preceded th e term of the All-Payer Model Dem onstration and includ ed the beginning of the Sequester in March The second ( ) represented the first two years of the Demonstration, the implementation of the GBR target budgets, and the impact of enrollment under the ACA. Over these two periods the average Difference Statistic dropped from (( )/2) to (( )/2), reflect ing a moderation in the growth of private sector volume in period 2. Furthermore, the average variance dropped from (( )/ 2) to 0.68 (( )/ 2). T his suggests that the use of a Differe nce Statistic of approximately 1.00 would be an appropriately conservative estimate based on the second period s data. 5. Alternative Estimates of the Difference Statistic 23
26 Final Recommendations on the Update Factors for FY 2017 The HSCRC staff has accumulated Medicare inpatient and outpatient payments for Maryland hospital services for resident Medicare FFS beneficiaries for the period , including a 2-month run out with completion factors. Schedule 2A sets forth these payment data, the number of FFS beneficiaries, the payment per beneficiary and the annual percentage change in these payments per beneficiary in 2014 and These percentage changes are then used on Schedule 3A to re-estimate the Difference Statistic. Summary of Maryland Hospital Medicare Payments FFS Beneficiaries CY Inpatient Outpatient Total FFS Beneficiaries (000 s Payment/ Beneficiary Schedule 2A % Change Payment/ Beneficiary 2013 $ 3,379.1 $1,285.3 $4, $6, $ 3,390.0 $1,366.0 $4, $6, $ 3,514.5 $1,469.9 $4, $6, Combined 2 015/ Schedule 3A records the percentage change in the Maryland hospital charges per resident for 2014 and 2015 from Schedule 1 and the percentage change in the payments per beneficiary from Schedule 2A. The Difference Statistics derived from these results average 1.80 and the average variance is.91. This suggests that the use of a Difference Statistic of.89 would be likely to ensure compliance with the Medicare Waiver Test. CY % Change MD Resident Charges per Capita (Sch 1) % Change Medicare Payment Per Beneficiary (Sch 2A) Difference Statistic Average 1.80 Average Variance.91 Conservatively Projected Diff Statistic.89 Schedule 3A Variance 24
27 Final Recommendations on the Update Factors for FY 2017 APPENDIX II. COMMENT LETTERS ATTACHED CareFirst Comment Letter May 6, 2016 MHA Comment Letter May 9, 2016 MHA Comment Letter May 18, 2016 Garrett Regional Medical Center May 19, 2016 Meritus Medical Center May 19, 2016 MedStar St. Mary s Hospital May 19, 2016 Union Hospital of Cecil County May 20, 2016 Doctor s Community Hospital May 23, 2016 Peninsula Regional Medical Center May 23, 2016 MedStar Franklin Square Medical Center May 23, 2016 MedStar Southern Maryland May 23, 2016 Adventist HealthCare May 23, 2016 Johns Hopkins Health System May 23, 2016 Calvert Memorial Hospital May 24, 2016 Western Maryland Health System May 24, 2016 Atlantic General Hospital May 24, 2016 Frederick Regional Health System May 24, 2016 LifeBridge Health May 25, 2016 St. Agnes Hospital May 25, 2016 Holy Cross Health May 25, 2016 University of Maryland Medical System May 25, 2016 MedStar Montgomery Medical Center May 25, 2016 Mt. Washington Pediatric Hospital May 26, 2016 Anne Arundel Medical Center May 31, 2016 Maryland Hospital Association June 2, 2016 MedChi, The Maryland State Medical Society June 2, 2016 Mercy Health Services June 5, 2016 United Healthcare June 6, 2016 Department of Health and Mental Hygiene Medicaid Program June 8,

28 Chet Burrell President and Chief Executive Officer CareFirst BlueCross BlueShield 1501 S. Clinton Street. 1 t" Floor Baltimore, MO Tel: Fax: chel,burrell@carefirst.com CareRrst.... May 6, 2016 Nelson,. Sabatini, Chairman Donna Kinzer, Executive Director Health Services Cost Review Commission 4160 Patterson Avenue Baltimore, Maryland Dear Mr. Sabatini and Ms. Kinzer: This letter provides CareFirst's comments on the HSCRC staffs Draft Recommendations for the Update to Hospital Rates and the "PAU Savings Program" (PSP) for the Fiscal Year ending Background It appears that in the first year of the Model Agreement (CY 2014), the Maryland rate setting system easily met the All Payer test and both of the Medicare financial tests: 1) the U.S. FFS Medicare hospital expenditure savings requirement of $0; and 2) the national total Medicare Part A and Part B expenditures "Total Cost of Care" (TCOC) test. However, while continuing to achieve strong cumulative savings through CY2015, this performance trend has sli pped somewhat causing a need for further root cause assessments. Preliminary data indicates that Maryland is exceeding the U.S. Medicare TCOC growth rate in CY 2015 and it is imperative to provide an Update at Ju ly 1, 2016 that ensures compliance with this waiver term for CY2016. If Maryland's Medicare TCOC growth exceeds that of the U.S. by more than 1.0 percentage points in CY 2015, or if it exceeds the national growth rate for two consecutive years (e.g., CY 2015 and CY 2016), the State would experience a "Triggering Event," which would elicit a "Warning Notice" from CMS that might, after some discussion, require Maryland to file an acceptable "Corrective Action Plan" (CAP) w ith CMS to avoid termination of the Model Agreement. Obviously, termination of the waiver would be disastrous for the State and its hospitals. Experiencing a Trigge ri ng Event in the midst of negotiations with CMS/CMMI regarding the continuation of the Model Agreement could jeopardize the ability of the State to obtain a Phase II extension. The less favorable performance in CY 2015 appears to be a function of: 1) A high FY 2016 Update that increased both CY 2015 and CY 2016 spending, but has not been offset by reduced Medicare utilization; 2) An increase in the use of Part A post-acute care services (Le., skilled nursing facility and home health services) in CY 2015 that will likely continue into CY The Model Agreement included the TCOC test so that savings under the hospital system wo uld not be more than offset by increases in costs outside the hospital setting and to ensure that hospitals did not shift routine hospital services to non-hospital settings/facilities; and C..-.F~.t 81uaCross II1... Shield i." i tdepe<.o.. rt licemee 01 the 81 ue Cron 8nd 8 1ue S~d Assocntkln, e ReQI$ter... Irademarl< oil/"ie Blue Crosl8nd Bl ue Shield AsIOCl.tocn. e' R"9'I_ tr-...rk 01 CareF~.. 01 M"'VI_, Inc.

29 3) What the HSCRC staff has characterized as an "uneven implementation of care coordination strategies thus far" by hospitals (particularly as it relates to the Medicare population): Moreover, despite the infusion of nearly $200 million of cate management infrastructure funding into the hospital system, there appears to have been virtually no change to date in the statewide level of PAUs over the past several years. Significantly, slightly more than half of the hospitals currently have increases in PAUs. PAU Savings Program Given these results, CareFirst strongly supports the staffs proposal to increase the PAU Savings Program (PSP) offset to rates to 1.25% in FY 2017 (from 0.60% in FY 2016) and to scale these rate offsets based on each hospital's level of PAUs. An increased emphasis on reducing PAUs is consistent with the HSCRC's GBR-based model of rate control. The Commission has frequently noted that, under fixed target budgets, the reduction of unnecessary utilization is an essential source of savings that should be used to offset investments in community-based initiatives and care coordination activities Update Factor In addition, we believe that the FY 2017 update factor must reflect the reality of the State's current and projected position relative to TCOC. We base this on the fact that CY 2015 performance on the Medicare TCOC test appears to have been unfavorable and this performance may also negatively affect performance in the first half of CY 2016 because the relatively high update factor that was approved in July 2015 will remain in effect until June 30, The FY 2016 Update Factor- which provided hospitals with over 4.0% additional revenue, when the effects of termination of the MHIP assessment and reduction in hospital Uncompensated Care (UCC) provisions are considered- was predicated on a projected level of Medicare volume reductions that has not been realized. 1 We have reviewed the methodology and the assumptions that the HSCRC staff used to develop the draft FY 2017 Update of 2.02% that is contained in the "Draft Recommendations on the Update Factor for FY 2017" (May 2, 2016) and provided in the pre-meeting package for the May public meeting and we generally support the approach taken by the staff. However, we have concerns that approving the full Update provision at July 1 could result in Maryland exceeding the National TCOC guardrail for the second consecutive year, causing a "triggering event". Specifically, we believe that the total hospital revenue increase needs to be held to no more than 2.11 % in CY 2016 if Maryland is to meet the Medicare tests in the Model Agreement. Given that the approved revenue increase for FY 2016 was 2.94%, approximately half of that amount (I.e., 1.47%) will have been consumed in the first half of CY The elimination of the MHIP assessment and reduction in hospital uec worked to reduce hospital gross patient revenues (their gross charge levels), however, hospital net patient revenues increased by approximately 4.35%. A similar dynamic is occurring in FY 2017 associated with a reduction in the Medicaid Deficit Assessment of 0.15% and an estimated drop in hospital Uncompensated Care ofo.s5%. Thus, while gross patient service revenue would increase by 2.01 % (under the current staff proposal), the hospitals' net revenues would increase by 2.71 % (the 2.02% recommended GBR increase plus 0..70% = 0.15%+0.55%). CareFirsl BlueCrass BI""Shield IS an lndependent licensee of \he Blue Cross and 8100 Shield Associat,on. Registered trademark of fhe Blue Cross and B!ue Sh,eld Association. " Regisleredtrademarkof CareF,rst of Maryla~d, Inc.
30 This would mean that the maximum revenu e increase that the HSCRC could approve effective July 1, 2016 without jeopardizing the Model Agreement is 1.28% (Le., 1.47% +.50 x 1.28% = 2.11 %). Exhibit 1 to this letter illustrates this paint in more detail. If, after six months, it is clear that the system is outperforming the Medicare financial tests, the HSCRC could reasonably consider increasing the Update effective January 1, PAUs Finally, we believe that the HSCRC staffs formulation of PAUs-which includes unplanned read missions, observation cases, Prevention Quality Indicator (PQls) and Maryland Hospital Acquired Conditions (MHACs) - is a good first step in defining a methodology to incent hospitals to reduce PAUs. However. we believe that the Commission should consider the following modifications and refinements to the PAU methodology: 1) The PAU list consists of inpatient services only in relation to each hospital's total (inpatient and outpatient) revenue. This calculation masks the level of PAUs at hospitals that have relatively large proportions of outpatient services; 2) The exemption of procedure-based utilization from the PAU list leaves a large pool of services that mayor may not be appropriate outside the scrutiny of the PAU methodology. This means that hospitals with relatively high levels of procedural services- which are not considered in the determination of PAU levels- will tend to show lower PAU levels as a proportion of their total services. We suggest that the HSCRC revise its PAU methodology to compute the level of PAUs relative to the share of each hospital's revenue that is subject to the PAU definitions; and 3) The PAU list currently does not address the fact that the health services literature has amply established the fact that a substantial number of hospital procedures are unnecessary-either because they have little value under any circumstances. or they are over-utilized or they could be performed in more appropriate settings. The HSCRC should over time expand the PAU list to encompass such procedures with the assistance of experts- such as those at RAND, Dartmouth and other organizations- that have done extensive work in this area for many years. We would like to recognize th e HSCRC Staffs openness throughout this process of balancing all stakeholder concerns and comments and putting forward a very reasonable and workable recommendation. Thank you for this opportunity to comment on these ve ry important policy initiatives. Sincerely, Chet Burrell President & CEO If_ Car. F~ ' 1 BlueCross BI.,.Stueklll en ~l ~... '" the Blue CroiO and BI.,. SIIltId Association. e RI>gi.lllred U d,mark '" lhe B... Crolt..., B... St'WekI Associelim. C)' R~"!efed of c..-<!i'n! of M..-yIand. Inc.

31 Exhibit I - Recommended Modification to the staff FY Update Proposal In order for the State to achieve its goal of generating the desired level of 0.5% savings relative to the U.S. Medicare national FFS hospital growth rate, the impact of the FY 2016 approved revenue Update on the period January through June 2016 must be offset by a lower approved Update for FY 2017 (which will impact the last six months ofcy 2016). Table 1 below shows that. in order to meet the staffs goal, the HSCRC should approve a FY 2017 overall GBR revenue Update of 1.28%, not 2.01%, which was the amount that was being considered by the staff at the time of the May 2 Payment Models work group meeting. This 1.28% amount is the maximum affordable update for FY 2017 because the Commission must offset the impact of the large FY 2016 Update, which has inflated hospital revenues during the first six months of the calendar year. If the HSCRC were to approve a 2.02% GBR revenue Update for FY 2017, Maryland could fail to meet the goal of achieving the desired level of Medicare hospital savings in CY 2016 (Le., the CY 2016 U.S. Medicare FFS hospital expenditure per beneficiary growth rate less the 0.5% savings provision). TABLE l' Meeting the Dual Waiver Tests with a Projection of Maximum GBR Increases Combining Fiscal Year Approved Revenue Growth for both FY16 & FY 17 P Be fie' " ".. '" (1) CMS Actuary Projection (v16 US hospital growth 1.20% (2) Less annual Savinss" '().50% (3) Medicare Test Target 0.70% (4) Conservative Difference Statistic 0.89% (5) Projected Increase in MD Charges per Resident 1.59% (6) Population Growth 0.52% (7) Allowed CY 2016 Revenue Growth ((5) + (6)) 2.11% FY16 Approved Revenue Increase FY 17 Approved Revenue Increase to hit MedIcare Waiver Target (S) Approved GBR Revenue Increase 2.94% (1 1.28% I (9) Six Months of FY16 Approved GBR 1.47% (10) Six Months of FY 17 Approved 0.64% (11) Allowed CY 2016 Revenue Growth (9) + (10) 2.11% (1) (It, iyt'd from the FY16 ipllroved Updilte 0( 3.1~ Il!'Ss the 0.25" T"mfornutlon Grint fundlna de~yed 10 FYl1 2 Table 1 shows a 2.11 % update because this is the level necessary to meet the U.s. Medicare FFS Hospital expenditure per beneficiary less 0.5% target for FY Staff recommended a 2.02% update in order to provide a cushion for meeting this goal. However, as noted, it did not factor in the impact of t he larger Update effective FY 2016 which impacts the first six months ofcy Ca ' ef~si BlueCro55 BI""Shu.kl IS an ~l l ioensee of [he Blue Cross and BI"" Shield AsSOCIation. «> Regi.. ered Ira<lernark oilhe Blue Cross and Blue Shj~d Assoc;alion. t r Reg'stered In><le"""'" 01 C,.,."Firsl 01 Ma<yIancI. Inc.
32 May 9, 2016 Nelson J. Sabatini Chairman, Health Services Cost Review Commission 4160 Patterson Avenue Baltimore, MD Dear Chairman Sabatini: On behalf of the Maryland Hospital Association s 64 member hospitals and health systems, I am writing to provide feedback on the Health Services Cost Review Commission (HSCRC) staff draft recommendations on the global budget update factor for fiscal year The decision before you is critical to the future of the all-payer model in Maryland. Every one percentage point subtracted from or added to this update equals $160 million either withheld from or paid to Maryland s hospitals for patient care inside and outside the hospital. We ask that commissioners please consider the following important data that augment the current draft recommendation: Savings Far Exceed Targets As stated in our April 19 letter, substantial progress has been made in the first two years of the waiver, particularly on Medicare savings (see attached charts): The Medicare hospital savings through the end of the waiver s second year was more than five times the minimum savings required under the agreement, and already ahead of the minimum required by June 30, 2017 (chart 1) If hospitals continue to save 0.50 percent below the national growth rate for the remainder of the agreement, total savings are projected to exceed $850 million, more than two-and-a-half times the agreement s minimum required savings of $330 million (chart 2) If Maryland hospital spending grew at the national rate for the balance of the five-year agreement, total hospital savings would be $681 million, more than double the minimum savings requirement (chart 2) The staff s proposed update would push savings and reductions in the all-payer rate of spending for hospital care even further. Staff propose a total all-payer growth through June 30, 2017, of 7.81 percent per capita (6.40 percent after removing the savings from uncompensated care and assessment reductions). This limited growth in spending for hospital care is more than one-third lower than the allowed ceiling under our all-payer demonstration (chart 3). Full Range of Allowable Growth Options Not Presented On pages of the staff proposal, two charts present paths to achieve the desired fiscal year 2017 Medicare hospital savings of 0.50 percent. This is an opportunity to engage in a critical policy discussion about the cumulative minimum level of Medicare hospital savings to be achieved, when the minimum required savings through June 30, 2017 have already been exceeded and the all-payer agreement specifies a minimum cumulative five-year savings total of $330 million.
33 Nelson J. Sabatini May 9, 2016 Page 2 The Medicare hospital savings requirement of $330 million was calculated assuming the growth in Maryland s spending for hospital care would be lower than the national growth rate by 0.50 percent per year. In the agreement s first year, Maryland reduced that growth rate by far more 2.15 percent. The commission can set a savings target for fiscal year 2017 less than the 0.50 percent recommended by staff, and still significantly exceed the minimum savings required. Setting a policy on hospital savings that does not account for the significant cumulative savings to date would undermine the still-tenuous status of the all-payer model. In addition, Page 13 of the draft proposal suggests that the maximum all-payer growth rate that could be granted to achieve desired savings is limited to between 2.12 percent and 2.68 percent (1.59 percent to 2.15 percent per capita). However, two elements of the calculation are subject to a range of estimates not presented: The projection of national Medicare spending growth for fiscal year Several sources of data can be used for projecting Medicare national spending growth. We believe the most reliable is the projection of hospital spending in the Medicare Trustees annual report to Congress. In its latest report, spending growth is projected at 1.81 percent in calendar year 2016 and 2.52 percent in calendar year 2017, for a fiscal year 2017 projected growth of 2.18 percent (compared with staff s indicated range of percent). Further, in its report, the CMS Actuary indicates that based on a study of its estimates for the time period , it has historically underestimated hospital spending by about 0.4 percentage points per year. The difference statistic that estimates the difference in all-payer spending per capita and Medicare hospital spending per beneficiary. In calendar years 2014 and 2015, the average difference between the all-payer spending per capita and the Medicare spending per beneficiary was 1.62 percent, nearly double the conservative projection of the difference statistic staff are using (0.89 percent). In short, there are several alternative scenarios not shown on pages 13 and 14 of your materials that commissioners might consider for fiscal year 2017 s maximum allowable all-payer increase. These scenarios demonstrate the ability to further increase the update. Maximum Increase that Can Produce Desired FY 2017 Medicare Savings Scenario 1 (Page 13) Scenario 2 (Page 14) Alternative Scenario 3 Proposed Scenario 4 Estimated 1.20% 1.75% 2.18% 1.85% Medicare Growth (FY 2017) Savings Goal (FY -0.50% -0.50% -0.0% -0.25% 2017) Maximum Growth Rate that Will Achieve Savings 0.70% 1.25% 2.18% 1.60%
34 Nelson J. Sabatini May 9, 2016 Page 3 Actual Statistic Between Medicare and All-Payer Conversion to All- Payer per Resident Conversion to Total All-Payer Revenue Growth Conversion to All-Payer Scenario 1 (Page 13) Scenario 2 (Page 14) Alternative Scenario 3 Proposed Scenario % 0.89% 1.62% 1.25% 1.60% 2.15% 3.84% 2.87% 2.12% 2.68% 4.38% 3.41% At the May 11 meeting, MHA will provide commissioners with our recommendation for the update for fiscal year 2017, which will be well within the range of allowable increases that commissioners could consider. We ask commissioners to review the broader range of alternative scenarios and provide an update that does not undercut, at this still early stage, the important achievements and continued investments needed for successfully improving care delivery and health in Maryland. Thank you for your consideration. Sincerely, Michael B. Robbins Senior Vice President cc: Herbert S. Wong, Ph.D., Vice Chairman Victoria W. Bayless George H. Bone, M.D. John M. Colmers Stephen F. Jencks, M.D., M.P.H. Jack C. Keane Donna Kinzer, Executive Director Attachment
35 Medicare Hospital Savings is Already Five Times the Required Amount $300.0 Medicare Hospital Savings (1/1/14 6/30/17) $250.0 $251.4M Already exceeded FY 2017 target by $62M $200.0 Millions $ times the required savings $189.8M required cumulative savings $100.0 $50.0 $0.0 $49.5M required cumulative savings Cumulative Cumulative (Through 12/31/15) (Through 6/30/17) 1
36 Expected Medicare Savings will far Exceed Requirement 2018 Projected Cumulative Medicare Hospital Savings (in millions) $900.0 $850.7 $800.0 $782.5 $700.0 $681.1 Millions of $ $600.0 $500.0 $400.0 $330.0 $300.0 $200.0 $100.0 $- MD min. savings MD growth = Nat'l. growth 0.5% below Nat'l, 2017 only 0.5% below Nat'l,
37 Plenty of Cushion is Available All-Payer Cumulative Update Capacity (per capita; 1/1/14 6/30/17) 14% 13% 12% 13.12% 11.71% All-Payer Cumulative Ceiling Uncompensated care and assessment savings = $526 million 11% 10% 9% Cumulative Available Cushion $1.5 billion Actual spending 5.31 percentage points below the adjusted ceiling 8% 7% 6.40% Actual Update as proposed 6% Category 1 Category 2 Category 3 Category 4 3
38 May 18, 2016 Nelson J. Sabatini Chairman, Health Services Cost Review Commission 4160 Patterson Avenue Baltimore, MD Dear Chairman Sabatini: On behalf of the Maryland Hospital Association s (MHA) 64 member hospitals and health systems, this letter follows up on the May 11 commission meeting, at which we offered alternative proposals to the current staff-recommended global budget update and update for revenues not governed by global budgets for fiscal year In addition to this letter, MHA will be sending two others: one on the regional transformation grants, and another on the qualitybased incentive programs. You ll also receive letters from Maryland s hospitals in response to Commissioners questions about the transformative work they ve been engaged in over the past two years. If adopted, the staff proposed update would be a premature overcorrection that would jeopardize Maryland s momentum under the new All-Payer Model. As described below, what has been displayed as a proposed two percent increase in total revenue for hospitals in the state, is actually only a one percent increase available to all hospitals. Also described below: based on more current data than used by staff, a higher update can be provided without encroaching on the staff-recommended Medicare total cost of care cushion. Constraining hospital funding now, at this sensitive stage, would undermine hospitals nascent success and threaten their ability to meet the waiver s continued requirements; the commission s support through reasonable funding levels early on has been an essential building block of the success to date. But at levels as low as those proposed by staff, hospitals will be unable to pay needed wage increases, cover the increased cost of core operations and care, or follow through on population health investments in the community. Of greater concern, an update this low calls the question on support for the demonstration and next steps. Now is a time when the state and stakeholders should be together, sharing with federal officials and the nation our collective successes in the first two years of this model and continuing to shape the hard work still ahead. But a too-low update would confirm concerns expressed all along about the model that because of the total cost of care metric, we in Maryland could be hampered in truly innovating care delivery and reduced to simply chasing national Medicare performance. Cumulatively to date Maryland has met every metric and far exceeded most. Hospitals have outspent the funding provided in rates by the Commission for investments in population health. The delivery of care has changed and continues to change against a backdrop of exceedingly, and sometimes unrealistically, high expectations about the time and resources required to implement dramatic change not only inside hospitals but also

39 Nelson J. Sabatini May 18, 2016 Page 2 within communities working voluntarily with physicians, nursing homes and other community partners. Instead, MHA proposes a modest addition of 1.12 percentage points to the per capita staff recommendation. Update for Revenue under Global Budgets HSCRC staff s proposal suggests a limit on revenue growth for hospitals in 2017 of 2.02 percent (1.49 percent per capita) after accounting for required reductions in uncompensated care and the Medicaid hospital assessment spend-down. However, as shown in the chart below, that number is misleading. In fact, a significant portion of the proposed update would be available only to some hospitals: 0.50 percent is for unforeseen adjustments which, as reported at the last meeting, has been set aside for the last two years but not added to rates 0.07 percent is for one hospital only - Holy Cross Germantown Hospital 0.51 percent is for certain hospitals that apply and are approved for specific programs (e.g. high-cost drugs, partnership grants, workforce support) where in all cases, hospitals will likely spend more money than the amount proposed 0.52 percent is for needed care increases due to population growth Factoring in those set-asides for only some hospitals, all hospitals, on average, would receive a total revenue increase of just 1.1 percent (a scant 0.60 percent per capita compared to the oneyear ceiling of 3.58 percent per capita) to cover the increased costs of caring for patients (workers wages, operations, care improvement and community investment).
40 Nelson J. Sabatini May 18, 2016 Page 3 MHA is proposing a modest increase to the update. A 1.12 percentage point increase to the 1.49 percent per capita staff recommendation for a total 2.60 percent per capita update. Only some of this (1.80 percent per capita) would go to all hospitals. The 2.60 percent per capita update would still fall far below the one-year 3.58 percent per capita growth ceiling, but would provide hospitals with the resources and stability they need to advance ongoing health care delivery transformation and maintain success under the all-payer model. This alternative could be achieved with three minor adjustments to the current staff proposal, as detailed on Chart 1: Increase the proposed 1.72 percent inflation adjustment to the currently projected 2.49 percent growth. Staff has proposed applying an estimated downward correction factor in advance. However, as noted in Chart 2, based on a 16-year analysis of Global Insights projections, Global Insights is more likely than not to underestimate, not overestimate, inflation. Basing a forecast error adjustment on just the three most recent years is arbitrary. Applying it now for the first time to reduce the update while ignoring years in which inflation was underestimated and hospital rates should have been increased is arbitrary. This fosters system instability and unpredictability. And a higher amount is important because your update decision is not solely a unit price inflationary increase. Rather, it is the limited amount by which hospitals total revenue may increase, which means it must accommodate price increases, funds to cover the risk assumed by hospitals in their global budgets for volume, case mix change and other costs, as well as the investments needed to improve the health of entire communities. Reduce from percent to percent the net quality-based payment program adjustment by lowering the expected shared savings offset for Potentially Avoidable Utilization. As we ll detail in a separate letter, this adjustment sets an expectation that hospitals will reduce Prevention Quality Indicators and readmissions by a combined 11 percent in a single year. That is both unrealistic and unachievable. In the last two years, the annual reduction averaged three percent. To our knowledge, no other demonstration in the nation has shown a one-year reduction in potentially avoidable utilization of the magnitude suggested by staff. Reduce from 0.50 percent to 0.40 percent the set-aside for unforeseen adjustments. This 0.5 percent has been set aside but not used in each of the past two years, withholding more than $150 million in payments. These funds could be used to further develop muchneeded partnerships with non-hospital community providers or to cover the expense of high-cost drugs without carving more from the inflation update. Total Cost of Care Concerns Most important, these modest changes would keep the state well within the boundaries of the waiver s financial metrics metrics. Specifically: Per Capita Spending MHA s proposal yields cumulative all-payer spending growth through FY 2017 of 7.5 percent per capita, far below the 13.1 percent ceiling
41 Nelson J. Sabatini May 18, 2016 Page 4 Medicare Savings Cumulative Medicare savings of $251 million are already more than five times the 2015 target of $49 million and savings through FY 2017 are projected to surpass the target, even if no additional hospital savings accrue Medicare Total Cost of Care While Medicare total cost of care grew faster than the nation in 2015, Maryland did not exceed the ceiling. However, HSCRC staff have proposed a lower update designed to reduce hospital spending even more, beyond the current $251 million in savings, in an effort to use lower hospital spending to drive lower total cost of care. That reduction is unnecessary. Staff has estimated the maximum per capita increase that can be given to obtain the desired savings to control the total cost of care. But in that calculation the difference statistic staff uses older data (CY 2015) to derive the factor (0.89) to translate Medicare spending trends into all payer trends. The most recent data (January - March 2016) for the conversion factor is higher (2.13), which translates into an allowable all-payer per capita growth rate of 3.38 percent (Chart 3). MHA s proposed update of 2.60 percent is well within this updated allowable growth rate. Moreover, it is in neither the state s nor the federal government s interest to manage the total cost of care metric as a guillotine, rather than a guardrail. It is important to all stakeholders for the HSCRC to manage and balance the system within the financial targets of the all-payer model. MHA s proposed 2.60 percent global budget update would do just that. But even the agreement with CMMI acknowledges that Maryland may meet one metric (per capita hospital spending) and not meet another (Medicare savings) and still provides for a path forward. And there are several indications that CMS would work closely with Maryland to ensure that the all-payer system remains viable and replicable in other parts of the country: Model architects understood that over a five-year period, there would be volatility in year-over-year performance and data calculations, which is why the contract includes a comprehensive process to analyze and for the state to explain any infractions should they occur, and specifically says that CMS may or may not require corrective action, depending on the totality of the circumstances. Maryland has already experienced what occurs when a metric is not met, and CMMI has been highly supportive of working with the state without threatening a waiver termination When readmissions reduction targets appeared to fall short in calendar years 2014 and 2015, CMMI not only recognized the possibility of data integrity issues, but worked closely with the state to continue the progress under the all-payer model CMMI is looking at Maryland as a model for the rest of the country A recent Request for Information published by CMS (Chart 4) looks to interest hospitals nationally in global budgets, and cites Maryland s global budget approach as the example of better management of cost and quality for a community s population, by providing clear revenue expectations and connecting services across outpatient and inpatient sectors
42 Nelson J. Sabatini May 18, 2016 Page 5 Update for Revenue Not under Global Budgets MHA recommends an update of 1.99 percent (instead of 1.24 percent) for non-global revenues, and 2.30 percent (instead of 1.55 percent) for the psychiatric hospitals and Mt. Washington Pediatric Hospital. The HSCRC staff recommends a 0.50 percent adjustment for productivity improvement, with which we agree. However, their recommendation also includes a reduction of 0.75 percent, which is the Medicare hospital payment cut intended to fund part of the cost of the Affordable Care Act. It is inappropriate to apply this federal Medicare reduction amount to all payer revenue in Maryland (Medicaid, CareFirst, United, others). It creates a larger-thanintended reduction for hospitals and a windfall for non-medicare payers. We look forward to further discussion of our proposal with you, as the commission moves forward on this critical funding decision for the next year. Thank you for your consideration. Sincerely, Michael B. Robbins Senior Vice President cc: Herbert S. Wong, Ph.D., Vice Chairman Victoria W. Bayless George H. Bone, M.D. John M. Colmers Stephen F. Jencks, M.D., M.P.H. Jack C. Keane Donna Kinzer, Executive Director
43 HSCRC Staff Preliminary Update Factor Component Breakdown FY 2017 HSCRC Staff MHA Proposal Proposal 05/11/16 05/11/16 Difference Inflation (Current Market Basket is 2.49%) 1.72% 2.49% 0.77% Net Quality-Based Payment Programs -0.61% -0.16% 0.45% Adjustment for ACA Savings (Productivity) 0.00% 0.00% 0.00% Subtotal 1.11% 2.33% 1.22% Adjustment for Volume 0.52% 0.52% 0.00% Care Coordination Allowances, by Application Rising Risk with Community Based Providers 0.00% 0.00% 0.00% Complex Patients w/ Regional & Community Partnerships 0.25% 0.25% 0.00% Long Term & Post-Acute Care 0.00% 0.00% 0.00% Workforce Support Program, by Application 0.06% 0.06% 0.00% Allowance for High Cost New Drugs, by Application 0.20% 0.20% 0.00% Subtotal - available through application process 0.51% 0.51% 0.00% Other Statewide Amounts Holy Cross Germantown 0.07% 0.07% 0.00% Set Aside for Unknown Adjustments 0.50% 0.40% -0.10% Subtotal 0.57% 0.47% -0.10% Statewide Total Revenue Growth, prior to UCC/assessments 2.72% 3.84% 1.12% Statewide Per Capita Growth, prior to UCC/assessments 2.18% 3.30% 1.12% Other Adjustments Uncompensated Care Allowance -0.55% -0.55% 0.00% Medicaid Tax Reduction -0.15% -0.15% 0.00% Statewide Total Revenue Growth, after UCC/assessments 2.02% 3.14% 1.12% Statewide Per Capita Growth, after UCC/assessments 1.49% 2.60% 1.12% 1
44 Why Adjust the Inflation Forecast Now? 5.00% 4.00% 3.00% 2.00% 1.00% 0.00% FY 2000 FY 2001 FY 2002 FY 2003 FY 2004 FY 2005 FY 2006 FY 2007 FY 2008 FY 2009 FY 2010 FY 2011 FY 2012 FY 2013 FY 2014 FY 2015 FY 2016 Forecast Used in Update Actual Inflation Note: 9 of 16 years under estimated by avg. 0.02% Underestimated 8 of 10 years by avg. 0.40% Overestimated 5 of 6 years by avg. 0.54% 2
45 Allowable All-Payer Growth Maximum Medicare Increase that Can Produce Desired FY 2017 Medicare Savings Estimated Medicare Growth (FY 2017) Savings Goal (FY 2017) Maximum Growth Rate that Will Achieve Savings Scenario 1 Scenario 2 Scenario 3 (Current (Staff proposal) (Staff proposal) difference statistic) 1.20% 1.75% 1.75% -0.50% -0.50% -0.50% 0.70% 1.25% 1.25% Actual Statistic Between Medicare and All-Payer Conversion to All- Payer per capita Conversion to Total All-Payer Revenue Growth Conversion to All-Payer Scenario 1 (Staff proposal) Scenario 2 (Staff proposal) Scenario 3 (Current difference statistic) 0.89% 0.89% 2.13% 1.60% 2.15% 3.38% 2.12% 2.68% 3.92% 3
46 Source: 4
47 GARRETT REGIONAL MEDICAL CENTER A PROUD AFFILIATE OF ~ WVU Medicine Nelson J. Sabatini Chairman, Health Services Cost Review Commission 4160 Patterson Avenue Baltimore, MD May 19, 2016 Dear Chairman Sabatini: On behalf of Garrett Regional Medical Center (GRMC), this letter is in response to the May 11, 2016 commission meeting, at which the Maryland Hospital Association (MHA) offered alternative proposals to the current staff-recommended global budget update and update for revenues not governed by global budgets for fiscal year I contend that, if adopted, the staff proposed update would be a premature overcorrection that would jeopardize the momentum under the new All-Payer Model and that a higher update can be provided without encroaching on the staff-recommended Medicare total cost of care spending cushion. GRMC has been engaged in work to transform healthcare in the region over the past two years. The hospital has made significant investments in patient care management and care coordination. GRMC has added social workers and case management staff in an effort to reduce readmissions and manage chronic disease conditions in the most appropriate and cost effective settings. New programs that work to reduce the overall cost of healthcare in the region include the following: The implementation of an outpatient cardiac rehabilitation program to reduce inpatient utilization for COPD, CHF, and AMI A Chronic Kidney Disease (CKD) clinic to better manage patients with potential renal failure Diabetes education programs and obesity counseling A wound care clinic to prevent inpatient hospital utilization for wound management The hospital now employs an integrated team approach to focused patient care management (Case Management) of the identified high utilizers of inpatient care through a multi-stakeholder discharge planning team. This team includes physicians, social workers, pharmacists, home health nurses, hospital nursing staff, behavioral health practitioners, and nursing home representatives. GRMC funds the activities of a Health Planning Council which is a multi-stakeholder team based at the Garrett County Health Department to create the community health plan and health needs assessment. GRMC also reaches out to each of the local nursing homes to assure successful care transitions and effective care management to reduce readmissions and potentially avoidable utilizations. 251 North Fourth Street Oakland, Maryland (301) TTY (301)
48 Nelson Sabatini May 19, 2016 Page 2 The hospital's community wellness and outreach also includes the following: o o o o o o o o o o o GRMC leads and sponsors the County Annual Health Fair Sponsors tobacco cessation programs Provides preventive health screenings and blood draw panels at local events Provides bone density screenings Provides medically supervised diet and exercise classes Public Flu Vaccination Clinics Provides atrial fib screenings Facial skin analysis cancer screens Breath carbon monoxide screens and expiratory lung capacity tests Public programs that assist people with weight, body fat, BMI management Dental health improvement initiatives in partnership with Garrett County Health Department All of this aforementioned work takes an incredible amount of resources and funding in order to implement successfully. Indeed GRMC has been successful and consistently experiences a very low readmission rate. The hospital is committed to reducing the total cost of care, which takes resources and time. Finally, the hospital assumes all risk for these aforementioned initiatives; therefore a reasonable revenue update will be critical to continued success. With respect to the current update, there is plenty of cushion for a more appropriate update; the cumulative savings the model has already secured for Medicare, Medicaid and commercial payers ensures that a reasonable update can be provided that will be far below the model's spending guardrails. The current staff proposal for the update is inadequate, as it is far below inflation. It also sets aside funding available only to some hospitals via an application process, which means commissioners would put at risk wage increases for workers, and the ability of GRMC to keep up with the basic costs of running the hospital, notwithstanding the investments required to improve community care and reduce utilization. GRMC currently has the lowest charge per case in the state. However, at this time, GRMC is also running on a negative 2% operating margin, which it cannot sustain without staffing cuts that will be detrimental to the local economy. In summation, I am reaching out to you to support a more appropriate global budget update. The Maryland Hospital Association sent you a fiscal year 2017 global budget update recommendation, which provides commissioners specific ways to turn the HSCRC staffs proposal from inadequate to helpful, without threatening the all-payer model's spending limits. I ask you to please consider these recommendations before approving the global budget update. Best Regards, MfkA&\~ ~~~~~ cot, President and CEO 251 North Fourth Street Oakland, Maryland (301) TTY (301)
49 May 19, 2016 Dear HSCRC commissioners: As the President and CEO of Meritus Medical Center and a member of the executive committee of the Maryland Hospital Association, I would like to address the proposed fiscal year 2017 global budget update for hospitals. Since our entry into Total Patient Revenue or TPR nearly six years ago, we have remained resolute to improve the health of the population, enhance the experience and outcomes of the patient and reduce the cost of care. In just a few years into our health care transformation, we have experienced success in reducing emergency room visits and hospital admissions, decreasing readmissions from skilled nursing facilities, lowering health care-associated infections and driving out waste and removing variability in patient care processes throughout the health system. Although early in our care delivery transformation, we have already experienced significant improvement in how to manage the health of our community. For instance, we have hired an inpatient diabetes educator to educate patients about their disease process and provide resources to help them remain compliant with their care plan. We have also placed diabetic educators in primary care practices to act as a resource to physicians and patients and round out the continuum of diabetic care in the community. Preliminary data indicates that among a sample group of Meritus Health patients engaged with an outpatient diabetes educator, a four percent reduction in HbA1c levels was attained. In addition, four years ago we began to place RN care managers in our emergency department to develop care plans for high utilizers. Since then, we have seen a 26 percent reduction in ED visits, a 36 percent drop in inpatient admissions and a 25 percent decrease in observation unit visits. Also, the physicians in our primary care practices utilize RN care managers and a team of social work care managers, diabetic educators, pharmacists, behavioral health counselors and respiratory therapists to proactively manage patients health care needs. This outpatient team allows primary care providers to focus on providing medical care to patients while the team helps educate, mitigate and resolve psychosocial barriers to improve patient compliance and outcomes. This multidisciplinary team has also been instrumental in creating disease management programs for patients with COPD, asthma and congestive heart failure. Funding from the Health Service Cost Review Commission has given us the resources to create this multidisciplinary health care team and focus on improving the health of our patients. When we embedded RN care managers into skilled nursing facilities or SNFs, we immediately saw a decrease in 30-day readmission rates. Since this partnership began, we have improved care transitions, provided patient education and benchmarked quality data sharing. Meritus Health pharmacists also provide consultation on formulary changes between hospital-to-snf-to-primary care handoffs. The teamwork between care managers and pharmacists saves time and money, prevents possible adverse medication events and optimizes drug therapy.
50 We have also discovered that 80 percent of our behavioral health ED visits do not require hospitalization. Recently, we integrated behavioral health professionals into our primary care practices to bring behavioral health services to the patient versus the patient coming to a behavioral health practice. Our counselors identify patients at risk, initiate treatment and support and link patients to appropriate community resources. Already, we are increasing immediate access to behavioral health care, improving care coordination, enhancing patient engagement and treatment compliance and decreasing ED visits and potential hospitalization. As you can see, we are on the path to better care, healthier people and smarter spending, but to continue in this direction, we need investment in innovative care programs, adequate staffing and competitively compensated health care workers and the resources necessary to meet the basic costs of running a hospital. Hospitals are the only entities at risk for the model s success. In order for us to succeed, we require a reasonable update to the 2017 global budget. However, the imminent decision as to how much of a global budget update will be provided to hospitals at the midpoint of our five-year Medicare agreement concerns me. Maryland s hospitals must have adequate investment to deliver on cost control and quality improvements. As a hospital CEO, I support MHA s Fiscal Year 2017 Global Budget Update recommendation. I am committed to the care transformation goals of the all-payer model and I share your desire to provide care in the most efficient and cost-effective manner. However, in order to achieve success in population health and lead the nation in transforming health care delivery, Maryland s hospitals, like Meritus Medical Center, need your help and consideration. Sincerely, Joseph P. Ross, FACHE President and CEO, Meritus Medical Center Heather Lorenzo, M.D. Vice President and Chief Medical Officer Thomas Chan Vice President and Chief Financial Officer
51 ~ MedStar St. Mary's Hospital Point Lookout Road P.O. Box 527 Leonardtown, Maryland PHONE MedStarStMarys.org May 19, 2016 Nelson J. Sabatini, Chairman Health Services Cost Review Commission 4160 Patterson Avenue Baltimore, Maryland Dear Commissioners, We are writing to detail our response to recent deliberations at the Health Services Cost Review Commission (HSCRC) meetings, specifically over the stated concerns of some commissioners that some hospitals are not focused enough on reducing avoidable utilization and reining in Medicare total costs of care. Please allow us to detail for you some of our efforts at MedStar St. Mary's Hospital (MSMH). With a long standing tradition of caring for our community by "continuously promoting, maintaining and improving health" per our Mission statement, we are proud of our record near the top in Quality Based Reimbursement scoring every year since its inception. We are a Maryland Performance Excellence Award recipient and pursue performance excellence in all we do. We offer some examples below. Regarding our work to reduce potentially avoidable utilization of hospital services: With the end of the HEZ project in FY17 we will need to sustain the successful care coordination and community health worker programs out of hospital operating dollars. This will not expand our capacity but simply maintain it. To expand the HEZ pilot to the entire county we estimate we will need an additional two FTE RNs, one FTE Social Worker and four - six FTE Community Health Workers on top of the five FTEs that will need to be absorbed when the grant ends. Currently Care Coordinators are carrying case loads above best practice recommendations and many patients that would benefit from care coordination are not able to be offered the service. MedStar St. Mary's Hospital was not awarded any funding for the transformation grants putting us at a severe disadvantage to continue to implement our population health strategy to support the Waiver. We successfully reduced readmissions 15.52% and 13.17% in CY'14 and CY'15 /" respectively compared to our base rates. With no additional resources new progress to continue to reduce readmissions and other unnecessary utilization will most likely stall..//~.~... MSMH has invested in real time quality and safety processes to reduce MHACs. This,...~ -...,'-... strategy resulted in a 24.85% improvement in This important but labo / int-en;ive... " work requires resource commitments to sustain these cost saving improvements. ~ ~~ -..., ~ ~ ~ ---' ~::::::::"..., Knowledge and Compassion Focused on You,/'//
52 Regarding our work with community partners in non-hospital settings to reduce total cost of care spending: We meet regularly with care coordinators from surrounding hospitals to share best practices and discuss common patients. We meet quarterly with representatives of other facilities (like skilled nursing facilities and the Charlotte Hall Veterans Home) to discuss best practices, readmissions rates, and specific processes that are in place for smoother transitions of care. We have collaborated with a local homeless shelter to create a Medical Respite program, launching soon. We attend community inter-disciplinary team meetings to develop community care plans for high utilizers. There is limited public transportation in St Mary's County which limits access to medical care for those with special needs from chronic disease. With the HEZ grant we created additional transportation options via a shuttle bus route and medical specialty route van service allowing patients to visit primary care and specialty physicians. This has proven to be a successful strategy to remove transportation as a barrier to self management for some of our patients. Post HEZ it will be important to sustain this service ourselves or find a community partner able to absorb the work. Hospital associates sit on various boards, workgroups and committees in our community to address social determinants. Our staff are supporting the work of all four teams of the Healthy St Mary's Partnership (Local Health Improvement Coalition). As the sole hospital in our county, our commitment to improving health is ardent and ever expanding, but we must remain fiscally solvent in order to continue this important, long range work of providing the resources necessary to address growth of appropriate volume while reducing potentially avoidable utilization. We are indeed a hospital committed to the care transformation goals of the Maryland All-Payer Model and thus we are also committed to ensuring that there is adequate funding to create the infrastructure necessary to make the connections and hand-offs to community providers and alternatives. Further, within the current model, the only entities at risk for the Model's success are the hospitals, yet success is dependent upon many other organizations, not to mention patient compliance. The cumulative savings the Model has already secured for Medicare, Medicaid and the commercial payers ensure that a reasonable update factor can be provided that will be far below the Model's spending guardrails. Moreover, approving an update that is far below inflation and that sets aside funding available only to some hospitals via an application process, means commissioners would put at risk wage increases for workers, and the ability of hospitals to keep up with the basic costs of running a hospital, much less the investments required to improve community care and reduce utilization. A low update factor such as that proposed would cause MSMH will undoubtedly reduce funding available for wage increases - made more complicated by recent living wage efforts and the shortage in health care providers notably in the Emergency Department is a growing concern.
53 Finally, we support the Maryland Hospital Association Fiscal Year 2017 Global Budget Update recommendation and believe it provides the commissioners specific ways to turn the HSCRC Staff's proposal from inadequate to helpful, without threatening the All Payer Model's spending limits. We would appreciate your serious consideration of this recommendation. Regards, &J~R~ Barbara R. Thompson Board Chairwoman Christine R. Wray President Stephen T. Michaels, COO and CMO CC: Mike Robbins, Senior Vice President, Rate Setting, MHA Michael Curran, Executive Vice President, Chief Administrative & Financial Officer, MedStar Health Kathy Talbot, Vice President, Rates & Reimbursement, MedStar Health
54 UNION HOSPITAL May 20, 2016 Nelson J. Sabatini Chairman, Health Services Cost Review Commission 4160 Patterson Avenue Baltimore, MD Dear Chairman Sabatini : On behalf of Union Hospital of Cecil County, we would like to respond to your staff-recommended global budget update and update for revenues not governed by global budgets for fiscal year 2017 discussed at your May 11 commission meeting. First and foremost, it takes resources to reduce potentially avoidable utilization of hospital services. Over the past six years, we have been employing primary care and specialists to provide access to care in the ambulatory setting, spending millions of dollars. We have added social workers and care managers to improve transition of care to home and post-acute facilities. We opened a clinic for self-pay and Medicaid patients to provide adequate access for our cardiology patients. Finally, we are in the process of developing a free comprehensive care clinic to coordinate health care and social services for our patients outside the four walls of the hospital. In addition, we have been partnering with our local Health Department and Department of Aging to better coordinate the resources they can provide. We also meet regularly with the three skilled nursing facilities to review readmissions data and the rationale to mitigate in the future. We are exploring the use of telehealth and seeding of "SNFists" in the facilities to keep their residents from returning to the hospital. Finally, the hospital is committed to the care transformation goals of the all-payer model, but it takes financial support and time to do it right. Hospitals are the only entities at risk for the model's success; to succeed, a reasonable update is critical. Any improvements we make benefit our patients, but also accrue to the bottom lines of the insurance companies. We look forward to further discussion with you as the commission moves forward on this critical funding decision for the next year. Thank you for your consideration. 106 Bow Street El kton, Maryland / Fax: 410/ TTY: w\v\v.uhcc.com
55 Richard. Szumel President/ CEO ~/0~~ Laurie R. Beyer Senior VP/CFO ~cjj~/k Martin Healy, Chairman of the Board Cc: Herbert S. Wong, Ph.D., Vice Chairman Victoria W. Bayless George H. Bone, M.D. John M. Colmers Stephen F. Jencks, M.D., M.P.H. Jack C. Keane Donna Kinzer, Executive Director
56 DOCTORS COMMUNITY HOSPITAL May 23,2016 Nelson J. Sabatini Chairman, Health Services Cost Review Commission 4160 Patterson Avenue Baltimore, MD Dear Commissioners, We appreciate this opportunity that you are allowing for Doctors Community Hospital (DCH) to discuss all our transformative work that we have implemented to reduce utilization and save per capita costs in Maryland. To implement our care coordination and management programs within our hospital and with non-hospital community partners, we are using both infrastructure dollars allocated over the past two years and the variable cost savings from CY 2014 and CY 2015 as a result of reducing readmissions by 13.97% and 6.47%, against HSCRC goals of 6.76% and 9.3%, respectively. Our programs have also shown success in "quality-based" improvement efforts, such as MHAC in which we moved from 45 th to 39 th in the State, and receiving a reward. In CY 2015, PQIs and PAUs both show a reduction of 5% over prior year's values as seen in Appendix A, our Monthly Population Health GBR Dashboard. Now, in our third year, we are beginning two new efforts in implementing total cost of care initiatives. Every year we add programs and initiatives with our community partners, since the effort of reducing healthcare costs must be a collaborative approach although only hospitals are at risk for the model's success. A reasonable update factor is critical to allow a few more years to meet this first Medicare Waiver mandates. The cumulative savings, the all-payer model has already secured from Medicare, Medicaid and commercial payers, is a result of programs such as the ones identified in Table 1: Infrastructure Funds. In FY 2016, an additional $891,502 was provided as Infrastructure Funds, and as you can tell the three years of funding don't begin to cover the costs to implement the community programs needed to meet the Triple Aim strategies of cost reduction, community health improvement, and patient satisfaction.
57 Doctors Community Hospital 21Page Infrastructure rate order $ 718, $ 701, Investment 1: Investment 2: Population health focused reports to track potentially avoidable utilization and identify key areas to focus on. Routine reports are generated daily (Daily Scorecard), monthly (Monthly GBR Dashboard), and quarterly (BRG report) to help clinicians monitor their efforts centered around population health patient care. Outcomes Imrovement Committee will be implemented in Q3 of FY 2015 to create structure and accountability around the reduction of potientially avoidable utilization, MHAC and Readmissions. Focus is to use BRG reports to identify what and how to reduce PQls. Hired Navigators and PAs to visit the patients $.209, $ 365, n/a $ 160, Investment 3: Investment 4: Investment 5: Investment 6: Investment 7: Investment 8: Mobile Clinic: The "Community Health Connector" is a mobile van that travels to various locations in Prince George's County to help patients maintain or improve their health. The mobile clinic is staffed with DCH healthcare professionals. The clinic provides a wide range of services to people ages 16 and older, including:+ Blood pressure screenings,+ Electrocardiogram (EKG) testing,+ Flu and pneumonia vaccinations,+ Tetanus shots,+ HIV screenings,+ Pulmonary function testing,and + Routine physicals Sickle Cell Clinic: As a result of the review of readmission patients, the hospital identified that Sickle Cell patients were being readmitted due to the lack of proper outpatient protocols. After discussions with the local physician practices and meetings with Johns Hopkins clinical representatives, the hospital decided to offer the Johns Hopkins protocols in our Infustion Clinic Center. CHF Clinic: The Congestive Heart Failure Clinic is a comprehensive program that provides: + An experienced and board-certified heart failure cardiologist + A holistic care approach that includes the collaborative services of pharmacy, nutrition, physical therapy, cardiology, physician assistant, social work, home health and hospice care professionals - all accessible on Doctors Community Hospital's campus Accountable Care Organization ("ACO") / Clinically Integrated Network ("ClN"): The rationale / primary objective for joining an ACO is to build relationships with physicians in the community. The CIN will allow for gain sharing with the physicians once the business becomes profitable. ER Through-put / Readmission Initiative (consulting by Medical Strategies and Management). The objectives of this consulting engagement were to reduce ER wait times, increase patient satisfaction in the ED, reduce unneccessary admissions to the Telemetry unit that belong in a Med/Surg unit. The second phase of the consulting engagement focused on reducing readmissions. Committee formed to reduce Readmissions from Genesis Nursing Home to DCH. $ 2, $ 4, $ 54, $ 79, $ 21, $ 185, $ 174, $ 1,747, $ 520, $ 243, $ 2, n/a Investment 8 Investment 9 Premier Cost Savings Initiatives Professional Fees: In an effort to reduce hospital costs, we reduced staffing, supply expenses, and other expenses to meet our goals versus our peers in Premier's national database. Ambulatory Care Center - Leiland Hospital Total Spent Dollars from Variable Cost Savings n/a $ 1,242, $ 986, $ 4,029, $ (267,554.15) $ (3,328,185.86)
58 Doctors Community Hospital 31Page Table 2: TLC-MD describes the Transformation Partnership efforts started in March and continues through today with 6 hospitals and over 40 community partners in an effort to offer care coordination in Prince George's County, St. Mary's County, and Calvert County. Although TLC-MD Transformation Grant was not funded in round one, we will continue to serve our counties on a smaller level as HSCRC staff evaluates if funding is available. Here are the four Strategic Efforts that are offered or being developed in our counties to meet the Triple Aim strategies. Strategy #1- Screen all admissions to our hospitals and implement layered care coordination. S 3,922, REVISION 1,575, NOTES Our High-Needs Population will have care coordination provided by their hospital or by eqhealth, under contract with TLC-MD. The eqhealth suite of services includes home visits, patient and caregiver education, medication reconciliation, navigation for primary and specialty care and supportive services care planning, and communication with physicians. We will track the effectiveness of this approach by monitoring readmission rates, total cost of care, and RCA of readmissions and preventable hospitalizations. Patient satisfaction and engagement will be critical and regular surveys will be conducted to receive patient (and caregiver/family) feedback. Reporting on Care Coordination: EQHealth - Implementation of Business Intelligence. This tool is used for reporting on the results of care coordination. 33, , Predictive Modeling: EQHealth Business Intelligence (Hopkins). This tool is used to place all claims data on our population so that predictive modeling can identify patients with needs before readmissions begin after the first visits. 12, , Rent and Organizational Costs for Small Villages for the St Mary's HEZ, to pay fees to have educational services throughout the community as needed. 27, , St Mary's Clinic staffing and other costs is the expense ofthe HEZ clinic, one ofthe unique programs we will be having for care coordination that is different from the eqhealth approach since this rural approach Open a 184, works better for this population. 369, smaller clinic Three Discharge Clinics Staffing and other costs is the expense ofthe Discharge clinics, one ofthe unique Open 1 clinic programs we will be having for care coordination that is different from the eqhealth approach since this in Prince rural approach works better for this population. We are planning to add 2 more clinics to support this George's approach to care coordination as guided by the evidence. 851, County Transportation Services for patients whose cost of transportation keeps them from meeting an
59 Doctors Community Hospital 41Page Strategy #1- Screen all admissions to our hospitals and implement layered care coordination. appointment. Physician Care is for the payment of co-pays or physician office visits for the self-payor indigent patient who is not eligible for insurance coverage or Medicaid or Medicare. Call Center is the expense to cover after hours call coverage from 6pm to 8am M-F and all weekend. The following Tiers are based on the acuity level of the patient and months in TLC-MD's program. High utilizers Time on program High utilizers Time on program Tier 1 10% all year Tier 3 6% 180 days Tier 2 78% 90 days Tier 4- high acuity 6% 180 days Tier 1- Social and Medical is costs associated county case workers to support our patients, as TLC-MD identifies. Tier 1- Behavioral is costs associated with services provided to patients needing mental health assistance that is not part of the insurance coverage. Tier 2 - Social and Medical is costs associated county case workers to support our patients, as TLC-MD identifies. Tier 2 - EQ Medical is the cost of the software and the professional services from an RN to visit the Care Transition patients in the hospital and place them in a care coordination program. The cost includes the use of this software for care coordination programs within the hospitals whose staff work directly with patients, such as Cancer Navigators. Tier 3 - EQ Medical is the cost of the software and the professional services from an RN to visit the Care Transition patients in the hospital and place them in a care coordination program. The cost includes the use of this software for care coordination programs within the hospitals whose staff work directly with patients, such as Cancer Navigators. Faith and Community Based is the cost of working with the community to help TLC-MD visit with patients who need volunteers to assist them. Recruit 100 congregations and community organizations, health liaison training, feedback and evaluation with participating organizations, add training for community health workers for congregations, community organizations that would want their own paid staff and nurse support for outreach health fairs and screenings at participating organizations. Patient Engagement is the cost to support the use of telehealth technologies, such as fitbits, that can be provided to patients and linked back to the eqhealth software tool to notify TLC-MD care coordinators when patients are possibly having difficulty in managing their care processes. $ 3,922, REVISION 1,575, NOTES volume No free MD 192, care 0 6 hours a 125, night 140, volume 131, volume 319, volume 851, volume 130, volume 500, volume 235, volume 58,800.00
60 I Doctors Community Hospital SIPage Strategy #2 - Reinforce the care coordination with special focus on medication management. Vitamin D levels cost is payment to the Emergency Rooms of the Member Hospitals to monitor levels. Medication Delivery System has been tested by Union Memorial Hospital, and we have decided to test the use of an alarm system that sounds when the patient does not take their medication timely. Non-Medical Equipment is the cost for scales and other minor equipment that can be provided to patients to assist patients who are possibly having difficulty in managing their care processes. Tier 1 - Medicine Management is cost associated with services provided to help review the patient medications past medication reconciliation and medicine adherence to are the prescriptions appropriate for the patient. Tier 2 - Medicine Management is cost associated with services provided to help review the patient medications past medication reconciliation and medicine adherence to are the prescriptions appropriate for the patient. Tier 3 - Medicine Adherence is the cost of placing the tool in the patients' homes that filled with a month of medication and is linked to eqhealth to notify the TLC-MC care coordinator if the patient is non-compliant. Tier 3 - Medicine Management is cost associated with services provided to help review the patient medications past medication reconciliation and medicine adherence to are the prescriptions appropriate for the patient. Tier 4 - Medicine Management is cost associated with services provided to help review the patient medications past medication reconciliation and medicine adherence to are the prescriptions appropriate for the patient. $1,201, , , , , , , , , REVISION NOTES volume volume volume volume volume volume volume volume 76,500.00
61 Doctors Community Hospital 61Page Strategy #3 - Support physician practices that deal with these high-needs patients Physician Engagement includes hosting CME meetings throughout the 3 counties each year. Plans include 11 events at $66,000 for location and food, $7,500 for the speakers, and $15,000 for CME fees. Three (3) Outreach and Education meetings to explain: Increasing Quality and Revenue Through Medicare Fee-for-Services, EHR Incentive Programs, CRISP Services for Providers, The Post-Acute Care Team Program, All New Payer Model: Performance Improvement Continuing Medical Education (PI CME). Implement the intervention(s) based on the results of the analysis Physician Engagement is a cost to communication to practices, such as (a) distributed by participating sites (placed in inpatient packets~ waiting rooms~ mobile C/inic~ health fair packets~ social work packets~ etc.~ (b) Postcard mailed to targeted ZIP codes to inform patients of this service, (c) Public service announcement audio/video(distributed to local radio and television stations~ and placed on participating sites' Web and YouTube pages~ (d) participation with health fairs, and (e) brochures for awareness to other offices, such as County offices and Agency Area on Aging offices. CRISP Outreach: Initial goal of 50 physicians. Reach out to targeted individual practices as identified by the coalition to register for CRISP services: Encounter Notification Service (ENS), Prescription Drug Monitoring Program (POMP), Query Portal REVISION $271, NOTES 76, Us MedChi's 88, CME license 76, No physician office site 175, visits 0 Free 7, services 0
62 Doctors Community Hospital 71Page Strategy #4 - Cultivate a highly reliable learning organization, with ongoing testing, adaptation, and adoption. $816, REVISION NOTES 398, Executive Director who will management this program. Financial Analyst will perform all the financial reporting to ensure we are documenting our expenditures properly per initiative. This person will also ensure that each hospital supplies their grant values quarterly to TLC-MD to pay the bills. The ROI will be a combination of the Clinical and the Financial Analysts work. Clinical Analyst will monitor all the clinical components for reporting to committees to ensure we have positive outcomes or can offer suggested improvements to our processes. 200, , , , Exec Dir to do 0 80, Benefits at 20% of Wages are the related to the staffing benefit and tax costs. Consultant costs are for the continued facilitation of the grant as an assistant to the Executive Director as needed to evaluate initiatives and keep the program moving forward. Project Management is the cost of maintaining the Timeline and reporting on progress. Metrit Management is the cost of maintaining the Timeline and reporting on progress. 90, , , , Adjust 70, No Altarum 0 Exec Dir to do 0 Clinical Analyst to do 0 Insurance is the cost of Directors and Officers insurance. Audit / Finance is for the annual fiscal and compliance audits, and any cost of complying with HSCRC reporting. Legal is the cost for additional legal assistance with contracts and questions that arise. 20, , , , No audit, just Acctg 12, No legal 0 Website is the cost of maintaining a website with relevant data. Lab services are the cost of providing other testing of interventions as nece~~c:l~y. 30, , No website 0 Hospitals pay from Comm Benefits 15,680.00
63 Doctors Community Hospital 81Page In the synergy between the Table 1 Investment 6: ACO/CIN effort and Table 2 of care coordination, DCH staff recently identified that the patients of the ACO can have their claims history processed through TLC-MD's eqhealth's predictive modeling tool so patients who might be considered high-needs patients in a year or two, can be care coordinated through TLC- MD today in an attempt to meet the Triple Aim strategies. The building of care coordination and total cost of care efforts are not simple, but complex programs that support unique patients. Based on the demographics seen in Table 6, Prince George's county falls short in so many categories as compared to Maryland: non-hispanic African-Americans, more diabetes, more food insecurity, less physicians, less health care cost because of not being able to see a doctor, and other disparities. To meet our community and give patients the opportunity for preventive care, during FY 2016 and in preparation for FY 2017, DCH has been adding Navigators, Physician Assistants, Nurse Practitioners, and Physicians to place these providers in the community in outpatient locations within Prince George's County. The plan is to purchase primary care and specialty practices to expand the number of providers to offer the community preventive medicine. At this time, we have purchased 3 practices and have at least 3 more planned. With 50% funding from the MHA Hospital Bond Capital Project, our plan is to open two multi-purpose clinics to serve the communities. In FY 2017, we will be joining with LaClinica, a FQHC, in the opening of a PCP/Specialty Care Clinic to service Hispanics, a growing population of Prince George's County. DCH has a relationship with Genesis, a nursing home owner and manager. We have been meeting to develop a program to reduce readmissions. Our intent is to develop a risk relationship on bundled services when a DCH inpatient is transferred to a Genesis skilled nursing facility. This effort has been in process for a few months, a costly process of studying the reasons for nursing home patients and putting together protocols to reduce unnecessary readmissions.
64 Doctors Community Hospital 91Page Demographics Population % below 18 years of age % 65 and older % Non-Hispanic African American % American Indian and Alaskan Native % Asian % Native Hawaiian/Other Pacific Islander % Hispanic % Non-Hispanic white % not proficient in English % % 10.00% 63.00% 1.00% 4.00% 0.00% 15.00% 15.00% % 10.80% 62.80% Maryland 22.70% 13.40% 29.20% % Females % Rural 1 Health Outcomes Diabetes HIV prevalence Premature age-adjusted mortality 11% 12% % 633 Infant mortality Child mortality j Health Behaviors Food insecurity Limited access to healthy foods Motor vehicle crash deaths Drug poisoning deaths, Health Care Uninsured adults Uninsured children Health care costs Could not see doctor due to cost Other primary care providers 1 Socfcil&EconomlcFactors ""-." -,~,-,,,.,c~=,=~,, =-==_ --=,-~ -"=,,-'" =,,=cc, Median household income Children eligible for free lunch Homicides 20% $8,592 11% 20% 5% 13% 3% % 4% $9, % 8 Prince George's County Data provided by County Health Ranlcings
65 Doctors Community Hospital 10 I P age As for the FY 2017 update factor, the thought that after two years under the GBR model, that a hospital can tum around its community is not realistic. From the tables above, you can see how complicated the changing of life long habits can be when all providers do not have the same financial incentives - GBR vs. volume. The hospitals are being held accountable for management by community-based physicians. The most disturbing component of HSCRC staff's proposed update factor is the use of PQI to penalize hospitals. Some hospitals specialize in conditions unrelated to a PQI diagnosis. Thus, hospitals have lower or higher PQ Is depending on the specialty services offered and using the PQI as a good or bad performance measurement distorts the results. Besides the social-economic factors are only sex and age, and not all the other differences that make Prince George's County's patients different are considered. Three years ago we entered the GBR with the understanding that the GBR would have a reasonable inflation factor, population changes, and valid rewards/penalties. The PQI penalty seems to miss the validity of the update factor. Also, the HSCRC staff's inflation factor assumes that the Global Insights will again overstate the market basket forecast but in the past, Global Insights also understated the forecast. Hospitals have taken on the total risk of volume/case-mix, and price increases within the global budgets, while the forecast error is a significant adjustment to the unit cost increases, without recognition of the total risk we have assumed under the global budget. Why start to adjust the update factor in this fourth year of the GBR and chance that the hospitals find they cannot continue new and unique services that support community change? At the May 2016 commissioner meeting, it was said that HSCRC does not want to penalize hospitals who gave their staff market raises in prior years, but reducing a future inflation factor does just that by having hospitals choose how to deal with less funding for today's inflation. We are supportive of the GBR, the Triple Aim, and the movement towards a healthier community. We just need a fair update factor to allow us the time to finish the projects mentioned in our Tables and start new projects that show Maryland is the model for the county. We look forward to further discussion of the MHA proposal with you, as the commission moves forward on this critical funding decision for the next year. Thank you for your consideration. Sincerely, ~~ Philip B. Down, CEO Camille R. Bash, CFO CC: Herbert S. Wong, Ph.D., Vice-Chairman (herbert.wong(ci).ahrq.hhs.gov) Victoria (Tori) W. Bayless (vbavless((vaahs.org) George H. Bone, M.D. (ihc.bone(ci)gmail.com) John M. Colmers Cicolmers(ci)jhmi.edu) Stephen F. Jencks, M.D., M.P.H. (SteveJencks(ci)comcast.net) Jack C. Keane (keaneic(iv.aol.com) Donna Kinzer, Executive Director (donna.ldnzer(al.maryland.gov)
66 Doctors Community Hospital 11 I P age Appendix A: Monthly Population Health GBR Dashboard Doctors Community Hospital GBR Quality Measures CY 2014 (Final) - Effects Rate Year 2016 CYTO Effects Rate Year 2017 Result Goal!l) Rank $Im~ Revenue Impact(2) Result Goal!l) $ Impact Revenue Rank (Estimated) Impact(2) Data Period Notes: Readmission Reduction %1-6.76% 680,054 Reward -6.47% -9.30% Improvement in risk-adjustment readmission rate vs. prior 26 (398,000) Penalty January - December 2015 calendar year MHAC 0.41 ~ (234,501) Penalty 0.45 ~ ,000 Reward January - December 2015 CY15 % penalty/reward from monthly dashboard QBR ,095 Reward TBD ~0.54 TBD TBD TBD Data Unavailable Need QBR scaling results for RY16 Market Shift 3.41% >0.00% ,321 Increase 0.83% >0.00% 29 (678,059) Decrease January - September 2015 Includes market shift reduction for infusion/oncology/etc (Preliminary) PQI Volume/Charges(3) 18.42%1 0.00% 41 $ 18,719,206 Bad Volume 18.36%1 0.00% PQI % of discharges. Dollar Amount is total charges reflective 41 $ 17,768,767 Bad Volume January - November 2015 of PQI cases. Total PAU Volume/Charges(3) 28.32%1 0.00% 37 $ 45,713,838 Bad Volume 29.74%1 0.00% Total PAU % of discharges. (Readmissions, PQI, PPe's). Dollar 41 $ 43,609,775 Bad Volume January - November 2015 Amount is total charges reflective of PQI cases. Note (1): Goals reflect maximum reward. Note (2): Reward / Penalty: Reversed annually and new amount calculated each year. Market Shift: Calculated annually by Product line and zip code. Bad Volume: Reflects actual dollar amount of PQI/PAU charges. These charges do not benefit the GBR cap. Note (3): Results reflect the PQI/PAU percent of total discharges.
67 ExCEPTIONAL HEALTHCARE. EXCIPTIONAL PEOPLE. May 23,2016 Nelson J. Sabatini Chairman, Health Services Cost Review Commission 4160 Patterson Avenue Baltimore, MD Dear Chairman Sabatini: On behalf of Peninsula Regional Medical Center, this letter follows up on the current staffrecommended global budget update for fiscal year Ifthe Health Services Cost Review Commission's (HSCRC) staff recommendation is adopted, it will jeopardize Maryland's momentum under the new All-Payer Model. In the past, the rate setting system updates have not been adequate, and once again the commission has recommended an unacceptable update. Additionally, PRMC and other Eastern Shore hospitals were excluded from the HSCRC's Transformation Implementation Program. Constraining the hospital industry funding now, at this sensitive stage, would undermine our emerging success and threaten our ability to meet the waiver's continued requirements. The commission's support through reasonable funding levels early on has been an essential building block ofthe success to date. At levels as low as those proposed by HSCRC staff, Peninsula Regional Medical Center and other Maryland hospitals will be unable to pay necessary wage increases, meet the increased cost of core hospital operations, cover the increase in drug costs, maintain facility infrastructure, invest in improved electronic medical records, and follow through on population health initiatives in the community. Of greater concern, an update this low calls into question the support required to move to the next generation of care coordination and transformation. Now is a time when the state and stakeholders must be united, sharing with federal officials and the nation our collective successes in the first two years of this model, and continuing to shape the hard work still ahead. An inadequate update will confirm concerns expressed all along about the model- that because of the total cost of care metric, PRMC and all other Maryland hospitals will be hampered in delivering truly innovative care, and reduced to simply chasing national Medicare performance. Cumulatively to date, Maryland has met every metric of the All-Payer Model and far exceeded most. Like many hospitals across Maryland, PRMC has outspent the funding provided in rates by the Commission for investments in population health. The delivery of care has changed and continues to evolve against a backdrop of exceedingly, and sometimes unrealistically, high expectations about the time and resources required to implement dramatic change, not only inside PRMC but also within our community. 100 East Carroll Street Salisbury, MD
68 Specific to PRMC, we have a larger structural margin issue that must be addressed, and the systematic erosion of our bottom line through inadequate rates jeopardizes our ability to continue as a tertiary referral center. As the Lower Eastern Shore's only tertiary referral center, we offer trauma care, open heart surgery, structural heart surgery, robotic surgery, comprehensive cancer care, neurosurgery, and we deliver more babies than all the other local hospitals combined. Since 2010 PRMC has experienced update factors below inflation. In fiscal year 2013, PRMC experienced its first ever layoff since opening in While there was an improvement in the amount of the rate increase in fiscal years 2015 and 2016, those rate increases only provided a part ofthe funding of the infrastructure to begin our journey into population health. The HSCRC FY 2017 proposed update factor for PRMC will be about 1.00%. This clearly does not allow for wage increases for employees and it will not cover supply inflation. We support the MHA's global update recommendation as it provides commissioners specific ways to turn the HSCRC staff's proposal from inadequate to helpful, without threatening the All-Payer Model's spending limits. Population health has become a strategic focus at PRMC with the establishment of a new department and the appointment of a vice president assigned specifically to oversee hospital and community transformation initiatives. PRMC is located in a rural, geographically isolated area with Maryland's poorest county in its primary service area, as well as the proportionally highest elderly population in the state. As a result, it is essential that PRMC offer a robust community outreach program that prioritizes the prevention of readmissions and other potentially avoidable utilization. Through these efforts, PRMC's risk-adjusted readmission rate has improved by 3% through CY2015 vs the base period CY2013, and was 11.90% to start, which was in the top quartile. Peninsula Regional's mission is to improve the health of the communities we serve. We are no longer just in the hospital business; we are in the health business, with an emphasis on preventing illness, keeping our community healthier, improving quality and lowering costs. The change has been revolutionary. Below are a few examples of the actions PRMC has taken to reduce potentially avoidable utilization of hospital services: Administered over 6,000 annual community flu shots (including a drive-thru flu clinic) Monthly community education via public access programming Opened an on-site pharmacy, HomeScripts, for 30-day first fills Created a focused transitional care nursing team Implemented standardized education for clinical and physician staff Enhanced discharge processes (including verbal and written instructions) Created dedicated emergency department case managers deployed across the unit Implemented follow-up appointments within 72 hours for high-risk discharges Assigned pharmacists to high-risk hospital units
69 Developed a 24 hour RN-staffed patient call line for high-risk patients Implemented the Philips Lifeline CareSage program to identify inpatients at risk for falls Enacted a falls prevention and education program in cooperation with Maryland Active Citizens, Inc (MAC) to identify ED patients at risk for falls at home with referral to a proven falls prevention program Awarded a CMS Transformational Care Practice Initiative (TCPI) grant to assist independent local providers Actively engaging skilled nursing home clinical and administrative leadership to drive down hospital utilization/readmissions Developed standardized education modules on CAUTls and UTls in the post-acute care and community setting Implemented a medically based weight loss program Delivered education to community providers on PAU and other population health initiatives Applied lean principles of standard work to derive improvement of processes Engaged physicians on all quality initiatives Provide diabetes awareness, education and management to the community In addition, PRMC has been working across the continuum with a multitude of community partners in non-hospital settings to reduce total cost of care. Developed partnerships with local law enforcement, health department and other community providers to address a local opioid epidemic Formed a strategic partnership with the YMCA for health and well ness initiatives Sponsor of an annual health fair with the Wicomico County Board of Education offering free screenings and education to over 1,200 residents Partnered with a home health agency on medication reconciliation Provided funding and partnered with Lower Shore Clinic-CareWrap program-targeting primary and mental health at-risk patients to reduce readmissions Working with the United Way, Wicomico County Library and Rotary Clubs to develop and implement a health literacy program to provide basic health information to poor and underserved members of our community Partnered with Maryland Active Citizens, Inc (MAC) to provide falls prevention, cancer support, chronic disease management and chronic disease self-management Use of PRMC's Wagner Wellness van (a mobile clinic) in conjunction with Urban Ministries to provide primary care and screening services Worked with our joint venture partnerships for home health, durable medical equipment, SNF, outpatient rehab, diagnostic imaging and ambulatory surgery to reduce total cost of care Created a clinically integrated network/accountable care organization (ACO) with independent physician practices, Three Lower Counties (TLC) a Federally Qualified Health Center and PRMC's own medical group
70 Actively working with the regional SNFs and Acute Rehab facilities to reduce readmissions and ED use with nurse case managers who round on-site with the SNF teams. Submission ofthe first "regional" grant as a partnership with all three hospitals that included strategies to impact gaps in care that exist on the Lower Eastern Shore. The entire community was engaged in the development of this request for funding, including all Health Departments, local churches, skilled nursing facilities, non-profits, home health, local FQHC, and others. These valuable programs, by their episodic and ongoing nature, are time-consuming but incredibly impactful beyond the short run. Redesigning a hospital delivery system focused on population health and value-based payment models is a Herculean task; it involves not only brick and mortar structural changes, but a wide array of process changes in both the inpatient and outpatient environment. Cultural changes need to be fostered in both acute-care hospitals as well as post-acute care and office-based practices. The seeds of these structural and cultural changes have been sown, but regulatory patience is required while we work together to orient our entire system of care delivery toward population health and wellness. Approving an update that is far below inflation and sets aside available funding only to some hospitals via an application process means commissioners put at risk wage increases for workers and the ability of hospitals to keep up with the basic operational costs... much less the investments required to improve community care and reduce utilization. As discussions evolve concerning the rate structure, hospitals are at the forefront of an evolutionary change. Maryland hospitals are struggling to strike a balance during this transitional period, and are the only entities at risk for the success of the All-Payer Model. A reasonable update is critical for the continued success of the new All-Payer Model, and based on the cumulative savings so far, there is plenty of cushion. We look forward to further discussions as the commission moves forward on this critical funding discussion. Peggy Naleppa, MS, MBA, DrM, FACHE President/CEO Bruce Ritchie Chief Financial Officer ~ CB Silvia, M D Chief Medical Of 'cer (\N. Chairman, Board of Trustees
71 ... = MedStar Franklin Square Medical Center 9(X)() Franklin Square Drive Baltimore, Maryland PHONE FAX Administration May 23, 2016 SENT VIA ELECTRONIC MAIL; ORIGINAL TO FOLLOW VIA US MAIL Nelson J. Sabatini Chairman, Health Services Cost Review Commission 4160 Patterson Avenue Baltimore, MD Dear Chairman Sabatini: We write on behalf of MedStar Franklin Square Medical Center ("MFSMC") to express our serious concerns surrounding the current staff-recommended global budget update for fiscal MFSMC, a non-profit, community teaching hospital that relocated to Eastern Baltimore County in 1969, serves a very diverse patient population. In the southeast portion of Baltimore County, the estimated percentage of all people whose income is below the federal poverty level is 11.4 percent, compared to 8.2 percent in all of Baltimore County (American Community Survey, ). Four of the zip codes in MFSMC's service area (21206: Overlea; : Essex; and, and 21224: Dundalk) have poverty rates that are considerably higher ( %) than the Baltimore County average. Rates in MFSMC's service area for asthma, heart disease, hypertension and cancer are all higher than rates in Baltimore County and the State as a whole. The Baltimore County Local Management Board identified a small community (3 census block groups) within the Essex zip code that annually produced the most negative birth outcomes, including infant mortality, babies born of low birth weight, and births to adolescents in the State of Maryland. MFSMC has made serving these needs a priority if we are to succeed in a manner called for in the revised Waiver the State of Maryland entered into with CMS. Rate Increase for MFSMC is 1%; NOT the 2% Being Presented For MedStar Franklin Square, the staff proposal translates into an approximate 1 % rate increase, not the 2% that is being presented to the public. As the leadership of MedStar Franklin Square, we believe-in fact, we know- the staff proposed update factor will Knowledge and Compassion Focused on You

72 jeopardize the momentum we have made based on IHl's Triple Aim framework. Further, we believe the staff proposal represents an overcorrection that would jeopardize the State of Maryland's momentum under the new All-Payer Model. We believe, based on more current data than used by HSCRC staff, that a higher update can be provided without encroaching on the staff-recommended Medicare total cost of care cushion. Proposed Global Budget Update Does Not Adequately Recognize Inflation; Will Lead to Further Job Losses & Program Closures As the leaders of MFSMC, we believe that constraining hospital funding now will not only lead to a reversal in the investments we have made to manage the population's health (which will be discussed below), but also require us to reduce employment beyond the most recent workforce reductions. The initial reductions put in place in April and May-totaling 122 positions or 4% of MFSMC's workforce-were made based on an update factor of 2.6%. These decisions were necessary as a result of increases well in excess of inflation in such areas as pharmaceuticals & medical supplies and compensation increases made to retain a well-qualified workforce. We believe these increases are further proof that the staff proposed update factor is too low given its assumption that health care inflation is 1.720/0 (against a projected 2.49%). Regrettably, should the proposed update factor be implemented, MFSMC will be forced to reduce employment further and close certain non-rate regulated centers that serve our community (e.g., Women's & Children's Center). MFSMC Has Invested in Population Health Beyond Funded in Rates Since the initiation of the new waiver with CMS, MedStar Franklin Square has invested in the development of a Population Health Division. The funds invested in the Population Health Division exceed those provided by the HSCRC update factor in fiscal years 2015 and We believe our initiatives and partnerships have been extremely valuable to achieving the objectives outlined in the Triple Aim framework. The first initiative is our work with the neighboring Genesis Franklin Woods Nursing Home. We have instituted a Congestive Heart Failure Team ("CHF Team") whose focus is to manage patients in the Nursing Home with the goal to provide proactive care and, in doing so, reduce admissions (and readmissions) to MFSMC. The CHF Team consists of cardiologists, case managers, social workers, pharmacists, and transitional care nurses from MFSMC, as well as a dietician, social worker, and cardiac rehabilitation specialist from Genesis Franklin Woods. In CY16, patients in this program have seen a significant reduction in their 30-day readmission rates: from 28% to 11.5%. 2

73 We are also proud of the initiation of a Navigator Program within our Emergency Department intended to link ED patients with primary and specialty care providers so that we reduce unnecessary ED utilization and provide greater continuity of care for patients who have chronic medical conditions. In FY 2015, MedStar Franklin Square saw a reduction of approximately 3,000 ED visits. Some of this ED visit reduction can be attributed to this initiative. MedStar as a system has also established Palliative Care Programs in many of the System's nine acute care hospitals, including MFSMC. MFMSC's Program was initiated in FY 2015 and is currently staffed by a full-time physician, pharmacist and social worker. Finally, MFSMC is also pleased with the outcomes of the work by our Department of Family Medicine which is managing the health of approximately 11,000 patients and has entered into shared savings initiatives with certain commercial payers. The shared savings are based on performance in reduced hospital utilization (ED and inpatient). The mainstay of this initiative is the investment in a Care Coordination Program ("CCP") for those patients at highest risk for avoidable high-cost utilization. The CCP includes care by a multidisciplinary team, a home visit program, telemedicine follow-up visits, and a community-based team of community health workers, advocates and primary care providers. To-date, our results have demonstrated significant savings of nearly $11,000/month in avoidable inpatient utilization and $9,000/month in avoidable ED visits for participants in the CCP. MFSMC is also part of a new Regional Partnership with the John Hopkins Hospital, John Hopkins Bayview Medical Center, MedStar Harbor Hospital and Sinai Hospital. Our Regional Partnership Grant received partial funding starting in FY17. We are thankful for the additional funding, but the continued constraints on needed dollars will make it difficult to fully meet the goals of the New Waiver. Also of note is the staff recommended Global Budget Update factors including an additional 0.65% for shared savings, a total of 1.25% over the three years, without being provided adequate rates or funding for programs to achieve the outcomes or savings. Now is Not the Time to Withdraw Support Federal officials have recognized the success of the new CMS waiver in its first two years and cite the Maryland waiver experiment as a new model that moves providers to improve community health outcomes, improve quality of care and reduce the cost of care. The State of Maryland has moved extraordinarily fast to adapt to the new CMMI Waiver metrics and can claim success in our first two years. We do not believe the proposed Global Budget Update will allow us to sustain the momentum of the last two years. 3
74 It is for this reason that MedStar Franklin Square respectfully requests that the HSCRC increase the FY 2017 Global Budget Update factor to 2.60/0. With a rate increase of 2.60/0 in FY 2017, the State will be well below the 13.1 percent ceiling. In addition, our cumulative Medicare savings will far exceed the target (even if we do not produce any additional savings in FY 2017). Finally, while Medicare's total cost of care grew faster than the nation in 2015, Maryland did not exceed the waiver's ceiling. This increased funding will provide for the investments needed to meet the ultimate objective guiding the Waiver Demonstration entered into by the State of Maryland with CMMI. We stand ready to answer any questions you may have. Thank you. Most sincerely, /}1;i~/'eh;-1 - Michael Dietrich Chair, Board of Directors ~L.l(S Samuel E. Moskowitz, FACHE President, MedStar Franklin Square Medical Center Sr. Vice President, MedStar Health Stuart M. Levine, FACP Vice President of Medical Affairs & CMO cc: Herbert S. Wong, Ph.D., Vice-Chairman Victoria (Tori) W. Bayless George H. Bone, MD John M. Colmers Stephen F. Jencks, MD, MPH Jack C. Keane Donna Kinzer, Executive Director Mike Robbins, MHA Kathy Talbot, MedStar Health 4
75 May 23, 2016 Commissioners, Health Services Cost Review Commission 4160 Patterson Avenue Baltimore, MD Dear Commissioners: We are writing to detail our response to recent deliberations at the HSCRC meetings, specifically over the stated concerns of some Commissioners that some hospitals are not focused enough on reducing avoidable utilization and reining in Medicare total costs of care. Please allow me to detail for you some of our efforts at MedStar Southern Maryland Hospital Center (MSMHC). With the purchase of the hospital by MedStar Health, the first focus was on driving quality and safety improvements. Significant progress was made in both arenas including considerable and important turnover in providers, improvements in Core Measures to result in MSMHC being named one of the Joint Commission s Top Performers in Key Quality Metrics last Fall, and a run of twenty-four months of zero ICU CLABSIs, among others. We offer some further examples below. To address Potentially Avoidable Utilization of hospital services, we are staffing case managers in our Emergency Department (ED). We also have a Behavioral Health Social Worker in the Emergency Department to coordinate services for those patients who can be discharged from the ED. Additionally, we are partnering with the Prince Georges County Health Department to provide grant funded Social Workers. We have invested in new Case Management software across our MedStar Health system to facilitate more effective management of our inpatient clinical cases, with the objective to reduce the number of days leading up to potential denials and improve the care coordination. We have also improved the engagement of payers to plan more strategically for their at risk patients. Further we have a Length of Stay Reduction initiative focused on streamlining processes particularly around the last 24 hours of the stay. This includes identifying test results more timely and preparing patient families for discharge expectations. We have an ongoing review of observation cases to ensure appropriateness. We also offer education to our patients and guidance on resource utilization in the ED. Regarding our work with community partners in non-hospital settings, we have participated with our Nursing Home partners to provide lab services to reduce the need for Emergency Room visits. We opened a Medical Specialty Unit to accommodate chronic vent patients from the Nursing Homes such as Pineview, which accepts chronic vent patients. This helps us to avoid patients having to be admitted to the Intensive Care Unit or have prolonged stays there.
76 Also regarding our work with non-hospital settings, we are establishing a Transitional Care Clinic to reduce readmissions to MSMHC. The staff will include a Nurse Practitioner, a Registered Nurse Case Manager, as well as, a Registered Nurse. Finally, we have joined with our fellow Prince George s County hospitals to learn from recent HEZ demonstration projects and to identify community care collaboration opportunities. We are indeed a hospital committed to the care transformation goals of the Maryland All-Payer Model and thus are also committed to ensuring that there is adequate funding to create the infrastructure necessary to make the connections and hand-offs to community providers and alternatives. Within the current model, the only entities at risk for the Model s success are the hospitals. However, success is dependent upon many other organizations, not to mention patient compliance. The cumulative savings the Model has already secured for Medicare, Medicaid and the commercial payers ensure that a reasonable update factor can be provided that will be far below the Model s spending guardrails. Moreover, approving an update that is far below inflation and that sets aside funding available only to some hospitals via an application process, means Commissioners would put at risk wage increases for workers, and the ability of hospitals to keep up with the basic costs of running a hospital, much less the investments required to improve community care and reduce utilization. A low update factor such as that proposed would cause MSMHC to undoubtedly reduce further positions, as significant cuts have already been made this year in order to fund these new initiatives. Finally, we support the MHA Fiscal Year 2017 Global Budget Update recommendation and believe it provides the commissioners specific ways to turn the HSCRC Staff s proposal from inadequate to helpful, without threatening the All Payer Model s spending limits. We would appreciate your serious consideration of this recommendation. Regards, John W. Rollins Christine R. Wray Yvette Johnson-Threat, MD Board Chairman President Vice President, Medical Affairs CC: Mike Robbins, Senior Vice President, Rate Setting, Maryland Hospital Association Michael Curran, Executive Vice President, Chief Administrative & Financial Officer, MedStar Health Kathy Talbot, Vice President, Rates & Reimbursement, MedStar Health
 and its member hospitals, Washington Adventist Hospital and Shady Grove Medical Center, we want to")
77 ,J\ Adventist f-\ HealthCare Nelson J. Sabatini Chairman, Health Services Cost Review Commission 4160 Patterson Ave. Baltimore, MD May 23,2016 Dear Chairman Sabatini: On behalf of Adventist HealthCare (AHC) and its member hospitals, Washington Adventist Hospital and Shady Grove Medical Center, we want to thank you for the opportunity to provide comment on the Draft FY 2017 Update Factor Recommendation presented at the May 11, 2016 meeting. AHC has been and continues to be committed to improving care coordination to ensure that our community receives health services and interventions in an efficient and effective manner that ultimately leads to more efficient use of healthcare dollars with improved outcomes. AHC recognizes great opportunity to gain efficiencies and generate savings through improved care coordination and the reduction of unnecessary utilization, however continued investment in programs to redesign and transform the delivery system are necessary to generate significant stakeholder engagement and alignment against a common goa/. While there is significant work going on within our hospitals to put in place processes to reduce readmissions, hospital acquired conditions and unnecessary length of stay, AHC believes that in order to achieve significant reductions in unnecessary or preventable high cost care, engagement and alignment of stakeholders across the entire care continuum, including areas outside of the health systems' direct control is necessary. Unfortunately, reimbursement models for the entire care continuum are not yet fully aligned which requires AHC to provide funding to help our provider partners that are still reimbursed on volume maintain financial stability as we engage them in our goal of improving the health of our community and ultimately driving down utilization. Additionally, even with a high level of engagement in this common goal, we see a need for continued investment to address gaps in access to primary care and preventative services for the uninsured and underinsured population in our community. We believe that addressing this gap is critical to ensuring that the health needs of this population are met to avoid unnecessary ED visits and prevention of avoidable inpatient admissions and readmissions. Below is a summary of some of the investments and programs at AHC related to improving care coordination: Physician led strategies for improving care coordination: Developed and provide continuous funding and management to a Medicare Shared Savings ACO in conjunction with many community based physicians Developed and funded a separate clinically integrated network of community physicians with the physicians co-managing this network expressly for the purpose of improving quality and lowering cost Implementation of care coordination workflow and analytics software which provides the physicians critical information to better manage high risk populations

78 AHC Infection control physician rounding at high volume referring nursing homes Contracts to better align waiver goals and provide financial support to hospital based physicians for reductions in unnecessary utilization Hospital led strategies for Improving care coordination and transitions: Implementation of electronic medical record sharing with Skilled Nursing, rehabilitation and home health providers Addition of Care Transitions nurses and case managers to ensure adequate post discharge follow-up and compliance, including in-home follow-up Implementation of telehealth monitoring and follow-up Discharge medications provided to patients at the bedside prior to discharge Enrollment of high risk medical and psychiatric patients in community based care management programs Constant and continuous engagement of senior hospital leadership and physician leadership in care coordination planning and monitoring activities. Additional resources for more robust patient discharge and outpatient education programs related to chronic disease management System Investments to provide improved access for un- and underinsured patients: Investment and continued funding for FQHC (CCI) on Washington Adventist Hospital Campus Collaboration with FQHC to provide a continuum of care to some of our most vulnerable patient populations, including screenings to ensure that our patients have access to things such as housing, childcare, transportation, food, CHIP, free and reduced school meals, utility assistance, water assistance, WIC, telephone assistance, free tax preparation, etc. that have a direct effect on an individual's health outcomes. Additional investments in primary care practices in Montgomery County Participation in multi-stakeholder collaborations to reduce avoidable utilization and provide improved care for high risk populations: Collaboration and work with all other hospitals in Montgomery County to develop NexusMontgomery, a regional partnership dedicated to developing and implementing community wide outpatient focused strategies to enhance care coordination and disease management Development of the Centers for Heath Equity and Wellness, a recognized leader within the state for research and education regarding health disparities, community health improvement and impact on the social determinants of health Under the new waiver, hospitals bear all the risk related to the model's success. In addition, almost all hospital revenues are now covered under global budget or total patient revenue caps, which removes the risk for increased hospital utilization from the system. In order for the hospitals to manage this risk while also investing in programs to continually reduce avoidable utilization, the hospitals require adequate annual updates. Without sufficient annual updates that allow for stable and reasonable margins, hospitals will be faced with difficult decisions related to cost cutting which could impede the progress of achieving the goals of the model. If the current HSCRC staff proposal is adopted, both SGMC and WAH could be subject to revenue reductions in FY 2017 (see estimate below) which places considerable strain on AHC's ability to provide adequate wages to maintain an engaged workforce and keep up with inflationary increases on basic hospital costs, much less to continually invest in care coordination, improved access to primary care and alignment of stakeholders in the care continuum at a level to achieve desired results.
79 Hospital Specific Revenue Updates: SGMC WAH Adjustment for Inflation 1.72% 1.72% Allowance for High Cost Drugs 0.00% 0.00% Net Shared Savings -0.65% -0.65% Population/Demographic Adjustment (est.) 0.52% 0.56% Quality Scaling (not final) 0.03% -0.73% Market Shift -0.92% 0.22% Uncompensated Care Funding (est.) -1.20% -3.20% Total Revenue Increase/(Decrease) -0.50% -2.08% AHC recognizes the constraints of the waiver but analyses by the HSCRC staff show that the HSCRC can provide additional update without risking the current guardrails of the model including both the per capital test and the total cost of care measure. AHC respectfully requests that the Commissioners consider the strain that suppressed update factors place on hospitals ability to invest in long term care coordination and care delivery redesign strategies that do not produce immediate financial savings to the hospital but are required to achieve material reductions in avoidable utilization over a longer period oftime. We support MHA's Fiscal Year 2017 Global Budget Update recommendation. We want to thank you again for the opportunity to provide you with more information regarding the many initiatives related at AHC intended to transform care delivery to provide more efficient and cost-effective care. We hope that the this letter conveys that AHC is fully committed to the care transformation goals of the all-payer model while also providing you with information to support MHA's Update recommendation. Sincerely, Terry Forde President & CEO Adventist Hea/thCare James G. Lee Executive Vice President & CFO Adventist Hea/thCare
80 JOHNS HOPKINS MED I C I NE May 23,2016 JOHNS HOPK I NS HEALTH SYSTEM Nelson J. Sabatini, Chairman Health Services Cost Review Commission 4160 Patterson Avenue Baltimore, MD Dear Mr. Sabatini: The purpose of this letter is to provide Johns Hopkins Health System's comments on the staffs recommendation on the update factor for FY2017. We appreciate the opportunity to provide comments. JHHS has always supported Maryland's All Payer System with its improved equity for Maryland patients and for the access it has provided by funding the social costs of providing hospitals services in the State. We continue to support the system as it has transformed into the Hospital All Payer Model with CMMI, with its new emphasis on population health. We believe that this is the right path to improve the quality of care for patients and to align payments with improved population health efforts. Recognized Successes We have completed the first two years of the model and the system has generated Medicare savings well ahead of those scheduled in the model agreement with CMMI. The system has also delivered per capita hospital spending well below the 3.58% all payer limit established under the agreement. While this performance is extraordinary, we must take time to consider the broader question of system needs. Hospitals are being asked to fund a number of population health initiatives and their related infrastructure as well as the routine costs of operation such as wages, medical supplies, drugs and capital costs. Funding that was once generated through hospital volume is no longer available under the new model. To fund these expenses and generate margins to maintain our mission, the FY 2017 update factor needs to be a minimum of 2.49% to fund projected inflation for the upcoming fiscal year. Funding Other Investments Achieving our tripartite mission of patient care, teaching and research (and meeting the requirements of the Waiver) requires transformation of the systems, technology, behavior and performance of our large health care system. Such a transformation requires an enormous investment of resources, time and comprehensive population health solutions. There is evidence that some population health methodologies are cost effective and can achieve both a clinical and financial return. But there is much to be learned about which programs achieve the desired clinical outcomes and justify the large expense over the long term. Thus, innovation and experimentation in care delivery will be critical to our long term success. Moreover, we do not know the effects these changes in care delivery will have on the immediate health of Maryland's residents. This is of the utmost

81 importance and must be carefully measured and monitored. Moving too fast may have unintended consequences and adverse effects on patients and providers. While we believe these efforts are worthwhile and can ultimately improve care for Maryland patients, we must use this opportunity to voice our concern over the update factor for FY2017 recommended by the staff. While the Commission has included money for population health initiatives, the amounts have been limited - and the funds have been designated for specific purposes with corresponding expenses, not for patient care expenses. Hospitals are expected to fund clinical innovation, new information technology, and infrastructure improvements to support population health initiatives. These needs have to be funded along with wage increases for our employees, capital replacement to maintain our facilities, rising drug and supply costs, true medical innovation and breakthroughs, higher severity cases only treatable at research based AMCs, and real use rate growth associated with an aging population in areas such as oncology, orthopedics and others. If an appropriate level of funding is not provided hospitals will need to evaluate the financial viability of clinical programs that the population currently has access to. Efforts to Reduce Potentially Avoidable Utilization JHHS is actively working within this new system to transform the care we deliver. We are working hard to reduce potentially avoidable utilization (PAU) and we are making significant investments in population health programs that are designed to improve quality, safety and efficiency of care and to assure success of the Waiver (more detail by hospital is provided below). The results of most of these initiatives will be realized years from now as the population changes behavior over different generations. However the system assumes that financial results will be realized immediately to fund necessary operating expenses. The Johns Hopkins Health System - Summary of Strategic Hospital Transformation Plans The Johns Hopkins Health System Academic Division Overview and Outcomes The Johns Hopkins Hospital The Johns Hopkins Bayview Medical Center In December of 2009, a Johns Hopkins health system wide taskforce was created to begin to transform acute patient care delivery in order to achieve the "triple aim" of "better health, better care and lower cost." The recommendations from this taskforce were translated into the JHHS "care coordination bundle" informed by CMS demonstration projects and emerging evidence that individual interventions targeting a single aspect of care delivery tended to have limited impact on utilization rates, and that bundled interventions fostering coordinated care processes may have significant impact on care delivery, quality outcomes, and utilization. The implementation of these strategies began in earnest in April of 2011 with the initiation of pilot units across all of the JHHS entities. The targeted populations for intervention were ALL hospitalized patients and vulnerable Medicare and Medicaid patients from the 7 zip codes surrounding the East Baltimore and Bayview Campuses. Over the 3 years since work began, the JHH and JHBMC care coordination bundles were expanded to include the majority of adult inpatients as well as outpatients served in the Emergency Department. The patient-centered care coordination concepts were embedded in the Johns Hopkins Medicine Strategic Plan and continue to be evaluated, modified and expanded as new evidence emerges and our own experience and outcomes analysis inform our strategies. The "bundle" addresses care coordination that transcends the inpatient setting and is focused on transitional care strategies to return patients to their optimal level of care.
82 Our experiences over the last five years in improving care delivery have yielded positive outcomes as well as helped to inform us of the challenges in implementing cross continuum care coordination processes and the identification of factors that influence the success of these strategies. Risk screening tools are highly effective, but low sensitivity requires the use of other methods to augment appropriate patient identification. Patients identified as "high risk" fit a multitude of profiles which do not necessarily suggest a specific collection of chronic conditions, socio-economic disparities, or payer, but reflect other variables not easily measured by severity of illness or other indicators available through administrative data. The definition of what constitutes "high risk" is critical in determining appropriate interventions at the right juncture in the health illness continuum. The current literature expands on the concept that the characteristics of patients most at risk for increased utilization include such factors as patient activation and healthcare literacy, social support at home, functional status as well as type and amount of disease burden. The Johns Hopkins Hospital - Early Outcomes and Strategic Objectives From FY , of the 44,376 JHH eligible adult discharges, almost 40% received a high intense care coordination intervention in addition to the standard care coordination bundle for all patients. Of the patients who received high intense interventions (as identified by risk), nearly 50% were Medicare, and 18% were Medicaid or Medicaid Managed care. Two of our major strategies for post-acute follow-up include postdischarge phone calls for all patients returning home (without home care), and home visits by a Registered Nurse "Transitions Guide" for our highest risk patients. For both of these programs, adjusted data demonstrate a significant reduction in readmissions for those who received the intervention versus those who could not be reached or refused the intervention. Propensity analyses of these interventions highlight the inherent challenges in improving readmission and utilization rates at Johns Hopkins. The variables that are associated with higher readmission rates are also the same variables that predict whether a patient will be successfully reached by one of the care coordination interventions. In other words, the precise people that we want to reach with our interventions are the patients we are least likely to reach. These results highlight the importance of patient engagement in driving change. Our work in transforming patient care delivery through a model for care coordination has yielded positive results and improved clinical outcomes in numerous domains. Both internal and external (CMS) early evaluation suggests reductions in 30 day readmissions as well as total cost of care for Medicare beneficiaries in the 90-days following discharge. Strategies to increase acceptance for post-acute services and engagement to recommended follow-up plans are paramount to yield the desired outcomes of better health and lower utilization. Patient/family centered care requires the partnerships between patients/caregivers and providers to empower patients for shared decision making while acknowledging patient goals and preferences for treatment. While we have been able to successfully implement many of our targeted strategies for all hospitalized and high risk patients, many of our challenges are related to systemic processes that contribute to barriers for timely access to care, provider communication and handoffs, as well as the availability of appropriate community services for our high needs populations. Our strategic Johns Hopkins Hospital objectives are focused on the expansion of our current cross continuum care coordination model and addressing the major systemic barriers impeding our progress. These include the following. Access to Urgent Care: Provide alternatives to ED visits and/or hospitalization for the provision of services to address acute healthcare needs, bridging the service gap between the Medical Home and the Hospital.
83 Care Coordination Across the Continuum: Include care coordination services as a core component in programs that service high risk patients, including those with multiple chronic conditions, mental illness and addictions across the continuum of care. Patient/family Engagement: Enhance strategies to improve patient engagement for active participation in healthcare decisions and self-care management. The Johns Hopkins Bayview Medical Center - Early Outcomes and Strategic Objectives From FY , ofthe 28,133 JHBMC eligible adult discharges, 48% received a high intense care coordination intervention in addition to the standard care coordination bundle for all patients. Of the patients who received high intense interventions (as identified by risk), 62% were Medicare, and 18% were Medicaid or Medicaid Managed care. Two of our major strategies for post-acute follow-up include post-discharge phone calls for all patients returning home (without home care), and home visits by a Registered Nurse "Transitions Guide" for our highest risk patients. For both of these programs, adjusted data demonstrate a significant reduction in readmissions for those who received the intervention versus those who could not be reached or refused the intervention. Propensity analyses of these interventions highlight the inherent challenges in improving readmission and utilization rates at JHHS. The variables that are associated with higher readmission rates are also the same variables that predict whether a patient will be successfully reached by one of the care coordination interventions. In other words, the precise people that we want to reach with our interventions are the patients we are least likely to reach. These results highlight the importance of patient engagement in driving change. The most recent JHBMC Community Health Needs Assessment identifies the health needs of our community as: Adult and childhood obesity; Addiction and mental health problems in adults and children; the sequelae of chronic illness; and access to care for Spanish and non-english speaking individuals. These problems are clear in our work on hospital readmissions and ED utilization where patients with heart failure, COPD, diabetes, heart disease, addictions and mental illness are those most often readmitted to the medical center. The JBMC leadership has incorporated our learning from our readmissions work, the evidence from the CHNA and the guidance from Healthy Baltimore to create the strategic plan for transformation summarized below. Our work in transforming patient care delivery through a model for care coordination has yielded positive results and improved clinical outcomes in numerous domains. Both internal and external (CMS) early evaluation has demonstrated a statistically significant decrease in 30 day readmissions as well as total cost of care for Medicare beneficiaries in the go-days following discharge. Building on this success, JHBMC will continue to redesign care delivery systems to improve accessibility, to foster patient and family engagement, and to build on current and future partnerships with community organizations to meet the needs of our patient population. The JHBMC strategies support these three areas of transformation. Access to Care: Improving access to primary care, specialty care, and urgent care. Particularly, for patients and families with high risk, chronic illness, including addictions and mental health. Care Coordination Across the Continuum: Includes focusing on patients with high-risk conditions and deploying strategies for patient/family engagement and care. Quality and Efficiency: Improving quality and efficiency of inpatient, outpatient and emergency department care through implementation and monitoring of clinical best practices for high risk populations.
84 Howard County General Hospital - Strategic Objectives The Maryland Waiver presents hospitals with a glide-path for change to realize health system transformation. Howard County General Hospital (HCGH) is committed to developing the Howard County Regional Partnership (HCRP) as the primary vehicle to coordinate efforts that improve the care delivery system and improve population health for our community. Improve care coordination to ensure seamless transitions between care settings and better manage patients' complex needs, focusing in particular on post-acute care coordination and processes to connect patients with multiple chronic conditions and significant social determinants to communitybased resources and programs. Develop data analytics infrastructure to support population health goals as outlined by the HCRP and provide real-time decision support for providers. Ultimately, we want to be able to proactively manage the health of the community instead of waiting for hospital utilization to intervene. Involve primary care providers in the development and execution of a specific action plan to create an effective continuum that ensures access to care in the most appropriate setting. As HCRP focuses initially on a pathway for provider referrals to a community-based care coordination intervention for high-risk Medicare beneficiaries, the hospital wi" work with primary care practices to determine the top two to three projects that need to happen in calendar years 2016 and 2017 to achieve better provider alignment. Improve access to urgent care mental health services. There are several gaps in the care continuum for behavioral health here in Howard County. This has been identified not only by our community health needs assessment but also by our Local Health Improvement Coalition as we" as by a recent Howard County Behavioral Health Task Force. One such gap is a lack of access to urgent care mental health services. HCGH, with support from the Horizon Foundation, partnered with Way Station, Inc. to pilot a rapid access program. The pilot runs from September 1, 2015 through August 31, Although initially a short term investment, we wi" evaluate the program's effectiveness in order to determine what longer term investments are needed. Suburban Hospital- Strategic Objectives Suburban Hospital supports the CMMI and HSCRC efforts at healthcare transformation. Achieving these goals is essential to the success of the a" payer system and a commitment that wi" permeate throughout our hospital culture. Our goals include: Coordinating care across the continuum in a structured, organized and efficient manner, Aligning hospital based and community practicing physicians to support the needs of patients with chronic conditions and high utilization, and; Strengthening patient education processes to provide relevant on time information to change patient's behavior and improve post-hospitalization compliance and potentially avoidable utilization. The A" Payer Model has offered an innovative approach to addressing problems that we faced under the old waiver model and has placed Maryland hospitals at the center of national efforts to transform the delivery system. We continue to support these efforts while noting that we are working in large complex organizations that require time to change. After only two full years of the model, we have made remarkable progress, and that progress can continue if we work together with a balanced funding approach. We appreciate the opportunity to comment on the staff recommendation.
85 Sincerely, 'Sr. VP and CFO, Johns Hopkins Medicine and CFO of Johns Hopkins School 0/ Medicine C --'-L flzl/-fkit1d~ Carl Francloli CFO, Johns Hopkins Bayview Medical Center Marty Basso CFO, Suburban Hospital and Sibley Memorial Hospital Cc: Nelson J. Sabatini, Chairman Herbert S. Wong, Ph.D., Vice-Chairman Victoria (Tori) W. Bayless George H. Bone, M.D. John M. Colmers Stephen F. Jencks, M.D., M.P.H. Jack C. Keane Donna Kinzer
86 Calvert Memorial Hospital Tradition. Qudity. Progress. May 24, 2016 Nelson J. Sabatini Chainnan, Health Services Cost Review Commission 4160 Patterson Avenue Baltimore, MD Chainnan Sabatini: I am writing on behalf of Calvert Memorial Hospital in Calvert County, Maryland. The proposed rate update for FY 2017 from the HSCRC will undennine our hospital's ability to continue the groundbreaking work we've undertaken to ineet the care transfonnation goals of the all-payor model and it will threaten our ability to meet our operating plan without significant cuts to wages, quality improvement initiatives and critical technology. We urge you to consider the MHA Fiscal Year 2017 Global Budget Update recommendation. At Calvert, we have wholeheartedly embraced the goals of better managing chronically ill, highrisk patients and reducing potentially avoidable readmissions. In fact, in 2015, Calvert Memorial Hospital had the second lowest readmission rate in the State of Maryland. We largely attribute this achievement to our investments in community outreach, chronic disease management and wellness. Since FYll: Calvert has spent $13.5 million in programs aimed at improving the health and wellness of our community. A key part of our chronic disease and readmission reduction program is the "Calvert Cares" initiative - a multi-faceted outreach program focused on the identification and proactive management of patients at the highest risk for readmission. Since the program's inception in the first quarter of 2014, we have leveraged case managers, social workers, physicians and pharmacists to coordinate tlie care of these vulnerable patients outside the hospital setting. In the first year of the program, we saw a 30 percent reduction in nursing home patient readmissions, a 27 percent reduction in Medicare patient readmissions and a 38 percent reduction in all cause readmissions. In 2016, the program was recognized as a leading edge initiative by the Maryland Patient Safety Center with a poster display at the Maryland Patient Safety Conference. All the services provided under this program are free of charge and offered as a community benefit with a goal of improving patient outcomes and reducing overall healthcare costs. This year, we had hoped to expand the program's success to a larger group of at-risk patients, potentially contributing to an even larger reduction in avoidable health care utilization. We applied for the HSCRC regional grant which would have covered the cost of this expansion, but we were not approved for the funds. Now, news of the proposed update factor will force us to 100 HOSPITALROAD PRINCE FREDERICK. MD TDD
87 not only eliminate the expansion of the program, but to consider cuts to the existing program which is showing so much promise. It is heartbreaking to have to eliminate important population health initiatives that are showing great progress at a time when Maryland hospitals are being asked to work with community partners to reduce the overall healthcare spending. It is. frustrating to have achieved great success in a program that other hospitals are trying to emulate, only to have the funding removed from our budget and re-directed to other select hospitals through a grant process. In addition, the update factor as it stands will make it impossible for us to meet our operating budget requirements without eliminating a wage increase for our employees or reducing spending on other critical quality initiatives. As the second largest employer in Calvert County, a freeze on wages has a ripple effect throughout our community. We strongly believe that the proposed update factors will adversely affect the work already being done in our community to meet the goals of the Medicare Waiver program and we support the Maryland Hospital Association's assessment that a higher update can be provided without encroaching on the staff-recommended total cost of care cushion. We feel that the reduced update factors over the last two years has benefitted the payors in an inequitable fashion and that update factors of less than 2 percent fall woefully short of the 3.58 percent target that was agreed upon by the payors and the hospital industry. We urge the Commission to reconsider the proposed update and adopt the MHA Fiscal Year 2017 Global Budget' Update recommendations. This investment will allow Maryland hospitals like ours to continue to fund the types of innovative programs that will reduce costs for all Marylanders over the long term. Respectfully, /J 7~~ r-) ~~ \ J-~ Henry Trentman, Chairperson Dean Teague FACHE Robert Kertis Board of Directors President and CEO CFO & V.P. of Finance Cc: Herbert S. Wong, Ph.D., Vice Chairman Victoria W. Bayless George H. Bone, M.D. John M. Colmers Stephen F. Jencks, M.D., M.P.H. Jack C. Keane Donna Kinzer, Executive Director
, we are writing to")
88 May 24, 2016 Nelson J. Sabatini, Chairman Health Services Cost Review Commission 4160 Patterson Avenue Baltimore, MD Dear Chairman Sabatini: On behalf of the Western Maryland Health System (WMHS), we are writing to provide our perspective on the proposed FY2017 global budget update for hospitals and the impact it will have on our continued efforts to improve the health and well being of the communities we serve. For the past six years, we have embraced the components of value-based care and have seen dramatic improvements in the clinical outcomes and health status of the patients we serve. There are many valuebased care delivery initiatives that we have implemented since moving to the Total Patient Revenue payment methodology in 2010 and a sampling of these initiatives is attached. Although the journey continues, we have significantly reduced unnecessary admissions, readmissions, Emergency Department visits, observation visits and ancillary utilization. In addition, our performance metrics have improved with WMHS receiving the highest reward in 2015 for PPC compliance. However, it is becoming increasingly more difficult to sustain these improvements and further enhance the health our patients. A study by the University of Wisconsin Public Health Institute indicates that only 20 percent of health outcomes can be attributed to clinical care. Health behaviors account for 30 percent and social determinants make up the remaining 50 percent. In order for hospitals to make lasting changes to improve community health, we must continue to invest in initiatives to encourage healthy lifestyles and address social issues. This is especially true in Allegany County, which is one of the poorest counties in Maryland and has extremely high rates of co-morbidities, including obesity, diabetes, and high blood pressure. Continued investment in support services and education is essential to change health behavior. Although there has been a decrease in avoidable utilization of hospital services among high-risk patients, additional patients need education about how to manage their chronic conditions to reduce their reliance on hospital care. In many cases, these are the family members of our current high-risk patients. We also need to invest in changing the behaviors of the community at large to improve health and reduce utilization for the long term Willowbrook Road Telephone: Cumberland, MD Website:

89 Western Maryland Health System 2 May 24, 2016 Socioeconomic factors create barriers for many of our patients and there are limited programs to benefit the poor and disenfranchised in our rural community. In recent years, WMHS has become the safety net for our region. WMHS has been using our savings under TPR to better address the many social and health needs that contribute to higher utilization of services by our patients. WMHS also provides leadership for many community-based programs to address poverty, eliminate barriers and improve overall health. WMHS is part of the Trivergent Health Alliance, along with Meritus Medical Center in Hagerstown and Frederick Memorial Hospital. With the recently awarded Regional Care Transformation Grant from the HSCRC, the Trivergent hospitals can reach approximately 500,000 people in our three counties to enhance care delivery and improve overall health. We will be able to take our care delivery model to the next level and reach our patients in their homes, homeless shelters, low-income housing units, and other non-traditional sites of care. Sufficient global funding for FY 2017 is needed to support these new initiatives and maintain our existing programs. The changes we have implemented over the past six years are having a profound impact on the health and well being of the patients we serve. Continued investment in these initiatives is critical to continuing this success. Without adequate global budget funding, we project a $4 million budget shortfall, which will impact the staffing and support needed to maintain our new care delivery model. In addition, our fiscal health continues to be impacted by the high incidence of cancer among western Maryland residents and drug affordability. The skyrocketing cost of new bio-pharmaceutical agents continues to be a fiscal barrier to providing the best care and treatment for these patients. We support MHA s recommendations for the Fiscal Year 2017 global budget updates and encourage you to provide a reasonable update for all Maryland hospitals so that we can continue to improve the health of the patients we serve and lower the overall cost of providing care. Thank you. Sincerely, Barry P. Ronan President and CEO Nancy D. Adams, RN Senior Vice President, Chief Operating Officer/Chief Nurse Executive Kimberly S. Repac Senior Vice President Chief Financial Officer Gerald Goldstein, MD Senior Vice President, Chief Medical Officer CC HSCRC Commissioners
90 Western Maryland Health System Value- Based Care Delivery Initiatives Inpatient admissions are down 25 percent from FY2011. Expanded care coordination efforts have reduced readmissions by 17 percent since o Expanded care coordination 24/7, including in the Emergency Department o Initiated Med- Start so post- charge medications are delivered to the bedside before patient leaves WMHS o Every readmission is subjected to a root cause analysis- like review to determine factors causing the readmission and how to avoid recurrence o Developed the Transitional Care Clinic to ensure all high- risk patients receive follow- up care within 5 days of discharge when their PCP is unable to see them High- risk patients who use the Center for Clinical Resources to manage their diabetes, congestive heart failure, lung disease and/or anticoagulation medications have experienced lower utilization of hospital services, resulting in a cost savings/avoidance of more than $7 million in two years. Case management for behavioral patients has reduced the inpatient admissions by 9.8 percent and readmissions by 46 percent over the past four years. Care coordination for hemodialysis patients with End- Stage Renal Disease to address all the patient s needs across the continuum has reduced readmissions by 67 percent over the past four years. Collaborative efforts with skilled nursing facilities to reduce readmissions by 30 percent o Host bi- monthly Partnership to Perfection meetings to address mutual topics o Implemented SNF Transitionist position in Care Coordination to facilitate better transitions from hospital to SNF o Developed the SNFist program that puts a physician and CRNP s onsite daily at 3 SNF s o Began medication delivery to SNF s for residents being discharged from WMHS Community Care Coordination with RNs and social workers placed in physician offices to address patient needs referrals, transportation, education, emotional support, assistance with obtaining medical equipment and supplies and addressing basic social needs. Leadership role in Making Healthy Choices Easy, a community- based wellness coalition, has resulted in community fitness challenges and work- site wellness programs. Community garden started in 2015 to for low- income families to grow fresh fruits and vegetables. Five additional gardens are now underway in 2016.
91 TIC G E NERAL H OSP IT AL care.glvers May 24,2016 Nelson J. Sabatini, Chair Health Services Cost Review Commission 4160 Patterson Avenue Baltimore, MD RE: Staff Proposal for FY 2017 for Maryland Hospitals Dear Mr. Sabatini, As you are aware, Maryland hospitals are very concerned with the HSCRC staff proposals regarding the 2017 global budgets update. The Maryland Hospital Association (MHA) has communicated to you specific state-wide financial data to support these concerns, and we will not duplicate that information in this letter. Rather, we are communicating with the HSCRC commissioners the real-life experience of Atlantic General Hospital (AGH), one of the non-baltimore-based hospitals in Maryland serving a unique rural, retirement and resort community on Maryland's Eastern Shore. AGH is the only hospital in Worcester County. AGH is a relatively small hospital from a licensed bed perspective (48 licensed beds in FY 2016), but due to the nature of our community and the way we have prepared our service delivery over the past decade, we have rate-regulated revenue in our GBR that exceeds $100 million annually. AGH has a higher rate-regulated outpatient to inpatient service revenue ratio than any other hospital in Maryland. Part of this is due to the fact that we serve a thriving resort industry, accommodating approximately 39,000 annual eme rgency room visits (approximately 1/3 of which is directly attributable to resort visitors). We have developed a robust outpatient service delivery system, creating close relationships with our community physicians so that their patients are cared for in a very efficient and personal manner in our community. The AGH Board oftrustees, Medical Staff, and Leadership Team have taken seriously the Maryland commitment to the GBR and the tenets ofthe newall-payer system. We were a fi rst adopter ofthe patient-centered medical home (PCMH) in Maryland. We were one ofthe first hospitals in Maryland to Atlantic General Hospital 9733 Healthway Drive Berlin, Maryland TEL:
92 participate in a Medicare Shared Savings Program (MSSP) Accountable Care Organization (ACO), and the first on the Eastern Shore. AGH was one of the first three telemedicine grant awardees by the Maryland Health Care Commission (MHCC) in These are just a few examples of how AGH has invested in adopting the service delivery changes necessary to achieve the goals of the GBR system. What has been the results of these investments, and our operational commitment to the goals ofthe GBR program? In the base period of the GBR system, AGH was already at or below the statewide means for most measures. In the most recent quality data that is being utilized by the HSCRC to influence the 2017 rates (MHAC scaling, readmission scaling, QBR scaling comparing 2015 results with 2014 results), AGH far exceeded the statewide average overall scaling (AGH = 1.68% versus State = 0.19%). AGH was by far the top performer in reducing Medicare unadjusted readmission rates during this measurement period, lowering readmissions by % versus the state average reduction of -3.09% (the next best reduction rate in the state was %). With the intentional focus by the Board, Medical Staff and Leadership, AGH has fully demonstrated its commitment to achieving the IItriple aim ll goals ofthe GBR system in the community for which we are held responsible. With the improvements made in the cost of care delivered by hospitals in Maryland in the first two years of the demonstration project, we have already saved Medicare approximately $257 million when our two-year goal was $49.5 million. Again, the data suggests that Maryland hospitals are living up to their commitment to this process. Since we regularly monitor our performance in the measurement system described to us by the HSCRC, and we monitor the statewide performance, we fully expected positive scaling overall to our projected FY 2017 rates. To our surprise and disappointment, the HSCRC staff created a new liadjustment" to add to the quality scaling program -the Potentially Avoidable Utilization Savings Policy (PAU). With this new, heretofore unknown and unexpected -1.25% liadjustment", AGH will be receiving a negative quality adjustment of -0.18%. Where deserved rewards for investment in community-based initiatives to achieve the objectives established in advance by the HSCRC were expected as a IIreturn on investment", to put it metaphorically, Lucy has once again pulled the football away from Charlie Brown. Maryland's unique all-payer system is only viable when all of the parties are committed to a fair, mutually agreed upon process for healthcare delivery and financial support for quality care. Just as the HSCRC desires IIpredictability" in the costs for the delivery of healthcare services for the state, the Maryland hospitals desire similar predictability in the resources they will have available to support the care delivery in the communities they serve. The delivery of sudden, draconian policies based upon future concerns that are not being borne out by the actual data will erode the support of the community-based Boards of Trustees and Medical Staffs that are vital to the success of the community hospitals and the Maryland demonstration project. On behalf of AGH and community hospitals in Maryland, we request the HSCRC not adopt the newly proposed PAU policy for FY 2017, allowing for deeper analysis and further actual data to support a fair application of the policy. ;;~~ :icz;:za: ---- President/CEO
93 ~EDERICK REG IONAL HEALTH SYSTEM May 24, 2016 Nelson J. Sabatini Chairman, Health Services Cost Review Commission 4160 Patterson Avenue Baltimore, MD Dear Chairman Sabatini: Frederick Memorial Hospital has been very supportive of the recent mandates to elevate the healthcare delivery system in Maryland. Transforming the health care delivery system is a difficult task and requires reconfiguring the clinical delivery system and supporting infrastructure. In this new environment, the Global Budget Reimbursement (GBR) system has been crucial to allowing quality improvements and efficiencies to be implemented without threatening the financial stability of the overall health system. More time is needed though, to continue the journey. It is for this reason that, we are prompted to write this letter. Prior to the implementation of GBR, FMH began investing in quality and care management initiatives, with good quality results; albeit with significant negative impact to operating results. However, under GBR, key funding has been provided for infrastructure and population health measures addressing some of the potential concern over sustainability. The other key success factor has been a reasonable Update Factor to support continuing the investment in the people and programs that support the overall care transition. FMH investments to date have been focused on reducing overall hospital utilization and readmissions, potentially avoidable utilization, and improving the care continuum for patients with chronic disease. The improvement as a result of the investment in Care Management and related activities have resulted in FMH being in the top 5 hospitals with the lowest readmission rate in Maryland at 10.97%, compared to a statewide average of 12.5% for CY15. FMH has also made improvements in MHAC's (Maryland Hospital Acquired Conditions) for CY15 in excess of 20%. To influence the behavior of many of our sickest (or neediest or chronically ill or most complex) patients we have reached out to them in many dimensions. Specifically, these are some of the major initiative we have implemented: 400 West Seventh Street Frederick, Maryland
94 Hired and assigned Care Managers to chronic care patients to assist in their care management Embedded Care Managers in 13 primary care offices. Hired Care Managers to work with patients in the Emergency Department for proactive management of care coordination and education on community resources. Hired Pharmacists to work with patients to improve their understanding of appropriate medication management in the Emergency Department, upon discharge, and at home. Implemented a Care Clinic for patients without a PCP to access a follow up appointment with an advance practice nurse post discharge and provide access for individuals with chronic conditions to a multidisciplinary team of clinicians. Contracted with physicians to work with patients in their home to manage their chronic health needs. Engaged The Coordinating Center and Potomac Case Management (Behavioral Health) to provide care management to high risk individuals. Provided telemonitoring capabilities for home bound patients. Launched a community wide Advance Directive initiative, with over 40 community education events, reaching over 1,800 individuals. Currently, 98% of our inpatients who request AD information receive it while in the hospital. Developed relationship with the Skilled Nursing Facilities in our area and implemented a dashboard for quality/costs. This information is used to provide a preferred list for referrals based on quality criteria. Held several Lay Health Educator programs with multi~cultural communities to enable the graduates of the program to provide health education in their community Formed Trivergent Health Alliance with Meritus Health and Western Maryland Health System with the mission to improve population health in our communities. Trivergent submitted and received approval for the Regional Transformation Grant. We believe that proposed inflation adjustment will impair the hospital's ability to provide reasonable wages to our employees and continue enhancements to the current programs that are directly improving the waiver metrics. In addition, the industry is experiencing unprecedented increases in the costs of drugs. In order to continue to the progress that has been made to date, we urge the HSCRC to continue to provide resources to the hospital via a reasonable update factor. The hospital industry has performed well under this new system and can continue to do so with realistic investment. The Maryland Hospital Association has proposed a reasonable alternative to the staff~recommended global budget update. FMH supports the MHA recommendations that were reviewed at the most recent HSCRC Payment Model Work Group.
95 We look forward to more discussion on this important issue and thank you for your consideration of the issues we have raised in this letter. Sincerely, ~4~j/ Thomas A. Kleinhanzl Chief Executive Officer Michelle K Mahan Chief Financial Officer cc: Herbert S. Wong, Ph.D., Vice~Chairman Victoria (Tori) W. Bayless George H. Bone, M.D. John M. Colmers Stephen F.Jencks, M.D., M.P.H. Jack C. Keane Donna Kinzer, Executive Director Mike Robbins, MHA, Senior Vice President
96 ~ LIFEBRIDGE H E A L T H. Sinai Hospital Northwest Hospital Carroll Hospital levindale Hebrew Geriatric Center and Hospital May 25,2016 Nelson J. Sabatini Ch airman, Health Services Cost Review Commission 4160 Patterson Ave. Baltimore, MD We write to you to express our co ncerns over the proposed Global Budget update for FY 17. Life Bridge Health is facing a rate change well below inflation. Th is rate change and the growing levels of commerci al payor payment denials will make it exceptionally challenging to maintain and expand our investments in care and infrastructure that address the total cost of healthcare for our citizens. We have made significant progress in reducing: potentially avoidable utilization, readmissions, and unnecessary testing. We have expanded care coordination, community partnerships and collaboration across the continuum. These endeavors have and do requi re commitment of staff, resources and technology. With the proposed rate changes, we will be unable to devote what is required to continue and grow these initiatives. Some of the areas of where we have made significant progress to date include: Developing collaborative relationships wit h community agencies in Baltimore City and the surrounding counties and partnerships with Health Departments to support the health objectives and social determinant infrastructure in these communities. We have created effective programs and outcomes by providing care to our patients in our facilities and in their homes through a community health worker model. We have leveraged our existing programs and personnel to develop and implement programs to improve the management of the high risk, high utilizer patients. These programs focus on managing to better outcomes, improving access to primary ca re and subspecialty disease management, providing social services support, facilitating transition of patients to a primary care medical home and engaging patients in understanding and accessing their health information in support of improved selfmanagement. We have placed significant emph asis on bolstering inpatient and ED care management services and on building an aligned care transitions program using HomeCare and Post-Acute Physician Partners, while adding new care navigation and social work positions. We have improved follow-up care for patients after an inpatient stay or ED visit to include primary care provider connections and a wide array of soci al services. We have developed disease management programs to support transitions of care for the highest risk patients (COPD, CHF, and Diabetes) and increased access to primary care through partnerships with Federally-Qualified Health Centers and Caring for Our Communities Together 2401 W Belvedere Ave I Baltimore, MD

97 Nelson J. Sabatini May 25,2016 Page 2 of 3 community clinics. We continue to enhance internal infrastructure to support behavioral health and expand our palliative care program. This multi-faceted strategy has necessitated a substantial investment in IT infrastructure to develop and manage the data components of all of the quality metrics needed to support population health, the PCMH model, NCQA requirements and the ACO's in our system. This infrastructure will provide disease registry information attributable by provider and will expand to perform analytics as well as serve as a system health information exchange (HIE). In every program and initiative we are committed to developing measurable goals, measures of success, and to re-evaluating outcomes, as they impact the three elements of the Triple Aim, in order to improve the health of our communities and reduce the total cost of healthcare. LifeBridge Health has been refining its patient-centered continuum of care to address avoidable hospital utilization. This has been and continues to be accomplished by improving access to primary care and chronic health care clinics and segmenting the population by risk level to provide targeted care models and goals. At the heart of this approach are clinically integrated networks using team-based care models that include care navigators and social workers in addition to multi-disciplinary teams of clinicians, ensuring the maximum level of care using the lowest-cost provider, and tracking success through measurable, evidence-based, pre-determined metrics. We have established and invested in our clinical call center to ensure comprehensive, seamless care coordination for patients with a focus on reducing preventable hospital utilization for "high-utilizers" across our four acute care hospitals and in partnership with other hospitals around the state. This clinical call center also assists our outpatient pharmacy with Free Home Prescription Delivery, Bedside Delivery, Employee Prescriptions and ED prescription pick-up & drop-off window We have implemented our technology platform for population health management. This long-term IT solution for Population Health Management that is EMR-agnostic, integrates with CRISP and other state-level solutions and provides or will provide: 1) clinical decision support at the point of care supporting evidencebased best practices, 2) attribution and risk stratification for focused populations, 3) patient engagement, 4) analytics, reporting, and performance tracking including scorecards that track provider, provider group, hospital, and system population health interventions and measures, and 5) actionable registries for improved clinical outcomes (Diabetes, CHF and Adult Wellness registries, as well as IVD/CAD, Asthma, Hypertension, COPD, Atrial Fibrillation, Depression, Maternity Health, Pediatric Wellness, Senior Wellness). Our investment in Palliative Medicine means a team now exists of a Medical Director, LCSW Coordinator, Nurse Practitioners and other clinicians. They provide services that include consultative assistance for patients with end of life situations or conditions with chronic deterioration, symptom and pain management, family support, referrals to home care, hospice and assisted living facilities. The Palliative Medicine team facilitates directional change for appropriate use of resources for better comfort care and avoidance of
98 ~ SAINT AGNES HOSPITAL May 25,2016 Nelson Sabatini Chairman Health Services Cost Review Commission 4160 Patterson Ave Baltimore, MD RE: Comments on HSCRC staff's Draft Recommendation of FY 2017 Update Factor Dear Mr. Sabatini, Saint Agnes Healthcare welcomes this opportunity to provide comments on the HSCRC staff's Draft Recommendation for the Update to Hospital Rates for the Fiscal Year Ending Saint Agnes is committed to the care transformation goals of the all-payer model and believes that the innovative care delivery and care coordination work being done by Maryland hospitals is the reason for the success experienced under the new waiver agreement. However, with hospitals now fully at-risk under the global revenue model, a reasonable update to hospital rates is critical to our ability to keep up with basic operating costs, including much needed wage increases for workers and investment in equipment and infrastructure replacement. HSCRC staff's recommendation for the annual update (shown in the table below for Saint Agnes) is far below factor cost inflation needed to maintain these basic costs much less fund the continued investments to improve community care and reduce utilization. Staff's Proposed Update Factor for Saint Agnes Adjustment for Inflation Allowance for High cost new drugs Gross Inflation Allowance PAU Shared Savings Offset Net provided for inflation Inflation (Global Budget Insights) Shortfall in Funding for Inflation 1.72% 0.20% 1.92% -1.09% 0.83% 2.49% -1.66% Simply stated, it could mean the reduction and/or closure of hospital services and impact access to care. 900 CATON AV ENUE, BALTIMORE, MARYLAND TEL mcenhs.ta<?~
99 Potentially Avoidable Utilization Initiatives Saint Agnes is committed to improving the health of its patients including the underserved residents of West Baltimore - a community challenged with numerous socio-economic barriers as they strive to become healthier. Below are some of the initiatives Saint Agnes has undertaken as it works to reduce avoidable utilization and strengthen the health of the community it serves. Creation of the HealthLink program in partnership with Health Care Access Maryland (HCAM) to provide enhanced care coordination for high cost, high need patients. Deployed relationship with The Coordinating Center via West Baltimore Care (HEZ) to provide community-based care coordination services for West Baltimore HEZ patients. Formation of the High Utilizer Task Force charged with creating shared care plans for community providers via CRISP for over 100 high need, high cost patients. Development of a Comprehensive Care Center for high need and rising risk acute patients without access to adequate primary care. Care coordination and provider alignment initiatives such as these come with a substantial financial investment and take time to realize the full impact. A hospital rate update that is far below inflation may disrupt their progress or unseat the programs altogether. Potentially Avoidable Utilization Savings Adjustment Included in staffs draft recommendation of the update factor is a sizeable increase in the shared savings reduction. On a statewide basis, the proposed savings reduction increases from $89.3m in FY 16 to $193.4 in FY 17 which represents a 217% increase over the prior year. The increase for Saint Agnes specifically is $4.5 million and represents a 281% increase over the prior year adjustment. For the past three years, each hospital's contribution to the savings reduction was based on its case-mix adjusted inpatient readmission rates. HSCRC staff is now proposing to expand the savings by focusing the program more broadly on PAU which also includes the AHRO Prevention Ouality Indicators (POls). The POI measure was developed and validated to monitor how health care systems that include community-based physicians are managing ambulatory sensitive conditions for a given population. This is not an appropriate individual hospital measure for two reasons: 1) Differences in hospital specialization threaten the validity of the measure - A hospital with a higher mix of medicine cases (vs. surgical cases) will have a higher POI score. Logically then, a hospital with a higher mix of surgical cases, and a lower POI score, is not necessarily delivering better outcomes by managing patients with ambulatory sensitive conditions in the community. 2) Differences in the socio-economic status of populations served by hospitals threaten the validity of the measure - Currently, POI measures are adjusted only for age and sex of patients. It is well documented that poorer populations have higher rates of admission to the hospital for ambulatory sensitive conditions than wealthier populations. In the application of the savings adjustment, staff provides protection for hospitals with Medicaid encounters in the top quartile
100 of the state. However, this protection falls short of a comprehensive socio-economic risk adjustment that should be applied to all Maryland hospitals. The proposed changes to the shared savings adjustment will, in effect, remove the very funding that we need to invest in potentially avoidable utilization reduction and maintain the savings secured in the first two years of the waiver model. The cumulative savings already secured for Medicare, Medicaid and commercial payers ensure that a reasonable update can be provided that will be far below the model's spending guardrails. The Maryland Hospital Association (MHA) has submitted an alternative rate update recommendation for consideration, which is more reflective of the issues mentioned above. Saint Agnes fully supports the MHA Fiscal Year 2017 hospital rate update recommendation. Thank you for this opportunity to provide these comments. Si~ Keith Vander Kolk Health System President & CEO, Baltimore Cc: Herbert S. Wong, PhD., Vice Chairman Victoria W. Bayless George H. Bone, M.D. John M. Colmers Stephen F. Jencks, M.D., M.P.H. Jack C. Keane Donna Kinzer, Executive Director Mike Robbins, MHA Sr. VP Rate Setting
101 I am writing to provide comments from Holy Cross Health's perspective on the FY17 global budget update. I know from personal experience that this is a complex, challenging decision for the Commission. For FY17, I believe the increase proposed by the Maryland Hospital Association is the minimum amount necessary to support a balanced implementation of the Maryland all-payer system. I will not repeat the points made in the MHA proposal they are clearly stated and reasonable, in my view. From the standpoint of a health system CEO, I can tell you that the cost pressure which flows from our commitment to paying a living wage to all staff (Holy Cross, as of October 1, will reach its target of an hourly minimum of $15) and the need to be competitive in the overall labor market is very significant. Making extensive investments in population health has been the focus of our very limited discretionary funds and we have implemented an extraordinary number of efforts to improve population health and avoid expensive utilization, which are summarized in an attachment to this document. We also need to invest in general clinical excellence, which is also vital to serving our communities. Resources must be found from our GBR payment update there is no other place today. From the standpoint of a member of the HSCRC's Advisory Council on the Implementation of the All-Payer System, I would reference its original recommendations (report of January 31, 2014), which the Commission has cited as very helpful. Specifically, Recommendation 2.2 states that, given the challenges hospitals face, the HSCRC should set spending targets as close to the demonstration limits as practicable. Even if the Commission accepts the MHA proposal, the three-year spending target will be 43 percent below the allowable per capita limit of the demonstration. The Staff proposal would result in a three-year cumulative target of less than half of the per capita limit. I do not believe either level meets the thrust of pages 5-7 of the Advisory Council's report but I believe we need the higher adjustment to prevent an even more negative situation. In addition to these specific comments on the FY17 update, I would like to provide a few thoughts related to the long-term future of the all-payer system. As you may know, I have been a strong supporter of the new system and served as Co-Chair of the Governor's Executive Input Group, which helped bring about a consensus on its final terms among hospitals, the State of Maryland, the payer industry and CMS. I would raise two items for your consideration: 1. The Maryland All-Payer System for hospital reimbursement cannot be measured on a Medicare only scale and then broadly "cushioned", or it will fail to meet Maryland's overall goals. A major reason the prior waiver got into difficulty was its exclusive focus on Medicare growth per inpatient admission relative to the U.S. The new waiver avoided that problem. First, it moved the compliance test to all hospital spending, measured it on a per capita basis, and set a spending target (never before accomplished) that held hospital spending increases to the level
102 of Maryland's overall economic growth. Second, the final negotiations reached a successful conclusion by making this all-payer per capita target, which was unprecedented and extremely challenging, the primary measuring stick for waiver success. It was expected that, if the per capita test were met, cumulative Medicare savings of $330 million over five years would be obtained (obviously, we are doing way better through two years). If the per capita test were met and the Medicare savings did not happen, CMS' position was that it was open to alternatives, including modifying the Medicare discount. The total Medicare spending provision and the out-of-state provisions were included to check against gross manipulation. It will be a mistake to underfund and risk long-term harm to an extremely effective all-payer program, which is far ahead of expectations, because of potential concerns in these areas. Over fifty years, healthcare spending in the U.S. has tripled its share of the overall economy. Changing that trajectory will take a generation of modifying institutional and individual behavior. However, since the start of this program, hospital spending in Maryland has succeeded in not growing its share of the overall Maryland economy. If we are able to continue to stay close to that level of performance which, I believe, will be very difficult given the rapid aging of the population, we will be perhaps the most effective demonstration ever conceived by CMS. I do not believe we should manage as though this demonstration is in a precarious position. 2. Longer term, the reimbursement system needs to move closer to being tied to capitation to match the overall thrust and target of the waiver requirements. The GBR system has been extremely effective in moving the system quickly away from fee-forservice and ensuring that Maryland has lived within the financial targets of the waiver during the first two plus years. Long term, however, it is unwieldy, inflexible and promotes micromanagement of every hospital transaction. The GBR system struggles and so far has not succeeded in having "the money follow the people", one of our original mantras established to recognize the importance of patient and payer choice in meeting the triple aim. It puts an extraordinary burden on the Commission staff, who are exceptional but cannot match up to the monitoring requirements, which grow with every additional provision. I urge the Commission to solicit ideas with a bias to move toward some form of per capita reimbursement principles for hospitals which would promote their efforts to provide great service that attracts and satisfies patients so the system can attain all of its goals while meeting the financial targets. If the final, critical measure of system success is limiting the increase in per capita expenditures, linking hospital reimbursement to its "per capitas" has great power. It would also promote less micro-management in keeping with the Advisory Council recommendation 2.6 (p.6), "Within the context of per capita growth ceilings on hospital spending, HSCRC should allow considerable flexibility for the health care sector to implement its own strategies for achieving the desired results while recognizing the importance of following evidence-based best practices and the potential value of some standardization." The Advisory Council report goes on to say that we should stress performance over detailed design standards.
103 I believe as we look ahead to Phase II, we must look to transition toward per capita payment models that unleash innovation while ensuring that we meet overall cost and quality standards. Getting this right is our number one long-term challenge. I urge a broadly consultative and collegial process as envisioned by the Advisory Council in recommendation 2.7 "The consensus of the hospital industry should have a significant weight in policy development." No one has ever come close to succeeding at what Maryland is attempting under this waiver. It will take everyone's ideas and follow through for it to have a chance for success. Thank you for the opportunity to comment. Sincerely, Kevin J. Sexton
104 Attachment: Holy Cross Health Population Health/Utilization Reduction Initiatives Holy Cross Health is engaged in a significant number of activities to reduce potentially avoidable hospital utilization and total cost of care, with particular attention to vulnerable populations including senior and uninsured residents. These initiatives include community based primary care serving mostly at risk individuals, hospital-based initiatives to improve communication and care coordination, post-discharge programs to reduce re-admissions and provider-supported self-care programs. In addition, Holy Cross, along with the other Montgomery County hospitals, is committed to implementing Nexus Montgomery as an innovative and far-reaching regional partnership. In this attachment, we will identify Holy Cross Health's extensive efforts to reduce potentially avoidable hospital utilization. But we note, we are also humbled by the challenges of achieving significant change and are troubled by the inappropriateness of hospital specific measures that are not considered within context of the patient's delivery system (especially for Kaiser Permanente patients) and the use of community-based measures to assess hospital performance. Our four health centers serve nearly 9,000 low income individuals, 84% of whom are uninsured. We provide on average 3.6 visits per patient per year, visits which would likely occur in a rate-regulated emergency department in the absence of the health centers. Our two OB-Gyn clinics provide prenatal care and deliveries to over 1,000 uninsured women each year (over 21,000 since we created the partnership with Montgomery County in 2000). Our low birthweight rates are well below the state average. We have established a primary care practice embedded in Asbury Methodist Village, a senior living community with 1,500 residents where we can promote continuity of care across multiple settings to better manage care for our patients, 80% of whom are over age 80. Improved communication among physicians enhances effective utilization management. We have partnered with Kaiser Permanente (KP) to provide in-hospital access to all of its electronic health records and a secure network for telemedicine consultations. We restructured our inpatient units to cohort KP patients so their hospital-based physicians and care managers can most effectively impact care. We are working with CareFirst to connect hospitalists with PCPs to better coordinate hospital and ambulatory care plans. Holy Cross Health and CareFirst representatives now meet together with those physicians toward that end. Holy Cross has implemented multiple post-acute care interventions to reduce the likelihood of future utilization both within the 30 day window and beyond. We call every adult medical/surgical patient discharged to home to assure that they have the required medications, have made the necessary followup appointments, have been in contact with homecare or DME vendors, and are aware of the red flags of their clinical condition. Concerns are elevated to a Holy Cross Health nurse care coordinator. At no cost to patient or payer, we offer transitional care services to high risk patients who are not eligible for home care services. These services include visits during their hospital stay; an extended RN home visit for medication reconciliation, safety evaluation and symptom review; and a series of nurse-led health coaching calls. We instituted care alerts in our EMR for home care and transitional care patients. Emergency Department providers have access to a 24/7 phone number to arrange for an in-home visit in lieu of hospitalization. We also contract with Family Services, Inc., to provide enhanced support for patients with behavioral health and substance abuse issues. Our post-acute liaison nurse provides next day follow-up on patients transitioning to and from Skilled Nursing Facilities (SNFs). We are working with SNFs throughout Montgomery County in a variety of forums including MHA, VHQC, and
105 independently with select high value partners. In FY17, we will fund a pharmacist led in-home medication reconciliation and home delivery program for high risk patients. Holy Cross Health has community health workers who work in underserved communities to provide health information and referrals to our health centers and to other services that can help individuals address social determinants of health. We also provided health insurance enrollment support to more than 10,000 people last year. We offer extensive community health programming to engage individuals in their own health. For example, each week 1,200 individuals participate in Senior Fit exercise classes offered free of charge by Holy Cross Health at 23 sites around the region. In annual assessments, we see a high percentage of participants improving strength, flexibility as well as their sense of well-being. Other valuable self-care programs include Living Well: Chronic Disease Self-Management Program, Diabetes Prevention and Diabetes Self-Management, Pulmonary Maintenance, Falls Prevention, Memory Academy, Better Bones, Heart Failure Management, Kids Fit and Kids Shape. We also offer multiple other exercise and intellectual engagement programs offered at Senior Source, our center for active aging and at multiple community locations. Our Medical Adult Day Center provides a safe, medically supervised, engaging setting for vulnerable adults, particularly those with dementia. It can be a valuable resource for families to help seniors remain in the community rather than becoming institutionalized. The Caregiver Resource Center, which is affiliated with the Medical Adult Day Center, provides information, referrals and numerous support groups to help people manage the responsibilities and challenges of caregiving. Together with the other Montgomery County hospitals, Holy Cross Health secured a Regional Partnership for Health System Transformation design grant which led to the creation of Nexus Montgomery. Our plan, which focuses on preemptive care coordination of high risk individuals to prevent initial admissions, was recognized in the HSCRC's January 13, 2016 Executive Summary report as "a notable standout in terms of detail and plausible impact." Nexus Montgomery has been selected as one of nine awardees in the HSCRC Transformation Implementation Program. In addition to the preemptive care coordination program we also will expand existing post-acute care programs and focus on care coordination for two particularly vulnerable populations: patients who are uninsured and those with severe mental illness. These efforts demonstrate Holy Cross Health's commitment to effective and appropriate hospital utilization. Our focus on high reliability clinical processes and consistent documentation has resulted in a dramatic reduction in complications. However readmission rates have been more difficult to move. Our Maryland all-site readmissions were significantly below the state average in CY13 but our CY15 risk adjusted readmissions were unchanged despite major investment. Our same site readmissions are down 5% over that period. This speaks to the importance of information sharing and risk sharing across communities as exemplified by Nexus Montgomery. Hospital readmission rates only tell a part of the story and cannot be fully understood without characterizing the population the hospital serves and the care systems in place. KP is a case in point for Holy Cross Health. They provide a highly respected and highly integrated model of care delivery, much of which is the basis for changes currently being implemented across Maryland. As part of that process, KP has built large "clinical decision units" that hold patients for a day and keep them out of the hospital. This resulted in a significant decrease in Observation patients and avoided many inpatient stays in FY14 and 15, likely by patients with the lowest risk for readmission. But, with the increased enrollment in KP and their active steering of patients to Holy Cross, we have seen a marked increase in KP inpatients and Observation patients in FY16. Despite their highly integrated delivery system and fully aligned incentives, KP's risk adjusted readmission rate for HCH has increased slightly between CY13 and CY15 with the latter representing a recovery from a
106 major rise in CY14. We have worked with KP to understand and improve readmission trends and they have implemented pharmacist medication reconciliation, high priority post discharge appointments, changes in their SNF discharge and rounding process, and a "concierge practice" with two internists focused on a small number of high utilizing patients. The inability of HCH and KP to lower already low readmission rates is humbling and challenges us to better understand readmissions as only one element of overall utilization of expensive healthcare by a defined population. We view Prevention Quality Indicators (PQIs) as a misleading and inappropriate measure of hospital performance. PQIs were conceived by AHRQ as global population measure and expressed as rates per 100,000 not percent of hospital admissions. Over 90% of PQIs are medical and represent "bread and butter" medicine heart failure, pneumonia, COPD, out of control diabetes. The number at any hospital is reflective of community resources, local referral practices, ease of access, the disease burden in the community, the availability of primary care, the availability of hospital beds, and the proportion of the population whose basic medical needs are served. The percentage of a hospital's inpatients who have a PQI will be lower for hospitals with large elective medical (and particularly surgical) cases, lower for hospitals with high obstetrical volume, and higher for community hospitals with good access through emergency departments or clinics. Patients who are admitted to a hospital with a PQI do not represent care that can be avoided at that moment. Hospitals already deal with justifying the need for hospitalization to payers based on medical necessity. Prevention is far upstream and requires concerted community-wide interventions shared by all of the stakeholders hospitals, payers, doctors, pharma, public health entities, and post-acute providers. The Nexus Montgomery program is a tiny step in that direction, but is orders of magnitude short of what is needed and hospitals alone cannot shoulder the cost. KP's practices as reflected in Holy Cross Health metrics illustrate some key points about PQIs. Three examples are particularly telling. -For PQI-16, amputations in diabetics, Kaiser increased from 27 in CY13 to 47 in CY15. This may represent adverse selection in KP enrollment but the over-riding factor was the decision by KP leadership to direct their vascular and general surgery from across their system to Holy Cross Hospital (HCH). -Overall, for commercially insured patients, PQIs represent 11% of KP medical admissions to HCH and 20% at Holy Cross Germantown Hospitals (HCGH). Does that represent a nearly 100% difference in the effectiveness of KP's practice across the 20 mile distance between the two hospitals? -At HCGH that 20% PQIs is above the community level of 14% for commercial insurance. Does this reflect a significant deficiency in care by KP's referrals from outside the immediate community? We believe these examples and others illustrate the difficulty of using PQIs as a measure of hospital performance or the combined role of hospital and community, without understanding the aggregate population served. We need to think, measure and act in terms of attributable populations rather than trying to control narrow measures which can never be fairly assessed as independent variables.
107 250 W. Pratt Street CORPORATE OFFICE 24 th Floor Baltimore, Maryland May 25, 2016 Donna Kinzer, Executive Director Health Services Cost Review Commission 4160 Patterson Avenue Baltimore, Maryland Dear Ms. Kinzer: On behalf of the University of Maryland Medical System s (UMMS) and its 12 member hospitals, this letter is in response to the HSCRC draft staff recommendation for the FY 2017 Update Factor, dated May 2. We appreciate the opportunity to provide comments. The University of Maryland Medical System has supported Maryland s All Payer System with its improved equity for Maryland patients and for the access it has provided by funding the social costs of providing hospitals services in the State. We continue to support the system as it has transformed into the Hospital All Payer Model with CMMI, with its new emphasis on population health. This is the right path to improve the quality of care for patients and to align payments with improved population health efforts. Achieving the Triple Aim (and meeting the requirements of the Waiver) requires transforming the systems, technology, behavior and performance of our large, fragmented, statewide health care system. Such a transformation requires significant resources (hundreds of millions of dollars), time (measured in years) and comprehensive population health solutions (people, process and technology). There is evidence that some population health methodologies are cost effective and can achieve both a clinical and financial return. But there is much to be learned about which programs achieve the desired clinical outcomes and justify the large expense over the long term. Thus, innovation and experimentation in care delivery will be critical to long term success. Making change of this magnitude in a health care system has never been done before. The effects of such profound change on Maryland s health system are unprecedented, challenging and risky. Moreover, we do not know the effects on the health of Maryland s residents. The latter is of utmost importance and must be carefully measured and monitored. Moving too fast may have unintended consequences and adverse effects on patients and providers. UNIVERSITY OF MARYLAND MEDICAL SYSTEM University of Maryland Medical Center University of Maryland Medical Center Midtown Campus University of Maryland Rehabilitation and Orthopaedic Institute University of Maryland Baltimore Washington Medical Center University of Maryland Shore Regional Health University of Maryland Shore Medical Center at Easton - University of Maryland Shore Medical Center at Chestertown - University of Maryland Shore Medical Center at Dorchester University of Maryland Charles Regional Medical Center University of Maryland St. Joseph Medical Center University of Maryland Upper Chesapeake Health System University of Maryland Upper Chesapeake Medical Center - University of Maryland Harford Memorial Hospital Mt. Washington Pediatric Hospital
108 Donna Kinzer, Executive Director May 25, 2016 Page 2. Efforts to Reduce Potentially Avoidable Utilization UMMS has actively worked to transform care delivery. We have put in place a number of efforts to reduce potentially avoidable utilization (PAU). UMMS is funding significant investments in population health programs in excess of the HSCRC GBR Infrastructure funding. These investments are designed to improve quality, safety and efficiency of care and to assure success of the Waiver. We have made these investments after extensive strategic and operational planning; and we have involved our own experts and engaged external partners to implement population health strategies. UMMS is making good progress in implementation of these programs, but these are large undertakings which take time. Our health system s strategies include building relationships and aligning incentives with both employed and independent physicians and aligning the physicians and other care providers in clinically integrated networks. We are employing sophisticated technology to track total cost of care and quality of care. We are building capabilities in complex care management, medication management, and behavioral health. Finally we are working with the physicians to optimize performance using the tools and technology described above. The population health capabilities described above will be applied to different populations of patients including Medicare FFS, Medicaid and Medicare Advantage and those who are insured commercially. There are differences in the approaches to achieving the Triple Aim by hospitals and health systems. These differences should be embraced as we learn what works and what does not and how we best address the dissimilarities among our communities and providers. Funding Other Investments While we believe these efforts are appropriate and improve care for Maryland residents, we must use this opportunity to register our concern over the update factor for FY2017 recommended by the staff. Based upon the HSCRC s staff recommendation, UMMS is estimating an updated factor of 1.07% (1.72% market basket less the.65% shared savings reduction) to fund core inflation for necessary wage increases and non-salary inflation. This number is woefully inadequate creating cost pressures to manage unfunded inflation. Additionally, under the new Waiver hospitals must find ways to fund clinical innovation, new information technology, population health strategies and capital replacement. The staff has noted that hospitals could fund these expenses by reducing PAU. However, to reduce PAU requires spending, as described above, and the spending that can be financed by these reductions is limited by the fact that PAU is potentially avoidable, not avoidable with certainty. Further, the Commission s policy has been to reduce update factors below the level of the market basket to share the savings with payers. As a consequence, hospitals must reduce PAU first to fund the shared savings and then even more to generate funds to finance hospital investments. The dollars to be saved are being designated for multiple purposes, and the first dollars of savings are already spoken for in the update factor policy.
109 Donna Kinzer, Executive Director May 25, 2016 Page 3. Recognize Success and Needs The current update factor proposal is sending a message of failure and discouragement, reminiscent of the last days of the old waiver model when we faced loss of the waiver and the need to change the delivery system in light of the national trend in healthcare reform. We have now completed two years of the model and the system has generated Medicare savings well ahead of those scheduled in the model agreement with CMMI. Further, we have delivered per capita hospital spending well below the 3.58% all payer limit established under the agreement. This performance is cause for celebration. It is also a time to consider the broader question of system needs. Hospitals are being asked to fund a number of population health initiatives and their related infrastructure as well as the routine costs of operation for wages and capital costs. Funding that was once generated through hospital volume is no longer an avenue under the new model. To fund those expenses and generate margins to maintain our facilities, update factors need to be closer to the market basket to cover general inflation, without specifically targeted purposes designated by the Commission. The University of Maryland Medical System supports the Maryland Hospital Associations (MHA) Update Factor recommendation and urges you to move towards a more balanced update. The MHA recommendation provides for specific ways to increase the current proposal without threatening the all-payer model s spending limits. The All Payer Model has offered an innovative approach to addressing problems that we faced under the old waiver model and has placed Maryland hospitals at the center of national efforts to transform the delivery system. We continue to support these efforts while noting that we are working in large organizations that require time to change. After only two full years of the model, we have made remarkable progress, and that progress can continue if we work together with a balanced funding approach. We appreciate the opportunity to comment on the staff recommendation. If you would like to discuss further, please contact me at Sincerely, Robert A. Chrencik President and Chief Executive Officer cc: Nelson J. Sabatini, Chairman Herbert S. Wong, Ph.D., Vice-Chairman John M. Colmers Stephen F. Jencks, M.D., M.P.H. Victoria (Tori) W. Bayless Jack Keane George H. Bone, M.D. Mike Robbins
,")
110 18101 Prince Philip Dr. Olney, MD Phone Fax medstarmontgomery.org Thomas J. Senker, FACHE President Administration May 25, 2016 Nelson J. Sabatini Chairman, Health Services Cost Review Commission 4160 Patterson Avenue Baltimore, MD Dear Chairman Sabatini: As the new hospital president at MedStar Montgomery Medical Center (MMMC), I am very concerned about the recent dialogue around the Health Services Cost Review Commission (HSCRC) global budget update for fiscal year As an organization that is committed to serving our local community by caring for patients and advancing health, MMMC has been very focused on impactful efforts to reduce potentially avoidable utilization (PAU) and unnecessary cost. While the incentives for doing this are not yet perfectly aligned, we believe it is the right thing to do and have made several investments to support these efforts. Limiting hospital funding at this critical stage could be detrimental to the progress that we have made and could prevent our ultimate success. As you know, the issue of avoidable utilization has many facets that are intertwined. To appropriately focus us on the key issues, I have expanded a senior leadership role to have specific responsibility for population health. This senior leader helps to design and monitor our PAU efforts in conjunction with a multi-disciplinary team consisting of case management, physicians, laboratory technicians, radiology technologists, pharmacists, nursing, and social work. The team has developed a range of solutions focused initially in the emergency department but continuing through the entire care continuum. As part of these efforts, they have also focused on the reduction of redundant or avoidable testing in radiology, cardiology and laboratory. This critical work has resulted in appropriate changes in practice, workflow changes to ensure appropriate testing and the identification of appropriate alternatives to high cost pharmaceuticals from the inpatient formulary. To ensure that we are intervening at the earliest possible stage, we have invested in a streamlined navigation process and have expanded case management staffing in our Emergency Department (ED). To better identify potential super-utilizers, we have implemented an all patient risk assessment program that stratifies all patients for risk of readmission. Depending on the level of risk identified, navigators help to coordinate appropriate care and identify follow-up care planning, including involvement in the transitional care program. The transitional care program tracks and follows our discharged to home patients for 30 days. As part of this program, we have also partnered with a private duty nursing company to provide home visits, help with obtaining medication and medically related transportation. MMMC has also expanded its reach into the community by partnering with skilled nursing facilities to better manage discharged patients. Building relationships with medical leads at each of the facilities enables us to better co-manage these patients and avoid unnecessary hospital stays and improved collaboration in care. Additionally, we have successfully piloted a program in a local nursing home in which hospitalist physicians from the hospital provide direct medical care and oversight at the nursing home. This program alone has resulted in an 18% reduction in readmissions for this patient population and will be expanded to other post acute centers if the update
111 factor allows us to fund it. We also run the medical clinic at a local retirement community at a significant loss in order to reduce unnecessary ED visits and admissions and are just beginning to see reduction of PAU associated with these patients. Despite all of the progress we have made, our efforts to contain cost and improve the quality of care that we provide are at risk if we are not properly funded. Regrettably, the current HSCRC staff proposal, if implemented, will result in the reduction of approximately 27 positions here at MMMC, some of which will directly impact our population health efforts. Given the very positive results and cumulative savings that have been generated in the initial years of the new waiver, now is the time to maintain the state s investment in its hospitals at least at the rate of inflation as we collaboratively work to aggressively shift into a value-based model. We are confident that we are making great strides at MMMC towards a population health focused model, in which increased coordination of care and partnerships with a variety of community partners will yield significant benefits for our community and the state of Maryland. We are proud to be a part of a forward-thinking waiver that has the opportunity to set the bar for the rest of the country. Please continue to support our efforts and the great progress that we have made by carefully reconsidering the HSCRC staff s inadequate annual update proposal. Thank you for the opportunity to share this important information I appreciate your thoughtful consideration and your leadership. Please let me know if I can be of assistance in any way. Sincerely, Thomas J. Senker, FACHE President, MMMC and Senior Vice President, MedStar Health Cc: Michael Robbins, Senior Vice President, Rate Setting, MHA Kathy Talbot, Vice President, Rates & Reimbursements, MedStar Health Michael J. Curran, Executive Vice President, Chief Administrative & Financial Officer, MedStar Health
112 May 26, 2016 Donna Kinzer, Executive Director Health Services Cost Review Commission 4160 Patterson Avenue Baltimore, MD Dear Ms. Kinzer: The purpose of this letter is to provide comments on the staff recommendation for the FY2017 update factor on behalf of Mt. Washington Pediatric Hospital. We appreciate the opportunity to provide our views on this important issue. We support the All Payer Model and the underlying goals of improving the quality and value of care for patients in Maryland s unique hospital regulatory system. We understand the Commission s desire to achieve the model s performance targets well in advance of the end of the demonstration model, but if rate updates ignore the rising cost of providing care, hospitals cannot sustain quality patient care. To operate our facility, we need to fund the basic costs of the hospital, including competitive wage structures and replacement capital. To do so, update factors need to reflect underlying market basket growth. We support an update of 2.30 percent (instead of 1.55 percent) for Mt. Washington Pediatric Hospital, as recommended by the Maryland Hospital Association. The HSCRC staff recommends a 0.50 percent adjustment for productivity improvement, with which we agree. However, the staff recommendation also includes a reduction of 0.75 percent, which is the Medicare hospital payment cut intended to fund part of the cost of the Affordable Care Act. It is inappropriate to apply this federal Medicare reduction amount to all payer revenue in Maryland (Medicaid, CareFirst, United, others). It creates a larger-than-intended reduction for hospitals and a windfall for non-medicare payers -- a particularly relevant issue for our hospital, given that we have almost no Medicare patients. Although not a GBR hospital, MWPH helps reduce overall healthcare costs by providing a lower-cost option for pediatric inpatient care. An appropriate update factor will assure that the hospital maintains its ability to help the acute care hospitals meet their goals.
113 We appreciate the opportunity to comment on this recommendation. Please contact me if you have any questions. Sincerely, Mary Miller Mary Miller, CFO cc: Nelson J. Sabatini, Chairman Herbert S. Wong, Ph.D., Vice-Chairman John M. Colmers Stephen F. Jencks, M.D., M.P.H. Victoria (Tori) W. Bayless Jack Keane George H. Bone, M.D. Mike Robbins Sheldon Stein
114 Nelson J. Sabatini May 25, 2016 Page 3 of 3 unnecessary and potentially harmful, end of life interventions in the inpatient and ICU settings. Improved Patient experience --- better pain and symptom management, alignment of goals between patient, family members, and providers. Facilitation of outcomes and goal alignment with treatment options. Palliative care decreased Potentially Avoidable Utilization by ensuring more appropriate use of supportive care, avoidance of inappropriate and costly ICU/ emergency care interventions that are futile or unwanted by the patient and alignment of patient goals with services at appropriate level of care- home rather than hospital, hospital rather than ICU. All of the above have required a financial investment that will not be possible with the proposed rate changes. In addition, commercial payors increasingly are denying payment for services rendered and ordered by physicians. Payment denials in a Global Budget, with penalties and incentives for unnecessary care, are inconsistent and a financial burden to hospitals that prevent expansion of initiatives that could improve our healthcare system. We urge you to reevaluate so that we have the resources required while still maintaining the requirements of the all payer model. Sincerely, ~. kcl?/ Neil M. Meltz~ President/CEO d~;j1~ Jason Blavatt Chair, LifeBridge Board Oavid Krajewski Sr. Vice President/CFO / \ ~ '--"'\ "'. ~Jonathan -Ringo Chief Medical Information Officer & VP, Clinical Transformation c: Herbert S. Won g, Ph.D., Vice Chairman Victoria W. Bayless George H. Bone, M.D. John M. Colmers Stephen F. Jenck s, M.D., M. P.H. Jack C. Keane Donna Kin zer, Executive Director
115
116
117
118

119 June 2, 2016 Nelson J. Sabatini Chairman, Health Services Cost Review Commission 4160 Patterson Avenue Baltimore, MD Dear Chairman Sabatini: With your critical decision on hospitals global budget update for fiscal year 2017 coming in less than a week, we wanted to make sure you had some important new information about why Maryland is well on track to meet the Medicare Total Cost of Care guardrail, which would allow for the higher MHA-proposed update of 2.75 percent without jeopardizing the total cost of care spending guardrail in calendar year The information below is conclusive: Maryland is besting the total cost of care spending guardrail so far this year; the historical data clearly suggest that the hospital rate increase doesn t harm that performance in the second half of the year; the historical data also indicate that we improve on our total cost of care performance over the second half of the year. With the most recent Medicare Chronic Conditions Warehouse (CCW) data made available just last week, Maryland currently has information for calendar year 2016 for claims processed through April 30, Staff are likely to share this data with you before the June 8 meeting, but because concern about total cost of care guardrails has been at the center of the update discussion, we wanted to bring it to you as soon as possible. Here is what that data show: Medicare savings are even higher than expected Maryland Medicare spending per beneficiary hospital savings has grown by an additional $74 million, bringing the cumulative savings to date to $325 million. With more than 2½ years to go, we will clearly exceed the minimum savings requirement of $330 million, with the savings rate so far this year exceeding that of the first two years of the all-payer model. Maryland s total cost of care growth is less than the nation s Maryland Medicare spending per beneficiary total cost of care growth so far this year has been less than the national growth rate by 0.75 percentage points. The test this year required that Maryland not exceed the national growth and the new data suggest we are on track. Historically, spending slows in the second half of the year Data for the past three years show that both Medicare hospital spending AND total cost of care spending per beneficiary have been less in the second half of the year than the first half of the calendar year, even with the HSCRC hospital rate increase being put into effect in July. That
120 Nelson J. Sabatini June 2, 2016 Page 2 is, the seasonality of spending has historically offset the full impact of hospital rate increases in the second half of the calendar year. Maryland spending declined more rapidly than national spending Data for the past three years show that Maryland actually spends increasingly less relative to the national growth rate in the second half of the calendar year for both hospital and total cost of care spending. The data and trending revealed by this latest information provides a solid basis for your support of MHA s update proposal of 2.75 percent. If you have any questions on the attached information please do not hesitate to contact me. We look forward to your consideration of this critical information as part of next week s commission action on the update to global budgets for fiscal year Sincerely, Michael B. Robbins Senior Vice President cc: Herbert S. Wong, Ph.D., Vice Chairman Victoria W. Bayless George H. Bone, M.D. John M. Colmers Stephen F. Jencks, M.D., M.P.H. Jack C. Keane Donna Kinzer, Executive Director Enclosure
121 Medicare Total Spending per Beneficiary $2,960 Maryland vs. National Growth Ceiling CYTD April 2016 $2, $2,955 $2,950 $2,945 CYTD 2016 Total Medicare spending per Maryland beneficiary 0.75% below the national growth rate $2,940 $2,935 $2, $2,930 $2,925 $2,920 Maryland Actual Source: Medicare CCW Data Received from HSCRC 5/25/16 Nat'l Growth Rate 1
122 Medicare Hospital Spending per Beneficiary $1,780 Maryland vs. National Growth Ceiling CYTD April 2016 $1,760 $1, $1,740 $1,720 $1,700 CYTD 2016 Medicare hospital spending per Maryland beneficiary is below the national growth rate, resulting in $74 million of additional annual savings, bringing the total to $325 million to date $1,680 $1,660 $1, $1,640 $1,620 $1,600 Maryland Actual Source: Medicare CCW Data Received from HSCRC 5/25/16 Nat'l Growth Rate 2
123 Dear Chairman Sabatini, Mercy Medical Center supports the MHA proposal for additional funds in the FY17 rate update. We believe the rate system has served Marylanders well and the movement to global budget has been an important tool to initiate change. We also believe that the industry has responded extremely well to the challenge of containing per capita costs. In fact, all the data suggests improvement well beyond the targets established in The total cost of care target has now been used to constrain revenue. It was set up as a guard rail against shifting of revenue. Using this measure to control the update is problematic as most of the revenue is outside of the control of hospitals. Because the measure is new, we need to be cautious not to overreact to one year's performance. Normal variation or errors in payment data could be causing the yearly differences. We believe the Commission should take a longer view in establishing updates for the industry. It is quite demoralizing to receive updates below the level needed to operate when performance has been so good. Management of hospital expenditures becomes extremely difficult in this environment. In addition, the current practice of prescribing how each dollar is spent while underfunding core inflation should be stopped. This practice impedes innovation and it just doesn't work. The commission should be focused on meaningful outcomes. Let the industry meet the challenge. We are in new unchartered territory. Maintaining momentum and investing for the future is important. Reducing revenue in anticipation of failure is not a good strategy. We need to invest for the future and restore the update to an appropriate amount. Sincerely, Tom Mullen President and CEO Mercy Health Services, Inc.
124 800 King Farm Blvd, Suite 600 Rockville, MD June 6, 2016 Nelson J. Sabatini, Chairman Donna Kinzer, Executive Director Health Services Cost Review Commission 4160 Patterson Avenue Baltimore, Maryland Dear Mr. Sabatini and Ms. Kinzer: The purpose of this letter is to provide United Healthcare s comments on the HSCRC staff s Draft Recommendations for the Update to Hospital Rates. First, United is concerned over the infusion of nearly $200 million of care management infrastructure funding into the hospital system, without definitive improvement and in some cases, increases in Potential Avoidable Utilization (PAUs). As such, United supports the staff s proposal as outlined to the Commission. Elimination of unnecessary utilization should be a strategic initiative to align and support community-based alternatives. One further point concerning the PAUs, United recommends the Commission should consider modifications to the current PAU methodology. Without going into greater detail in this letter, we would agree to participate in a broader discussion with staff, hospitals and other Payers to better align the methodology. Regarding the Update Factor as recommended by the HSCRC staff or the proposed FY 2017 Update of 2.12% (as revised), we are cautiously supportive of this respective position. We have a concern of Maryland exceeding the National TCOC guardrail for the second consecutive year based upon FY 2016 increase. It appears the Medicare TCOC test for CY 2015 is unfavorable and may impact performance in CY 2016 as well due the prior Update Factor approvals. With this said, United would concur and support the CareFirst recommendation of 1.28% July 1, 2016 Update Factor to ensure meeting the critical Medicare financial test in accordance with the Maryland Waiver provisions. Finally, we very much appreciate the opportunity to allow our input into this very important process. The HSCRC Staff has been terrific to work with or the collaboration we enjoy should be recognized. In the event you have further questions concerning United s positions above, please feel free to contact me at your convenience. Respectfully, Gary B. Simmons Regional Vice President, Networks
125
126

127 STATE OF MARYLAND DHMH Maryland Department of Health and Mental Hygiene Larry Hogan, Governor Boyd Rutherford, Lt. Governor Van Mitchell, Secretary June 8, 2016 Nelson J. Sabatini Chairman The Health Services Cost Review Commission 4160 Patterson Avenue Baltimore, MD Dear Chairman Sabatini: The Medicaid program has reviewed the recommendation of the Health Services Cost Review Commission s (HSCRC) Staff, specifically, the overall update factor recommendation of 2.16 percent for Fiscal Year 2017 and the Hospital Readmission Reduction Incentive Program for Rate Year We are writing in strong support of the Staff s recommendations, in particular the recommendation to continue to set a minimum required reduction benchmark on an all-payer basis. The Medicaid program applauds the HSCRC s foresight in implementing its quality programs to benefit all factions of Maryland s population. Strategies that focus only on Medicare ignore and risk not addressing the readmissions issues critical to Medicaid and other payers. Maintaining the all-payer approach to quality programs under the All-Payer Model will ensure the development of strategies that improve the health of all Marylanders while mitigating costshifting from Medicare to other payers. If you have any questions, please contact Tricia Roddy, Director for the Office of Planning at or tricia.roddy@maryland.gov. Sincerely, Shannon M. McMahon Deputy Secretary, Health Care Financing 201 W. Preston Street Baltimore, Maryland Toll Free MD-DHMH TTY/Maryland Relay Service Web Site:

128 FY 2017 Update Factor June 8,
129 Balanced Update Model for Discussion Components of Revenue Change Linked to Hospital Cost Drivers/Performance Weighted Allowance Adjustment for Inflation 1.72% - Total Drug Cost Inflation for All Hospitals* 0.20% Gross Inflation Allowance A 1.92% Implementation for Partnership Grants B 0.25% Care Coordination -Rising Risk With Community Based Providers -Complex Patients With Regional Partnerships & Community Partners -Long Term Care & Post Acute C Adjustment for volume D 0.52% -Demographic Adjustment -Transfers -Categoricals Other adjustments (positive and negative) - Set Aside for Unknown Adjustments (Includes.10 Earmark**) E 0.50% - Workforce Support Program F 0.06% - Holy Cross Germantown G 0.07% - Non Hospital Cost Growth H 0.00% Net Other Adjustments I = Sum of E thru H 0.63% -Reverse prior year's PAU savings reduction J 0.60% -PAU Savings K -1.25% -Reversal of prior year quality incentives L -0.15% -Positive incentives & Negative scaling adjustments M 0.27% Net Quality and PAU Savings N = Sum of J thru M -0.53% Net increase attributable to hospitals O = Sum of A + B + C + D + I + N 2.80% Per Capita P = (1+O)/(1+0.52%) 2.27% Components of Revenue Offsets with Neutral Impact on Hosptial Finanical Statements -Uncompensated care reduction, net of differential Q -0.49% -Deficit Assessment R -0.15% Net decreases S = Q + R -0.64% Revenue growth, net of offsets T = O + S 2.16% Per capita revenue growth U = (1+V)/(1+0.52%) 1.63% * Provided Based on proportion of drug cost to total cost **Earmark 0.10 percent for new outpatient infusion and chemotherapy drugs
130 Medicare Savings Requirements: Scenario 1 Maximum Increase that Can Produce Medicare Savings Medicare Medicare Growth CY 2016 A 1.20% Savings Goal for FY 2017 B -0.50% Maximum growth rate that will achieve savings (A+B) C 0.70% Conversion to All-Payer Actual statistic between Medicare and All-Payer D 0.89% Conversion to All-Payer growth per resident (1+C)*(1+D)-1 E 1.60% Conversion to total All-Payer revenue growth (1+E)*(1+0.52%)-1 F 2.12% Comparison of Medicare Savings Requirements to Model Results All-Payer Maximum to Achieve Medicare Modeled All- Difference Savings Payer Growth Comparison to Modeled Requirements Revenue Growth 2.12% 2.16% 0.03% Per Capita Growth 1.60% 1.63% 0.03% 3
131 Balanced Update Model for Discussion Components of Revenue Change Linked to Hospital Cost Drivers/Performance Weighted Allowance Adjustment for Inflation 2.29% - Total Drug Cost Inflation for All Hospitals* 0.20% Gross Inflation Allowance A 2.49% Implementation for Partnership Grants B 0.25% Care Coordination -Rising Risk With Community Based Providers -Complex Patients With Regional Partnerships & Community Partners -Long Term Care & Post Acute C Adjustment for volume D 0.52% -Demographic Adjustment -Transfers -Categoricals Other adjustments (positive and negative) - Set Aside for Unknown Adjustments (Includes.10 Earmark**) E 0.50% - Workforce Support Program F 0.06% - Holy Cross Germantown G 0.07% - Non Hospital Cost Growth H 0.00% Net Other Adjustments I = Sum of E thru H 0.63% -Reverse prior year's PAU savings reduction J 0.60% -PAU Savings K -1.25% -Reversal of prior year quality incentives L -0.15% -Positive incentives & Negative scaling adjustments M 0.27% Net Quality and PAU Savings N = Sum of J thru M -0.53% Net increase attributable to hospitals O = Sum of A + B + C + D + I + N 3.36% Per Capita P = (1+O)/(1+0.52%) 2.82% Components of Revenue Offsets with Neutral Impact on Hosptial Finanical Statements -Uncompensated care reduction, net of differential Q -0.49% -Deficit Assessment R -0.15% Net decreases S = Q + R -0.64% Revenue growth, net of offsets T = O + S 2.72% Per capita revenue growth U = (1+V)/(1+0.52%) 2.19% * Provided Based on proportion of drug cost to total cost **Earmark 0.10 percent for new outpatient infusion and chemotherapy drugs
132 Medicare Savings Requirements: Scenario 2 Maximum Increase that Can Produce Medicare Savings Medicare Medicare Growth (CY CY 2017)/2 A 1.75% Savings Goal for FY 2017 B -0.50% Maximum Growth Rate that will Achieve Savings (A+B) C 1.25% Conversion to All-Payer Actual Statistic between Medicare and All-Payer D 0.89% Conversion to All-Payer Growth per Resident (1+C)*(1+D)-1 E 2.15% Conversion to Total All-Payer Revenue Growth (1+E)*(1+0.52%)-1 F 2.68% Comparison of Medicare Savings Requirements to Model Results All-Payer Maximum to Achieve Medicare Modeled All- Savings Payer Growth Difference Comparison to Modeled Requirements Revenue Growth 2.68% 2.72% 0.04% Per Capita Growth 2.15% 2.19% 0.04% 5
133 Proposed Update & Compliance with the All- Payer Gross Revenue Test A B C D E = (1+A)*(1+B)*(1+C)*(1+D) Actual Actual Staff Est. Proposed Cumulative Jan- June 2014 FY 2015 FY 2016 FY 2017 Through FY 2017 Maximum Gross Revenue Growth Allowance 2.13% 4.26% 4.12% 4.12% 15.44% Revenue Growth for Period 0.90% 2.51% 2.94% 2.72% 9.37% Savings from UCC & Assessment Declines that do not Adversely Impact Hospital Bottom Line 1.09% 1.41% 0.64% 3.17% Revenue Growth with UCC & Assessment Savings Removed 0.90% 3.60% 4.35% 3.36% 12.74% Revenue Difference between Cap & Projection 2.70% 6
134 Total Approved Inflation Allocation Current Approved Update Total Approved Example: Revenue Approved Revenue Percent YE June 30, 2016 $ 100,000, % $ 102,720, of Total Allocated as Follows: July though Decenber 31, 2016 $ 50,000, % $ 51,080, % January 1, 2017 through June 30, 2017 Remainder $ 51,640, % Total Approved Revenue FY June $ 102,720,
135 Summary of Recommendations Update the three categories of hospitals & revenues: 2.72% for revenues under global budgets 2.16% for the first 6 months of the FY The remainder over the final 6 months of the FY 1.24% for revenues subject to waiver but excluded from global budgets 1.55% for psychiatric hospitals and Mt. Washington Pediatric Hospital Allocate 0.20% of the inflation allowance based on each hospitals proportion of drug cost to total cost. Earmark 0.10% of the allowance for unforeseen adjustments for increases in cost related to new outpatient physician-administered drugs. 8


136 9 Data prepared by HSCRC Staff from federal extracts, subject to change


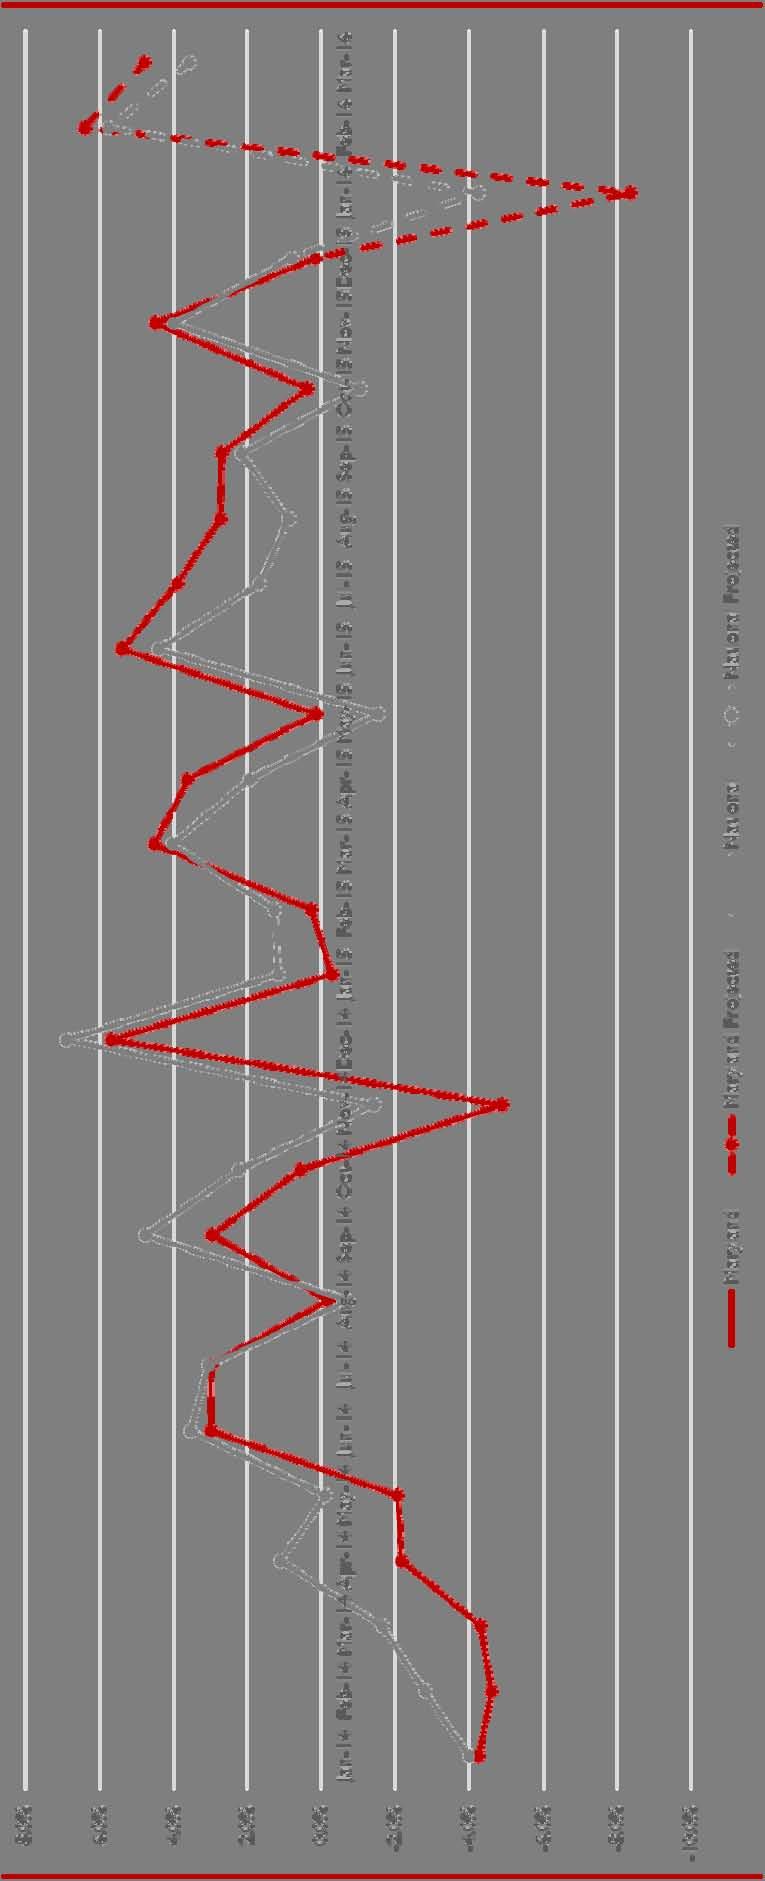
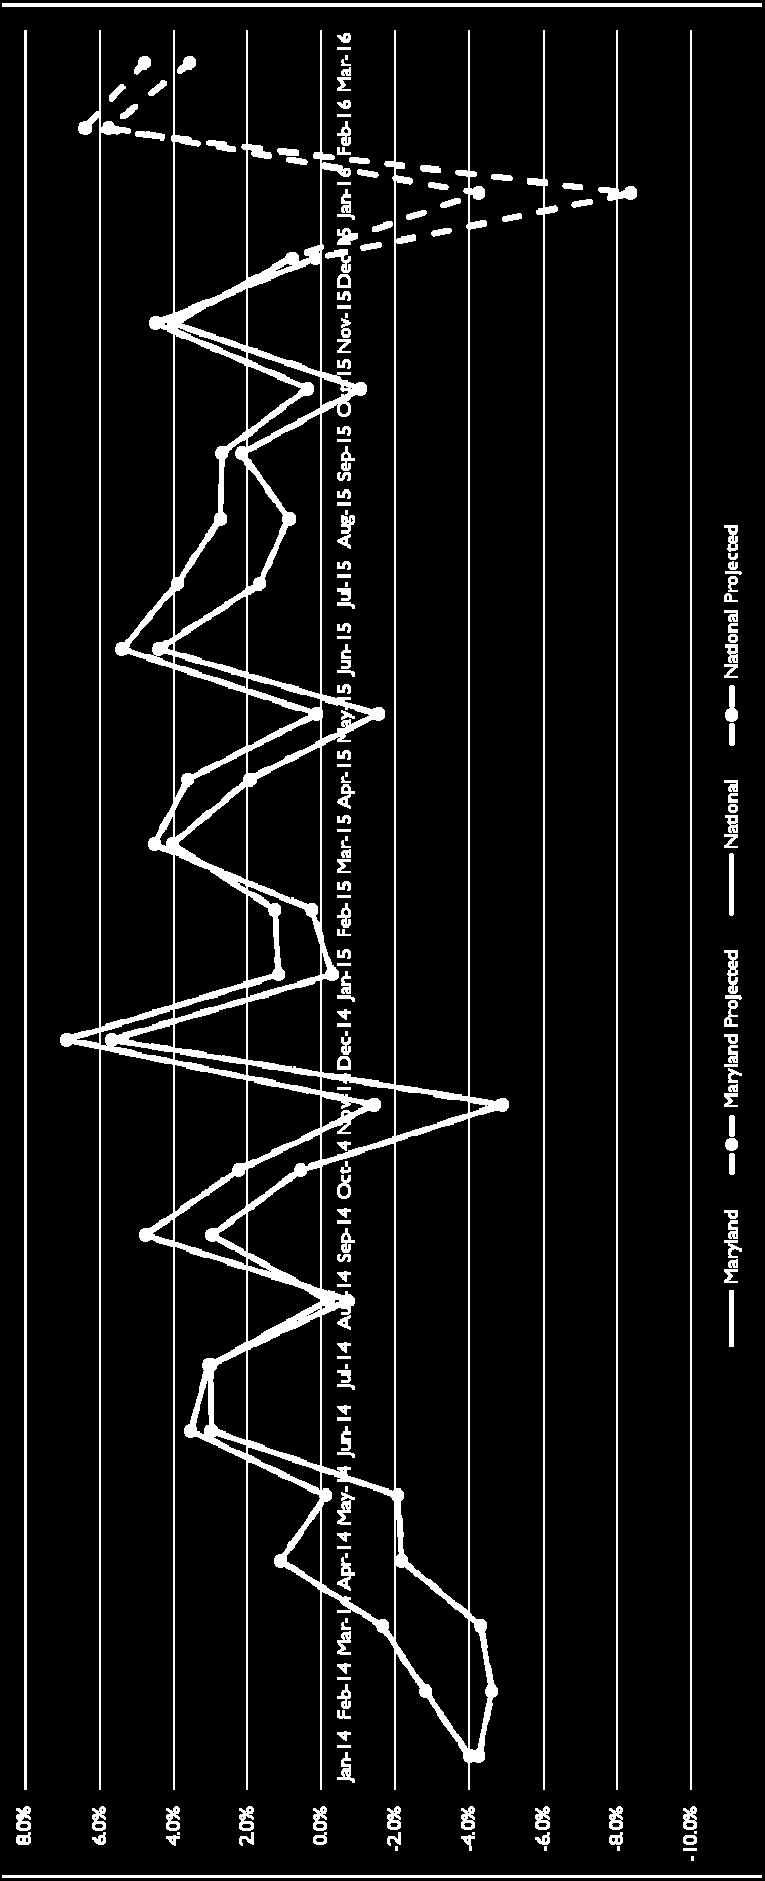
137 10
NOTICE OF WRITTEN COMMENT PERIOD
 NOTICE OF WRITTEN COMMENT PERIOD Notice is hereby given that the public and interested parties are invited to submit written comments to the Commission on any or all of the following staff draft recommendations
PROPOSED POLICY AND PAYMENT CHANGES FOR INPATIENT STAYS IN ACUTE-CARE HOSPITALS AND LONG-TERM CARE HOSPITALS IN FY 2014
 DEPARTMENT OF HEALTH & HUMAN SERVICES Centers for Medicare & Medicaid Services Room 352-G 200 Independence Avenue, SW Washington, DC 20201 FACT SHEET FOR IMMEDIATE RELEASE Contact: CMS Media Relations
Draft for the Medicare Performance Adjustment (MPA) Policy for Rate Year 2021
 Policy for Rate Year 2021") Draft for the Medicare Performance Adjustment (MPA) Policy for Rate Year 2021 October 2018 Health Services Cost Review Commission 4160 Patterson Avenue Baltimore, Maryland 21215 (410) 764-2605 FAX: (410)
Draft for the Medicare Performance Adjustment (MPA) Policy for Rate Year 2021 October 2018 Health Services Cost Review Commission 4160 Patterson Avenue Baltimore, Maryland 21215 (410) 764-2605 FAX: (410)
Global Budget Revenue. October 8, 2015
 Global Budget Revenue October 8, 2015 Goals Understand GBR s connection to the goals of Maryland s Demonstration Understand impact on budgeting and planning for RFP and future phases Answer questions that
Report to the Governor
 Report to the Governor Health Services Cost Review Commission 4160 Patterson Avenue Baltimore, Maryland 21215 (410) 764-2605 October 2016 Table of Contents Introduction... 1 The New All-Payer Model with
Analysis of 340B Disproportionate Share Hospital Services to Low- Income Patients
 Analysis of 340B Disproportionate Share Hospital Services to Low- Income Patients March 12, 2018 Prepared for: 340B Health Prepared by: L&M Policy Research, LLC 1743 Connecticut Ave NW, Suite 200 Washington,
Final Recommendation for the Medicare Performance Adjustment (MPA) for Rate Year 2020
 for Rate Year 2020") Final Recommendation for the Medicare Performance Adjustment (MPA) for Rate Year 2020 November 13, 2017 Health Services Cost Review Commission 4160 Patterson Avenue Baltimore, Maryland 21215 (410) 764-2605
Final Recommendation for the Medicare Performance Adjustment (MPA) for Rate Year 2020 November 13, 2017 Health Services Cost Review Commission 4160 Patterson Avenue Baltimore, Maryland 21215 (410) 764-2605
hfma Maryland Chapter New All-Payer Model for Maryland Maryland Health Services Cost Review Commission
 hfma Maryland Chapter New All-Payer Model for Maryland Maryland Health Services Cost Review Commission October 2013 1 HSCRC Preparation for New All Payer Hospital Model Maryland prepared updated application
MEDICARE FFY 2017 PPS PROPOSED RULES OVERVIEW OHA Finance/PFS Webinar Series. May 10, 2016
 MEDICARE FFY 2017 PPS PROPOSED RULES OVERVIEW 2016 OHA Finance/PFS Webinar Series May 10, 2016 Spring is Medicare PPS Proposed Rules Season Inpatient Hospital Long-Term Acute Care Hospital Inpatient Rehabilitation
paymentbasics The IPPS payment rates are intended to cover the costs that reasonably efficient providers would incur in furnishing highquality
 Hospital ACUTE inpatient services system basics Revised: October 2015 This document does not reflect proposed legislation or regulatory actions. 425 I Street, NW Suite 701 Washington, DC 20001 ph: 202-220-3700
Prepared for North Gunther Hospital Medicare ID August 06, 2012
 Prepared for North Gunther Hospital Medicare ID 000001 August 06, 2012 TABLE OF CONTENTS Introduction: Benchmarking Your Hospital 3 Section 1: Hospital Operating Costs 5 Section 2: Margins 10 Section 3:
Policies for Controlling Volume January 9, 2014
 Policies for Controlling Volume January 9, 2014 The Maryland Hospital Association Policies for controlling volume Introduction Under the proposed demonstration model, the HSCRC will move from a regulatory
Medicare Home Health Prospective Payment System Calendar Year 2015
 Proposed Rule Summary Medicare Home Health Prospective Payment System Calendar Year 2015 August 2014 1 P age TABLE OF CONTENTS Overview, Resources and Comment Submission... 1 Home Health Payment Rates...
Indiana Hospital Assessment Fee -- DRAFT
 Indiana Hospital Assessment Fee -- DRAFT September 27, 2011 Inpatient Fee The initial Indiana Inpatient Hospital Fee applies to inpatient days from each hospital's most recent FYE as taken from the cost
Overview of the HSCRC
 Overview of the HSCRC William J. Mooney, Jr. Memorial Education Series December 4, 2014 Arin Foreman Manager KPMG LLP What is the HSCRC? Health Services Cost Review Commission State regulatory commission
State of Kansas Department of Social and Rehabilitation Services Department on Aging Kansas Health Policy Authority
 State of Kansas Department of Social and Rehabilitation Services Department on Aging Kansas Health Policy Authority Notice of Proposed Nursing Facility Medicaid Rates for State Fiscal Year 2010; Methodology
Medicaid Hospital Incentive Payments Calculations
 Medicaid Hospital Incentive Payments Calculations Note: This guidance is intended to assist hospitals and others in understanding Medicaid hospital incentive payment calculations. However, all hospitals
Medicare Home Health Prospective Payment System
 Medicare Home Health Prospective Payment System Payment Rule Brief Final Rule Program Year: CY 2013 Overview On November 8, 2012, the Centers for Medicare and Medicaid Services (CMS) officially released
Working Paper Series
 The Financial Benefits of Critical Access Hospital Conversion for FY 1999 and FY 2000 Converters Working Paper Series Jeffrey Stensland, Ph.D. Project HOPE (and currently MedPAC) Gestur Davidson, Ph.D.
HOT ISSUES FACING HOME HEALTH & HOSPICE AGENCIES. Luke James Chief Strategy Officer Encompass Home Health & Hospice
 HOT ISSUES FACING HOME HEALTH & HOSPICE AGENCIES Luke James Chief Strategy Officer Encompass Home Health & Hospice Hospice Challenges Past & Present Face-to-Face (F2F) Implementation Sequestration Cuts
kaiser medicaid and the uninsured commission on O L I C Y
 P O L I C Y B R I E F kaiser commission on medicaid and the uninsured 1330 G S T R E E T NW, W A S H I N G T O N, DC 20005 P H O N E: (202) 347-5270, F A X: ( 202) 347-5274 W E B S I T E: W W W. K F F.
For further information call: Robert B. Murray * For release 1:30 p.m. EST * Wednesday, July 6, 2005
 For further information call: Robert B. Murray * For release 1:30 p.m. EST 410-764-2605 * Wednesday, July 6, 2005 Average Amount Paid For A Hospital Stay in Maryland The rate of increase in charges for
Decrease in Hospital Uncompensated Care in Michigan, 2015
 Decrease in Hospital Uncompensated Care in Michigan, 2015 July 2017 Introduction The Affordable Care Act (ACA) expanded access to health insurance coverage for Michigan residents in 2014 through the creation
State of Rural Healthcare In US
 State of Rural Healthcare In US According to the American Hospital Association (AHA): There are 5564 registered hospital in US 4862 are considered community hospitals 1829 are rural hospitals Aging Population
Medicare Fee-For Service Provider Utilization & Payment Data Inpatient Public Use File: A Methodological Overview
 Medicare Fee-For Service Provider Utilization & Payment Data Inpatient Public Use File: A Methodological Overview May 30, 2014 Prepared by: The Centers for Medicare and Medicaid Services, Office of Information
Technical Overview of HCIP/CCIP
 Technical Overview of HCIP/CCIP Using Care Redesign to Align Provider Incentives Presentation to HFMA, Maryland Chapter HSCRC Care Redesign Summit August 18, 2017 Facilitators Nicole Stallings Vice President,
paymentbasics Defining the inpatient acute care products Medicare buys Under the IPPS, Medicare sets perdischarge
 Hospital ACUTE inpatient services system basics Revised: October 2007 This document does not reflect proposed legislation or regulatory actions. 601 New Jersey Ave., NW Suite 9000 Washington, DC 20001
Hospital Rate Setting
 Hospital Rate Setting Calendar Year 2014 Wisconsin Department of Health Services Division of Health Care Access and Accountability Bureau of Fiscal Management September 6, 2013 1 Agenda 1. Introduction
Guidance for Developing Payment Models for COMPASS Collaborative Care Management for Depression and Diabetes and/or Cardiovascular Disease
 Guidance for Developing Payment Models for COMPASS Collaborative Care Management for Depression and Diabetes and/or Cardiovascular Disease Introduction Within the COMPASS (Care Of Mental, Physical, And
The Health Services Cost Review Commission s (HSCRC) global budget revenue contracts state:
 global budget revenue contracts state:") Global Budget Revenue (GBR) Reporting on Investment in Infrastructure Background The Health Services Cost Review Commission s (HSCRC) global budget revenue contracts state: The Hospital shall provide an
Global Budget Revenue (GBR) Reporting on Investment in Infrastructure Background The Health Services Cost Review Commission s (HSCRC) global budget revenue contracts state: The Hospital shall provide an
Quality Outcomes and Data Collection
 Quality Outcomes and Data Collection Presented By: Joanne Jones Director, Clinical Consulting Services August 30, 2016 Quality Measurement in LTC CMS Nursing Home Compare 5 Star Rating System New measures
Medicare P4P -- Medicare Quality Reporting, Incentive and Penalty Programs
 Medicare P4P -- Medicare Quality Reporting, Incentive and Penalty Programs Presenter: Daniel J. Hettich King & Spalding; Washington, DC dhettich@kslaw.com 1 I. Introduction Evolution of Medicare as a Purchaser
MI Health Link Calendar Year 2016 Medicaid Capitation Rate Development
 MI Health Link Calendar Year 2016 Medicaid Capitation Rate Development January 1, 2016 through December 31, 2016 State of Michigan Department of Health and Human Services Prepared for: Penny Rutledge Director,
Summary of U.S. Senate Finance Committee Health Reform Bill
 Summary of U.S. Senate Finance Committee Health Reform Bill September 2009 The following is a summary of the major hospital and health system provisions included in the Finance Committee bill, the America
Final Recommendation for the Potentially Avoidable Utilization Savings Policy for Rate Year 2018
 Final Recommendations for the Potentially Avoidable Utilization Policy Final Recommendation for the Potentially Avoidable Utilization Policy for Rate Year 2018 June 14, 2017 Health Services Cost Review
Medi-Cal APR-DRG Updates. Medi-Cal Updates. Agenda. Medi-Cal APR-DRG Updates Quality Assurance Fee (QAF) Program
 Program") Medi-Cal Updates Amber Ott California Hospital Association Agenda Medi-Cal APR-DRG Updates Quality Assurance Fee (QAF) Program Current QAF Law (SB239) Prop 52 Medicaid Managed Care Final Rules QAF 5 Development
Medi-Cal Updates Amber Ott California Hospital Association Agenda Medi-Cal APR-DRG Updates Quality Assurance Fee (QAF) Program Current QAF Law (SB239) Prop 52 Medicaid Managed Care Final Rules QAF 5 Development
August 25, Dear Ms. Verma:
 Seema Verma Administrator Centers for Medicare & Medicaid Services Hubert H. Humphrey Building 200 Independence Avenue, S.W. Room 445-G Washington, DC 20201 CMS 1686 ANPRM, Medicare Program; Prospective
Ohio Hospital Association Finance Committee 2018 Hospital Inpatient Reimbursement Recommendations
 Ohio Hospital Association Finance Committee 2018 Hospital Inpatient Reimbursement Recommendations Freddie L. Johnson, JD, MPA Chief Medical Services & Compliance Officer August 10, 2017 2018 Inpatient
Medicare Skilled Nursing Facility Prospective Payment System
 Final Rule Summary Medicare Skilled Nursing Facility Prospective Payment System Program Year: FY2019 August 2018 1 TABLE OF CONTENTS Overview and Resources... 2 SNF Payment Rates... 2 Wage Index and Labor-Related
Estimated Decrease in Expenditure by Service Category
 Public Notice for June 2009 Release PUBLIC NOTICE COLORADO MEDICAID Department of Health Care Policy and Financing Fee-for-Service Provider Payments Effective July 1, 2009, in an effort to reduce expenditures
DRAFT Complex and Chronic Care Improvement Program Template. (Not approved by CMS subject to continuing review process)
") DRAFT Complex and Chronic Care Improvement Program Template Performance Year 2017 (Not approved by CMS subject to continuing review process) 1 Page A. Introduction The Complex and Chronic Care Improvement
DRAFT Complex and Chronic Care Improvement Program Template Performance Year 2017 (Not approved by CMS subject to continuing review process) 1 Page A. Introduction The Complex and Chronic Care Improvement
BILLIONS IN FUNDING CUTS THREATEN CARE AT NATION'S ESSENTIAL HOSPITALS
 POLICY BRIEF BILLIONS IN FUNDING CUTS THREATEN CARE Authored by: America s Essential Hospitals staff ESSENTIAL HOSPITALS TARGETED The U.S. health care system is evolving to meet the demands of the Affordable
Inpatient Hospital Rates Rebasing Report
 This document is made available electronically by the Minnesota Legislative Reference Library as part of an ongoing digital archiving project. http://www.leg.state.mn.us/lrl/lrl.asp Inpatient Hospital
Principles for Market Share Adjustments under Global Revenue Models
 Principles for Market Share Adjustments under Global Revenue Models Introduction The Market Share Adjustments (MSAs) mechanism is part of a much broader set of tools that link global budgets to populations
HOME DIALYSIS REIMBURSEMENT AND POLICY. Tonya L. Saffer, MPH Senior Health Policy Director National Kidney Foundation
 HOME DIALYSIS REIMBURSEMENT AND POLICY Tonya L. Saffer, MPH Senior Health Policy Director National Kidney Foundation Objectives Understand the changing dynamics of use of home dialysis Know the different
GENERAL ASSEMBLY OF NORTH CAROLINA SESSION SENATE DRS15110-MGx-29G (01/14) Short Title: HealthCare Cost Reduction & Transparency.
 Short Title: HealthCare Cost Reduction & Transparency.") S GENERAL ASSEMBLY OF NORTH CAROLINA SESSION 01 SENATE DRS-MGx-G (01/1) FILED SENATE Mar, 01 S.B. PRINCIPAL CLERK D Short Title: HealthCare Cost Reduction & Transparency. (Public) Sponsors: Referred to:
S GENERAL ASSEMBLY OF NORTH CAROLINA SESSION 01 SENATE DRS-MGx-G (01/1) FILED SENATE Mar, 01 S.B. PRINCIPAL CLERK D Short Title: HealthCare Cost Reduction & Transparency. (Public) Sponsors: Referred to:
Performance Measurement Work Group Meeting 10/18/2017
 Performance Measurement Work Group Meeting 10/18/2017 Welcome to New Members QBR RY 2020 DRAFT QBR Policy Components QBR Program RY 2020 Snapshot QBR Consists of 3 Domains: Person and Community Engagement
STATE OF MARYLAND DEPARTMENT OF HEALTH AND MENTAL HYGIENE
 STATE OF MARYLAND DEPARTMENT OF HEALTH AND MENTAL HYGIENE John M. Colmers Chairman Herbert S. Wong, Ph.D. Vice-Chairman George H. Bone, M.D. Stephen F. Jencks, M. D., M.P.H. Jack C. Keane Bernadette C.
Methods for Monitoring Total Cost of Care: Maryland s All-Payer Model
 Methods for Monitoring Total Cost of Care: Maryland s All-Payer Model Health Services Cost Review Commission Call for Technical Papers January 10, 2014 kpmg.com Content Monitoring total cost of care 1
Medicaid Supplemental Hospital Funding Programs Fiscal Year
 Fiscal Year 2014-2015 General Revenue Grants and Donations Trust Fund Medical Care Trust Fund Total Rural Proportional Primary Care Hospitals Trauma Level I Trauma Level II or Pediatric Trauma Trauma Level
Division of Health Care Financing and Policy
 Division of Health Care Financing and Policy Presentation to the Legislative Subcommittee on Post Acute Care in Nevada February 2016 1 Topics of Discussion Post acute care-types of services Current rate
REPORT OF THE COUNCIL ON MEDICAL SERVICE. Hospital-Based Physicians and the Value-Based Payment Modifier (Resolution 813-I-12)
") REPORT OF THE COUNCIL ON MEDICAL SERVICE CMS Report -I- Subject: Presented by: Referred to: Hospital-Based Physicians and the Value-Based Payment Modifier (Resolution -I-) Charles F. Willson, MD, Chair
REPORT OF THE COUNCIL ON MEDICAL SERVICE CMS Report -I- Subject: Presented by: Referred to: Hospital-Based Physicians and the Value-Based Payment Modifier (Resolution -I-) Charles F. Willson, MD, Chair
MEDICARE INPATIENT PSYCHIATRIC FACILITY PROSPECTIVE PAYMENT SYSTEM
 MEDICARE INPATIENT PSYCHIATRIC FACILITY PROSPECTIVE PAYMENT SYSTEM PAYMENT RULE BRIEF PROPOSED RULE Program Year: FFY 2019 OVERVIEW AND RESOURCES The Centers for Medicare & Medicaid Services released the
Grants and Per Capita Funding
 HHS Joint Appropriations Subcommittee Implications of Possible Medicaid Block Grants and Per Capita Funding Steve Owen, Fiscal Research Division March 15, 2017 Presentation Objectives Federal Legislation
Physician Compensation in an Era of New Reimbursement Models
 2014 IHA Annual Membership Meeting Physician Compensation in an Era of New Reimbursement Models Taryn E. Stone Ice Miller LLP (317) 236-5872 taryn.stone@ Agenda Background New Reimbursement Models Trends
Medicare Program; FY 2016 Hospice Wage Index and Payment Rate Update and Hospice Quality Reporting Requirements [CMS-1629-P] Summary of Proposed Rule
![Medicare Program; FY 2016 Hospice Wage Index and Payment Rate Update and Hospice Quality Reporting Requirements [CMS-1629-P] Summary of Proposed Rule](/thumbs/73/68786685.jpg "Medicare Program; FY 2016 Hospice Wage Index and Payment Rate Update and Hospice Quality Reporting Requirements [CMS-1629-P] Summary of Proposed Rule") Medicare Program; FY 2016 Hospice Wage Index and Payment Rate Update and Hospice Quality Reporting Requirements [CMS-1629-P] Summary of Proposed Rule TABLE OF CONTENTS Issue Page I. Introduction and Background
Medicare Program; FY 2016 Hospice Wage Index and Payment Rate Update and Hospice Quality Reporting Requirements [CMS-1629-P] Summary of Proposed Rule TABLE OF CONTENTS Issue Page I. Introduction and Background
Meaningful Use of EHR Technology:
 Meaningful Use of EHR Technology: What Do the New Standards and Certification Criteria Mean for Your Organization? January 20, 2010 Mitchell J. Olejko Ropes & Gray LLP mitchell.olejko@ropesgray.com 415-315-6328
Re: Rewarding Provider Performance: Aligning Incentives in Medicare
 September 25, 2006 Institute of Medicine 500 Fifth Street NW Washington DC 20001 Re: Rewarding Provider Performance: Aligning Incentives in Medicare The American College of Physicians (ACP), representing
State FY2013 Hospital Pay-for-Performance (P4P) Guide
 Guide") State FY2013 Hospital Pay-for-Performance (P4P) Guide Table of Contents 1. Overview...2 2. Measures...2 3. SFY 2013 Timeline...2 4. Methodology...2 5. Data submission and validation...2 6. Communication,
State FY2013 Hospital Pay-for-Performance (P4P) Guide Table of Contents 1. Overview...2 2. Measures...2 3. SFY 2013 Timeline...2 4. Methodology...2 5. Data submission and validation...2 6. Communication,
Regulatory Advisor Volume Eight
 Regulatory Advisor Volume Eight 2018 Final Inpatient Prospective Payment System (IPPS) Rule Focused on Quality by Steve Kowske WEALTH ADVISORY OUTSOURCING AUDIT, TAX, AND CONSULTING 2017 CliftonLarsonAllen
The Home Health Groupings Model (HHGM)
") The Home Health Groupings Model (HHGM) September 5, 017 PRESENTED BY: Al Dobson, Ph.D. PREPARED BY: Al Dobson, Ph.D., Alex Hartzman, M.P.A, M.P.H., Kimberly Rhodes, M.A., Sarmistha Pal, Ph.D., Sung Kim,
The Home Health Groupings Model (HHGM) September 5, 017 PRESENTED BY: Al Dobson, Ph.D. PREPARED BY: Al Dobson, Ph.D., Alex Hartzman, M.P.A, M.P.H., Kimberly Rhodes, M.A., Sarmistha Pal, Ph.D., Sung Kim,
California Community Clinics
 California Community Clinics A Financial and Operational Profile, 2008 2011 Prepared by Sponsored by Blue Shield of California Foundation and The California HealthCare Foundation TABLE OF CONTENTS Introduction
2017/2018. KPN Health, Inc. Quality Payment Program Solutions Guide. KPN Health, Inc. A CMS Qualified Clinical Data Registry (QCDR) KPN Health, Inc.
 KPN Health, Inc.") 2017/2018 KPN Health, Inc. Quality Payment Program Solutions Guide KPN Health, Inc. A CMS Qualified Clinical Data Registry (QCDR) KPN Health, Inc. 214-591-6990 info@kpnhealth.com www.kpnhealth.com 2017/2018
2017/2018 KPN Health, Inc. Quality Payment Program Solutions Guide KPN Health, Inc. A CMS Qualified Clinical Data Registry (QCDR) KPN Health, Inc. 214-591-6990 info@kpnhealth.com www.kpnhealth.com 2017/2018
Moving the Dial on Quality
 Moving the Dial on Quality Washington State Medical Oncology Society November 1, 2013 Nancy L. Fisher, MD, MPH CMO, Region X Centers for Medicare and Medicaid Serving Alaska, Idaho, Oregon, Washington
DOCUMENTATION OF MANAGED SPECIALTY SERVICES AND SUPPORTS WAIVER CAPITATION RATES QUARTERS 1 AND 2 OF STATE FISCAL YEAR 2016
 Milliman Client Report DOCUMENTATION OF MANAGED SPECIALTY SERVICES AND SUPPORTS WAIVER CAPITATION RATES QUARTERS 1 AND 2 OF STATE FISCAL YEAR 2016 State of Michigan Department of Health and Human Services
December 14, [Sent via CY 2016 Family Care Final Capitation Rate Report.
 15800 Bluemound Road Suite 100 Brookfield, WI 53005 USA Tel +1 262 784 2250 Fax +1 262 923 3680 milliman.com December 14, 2015 Mr. Grant Cummings Benefit Rate and Finance Section Bureau of Long Term Care
Minnesota Statewide Quality Reporting and Measurement System: Quality Incentive Payment System Framework
 Minnesota Statewide Quality Reporting and Measurement System: Quality Incentive Payment System Framework AUGUST 2017 Minnesota Statewide Quality Reporting and Measurement System: Quality Incentive Payment
Ch COUNTY NURSING FACILITY SERVICES CHAPTER COUNTY NURSING FACILITY SERVICES
 Ch. 1189 COUNTY NURSING FACILITY SERVICES 55 1189.1 CHAPTER 1189. COUNTY NURSING FACILITY SERVICES Subchap. Sec. A. GENERAL PROVISIONS... 1189.1 B. ALLOWABLE PROGRAM COSTS AND POLICIES... 1189.51 C. COST
Inpatient Hospital Rates Rebasing Report
 This document is made available electronically by the Minnesota Legislative Reference Library as part of an ongoing digital archiving project. http://www.leg.state.mn.us/lrl/lrl.asp Inpatient Hospital
The Budget: Maximizing Federal Reimbursement For Parolee Mental Health Care Summary
 The 2013-14 Budget: Maximizing Federal Reimbursement For Parolee Mental Health Care MAC Taylor Legislative Analyst MAY 6, 2013 Summary Historically, the state has spent tens of millions of dollars annually
2016 Edition. Upper Payment Limits and Medicaid Capitation Rates for Programs of All-Inclusive Care for the Elderly (PACE )
") 2016 Edition Upper Payment Limits and Medicaid Capitation Rates for Programs of All-Inclusive Care for the Elderly (PACE ) R ABSTRACT The Program of All-Inclusive Care for the Elderly (PACE ) is a federal
2016 Edition Upper Payment Limits and Medicaid Capitation Rates for Programs of All-Inclusive Care for the Elderly (PACE ) R ABSTRACT The Program of All-Inclusive Care for the Elderly (PACE ) is a federal
MACRA for Critical Access Hospitals. Tuesday, July 26, 2016 Webinar
 MACRA for Critical Access Hospitals Tuesday, July 26, 2016 Webinar MACRA presenters Harold D. Miller, President & CEO CHQPR Claudia Sanders, Sr. Vice President, Policy Development Andrew Busz, Policy Director,
Final Rule Summary. Medicare Skilled Nursing Facility Prospective Payment System Fiscal Year 2016
 Final Rule Summary Medicare Skilled Nursing Facility Prospective Payment System Fiscal Year 2016 August 2015 Table of Contents Overview and Resources... 2 SNF Payment Rates... 2 Effect of Sequestration...
Payment Rule Summary. Medicare Inpatient Psychiatric Facility Prospective Payment System: Update Notice for Federal Fiscal Year 2013
 Payment Rule Summary Medicare Inpatient Psychiatric Facility Prospective Payment System: Update Notice for Federal Fiscal Year 2013 August 2012 Table of Contents Overview and Resources... 2 Inpatient Psychiatric
Overview of the EHR Incentive Program Stage 2 Final Rule published August, 2012
 I. Executive Summary and Overview (Pre-Publication Page 12) A. Executive Summary (Page 12) 1. Purpose of Regulatory Action (Page 12) a. Need for the Regulatory Action (Page 12) b. Legal Authority for the
HEALTH PROFESSIONAL WORKFORCE
 HEALTH PROFESSIONAL WORKFORCE (SECTION-BY-SECTION ANALYSIS) (Information compiled from the Democratic Policy Committee (DPC) Report on The Patient Protection and Affordable Care Act and the Health Care
Better Health Care for all Floridians. July 13, 2012
 RICK SCOTT GOVERNOR Better Health Care for all Floridians ELIZABETH DUDEK SECRETARY July 13, 2012 Prospective Vendor: Subject: Solicitation Number: AHCA ITN 004-12/13 Title: Statewide Medicaid Managed
I. Cost Finding and Cost Reporting
 FLORIDA TITLE XIX INPATIENT HOSPITAL REIMBURSEMENT PLAN VERSION XLIV EFFECTIVE DATE July 1, 2017 I. Cost Finding and Cost Reporting A. Each hospital participating in the Florida Medicaid program shall
Department of Health and Mental Hygiene Mental Hygiene Administration Community Services Program
 Performance Audit Report Department of Health and Mental Hygiene Mental Hygiene Administration Community Services Program Rate Structure and Inadequate Oversight May Have Contributed to an Increase in
Proposed fy17 LTCH PPS: New rules for Quality & Referrals
 Proposed fy17 LTCH PPS: New rules for Quality & Referrals Mary Dalrymple Managing Director, LTRAX Kristen Smith, MHA, PT Senior Consultant, Fleming-AOD Overview Objectives Describe updates to the LTCH
Minnesota Statewide Quality Reporting and Measurement System: Quality Incentive Payment System
 Minnesota Statewide Quality Reporting and Measurement System: Quality Incentive Payment System JUNE 2015 DIVISION OF HEALTH POLICY/HEALTH ECONOMICS PROGRAM Minnesota Statewide Quality Reporting and Measurement
Hospital Inpatient Quality Reporting (IQR) Program
 Program") Hospital Readmissions Reduction Program Early Look Hospital-Specific Reports Questions and Answers Transcript Speakers Tamyra Garcia Deputy Division Director Division of Value, Incentives, and Quality
Hospital Readmissions Reduction Program Early Look Hospital-Specific Reports Questions and Answers Transcript Speakers Tamyra Garcia Deputy Division Director Division of Value, Incentives, and Quality
Preventable Readmissions Payment Strategies
 Preventable Readmissions Payment Strategies 3M 2007. All rights reserved. Strategy to reduce readmissions and increase quality needs to have the following elements A tool to identify preventable readmissions
John W. Gahan Jr. Department of Health
 John W. Gahan Jr. Department of Health Indigent Care Pool Electronic Health Record Medicaid Reimbursement FQHC s Other Clinics Appeals Meaningful Use Primary Medical Home General Billing 2010 AHCF-1 Questions
Healthcare Reimbursement Change VBP -The Future is Now
 Healthcare Reimbursement Change VBP -The Future is Now 1 On the Move Volume/ Fee-for-Service Fee-for-service reimbursement High quality not rewarded No shared financial risk Stand-alone systems can thrive
Legal Issues in Medicare/Medicaid Incentive Programss
 Meaningful Use Legal Issues in Medicare/Medicaid Incentive Programss Jane Eckels, Esq. Partner, Health Information Technology Group Deputy Chair, Technology, ebusiness and Digital Media Group Overview
The President s and Other Bipartisan Proposals to Reform Medicare: Post-Acute Care (PAC) Reform. Summary
 Reform. Summary") Current Law The President s and Other Bipartisan Proposals to Reform Medicare: Post-Acute Care (PAC) Reform Summary Home Health Agencies Under current law, beneficiaries who are generally restricted to
Current Law The President s and Other Bipartisan Proposals to Reform Medicare: Post-Acute Care (PAC) Reform Summary Home Health Agencies Under current law, beneficiaries who are generally restricted to
REPORT OF THE BOARD OF TRUSTEES
 REPORT OF THE BOARD OF TRUSTEES B of T Report 21-A-17 Subject: Presented by: Risk Adjustment Refinement in Accountable Care Organization (ACO) Settings and Medicare Shared Savings Programs (MSSP) Patrice
Report to the Greater Milwaukee Business Foundation on Health
 Report to the Greater Milwaukee Business Foundation on Health Key Factors Influencing 2003 2012 Southeast Wisconsin Commercial Payer Hospital Payment Levels Presented by: Keith Kieffer, CPA, RPh Management
Final Rule Summary. Medicare Skilled Nursing Facility Prospective Payment System Fiscal Year 2017
 Final Rule Summary Medicare Skilled Nursing Facility Prospective Payment System Fiscal Year 2017 August 2016 Table of Contents Overview and Resources... 2 Skilled Nursing Facility (SNF) Payment Rates...
California s Current Section 1115 Waiver & Its Impact on the Public Hospital Safety Net
 February 2010 California s Current Section 1115 Waiver & Its Impact on the Public Hospital Safety Net Executive Summary The current Section 1115 Medicaid waiver, which was intended to stabilize California
Questions and Answers on the CMS Comprehensive Care for Joint Replacement Model
 Questions and Answers on the CMS Comprehensive Care for Joint Replacement Model MEGGAN BUSHEE, ESQ. 704.343.2360 mbushee@mcguirewoods.com 201 North Tryon Street, Suite 3000 Charlotte, North Carolina 28202-2146
BOARD OF TRUSTEES MINNESOTA STATE COLLEGES AND UNIVERSITIES BOARD ACTION. FY2006 Operating Budget and FY2007 Outlook
 BOARD OF TRUSTEES MINNESOTA STATE COLLEGES AND UNIVERSITIES BOARD ACTION FY2006 Operating Budget and FY2007 Outlook BACKGROUND The development of the FY2006 operating budget began a year ago as Minnesota
time to replace adjusted discharges
 REPRINT May 2014 William O. Cleverley healthcare financial management association hfma.org time to replace adjusted discharges A new metric for measuring total hospital volume correlates significantly
Minnesota Statewide Quality Reporting and Measurement System: Quality Incentive Payment System
 Minnesota Statewide Quality Reporting and Measurement System: Quality Incentive Payment System JUNE 2016 HEALTH ECONOMICS PROGRAM Minnesota Statewide Quality Reporting and Measurement System: Quality Incentive
Dual Eligibles: Medicaid s Role in Filling Medicare s Gaps
 I S S U E P A P E R kaiser commission on medicaid and the uninsured March 2004 Dual Eligibles: Medicaid s Role in Filling Medicare s Gaps In 2000, over 7 million people were dual eligibles, low-income
Division C: Increasing Choice, Access, and Quality in Health Care for Americans TITLE XV: Provisions Relating to Medicare Part A
 Division C: Increasing Choice, Access, and Quality in Health Care for Americans TITLE XV: Provisions Relating to Medicare Part A Sec. 15001. Development of Medicare study for HCPCS versions of MS-DRG codes
Chapter 7 Section 1. Hospital Reimbursement - TRICARE Inpatient Mental Health Per Diem Payment System
 Mental Health Chapter 7 Section 1 Hospital Reimbursement - TRICARE Inpatient Mental Health Per Diem Payment System Issue Date: November 28, 1988 Authority: 32 CFR 199.14(a) 1.0 APPLICABILITY This policy
4160 Patterson Avenue, Baltimore, Maryland Phone: Fax: Toll Free: hscrc.maryland.
 4160 Patterson Avenue, Baltimore, Maryland 21215 Phone: 410-764-2605 Fax: 410-358-6217 Toll Free: 1-888-287-3229 hscrc.maryland.gov 536th MEETING OF THE HEALTH SERVICES COST REVIEW COMMISSION December
Recommendation to Adopt a Severity-Adjusted Grouper
 Recommendation to Adopt a Severity-Adjusted Grouper Health Services Cost Review Commission 4160 Patterson Avenue Baltimore, MD 21215 (410) 764-2605 Fax (410) 358-6217 June 2, 2004 This recommendation is