Understanding Population Health in Aurora
|
|
|
- Lilian Harrison
- 6 years ago
- Views:
Transcription

1 2014 Understanding Population Health in Aurora Michaela Brtnikova Erin Bomberger Mary Newell Chris Tyszka Michael Wallingford 0
2 1. Executive Summary The aim of this report was to identify health issues related to Aurora so as to aid Aurora Health Access (AHA) in determining priorities and evaluating strategic directions. An abbreviated community health assessment was conducted by students of the Colorado School of Public Health (CSPH) and presented to the executive members of AHA and community leaders in order to facilitate a brainstorming of strengths, assets and resources of Aurora and a prioritization of health concerns. Results from this process will inform AHA in determining future priorities and directions. Background & Partnership AHA is community coalition comprised of community members, healthcare providers, and multiple agencies committed to improving health inequities in Aurora, Colorado. AHA representatives included: Rich McLean Board Chair Denise Denton Executive Director Led by the CSPH faculty member, Dr. Holly Wolf and teaching assistant, Talia Brown, MPH students, Michaela Brtnikova, Erin Bomberger, Mary Newell, Michael Wallingford and Chris Tyszka partnered with the AHA team to develop and clarify the scope of work. The CSPH team held one in-person meeting to present the modified health assessment and provide background for the AHA members to prioritize health concerns in Aurora. Methods Collection and Analysis of Secondary Data Secondary data from Arapahoe, Adams and Douglas counties were used to calculate weighted proportions of selected variables based on Aurora s population size within each county. Mortality, morbidity and Years of Potential Life Lost (YPLL) were selected as the driving health outcomes for the health assessment. Based on the Health Equity Model framework, eleven health indicators were selected based on significant differences between Aurora and the state of Colorado and a literature review of risk 1
3 factors associated with all three health outcome measures. As a result, ten health concerns were formulated and later presented to the AHA members. Ranking to identify top health concerns in Aurora A Modified Hanlon Method was used to prioritize the ten Aurora health concerns based on the assessment of magnitude, severity and feasibility. Magnitude scores were determined by the percent of Aurora s population affected. Severity scores were determined by the frequency with which the health concern was associated with a health outcome involving mortality, morbidity, and YPLL. Magnitude and severity scores were predetermined by the student group and verified during the community engagement event. The method utilized to determine the feasibility scores and prioritization are discussed in the Community Engagement section, as these steps of the modified Hanlon Method of prioritization were conducted with the participants of this event. Community Engagement A presentation of the modified community assessment was followed by a brainstorming exercise and a feasibility assessment. The brainstorming exercise enabled the participants to identify Aurora s strengths and assets based on community capacity by answering the question, In thinking about the top 10 health concerns, what resources, strengths, and assets does the city of Aurora have that can be used to impact these concerns? A list was generated and used as a contextual basis for determining feasibility. A feasibility exercise enabled participants to score the feasibility of each health concern. After discussing the magnitude and severity scores of each health concern, each participant was asked to score the ten health concerns individually based on the following components of feasibility: political climate, will to change, intervention effectiveness, economic viability, and capacity to do work. An aggregate score was calculated based on magnitude, severity, and feasibility. Health concerns were then prioritized in order of the highest ranking score. 2
4 Findings Aurora s Demographics Aurora has a younger, reportedly growing, and a more diverse population living in areas with high poverty when compared to Colorado. This combination has implications for future healthcare systems functioning as well as population health. Diseases are often associated with population characteristics. If the population composition of Aurora continues to increase in age and diversity, with little or no change in poverty levels, healthcare infrastructure will have to accommodate and prepare for this changing population. Modified Health Assessment In the initial phase of the modified health assessment for the city of Aurora, three health outcomes were examined: mortality, morbidity, and YPLL. Ten Leading Causes of Mortality, Morbidity, and YPLL in Aurora Rank Mortality Morbidity YPLL 1 Cancer Stroke Unintentional Injury 2 Heart Disease Heart Disease Cancer 3 Chronic Lower Respiratory Disease Acute Myocardial Infarction Suicide 4 Unintentional Injuries Heart Failure Heart Disease 5 Alzheimer's Disease Adult Diabetes Perinatal Period Conditions 6 Motor vehicle Accidents Cerebrovascular Disease Hospitalization Homicide/Legal Intervention 7 Suicide Invasive Cancer Chronic Liver Disease/Cirrhosis 8 Congenital Malformations, Diabetes Congenital anomalies Deformations, and Chromosomal Abnormalities 9 Chronic Liver Disease Breast cancer Cerebrovascular Diseases 10 Influenza Prostate cancer Diabetes Mellitus Health indicators were used to describe the health of adults in Aurora, and two indicators were used to describe the child population. These indicators were compared to Colorado data and Healthy People 2020 (HP 2020) target goals, when applicable. 3
5 The health indicators represent the overall health status of Aurora s residents. Poverty, tobacco use, and mental health affect less of the population in Aurora than Colorado, but remain significant to health outcomes. Lower high school completion rates, fewer adults and children with health insurance, greater percentages of adult and childhood obesity and a larger proportion of the population who are physically inactive disproportionately affect Aurora, highlighting disparities and unmet needs. The top ten health concerns based on a literature review and indicators associated with the health outcomes of mortality, morbidity, and YPLL were: Regular Healthcare Provider, Educational Attainment, Healthcare Coverage, Obesity, Tobacco Use, Poverty, Physical Inactivity, Mental Health, Cancer, and Heart Disease. Based on the health indicators and health outcomes, the top ten health concerns were identified for Aurora and compared to the Northwest Aurora (NWA) report from This comparison showed that health care and educational attainment were top ranking health concerns for both Aurora and NWA; poverty and mental health were also important concerns for both. Prioritization A final prioritization based on the Hanlon Method ranked the top 10 health concerns. The following table shows prioritization based on the aggregate score in the far right column. Rank Health Concern Aggregate Score 1. Regular Healthcare Provider Educational Attainment Healthcare Coverage Obesity Tobacco Use Poverty Physical Inactivity 9 8. Mental Health 9 9. Cancer Heart Disease 7 4
6 Regular healthcare provider together with healthcare coverage, and education were rated the highest for Aurora. The comparison to NWA produced similar findings with access to health care and education previously prioritized as top health concerns affecting NWA. This is important for AHA to consider when deciding to expand their efforts to the entire population of Aurora. Brainstorming City of Aurora s Resources, Strengths, and Assets A brainstorming session identified Aurora s strengths, assets, and resources related to the health concerns. A list of 45 items was brainstormed and categorized as healthrelated agencies and organizations, community and organizations, government organizations and representatives, and the built environment. Recommendations It is recommended that AHA move forward on these health concerns focusing on the entire City of Aurora. Expand Target Population of AHA to the City of Aurora Consider a citywide approach to addressing identified health concerns Access to Healthcare: Healthcare coverage/having regular healthcare providers Explore dissemination of healthcare information methods such as mobile health apps, social media, and texting. Create collaboration between health departments, community health organization, and community organizations that are health assets in Aurora. Develop a health resource directory for all of Aurora. Monitor the impact the ACA has on health insurance coverage in Aurora. Educational attainment Promote protective factors, such as school and family connectedness, as an effective means of improving school retention rates. 5
7 Incorporate health educators into schools to reduce dropout rates. Reframe low educational attainment as a health problem. Obesity Develop a resource guide for free or low-cost physical activity opportunities and nutritional education in and around Aurora. Advocate breastfeeding and partner with breastfeeding friendly businesses, childcare centers, and hospitals that protect, promote, and support breastfeeding. Support and collaborate with Healthy Eating and Active Living (HEAL) programs that are being implemented in the community and schools. Emphasize existing fitness infrastructure throughout Aurora. Additional Recommendations Qualitative data collection for a more comprehensive community health assessment. Healthy People 2020 benchmarks can be used to track changes in Aurora s health status 6
8 Table of Contents 1. Executive Summary 2 2. Acronyms 8 3. Introduction. 9 A Background... 9 B Partnership and Community Information. 9 C Project Description Methods 11 A Collection and analysis of secondary data. 11 B Ranking to identify top health concerns in Aurora 14 C Community engagement and prioritization Findings 18 A Aurora s Demographics. 18 B Modified Health Assessment 24 C Prioritization. 32 D Brainstorming Aurora s Strengths and Assets Conclusions Limitations Recommendations References Appendices.. 45 A Aurora Health Indicator matrix 45 B AHA Informational Handout 46 C Top Health Concerns for Aurora 48 D Magnitude and Severity Assessment 49 E Scope of work 50 F Presentation Slides 56 G Selected Health Indicators for Aurora Health Assessment 79 0
9 2. Acronyms ACA = Affordable Care Act AHA = Aurora Health Access BMI = Body Mass Index BRFSS = Behavioral Risk Factor Surveillance System CDC = Centers for Disease Control and Prevention CDPHE = Colorado Department of Public Health and Environment CHA = Community Health Assessment CHI = Colorado Health Institute CSPH = Colorado School of Public Health HEAL = Healthy Eating Active Living HP 2020 = Healthy People 2020 NACCHO = The National Association of County and City Health Officials NGT = Nominal Group Technique NWA = Northwest Aurora YPLL = Years of potential life lost 1
10 3. Introduction A. Background Aurora Health Aceess (AHA) has had several past partnerships with Colorado School of Public Health (CSPH), Community Health Assessment class in order to make informed decisions throughout their planning process. Previous student groups working with AHA carried out assessments focusing on Northwest Aurora (NWA). This current project widened the scope to focus on the City of Aurora and consisted of two major components, a modified community health assessment and a community engagement event. The modified health assessment aided in identifying health concerns in Aurora, which the student group compared with previously identified NWA health concerns. The community engagement consisted of three parts, presenting a summary of the modified health assessment and comparison, brainstorming Aurora s strengths and assets, and a prioritization of Aurora s health concerns. This information can be used to provide an informed foundation on which to base future strategic directions of AHA. B. Partnership and Community Information CSPH The Fall 2014 student group that partnered with AHA consisted of MPH students Erin Bomberger, Mary Newell, Misha (Michaela) Brtnikova, Chris Tyszka, and Michael Wallingford. The Community Health Assessment faculty, Holly Wolf, and teaching assistant, Talia Brown, supported the student group throughout this partnership. Rich McLean, AHA s board chair, was the primary contact with AHA and Denise Denton, AHA s executive director, was secondary contact. This partnership worked collaboratively to develop a scope of work, identify appropriate secondary data, and facilitate a community engagement event. 2
11 Aurora Health Access Aurora Health Access is a community coalition comprised of community members, healthcare providers, and multiple agencies committed to improving health inequities in Aurora, CO. AHA has identified the current healthcare system in Aurora is not meeting the needs of all its residents. AHA is dedicated to solving this urgent problem while continuing to strengthen community partnerships. AHA is also committed to partnering with the community in order to address the health equity issues and overall health concerns facing the City of Aurora. Northwest Aurora Northwest Aurora is an urban neighborhood located within the Aurora city limits (see Figure 1). NWA has been the focus of AHA priorities due to the high rates of poverty, health inequity, and uninsured/underinsured experienced by the residents. Significant demographic changes over the past 15 years, combined with depressing economic and environmental conditions, have contributed to these high rates. The City of Aurora Aurora is Colorado s third largest city and is primarily urban. As the focus of this project, a thorough description of Aurora s boundaries, population changes and current composition, sociodemographic profile, and the health status of the city are detailed in the Findings section of this report. C. Project Description The goal of this project was to identify key health concerns facing the City of Aurora and create a foundation on which AHA can base future directional planning. The project consisted of two major components, a modified community health assessment and a community engagement event. 3
12 A modified community health assessment (CHA) defined the community, sociodemographics, and produced a list of the leading causes of mortality, morbidity, and years of potential life lost (YPLL) for Aurora based on county level data. This data, in combination with relevant health indicators, were used to identify the top health concerns of the City of Aurora. The CHA results were then used to compare the health concerns of the City of Aurora to the health concerns facing NWA as determined by previous student groups. A second component of this project entailed hosting a community engagement event with members from AHA and interested community organizations. This meeting consisted of presenting findings of the CHA and comparison to NWA, a Nominal Group Technique (NGT) for brainstorming Aurora s strengths, assets, and resources, and a feasibility exercise aiding in the prioritization of health concerns. 4. Methods For the purpose of this report, secondary data were used to assess health concerns in Aurora. Results were compared to NWA and health concerns were later prioritized during a community engagement event. A. Collection and analysis of secondary data The goal of the data collection and analyses was to identify key health concerns for the City of Aurora. Secondary data were collected from multiple sources including the Colorado Department of Public Health and Environment (CDPHE), Colorado Health Information Datasets: Colorado Behavioral Risk Factor Surveillance System (BRFSS), American Community Survey, Small Area Income and Poverty Estimates, Colorado Department of Education; Colorado Health Institute (CHI), and the U.S. Census Bureau. Since the City of Aurora is located in 3 different counties: Arapahoe County, Adams County and Douglas County, and the majority of secondary data available was at the county level, the percentages of the Aurora population within each county, 87.95% in Arapahoe, 12% in Adams, and.05% in Douglas, were identified and used to create weighted proportions for the City of Aurora (City of Aurora, 2014). 4

13 Three major health outcomes were selected as the basis of the health assessment: mortality, morbidity and YPLL. Top ten causes of each health outcome were calculated based on weighted proportions from each county and used to identify associated health indicators. All health outcomes were assessed specifically for the city of Aurora based on three-year aggregate data from (CDPHE, 2014). The Health Equity Model, shown in Figure 1, was used as a framework to select health indicators from social determinants of health and health factors. This framework was selected because it conceptualizes the social determinants of health as life-enhancing resources (such as food supply, housing, economic and social relationships, transportation, education and healthcare), whose distribution across populations over the life span, effectively determines length and quality of life. Figure 1: Health Equity Model Colorado Department of Public Health and Environment, Health Equity Model. (2014). 5
14 Each health indicator was selected based on the following criteria: Literature review of main risk factors associated with ten leading causes of mortality, morbidity, and YPLL, specifically in Aurora Statistically significant difference of the indicator between Colorado and Aurora (assessed based on Arapahoe County measures) Statistical significance was determined by utilizing confidence intervals, when available, for the health indicators. All three counties were analyzed for comparison to the state of Colorado as a whole, but Arapahoe County was chosen for closer evaluation due to the greatest proportion of Aurora residing in this county. When significant differences were found for an indicator, the value for each county was input in a spreadsheet and a weighted calculation (Appendix A) was used for assigning the City of Aurora a value. Due to the lack of available data at the municipal level, confidence intervals were only compared between county and state data. As each indicator was calculated based on weighted proportions from county data, an example of the process of weighting proportions for the indicator of adult obesity is shown below. Example of weighted proportion calculation: Arapahoe county * Adams County * Douglas County = Aurora 87.95% * 12% * 0.05% = Aurora Example: Obesity, Percent of Adults 18+ who are Obese Arapahoe Adams Douglas 21.4% * 87.95% % * 12% % * 0.05% = 21.8% Obesity in Aurora Each weighted health indicator was then compared to similar measures for Colorado and national Healthy People 2020 targets when applicable. The purpose of these comparisons is to better understand the burden of each indicator in the City of Aurora related to relevant populations. 6
15 B. Scoring to identify top health concerns in Aurora All selected health indicators were converted into health concerns and narrowed down to ten based on severity and magnitude score. A description of the criteria for determining severity and magnitude scores follows. Severity All selected health concerns were used to identify an association with the following health outcomes: Leading ten causes of death (mortality data) Leading ten causes of illness (morbidity data) Leading ten causes of YPLL The full matrix of all health concerns and associations with health outcomes is in Appendix A. Severity was scored between 1 and 5 and was based on the seriousness of the health concern identified by the frequency the health concern was associated with the above selected health outcomes (Appendix A). 1= Not Serious (the health problem was associated with less than 3 health events from all, top ten causes of mortality in Aurora, top ten causes of morbidity in Aurora and top 10 causes of YPLL in Aurora) 2= Relatively Not Serious (association with 3-9 health events) 3= Moderately Serious (association with health events) 4= Relatively Serious (association with health events) 5= Very Serious (association with more than 23 events) 7
16 Magnitude Magnitude was scored based on the selected health indicators and the percent of the population in Aurora affected. Magnitude scoring ranged between 1 and 5 as follows: 1= 0% of the population affected 2= up to 9% of the population affected 3 = 10%-20% of the population affected 4= 21%-50% of the population affected 5= Over 50% of the population affected Magnitude scores, as well as severity scores, were both revisited during the community engagement event and verified or adjusted based on the majority of votes from the meeting attendees. Severity and magnitude scores served two purposes: 1) narrow down lengthy list of health indicators to top10 health concerns to present during the community engagement event 2) as part of the composite score that also included feasibility to rank health concerns for prioritization (methods explained in next section). C. Community engagement and prioritization In order to prioritize the top health concerns in Aurora, community leaders from various organizations were invited to participate. First, a summary of the findings from the modified community health assessment was presented to describe the health status of the City of Aurora and illustrate a comparison to the health status of NWA to the participants (Appendix F). Next, the resources, strengths and assets of the city of the City of Aurora were brainstormed to help identify the feasibility of addressing each health concern using the NGT. Finally, a prioritization process using a modified Hanlon Method was facilitated to rank Aurora s top ten health concerns. Informational handouts were provided to participants detailing the top ten causes of mortality, morbidity, and YPLL; the ten health concerns for Aurora; and a guide to the scoring methods of magnitude, severity, and feasibility (Appendix B). 8
17 Brainstorming City of Aurora s Resources, Strengths, and Assets The community leaders who attended the community engagement were asked to participate in a brainstorming exercise. Brainstorming is a CDC recommended technique for generating information and ideas in a group setting in which all members are able to contribute and share their perspectives (Communities for Public Health, n.d.). This CDC guide for brainstorming highlights 5 basic steps: 1. Define the topic 2. Ask group members to generate ideas 3. Record the answers 4. Combine similar or redundant ideas 5. Document the session The purpose of the exercise was to create a comprehensive list of the resources, strengths and assets in the City of Aurora. The question posed to the attendees was: In thinking about the top 10 health concerns, what resources, strengths, and assets does the City of Aurora have that can be used to impact these concerns? Using the NGT as an effective means of generating many ideas in a limited amount of time (National Association of County and City Health Officials [NACCHO], n.d.), the participants were then asked to take a moment to silently and individually write down the resources, strengths and assets they were familiar with to assist AHA in assessing their role. To ensure that each person has the ability to contribute equally to the development of a comprehensive list, NGT employs a round robin-style of brainstorming. Starting at the front of the table, each participant was asked to state one item from their list with the intent of going around the table in this fashion, for several rounds. One student group member defined the topic and asked the members to generate ideas while acting as moderator. One student was responsible for recording the generated ideas; another student documented the brainstorming session. 9
18 Modified Hanlon Method A modified Hanlon Method for Prioritizing Health Problems was used to rank the selected ten health concerns. The Hanlon Method for Prioritizing Health Problems is a complex technique, which was modified for the purposes of this project to a more simplified process still taking into account defined criteria and feasibility factors (NACCHO, n.d.). The Hanlon Method follows 4 steps: 1. Rate against specified criteria 2. Apply the PEARL test 3. Calculate priority scores 4. Rank the Health Problems The first step, rating of magnitude and severity scoring was defined previously in this report. The following sections describe how the 3 remaining steps of the modified Hanlon Technique were utilized for the purposes of this project. Feasibility assessment AHA board members and Aurora community organizational leaders at the meeting assessed feasibility. Each health concern was presented separately with the predetermined severity and magnitude scores assigned by the student group. The student moderator presented the given scores, and asked for agreement or disagreement. When there was disagreement of the assigned score, a quick vote was taken to determine if the score should be modified. When consensus was reached for severity and magnitude, each attendee was then asked to score each of the ten health concerns individually based on the following components of a modified PEARL test of feasibility: Political climate Will to change Intervention effectiveness 10
19 Economic viability Capacity to do work Each participant wrote down a score of 1 to 5 based on AHA's ability to influence each health concern as follows: 1= 1 of the 5 components applies for Aurora 2= 2 of the 5 components apply for Aurora 3= 3 of the 5 components apply for Aurora 4= 4 of the 5 components apply for Aurora 5= 5 of the 5 components apply for Aurora Final prioritization Once all ten health concerns were assigned a feasibility score, an average group feasibility score was calculated and added to the severity and magnitude score to calculate the final (aggregate) score for each health concern for a highest possible total of 15. The highest final score was ranked first and the lowest final score was ranked last resulting in a ranking of health priorities. 5. Findings A. Aurora s Demographics Aurora s geographic boundaries lie within Adams, Arapahoe, and Douglas counties as shown in Figure 2. The city extends to the north as far as 70th Avenue, into Adams County, south to County Line Road, where it slightly crosses into Douglas County, and West to East from Yosemite Street to Schumacher Road, which is predominantly Arapahoe County. Arapahoe and Adams counties contain the majority of Aurora geographically and in population density. Figure 2: Map of Aurora 11

20 Google Maps (2014) The City of Aurora is primarily an urban city. The U.S. Census Bureau estimates the 2013 population to be approximately 345,800, making it the third largest city in Colorado and the fifty-fifth largest in the country. Aurora is roughly the size of New Orleans and Tampa (City of Aurora, 2014). According to 2010 Census data (see Figure 3), the age distribution of persons in the City of Aurora is as follows: children under the age of 5 represent 8.4%, persons, under the age of 19 represents 29.8% of the population, persons 65 and older total 8.9% of the population, this means over 60% of Aurora s population is between the ages of 20 and 64 (U.S. Census Bureau, 2014). This means 12
21 the City of Aurora has a relatively young population, with only 8.9% of the population being 65 or older compared to Colorado s proportion of 10.9%. Having a younger population means that the top 10 leading causes of morbidity may have an impact on the City of Aurora's healthcare system for extended years. Figure 3: Population Age Distribution of Aurora and Colorado Aurora Colorado 18% 16% 14% 12% 10% 8% 6% 4% 2% 0% Under 5 years 5-9 years years years years years years years years years years years 85 years plus Based on data from United States Census, The City of Aurora has seen dramatic population increase over the last 20 years (see Figure 4). The population in Aurora has increased by almost 50% since 1990, which is represented by the red line in Figure 4. This increase is substantially more than what is seen in Denver, represented by the blue line in the figure below, which is a 28% increase. Since 1990, Aurora's population has grown significantly higher than Denver's increase and even higher than the nearest towns of Thornton, Lakewood, and Arvada (Figure 4). Therefore, the City of Aurora's healthcare system has to accommodate the increasing population size. Figure 4: Population Growth,
22 Aurora Denver Arvada Lakewood Thornton 700, , , , , , , % change since % change since 1990 City of Aurora, Planning & Development Services Department. (2012) Census data for 2010 also report the racial demographics of the City of Aurora as 61.1% white, 15.7% African American or Black, 1.0% American Indian and Alaska Native, 4.9% Asian, 0.3% Native Hawaiian or Other Pacific Islander, 11.7% were some other race, and 5.7% were two or more races; approximately 29% self-report identifying as Hispanic or Latino ethnicity (City of Aurora, 2012) as shown in Figure 5. When considering the overall health status of the City of Aurora residents, it is important to keep in mind that these sociodemographics play a key role in contributing to a population s health outcomes. The percentage for Hispanics is much larger in Aurora than the 19% in Colorado over all. Additionally, Colorado has an African American population of 4.4% (US Census Bureau, 2010), which is almost a quarter of that of the City of Aurora. The diversity seen in the City of Aurora is important when thinking about health outcomes because both Hispanics and African Americans are at a greater risk for certain adverse health conditions (CDC, 2014). 14


.")

23 Figure 5: Racial Composition in Aurora Native Hawaiian or other Pacific Islander, 0% Some other Race, 12% Asian, 5% American Indian or Alaska Black or Native, 1% African American, 16% White, 61% Two or more Races, 6% City of Aurora, Planning & Development Services Department. (2012). Aurora has many areas where greater than 15% of the population is living below the federal poverty level (see Figure 6). A higher proportion of people are living below poverty on the western side of the city, and a concentrated area of poverty in NWA and surrounding area (City of Aurora, 2012). 15
.")


24 Figure 6: Percentage of the Population Living Below Poverty City of Aurora, Planning & Development Services Department. (2012). Aurora has a younger, reportedly growing, and a more diverse population living in areas with high poverty when compared to Colorado. This combination has implications for future healthcare systems functioning as well as population health. Diseases are often associated with population characteristics. With regard to age, nationally, obesity is higher among middle age adults years old (39.5%), than among younger adults 16
25 age (30.3%), or adults over 60 or above (35.4%) (CDC, 2014). And in the U.S., Hispanic and African American populations specifically are at particularly high risk of diabetes, heart disease, high blood pressure, renal disease and stroke (CDC, 2014). Poverty is also inextricably linked to illness and poor health outcomes; indeed to such a degree that childhood poverty affects and influences adult health even if the adult is no longer living in poverty (Economou and Theodossiou, 2011). If the population composition of the City of Aurora continues to increase in age and diversity, with little or no change in poverty levels, healthcare infrastructure will have to accommodate and prepare for this changing population. B. Modified Health Assessment In the initial phase of the modified health assessment for the city of Aurora, three health outcomes were examined: mortality, morbidity, and YPLL at a municipal level. Table 1 presents the top 10 leading causes of all 3 health outcomes. Table 1: Ten Leading Causes of Mortality, Morbidity, and YPLL in Aurora Rank Mortality Morbidity YPLL 1 Cancer Stroke Unintentional Injury 2 Heart Disease Heart Disease Cancer 3 Chronic Lower Respiratory Disease Acute Myocardial Infarction Suicide 4 Unintentional Injuries Heart Failure Heart Disease 5 Alzheimer's Disease Adult Diabetes Perinatal Period Conditions 6 Cerebrovascular Disease 7 8 Suicide Diabetes Motor vehicle Accidents Hospitalization Invasive Cancer Congenital anomalies Homicide/Legal Intervention Chronic Liver Disease/Cirrhosis Congenital Malformations, Deformations, and Chromosomal Abnormalities 9 Chronic Liver Disease Breast cancer Cerebrovascular Diseases 10 Influenza Prostate cancer Diabetes Mellitus Data based on aggregate 3-year data from , CDPHE 17

26 Additionally, nine health indicators were selected based on criteria described in the Methods section to assess health of the adult population in the City of Aurora, which is more than 70% of the entire population. Two more health indicators were added to describe the child population to complete the list for the final analysis. All selected indicators are described below and compared to Colorado state data and HP2020 when available. A description of each indicator as it relates to Aurora is below. 1. Percent of population living below poverty level (Figure 7) This indicator represents the total percent of the population living below the federal poverty level, data from 2012 (CDPHE, 2012). The city of Aurora has less people living below the poverty level when compared to Colorado. Figure 7: Proportion of People Living Below Poverty Level 20% 18% 16% 14% 12% 10% 8% 6% 4% 2% 0% 12% Aurora 14% Colorado Small Area Income and Poverty Estimates, High school completion rates (Figure 8) The high school completion indicator is used as a measure of educational attainment. It is defined as the four-year on time completion rate for students who graduate from high school four years after entering ninth grade. This includes students who graduate with a high school diploma, receive a certificate or designation of completion, or a G.E.D. (CDPHE, 2012). The percentage is lower in Aurora compared to CO, and both Aurora and CO are below the goal for HP
 This indicator represents the percentages of adults without health insurance coverage in 2013, which is prior to health")
27 Figure 8: Proportion of High School Completion 100% 80% 73% 78% 82% 60% 40% 20% 0% Aurora Colorado HP2020 Colorado Department of Education, Percent of adults years without health insurance coverage (Figure 9) This indicator represents the percentages of adults without health insurance coverage in 2013, which is prior to health reform. Health insurance coverage is defined as any type of coverage during the year or past year (CDPHE, 2012). As of 2013, Aurora had 50% more of the population that were uninsured compared to CO. These are the most recent estimates for county and state level data; the next estimates are due to come out in the summer of 2015, and will reflect the impact of health reform. Figure 9: Proportion of Adults without Health Insurance 50% 40% 30% 21% 20% 14% 10% 0% 0% Aurora Colorado HP2020* US Census Bureau, American Community Survey 1-yr Estimates,
. The percentage of uninsured children is slightly higher in Aurora than in Colorado, which are both higher than the national goal for HP 2020.")

28 4. Percent of population under 18 years without health insurance (Figure 10) The percent of the population, less than 18 years old, without health insurance is defined as having no type of healthcare coverage (CDPHE, 2012). The percentage of uninsured children is slightly higher in Aurora than in Colorado, which are both higher than the national goal for HP Figure 10: Proportion of Children without Health Insurance 15% 10% 9% 8% 5% 0% 0% Aurora Colorado HP2020* US Census Bureau, American Community Survey 1-yr Estimates, Percent of adults 18+ reporting having one or more regular healthcare providers (Figure 11) This indicator is defined as the percent of adults, 18 years and older, who reported thinking of one person as their personal doctor or healthcare provider (CDPHE, 2012). Aurora and CO have an equal proportion of adults with a regular HCP, which is below the national goal. Figure 11: Adults with a Regular Healthcare Provider 100% 80% 60% 40% 20% 0% 77% 77% 84% Aurora Colorado HP
29 Colorado Behavioral Risk Factor Surveillance System Percent of adults 18+ who are obese (Figure 12) This indicator describes the percent of adults 18 years of age and older that have a body mass index (BMI) greater than, or equal to 30 (CDPHE, 2012). The data are from the years Adult obesity is slightly higher in the City of Aurora than in CO, and even though these proportions are lower than the national goal, obesity is on an upward trend, and has the potential to continue increasing in the coming years. Additionally, obesity is linked with several causes of morbidity and mortality. Figure 12: Proportion of Adult Obesity 35% 30% 25% 20% 15% 10% 5% 0% 22% 20% 31% Aurora Colorado HP2020 Colorado Behavioral Risk Factor Surveillance System Percent of children 2-14 years who are obese (Figure 13) The percent of children aged 2-14 who are obese is defined here as children with a BMI greater than or equal to the 95th percentile (CDPHE, 2012). In contrast to adult obesity, childhood obesity in the City of Aurora is slightly higher than in Colorado and the national goal. This is important when thinking about the younger population in the City of Aurora, and it suggests childhood obesity is already a major concern and the severity is likely to increase. 21
 This indicator is defined as the percent of adults, 18 years and older who reported no leisure time physical activity (CDPHE, 2012).")
30 Figure 13: Proportion of Childhood Obesity, 2-14 years 20% 16% 15% 15% 15% 10% 5% 0% Aurora Colorado HP2020 Colorado Behavioral Risk Factor Surveillance System Percent of adults 18+ who are physically inactive (Figure 14) This indicator is defined as the percent of adults, 18 years and older who reported no leisure time physical activity (CDPHE, 2012). This means, other than one s regular job, they do no participate in any physical activity or exercise. The City of Aurora has a slightly higher proportion of the population who are physically inactive, compared to Colorado. Figure 14: Proportion of Adults that are Physically Inactive 40% 30% 20% 10% 19% 17% 33% 0% Aurora Colorado HP2020* Colorado Behavioral Risk Factor Surveillance System Percent of adults 18+ who currently smoke cigarettes (Figure 15) This indicator represents the percentage of adults, 18 years and older, who are current smokers, the data is from (CDPHE, 2012). Both the City of Aurora and CO are above the HP2020 goal for this indicator. 22
31 Figure 15: Proportion of Tobacco Use 20% 17% 18% 15% 12% 10% 5% 0% Aurora Colorado HP2020 Colorado Behavioral Risk Factor Surveillance System Percent of the population that reported poor mental health in the past 30 days (Figure 16) This indicator is used to represent the mental health status of a population. Poor mental health is defined as reporting 8 or more days of feeling stressed, depression or emotional problems in the past 30 days (CHI, 2013). Twelve percent of Aurora residents reported poor mental health, compared to 14% in Colorado. Figure 16: Proportion of People with Poor Mental Health 20% 15% 12% 10% 5% 0% Colorado Health Institute, Aurora 14% Colorado 11. Adult suicide rates (Figure 17) This indicator measures the rate of suicides per 100,000 population. A similar trend to the poor mental health indicator is seen in adult suicide rates in Aurora and CO, where Aurora is slightly less than CO. There is also a national goal for comparison. 23
32 Figure 17: Adult Suicide Rates Aurora Colorado HP2020 Colorado Health Information Dataset, These health indicators are an illustration of the social determinants of health combined with health factors, representing the overall health status of the City of Aurora s residents. Specific areas such as poverty, tobacco use and mental health are currently affecting less of the population in Aurora when compared to Colorado, but remain significant in the overall health status of a community. In contrast, Aurora is disproportionately affected by lower high school completion rates, fewer adults and children with health insurance, greater percentages of adult and childhood obesity and a larger proportion of the population who are physically inactive, when compared to Colorado. This highlights the disparities of this community and emphasizes their unmet needs. Additionally, the population health of Aurora could continue to experience poorer health outcomes if social determinants of health, like poverty and education, are not directly addressed. The data collected and analyzed for the indicators, as well as literature reviews of risk factors for leading causes of mortality, morbidity, and YPLL, led to the development of ten health concerns in Aurora. The concerns are as follows: Regular Healthcare Provider, Educational Attainment, Healthcare Coverage, Obesity, Tobacco Use, Poverty, Physical Inactivity, Mental Health, Cancer, and Heart Disease. These concerns represent broader themes than what specific indicators measure since the themes are areas that affect multiple aspects of population health. 24
33 C. Prioritization As was described in the Methods section, the student group determined magnitude and severity scores based on set criteria. The detailed assessment of magnitude score and severity score are in Appendix D. After explaining how each magnitude and severity score metric was calculated, the group had the opportunity to change any of the scores. The only major discussion was centered around the magnitude of Educational Attainment. The group decided to change this from a 3 to a 3.5 (rounded to 4) because children are also impacted by the educational attainment of the community, which was not included in the health indicator. In order to conduct final prioritization, feasibility scores were determined by community leaders. Feasibility scores were based on AHA s capacity, skills and resources, and ability to influence each concern. Final prioritization based on a modified Hanlon Method ranked the top 10 health concerns for Aurora (Table 2) from the highest to the lowest priority. This report shows that having a regular healthcare provider together with healthcare coverage and education were ranked the highest. Table 2: Prioritization Results, Ranked Health Concerns for Aurora Rank Health Concern Magnitude Severity Feasibility Aggregate Score 1. Regular Healthcare Provider Educational Attainment Healthcare Coverage Obesity Tobacco Use Poverty Physical Inactivity Mental Health Cancer Heart Disease
34 Based on the health indicators and health outcomes, ten health concerns were prioritized for the City of Aurora based on severity, magnitude and feasibility ranking and compared to the top ten health concerns identified in a NWA health assessment from 2013 (Table 3). Highlighted in Table 4 are health concerns that overlapped in both NWA and the city of Aurora. Both healthcare coverage and educational attainment were ranked high as one of the top concerns in both studied regions. Poverty was an important health concern in both regions that directly impacts healthcare coverage as well as educational attainment. It has been previously studied that people living below poverty level have lower education attainment than individuals above the poverty level (BLS, 2013). Additionally, people living below poverty have less access to healthcare services than other populations (Swartz, 2009). Mental health was identified in both regions as an important health concern. While obesity was not mentioned in the NWA report, it directly relates to access to healthy food and both concerns are related to health outcomes associated with obesity. Table 3: Comparison of Top Ten Health Concerns for Aurora and NWA Aurora NWA 1. Regular Healthcare Provider 1. Access to Healthcare 2. Educational Attainment 2. At-Risk Births (Teen Pregnancy) 3. Healthcare Coverage 3. Educational Opportunity 4. Obesity 4. Access to Healthy Foods 5. Tobacco Use 5. Housing 6. Poverty 6. Mental Health 7. Physical Inactivity 7. Poverty 8. Mental Health 8. Recreation Space 9. Cancer 9. Security 10. Heart Disease 10. At-Risk Births (Maternal Mortality) 26
35 Even though some health concerns are not identical, many are related and influence each other. For example, physical inactivity was ranked 7th for the City of Aurora while recreational space was ranked 8th for NWA. Having recreational space availability enhances physical activity and therefore, both health concerns are correlated (Heath, 2006). Similarly, both obesity and access to healthy foods were ranked 4th in either report while the correlation of both health concerns has been previously confirmed (Larson, Story, & Nelson, 2009). The comparison of the City of Aurora and NWA produced similar findings when ranking health concerns, which is important for AHA to consider when deciding to expand their efforts to the entire population of Aurora. D. Brainstorming City of Aurora s Resources, Strengths, and Assets In order to assess a feasibility score, the strengths, assets, and resources related to the health concerns were identified using a brainstorming technique. A list of 45 community features were brainstormed and categorized as shown in Table 4. Table 4: Strengths, Assets and Resources in Aurora Health-related agencies/organizations Community clinics physical and behavioral health ACAN (Aurora coverage assistance network) AHA (Aurora Health Access) MCPN (Metro Community Provider Network) Aurora Mental Health Dawn Clinic Tri-County Public Health Colorado School of Public Health Community Health Assessment Kaiser University Hospital Community and organizations Ethnic and cultural diversity Aurora use options. cooking clinics (Cooking Matters) 2040 Partnership Outreach Lowry Family Center Social services organizations Community campus partnership Community members Churches Asian Pacific development center Refugee Center Fields Foundation Government organizations/reps Medical school and training programs. City Council State representatives Community colleges Library Police Fire Department primary and secondary schools businesses Built environment Public transit Good weather Bike trails Parks 27
36 Children's Hospital The Medical Center of Aurora SMHA (South Metro Health Alliance) Resiliency Center Denver Foundation Community awareness health and social determinants Medical Students Foundation community be well Northwest Aurora neighborhood associations 6. Conclusions Aurora Health Access is currently considering an expanded mission to address health needs of the greater City of Aurora and not just NWA. In this process of a modified health assessment and prioritization process we found consistent results of top health concerns in both NWA and the greater Aurora Community. Access to healthcare measured by insurance coverage, having a primary care physician or any other health indicator seem to be the most prioritized health concern. Also related, education attainment has been identified within the top three health concerns. While education level has been closely related to the health status (Adler et al., 1994), it is important to focus public health organizations efforts to increase knowledge about health maintenance, preventive care and access to health. 7. Limitations There are several limitations regarding the methodology of this project. First, the modified community health assessment reflects only quantitative, secondary data and does not include corroborative qualitative data. Second, using a weighted proportion to calculate health indicators based on the population of Adams, Arapahoe, and Douglas counties requires several assumptions be made about the health of the City of Aurora. For example, the health of the urban populations of each county will have a stronger influence on the health indicator since the majority of the county population resides in the more urban. However, when considering various approaches in order to study the health concerns of the City of Aurora, which does not specifically collect health data 28
37 within city limits, weighted proportions was considered the most direct and straightforward method. A third limitation is that previous student groups defining health concerns for NWA were working with secondary data not available for the City of Aurora. This results in the problematic reality that there is no scientific means of comparing available NWA data to City of Aurora data. Finally, the most recent data for health insurance rates are from the American Community Survey and Colorado Health Institute, both in 2013, which is not reflective of health reform under the ACA. The rollout of the health insurance exchange, the expansion of Medicaid in Colorado, and the federal mandate requiring individuals to have health insurance may all affect the rates of insured individuals. The next set of data on health insurance rates is due to come out in the Summer of 2015, and will be a more accurate representation of these changes. 8. Recommendations Based on a modified health assessment and prioritization of the City of Aurora s health concerns, four health concerns considered top priorities for Aurora were selected to provide possible strategies for AHA to consider in addressing population health. As both having healthcare coverage and having a regular healthcare provider are aspects of access to health care concerns, these health concerns have been grouped together into the one for recommendations. When comparing the City of Aurora to NWA, the highest top prioritized health concerns are the same, access to healthcare (healthcare coverage and regular healthcare provider). Education is among the highest priorities for both. Additionally, mental health and poverty were areas of concern for both communities. These important health determinants are problematic in NWA, however, these health concerns are not limited to NWA and affect the whole city, and therefore, it is recommended that AHA move forward, especially in these areas, focusing on the entire City of Aurora. Expand Target Population of AHA to the City of Aurora Many of the top health concerns identified in a health assessment focused on NWA and the City of Aurora were similar including access to healthcare, educational attainment, 29
38 mental health, and poverty. AHA has been successful at leveraging community assets to address community needs in healthcare. By expanding this mission to a larger population, AHA can use this effective approach to impact a larger community in need using similar resources and community assets. Access to Healthcare: Healthcare coverage/having regular healthcare providers Having healthcare coverage and a regular healthcare provider are instrumental in positive health outcomes as these factors impact utilization of preventive care, decrease unnecessary emergency room care and costs, and improve disease treatment and coordinated care (New York Department of Mental Health and Hygiene, 2007). 1. Explore new methods of information dissemination about healthcare coverage topics and choosing/establishing a relationship with a regular healthcare provider. Mobile health apps and other uses of technology and social media can play an important role in connecting people to health information as Latinos, African Americans, and those between the ages of 18 and 49 who are cell phone owners are more likely than others to look for health information on their phones (Pew Research center, 2012). 2. The brainstorming exercise revealed health departments, community health organization, and community organizations as assets in Aurora. Baron et al. (2014) recommend collaboration between all of these entities as each can uniquely provide effective methods for delivering health protection and health promotion programs, especially to low-income earners (2014). AHA can begin the collaborative dialogue among these entities to offer more comprehensive programs that promote healthcare coverage and having a regular healthcare provider. 3. AHA provides a health resource directory for Northwest Aurora. Develop a directory of resources that incorporates all of Aurora s health resources to provide more residents access to a more extensive, comprehensive directory. 30
39 4. Monitor the impact the ACA has on health insurance coverage in Aurora. These changes may impact AHA s future directions. Educational attainment Education inequalities are linked to poor or fair health, poor physical health days, and poor mental health days, (Asada, 2014). Education level is a risk factor for multiple health conditions including heart disease, certain cancers, obesity, Alzheimer's disease, and depression (Adler et al., 1994). Inversely, higher education rates are correlated with better health outcomes (CDC, 2014). 1. The CDC (2014) recognizes promoting protective factors, such as school and family connectedness, as an effective means of improving school retention rates. Freudenberg and Ruglis (2007) also report that feeling connected to school and a caring adult reduces dropout rates. Several school and family related organizations were identified as strengths and assets through the brainstorming process. These strengths and assets can be partnered with to foster these protective factors and build partnerships with organizations that promote school connectedness, build partnerships with organizations promote family connectedness and positive parenting techniques. Post a link on the AHA website to the CDC s Handbooks as a resource for these partners: School Connectedness: Strategies for Increasing Protective Factors Among Youth and Parent Engagement: Strategies for Involving Parents in School 2. Freudenberg and Ruglis (2007) advocate that incorporating health coordinators or educators into schools is an effective method of reducing dropout rates. These professionals fill a gap between services in the community and student and family health and can work to connect families and students to the sevices they need. Additionally, they can effectively address sex education, substance abuse, violence prevention, and mental health (Freudenberg and Ruglis, 2007). 3. Reframe educational attainment as a health problem (Freudenberg and Ruglis, 2007). Inform the public that health and education are linked in such a way that improving high school completion rates can reduce socioeconomic and racial/ethnic 31
40 health disparities, health care cost over the life span, and risky health behaviors (Freudenberg and Ruglis, 2007). Call on policy makers and community leaders to view education in the greater health context as education level is a determinant of health. Obesity The CDC recognizes low levels of physical activity and poor nutrition as the leading contributors to obesity (2014). Increasing physical activity and healthy eating is considered to be an effective approach to obesity prevention (Tran, 2014, CDC, 2014). 1. Develop a resource guide for free or low-cost physical activity opportunities as well as organizations that offer free or low-cost nutritional education trainings and counseling in and around Aurora. 2. Advocate breastfeeding. Breastfeeding is an evidence-based strategy to prevent overweight and obesity (CDC, 2014). Partner with and advocate for breastfeeding friendly businesses, childcare centers, and hospitals that protect, promote, and support breastfeeding. 3. Healthy Eating and Active Living (HEAL) programs are being implemented in many communities and schools, they are feasible, and evidence-based approaches to obesity and overweight prevention (Tran, 2014). AHA is currently connected to partners advocating HEAL initiatives. Support these partners in promoting HEAL. 4. Emphasize existing infrastructure throughout Aurora by organizing community activities and meetings in different locations to expand the number of people introduced to Aurora s infrastructure for various physical activities. Additional Recommendations Lack of qualitative data sources are noted as a project limitation as quantitative data does not capture the complete picture of health in Aurora. Key informant interviews, indepth, structured interviews with relevant community partners, as well as focus groups with the health community would aid AHA in developing a more comprehensive understanding of the City of Aurora including NWA. The CDPHE recommends using 32
41 both types of data to inform community health assessments as a means of validating finding (CDPHE, 2011). This project highlighted Healthy People 2020 targets as a benchmark column in our analysis. Healthy People is a nationwide, government-funded program that sets and monitors ten-year objectives for improving the health of Americans and could be useful for identifying areas where the City of Aurora is falling behind national targets. Using this benchmark in future health assessments would serve as a useful tool in tracking changes in Aurora s health status. 33
42 9. References Adler, N., Boyce, T., Chesney, M., Cohen, S., Folkman, S., Kahn, R., Syme, S. (1994). Socioeconomic status and health: The Challenge of the Gradient. American Psychologist, Vol 49(1), Jan 1994, DOI:org/ / X Asada, Y., Whipp, A., Kindig, D., Billard, B. Rudolph, B. (2014). Inequalities in Multiple Health Outcomes by Education, Sex, and Race in 93 U.S. Counties: Why we should measure them all. International Journal for Equity in Health, 13 (47). DOI: / Aurora Health Access. (2014). Data Sources, Resource List, and Reports. Retrieved from: Baron, S., Beard, S., Davis, L., Delp, L., Forst, L., Kidd-Taylor, A., Liebman, A., Linnan, L., Punnett, L., Welch, L. (2014). Promoting Integrated Approaches to Reducing Health Inequities Among Low-Income Workers: Applying a Social Ecological Framework. American Journal of Industrial Medicine, 57: Center for Disease Control and Prevention. (2014). Breastfeeding. Retrieved from: Centers for Disease Control and Prevention. (2014) Nutrition, Physical Activity, and Obesity. Retrieved from: Centers for Disease Control and Prevention. (2014). School Connectedness: Strategies for Increasing Protective Factors Among Youth. Retrieved from: City of Aurora. (2014). Community Facts. Retrieved from: City of Aurora, Planning & Development Services Department (2012). Who Is Aurora, An Overview of demographic and social data and trends. Retrieved from: Communities for Public Health. (n.d.). Brainstorming Techniques. Retrieved on November 12, 2014 from: Colorado Department of Education. (2012). High School Completion Rates. Retrieved from, 0
43 Colorado Department of Public Health and Environment, Health Equity Model. (2014).Retrieved from: Colorado Department of Public Health and Environment. (2011). Colorado Health Assessment and Planning System. Retrieved from: Colorado Department of Public Health and Environment. (2012). Colorado Health Indicators: Colorado Behavioral Risk Factor Surveillance System Retrieved from: Colorado Department of Public Health and Environment. (2012). Colorado Health Indicators: Colorado Behavioral Risk Factor Surveillance System Retrieved from: Colorado Department of Public Health and Environment, Health. (2012). Colorado Health Indicators: Statistics and Vital Records, Retrieved from: Colorado Health Information Dataset. (2013). Leading Causes of Death QuickReport. Retrieved from: Colorado Health Institute. (2013). Analysis of CHAS data. Retrieved from: Economou, A. & Theodossiou, I. (2011). Poor and Sick: Estimating the Relationship Between Household Income and Health. Review of Income and Wealth, 57(3). DOI: /j x roiw_ Google Maps (2014). Retrieved from: b9b:0x8441e0688ba2e678?sa=x&ei=8p19vmouaskqno7sgrgi&ved=0cb0q8gewaa Freudenberg, N., Ruglis, J. (2007). Reframing School Dropout as a Public Health Issue. Preventing Chronic Disease, 4(4): A107 Heath G., Brownson R., Kruger J, et al. (2006). The Effectiveness of Urban Design and Land Use and Transport Policies and Practices to Increase Physical Activity: a Systematic Review. Journal of Physical Activity and Health, 3(Suppl 1):S Available at: Heinrich, C., & Holzer, H., (2009) Improving Education and Employment for Disadvantaged Young Men: Proven and Promising Strategies. Institute for Research on Poverty. Conference on Young Disadvantaged Men: Fathers, Families, Poverty, and Policy, held September 14 15,
44 U.S. Department of Health and Human Services. Office of Disease Prevention and Health Promotion. Healthy People Washington, DC. Retrieved from: Kahn, E., Ramsey, l., Brownson, R., Heath, G., Rajab, M., (2002) The Effectiveness of Interventions to Increase Physical Activity A Systematic Review. American Journal of Preventive Medicine, 22 (45) p Larson, N., Story, M., Nelson, M. (2009). Neighborhood Environments: Disparities in Access to Healthy Foods in the U.S. American Journal of Public Health, 36(1) National Association of County and City Health Officials. (n.d.). First Things First: Prioritizing health problems. Retrieved from: Summaries-and-Examples.pdf National Institute of Health and Science Research. (2014). Retrieved from: &affiliate=nih&query=educatioin+is+a+risk+facotr&commit.x=0&commit.y=0&commit=s earch New York Department of Mental Health and Hygiene. (2007). healthcare Access Among Adults in New York City: The Importance of Having Insurance and a Regular healthcare Provider. Retrieved from: Pew Research Center. (2012). Mobile Health Retrieved from: Swartz, K. (2009). healthcare for the Poor: For whom, what care and whose responsibility? Focus. Vol. 26 (2), Retrieved from: Tran, B., Ohinmaa, A., Johnson, J., Veugelers, P. (2014). Life Course Impact of School- Based Promotion of Healthy Eating and Active Living to Prevent Childhood Obesity. PLOS ONE, 7. DOI: /journal.pone U.S. Census Bureau. (2010). Profile of Population and Housing Characteristics Demographic Profile Data. Retrieved from: U.S. Census Bureau. (2012). Population Age American Community Survey 5-Year Estimates Retrieved from: U.S. Census Bureau. (2012). Poverty, American Community Survey 5-Year Estimates Retrieved from 2
45 U.S. Census Bureau. (2013). Uninsured, American Community Survey 1-Year Estimates. Retrieved from: U.S. Census Bureau. (2014). City of Aurora Quick Facts. Retrieved from: U.S. Bureau of Labor Statistics. (2013). A Profile of the Working Poor, 2011, Report Retrieved from: 3
46 10. Appendices Appendix A: Matrix of Health Concerns and Associations with Mortality, Morbidity, and YPLL Mortality health outcome Obesity Tobacco EDUCATION POVERTY Cancer Heart Disease Chronic lower resp. diseases Unintentional injuries Alzheimer's disease Cerebrovascular diseases Suicide Diabetes mellitus Chronic liver dis. and cirrhosis Influenza and Pneumonia PHYSICAL INACTIVITY HCE COVERAGE MENTAL HEALTH REGULAR HC PROVIDER CANCER Heart Disease YPLL Morbidity Unitentional Injury Malignant Neoplasms Suicide Heart Disease Perinatal period conditions Homicide/legal intervention Chronic liver disease/cirrhosis Congenital malformations,deformations Cerebrovascular diseases Diabetes Mellitus Stroke hospitalizations *Heart disease hospitalizations *Acute myocardial infarction hospitalizations Heart failure hospitalizations Percent of adults aged 18+ years with diabetes Motor vehicle accident hospitalizations Incidence rate of invasive cancer all ages Rate of major congenital anomalies (per 10,000) incidence rate of invasive cancer of the female breast among females of all ages incidence rate of invasive cancer of the prostate among males of all ages 45
47 Appendix B: AHA Informational Handout Leading causes of death: 1. Cancer 2. Heart Disease 3. Chronic Lower Respiratory Disease 4. Unintentional Injuries 5. Alzheimer's Disease 6. Cerebrovascular Disease 7. Suicide 8. Diabetes mellitus 9. Chronic Liver Disease 10. Influenza and Pneumonia Leading causes of chronic illness: 1. Stroke hospitalizations 2. Heart Disease hospitalizations 3. Acute myocardial infarction hospitalizations 4. Heart Failure hospitalization 5. Percent of adults with diabetes 6. Motor vehicle accident hospitalizations 7. Invasive cancers 8. Congenital anomalies (differences at birth) 46
48 9. Breast cancer 10. Prostate cancer Leading Causes of Years Potential Life Lost 1. Unintentional Injury 2. Cancer 3. Suicide 4. Heart Disease 5. Perinatal Period Conditions 6. Homicidal/Legal Intervention 7. Chronic Liver Disease 8. Congenital Malformation, deformations, and chromosomal anomalies 9. Cerebrovascular disease 10. Diabetes Mellitus 47
49 Appendix C: Top Health Concerns for Aurora Top Health Concerns for Aurora: 1. Regular healthcare Provider: nearly 23% of adults are without a regular healthcare Provider 2. Obesity: affects 22% of the adult population and 16% of children aged Healthcare Coverage: 21% of adults are without health insurance 4. Educational Attainment: With 9% of adults over the age of 25 having no high school diploma and with high school incompletion rates of 27% of expected high school graduates, it is likely that over 10% of the adult population has not completed high school or its equivalency. 5. Tobacco Use: 18% of adults smoke cigarettes everyday 6. Poverty: 12% of the population of Aurora is living below the poverty level 7. Physical Inactivity 19% of adults reported no physically activity other than their job in the last month. 8. Cancer: we estimate that approximately 10% percent of adults are affected by cancer 9. Heart Disease: we estimate that approximately 10% percent of the adult population is affected by heart disease 10. Mental Health: 12% of adults suffer from poor mental health including stress, depression, and emotional problems 48
50 Appendix D: Magnitude and Severity Score Assessment Health concern Magnitude Assessment % of population affected Magnitude Score educational attainment 27% 3 regular healthcare provider 23% 4 healthcare coverage 21% 4 tobacco use 17% 3 poverty 12% 3 physical inactivity 19% 3 cancer 10% 3 heart disease 10% 3 obesity 22% 4 mental health 12% 3 Health concern educational attainment regular healthcare provider healthcare coverage # of associated causes of mortality Severity Assessment # of associated causes of morbidity # of associated YPLL Severity Score tobacco use poverty physical inactivity cancer heart disease obesity mental health

51 Appendix E: Scope of Work Understanding Population Health in Aurora Scope of Work 50
52 Community Information Aurora is primarily an urban city. The U.S. Census Bureau estimates the 2013 population to be approximately 345,800 making it the third largest city in Colorado and the fifty-fifth largest in the Country, roughly the size of New Orleans and Tampa (2014, US Census Bureau, State and County Quick Facts, According to 2010 Census data, the age distribution of persons in Aurora is as follows: children under the age of 5 represent 8.4%, persons under the age of 18 represent 27.3% of the population, persons 65 and older total 8.9% of the population and female persons represent 50.8% of the population of Aurora. Census data for 2010 also report the racial demographics of the City of Aurora as 61.1% white, 15.7% African American or Black, 1.0% American Indian and Alaska Native, 4.9% Asian, 0.3% Native Hawaiian or Other Pacific Islander, and 28.7% as Hispanic or Latino. The geographic boundaries of Aurora lie within Adams, Arapahoe, and Douglas counties. The city extends to the north as far as 70th Avenue, into Adams County, south to County Line Road, where it slightly crosses into Douglas County, and West to East from Yosemite Street to Schumacher Road, which is predominantly Arapahoe County. Adams and Arapahoe counties contain the majority of Aurora geographically, and depending on the availability of secondary data, county level data may be used to describe the sociodemographics of the City of Aurora. Ongoing discussions with Aurora Health Access will help to determine the appropriateness of data sources. Northwest Aurora: Northwest Aurora (NWA) is an urban neighborhood located within the Aurora city limits. It is defined geographically by 26th Avenue to the North, 6th Avenue to the South, Potomac to the East, and Yosemite to the West. NWA has been the focus of Aurora Health Access priorities due to the high rates of poverty, health inequity, and uninsured/underinsured experienced by the residents. Significant demographic changes over the past 15 years, combined with depressing economic and environmental conditions have contributed to these high rates. Aurora Health Access is committed to partnering with this community and addressing the health equity issues facing NWA. Aurora Health Access: Aurora Health Access (AHA) is community coalition comprised of community members, health care providers, and multiple agencies committed to improving health inequities in Aurora, CO. AHA has identified that the current health care system in Aurora is not meeting the needs of all its residents. AHA is dedicated to solving this urgent problem while continuing to strengthen community partnerships. AHA has partnered with the Colorado School of Public Health Community Health Assessment class in order to make data-driven decisions for planning purposes. The students taking the Community Health Assessment course have carried out six assessments for AHA focusing on NWA. Projects include defining NWA, identifying key health related priorities specific to NWA, identifying health resources in NWA, identifying themes and strengths that aid in the health of NWA, identifying barriers and facilitators to access specialty care and identifying the impact of the Patient Protection Affordable Care Act in NWA. AHA is considering expanding its efforts and widening its scope to encompass the entire City of Aurora and not limiting its focus specifically to NWA. 51


53 Team Information UNIVERSITY OF COLORADO ANSCHUTZ MEDICAL CAMPUS COLORADO SCHOOL OF PUBLIC HEALTH Erin Bomberger, RN, BSN, MPH Candidate Erin Bomberger is a working on a Masters in Public Health, with a concentration in Community and Behavioral Health, at Colorado School of Public Health. She is interested in working with the urban underserved population in and around Denver and Aurora. Erin has a Bachelor of Science in Nursing, has eight years of experience, and is currently a Registered Nurse with University of Colorado Hospital. She plans to expand her assessment skills to population based, and will work with programs in public health addressing health equity and access as well as chronic disease prevention. In her free time she enjoys traveling, cycling, and hiking with her dog Daisy. Chris Tyszka, MPH Candidate christine.tyszka@ucdenver.edu! Chris is working on a Masters in Public Health with a concentration in Community and Behavioral Health. She expects to complete her degree in the summer of She earned a Bachelor of Arts in Biology (pre med) and a Bachelor of Arts in Psychology. She is interested in community behavior and health education, especially as it relates to nutrition as a means of disease prevention (both acute and chronic). She is very impressed with AHA s commitment to transform Aurora s health care system. She has been a resident of Southeast Aurora for 16 years and is excited to contribute to your efforts to improve the health of residents of Aurora. In her spare time, she enjoys oil painting, writing fiction and cookbooks, home improvement projects and gardening. Misha (Michaela) Brtnikova, PhD, MPH Candidate michaela.brtnikova@ucdenver.edu! Misha is working on a Masters in Public Health with concentration in Community and Behavioral Health, and expects to complete in winter Misha completed her PhD 52

54 in Kinanthropology in 2009 and currently works as a project manager for the Children s Outcomes Research Program at the UCD. She will bring her experience with project management including planning, timelines, data collection, analyses and evaluation. In her free time Misha plays sand volleyball or explores the mountains either by foot, mountain bike, motorcycle, skis or snowboard. Misha s non-professional goal is to summit all 58 fourteeners in CO. Michael Wallingford, MPA, CPH michael.wallingford@ucdenver.edu! Michael is completing his Masters in Public Health in Community and Behavioral Health with a concentration in Epidemiology. Prior, Michael worked for local public health agencies in both Colorado and Washington State, where he planned and implemented new or revised public and environmental health programs. Michael has earned a Bachelor of Science in Environmental Health, a Masters in Public Administration and a Certificate in Public Health. Michael will use his experience in program implementation and scholastic knowledge to work for a community health center implementing programs in public health, especially addressing childhood obesity. Michael enjoys running, cycling, backpacking and most anything outdoors. 53


55 Mary Newell Mary is expecting to complete the Colorado School of Public Health Masters in Public Health program with a concentration in Community and Behavioral Health in December She has an AAS in Early Childhood Development and a Bachelor of Science in Anthropology. Mary spent much of her early career working in the preschool environment with children aged 6 weeks to 5 years, in many varying capacities. Here she developed her interest in child health and safety policy, regulation, and best practices. Recently, Mary has been working with a local health department to evaluate the effectiveness of a breastfeeding friendly childcare center program. This entailed developing, distributing and collecting, and analyzing two evaluation instruments. Her primary career interests are in Child Health Promotion and Maternal Child Health. Mary enjoys a good cup of coffee, rafting, hiking, reading non-fiction, and the theater. Talia L. Brown, MS - primary UCD instructor talia.brown@ucdenver.edu! Talia Brown is a PhD student in Epidemiology at the Colorado School of Public Health. She is interested in applied epidemiology, especially using surveillance data to answer novel and immediately relevant research questions. She has four years of experience in epidemiology research and program evaluation, and currently works for the Community Epidemiology and Program Evaluation Group at the University of Colorado Cancer Center. She also worked on community needs assessments for the Center for Public Health Practice. In her spare time, she enjoys rock climbing, watching Gordon Ramsey reality shows, and playing with her cat. 54


56 Holly Wolf, PhD, MSPH - secondary UCD instructor holly.wolf@ucdenver.edu! Holly Wolf is an assistant professor in Community and Behavioral Health and Epidemiology in the Colorado School of Public Health and teaches community health assessment, program evaluation and project management. She is interested in public health and health reform, especially as it relates to chronic disease prevention and control and community mobilization. She directs the Colorado Colorectal Screening Program for the medical underserved and is principal investigator, project epidemiologist and/or project manager for several research and public health service programs focused on cancer prevention and control including several assessments around cancer screening and delivery of care. She is an active member of state and national coalitions, including the Colorado Cancer Coalition, serving as past Chair and executive committee member, as well as the National Colorectal Cancer Roundtable steering committee and Co-Chair of the Policy Task force. She believes it is a very exciting time to increase the role of public health in improving the health of Americans and looks forward to working with you and your community. AURORA HEALTH ACCESS Rich McLean - AHA primary contact rich502aha@q.com! Rich is a parishioner at St. Therese Catholic Church in Aurora, and longtime Aurora resident. Rich helped bring community residents and partners together to form Aurora Health Access in Rich serves on the boards of Aurora Health Access, Together Colorado, and the Aurora Community Connection Family Resource Center. He has received several awards for his work in social justice and health care. He resides in Aurora with his lovely wife of over 40 years, Mina, an education assistant for Aurora Public Schools. Denise Denton - AHA secondary contact ddenton@aurorahealthaccess.org! Denise joined Aurora Health Access as the Executive Director in March Denise s areas of focus have been board and staff leadership, training, and development, team building and collaboration, project planning, grant writing coaching, meeting facilitation, community capacity building, and workforce recruitment and retention. Denise has a Master s Degree in Human Resource Management from the University of Utah. 55
57 Project Description The goal of this project is to identify the key health issues and suggest priorities related to the City of Aurora as a whole. The findings will be used to guide the strategic directions of Aurora Health Access related to their current focus on NWA rather than the entirety of the City of Aurora. The first component of this project will be to conduct a modified community health assessment for the City of Aurora as defined by its city limits. The group will define the community, sociodemographics, and list the leading causes of morbidity and mortality. In order to define the population and sociodemographic data, the most locally relevant and specific secondary data available will be analyzed. Based on the leading mortality and morbidity rates, the group will select health indicators pertinent to the target population. A modified health assessment on the target population will be carried out. The results of the assessment will then be used to compare the City of Aurora to the existing community health assessment of the NWA. In this comparison, any underserved pockets located within Aurora, but not included in NWA, will be identified and discussed using the health equity framework. The second component of this project will be hosting a group meeting with the AHA steering committee. During this meeting, the results of the modified health assessments will be shared with the members of the AHA steering committee and other invited community members in a presentation format detailing a summary of the health assessment and comparison findings. A facilitated group discussion among the participants will identify the community s resources, strengths, and assets. Finally, a feasibility assessment will be facilitated for the AHA steering committee to address the key health concerns in Aurora using magnitude, severity, and feasibility as criteria. The third component of this project is an executive summary and final report. This report will detail the results of the community health assessment, the feasibility assessment, and the prioritization process. Finally, the team will make recommendations based on the information collected throughout the assessment and prioritization processes. Project Deliverables Deliverable 1: Presentation summarizing a modified community health assessment of the City of Aurora and results of a comparison to NWA assessments delivered to the AHA steering committee. (November 12, 2014) Deliverable 2: Executive summary and final report discussing the findings and recommendations of the modified health assessment and group methods. (December 12, 2014) Team organization Misha Brtnikova will be the liaison representing this team in communications with Rich McLean, the point person for AHA. The primary mode of communication with Rich will be , however he is available for cell phone calls when necessary. Misha will report the group progress, updates, and findings to Rich regularly and as needed to remain on track with the scope of work. The team members will meet at least once per week and will also be in contact regularly 56
58 via and cell phone. The AHA secondary contact, Denise Denton, will be included in all communication with Rich. The team members roles will continue to revise during the project, however, several members are bringing expertise from different fields: Misha will contribute with her project management skills and will help analyze secondary data. Together with Michael, Misha will develop a guide to facilitate a discussion/brainstorming session identifying the resources, strengths and assets of Aurora during the AHA meeting. Michael will contribute with his qualitative data collection/analyses expertise as well as his prior experience with Colorado Department of Health and Environment (CDPHE) data. Michael will also take charge in collecting mortality and morbidity data for the target population. Chris will present the health assessment data and comparison at the AHA meeting. Chris will also be in charge of defining the target population and selecting sociodemographic information on the population of interest. Erin will be in charge of contacting liaisons at the CDPHE, Tri-County Health Department and Colorado Health Institute (CHI) to help define the sociodemographic indicators of the target population. Erin will also take the lead in identifying health indicators to compare between the NW Aurora (NWA) and the entire city of Aurora. Mary will take a lead in developing a prioritization guide and facilitating the prioritization process at the AHA meeting. Mary will also assist Erin with health indicators identification and comparison as well as supportive literature search and other data selection and search. Talia Brown will serve as an experienced support and mentor throughout the project. Dr. Holly Wolf will be the secondary support leader. All of the group members will participate in drafting, editing, and revising the final report. 57
59 Project Timeline: Project Months October 2014 November 2014 Dec 2014 Project Days Deliverable 1: Compare health assessment of NWA with all Aurora (within city limits) Define population s sociodemographic data (E) Select health indicators to collect and compare (A) Identify leading mortality and morbidity rates (M,C) Carry out health assessment (A) Compare assessment results with NW Aurora (E,C) Develop a group discussion guide (m,m) Develop a prioritization guide (MN) Prepare a presentation for AHA (A) Present at the AHA meeting (A)! Deliverable 2: Deliver a final report incorporating AHA meeting feedback Summarize feedback from the AHA meeting (A) Formulate suggested solutions (A) Write final report (A) Submit final report to CSPH (m)! Deliver final report to AHA (m)! = deliverable; A = All team members; E = Erin Bomberger; C = Chris Tyszka; M = Michael Wallingford; m = Misha Brtnikova; MN = Mary Newell! 55


60 Appendix F: Presentation to AHA and the community members 56
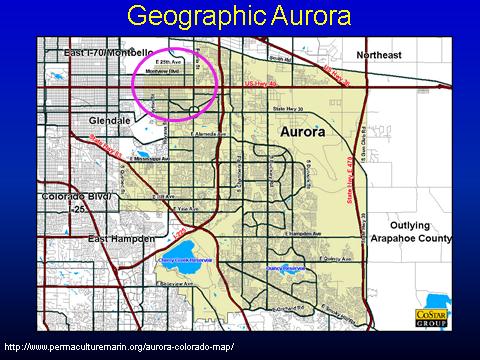
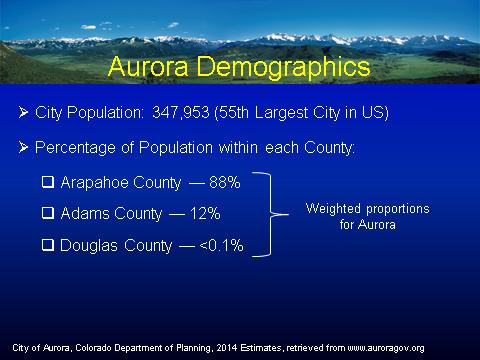
61 57
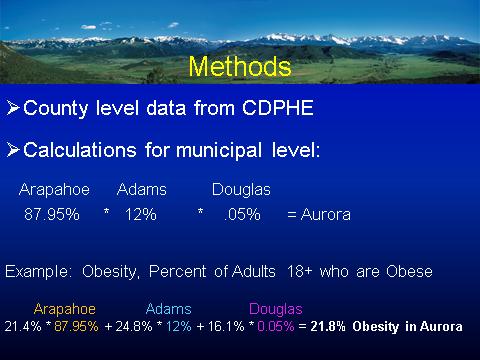
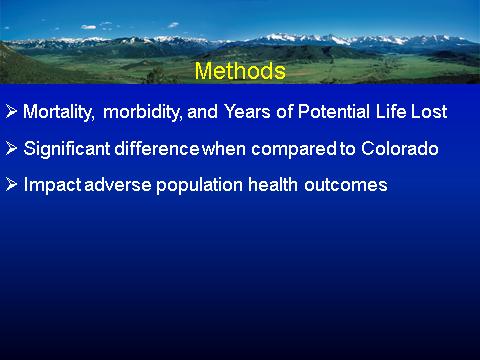
62 58
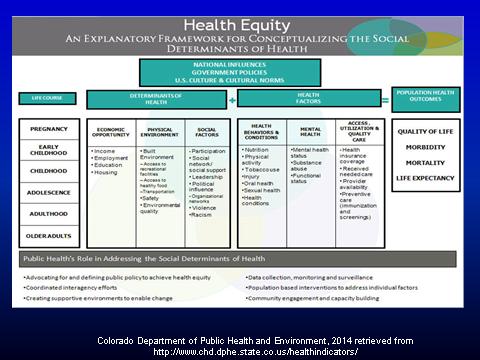
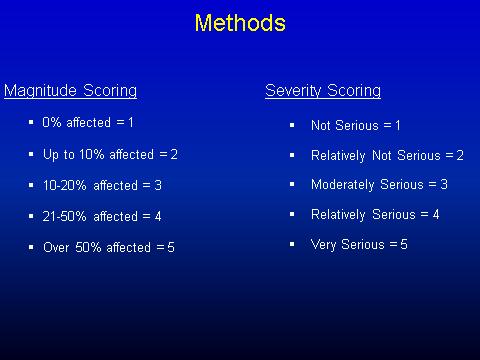
63 59
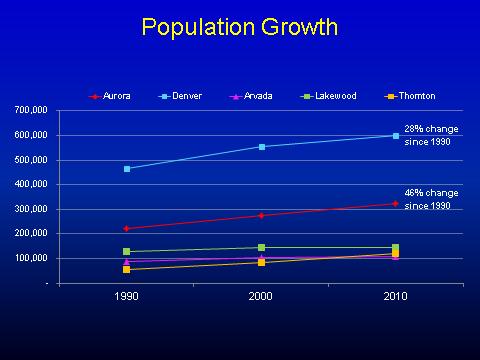
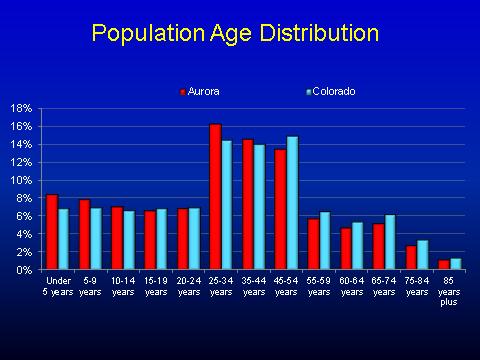
64 60
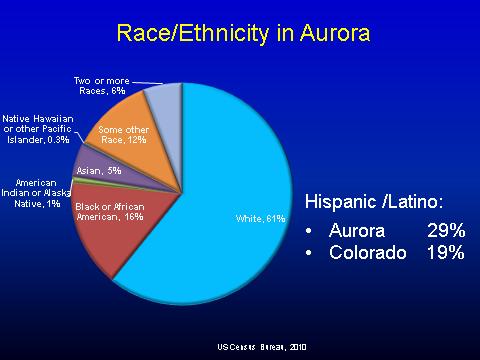
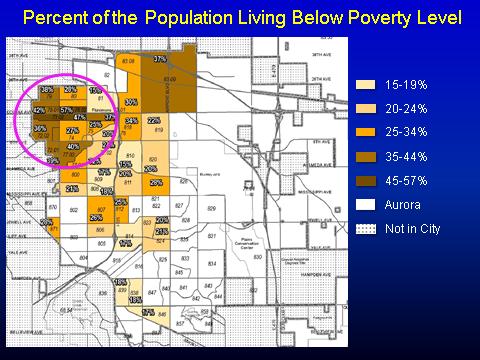
65 61
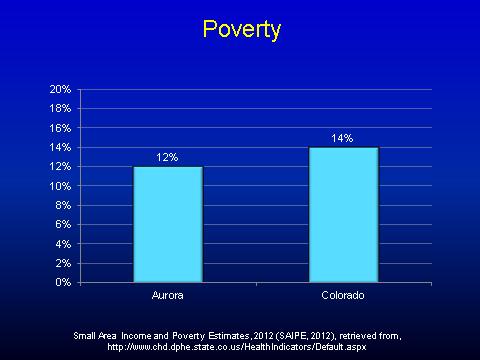
66 62
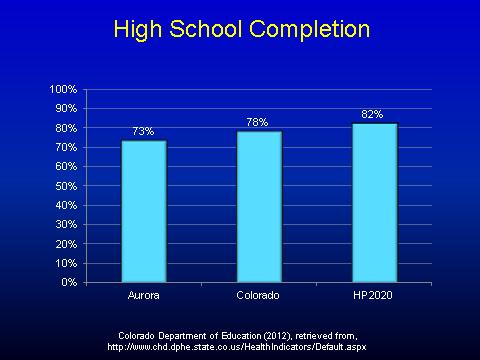
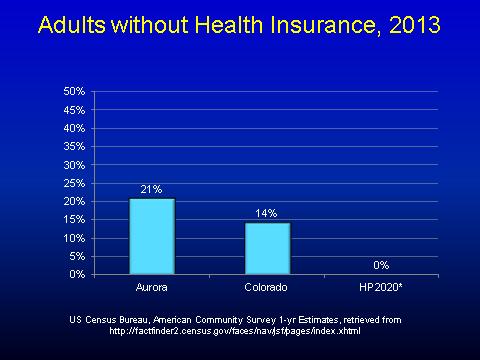
67 63
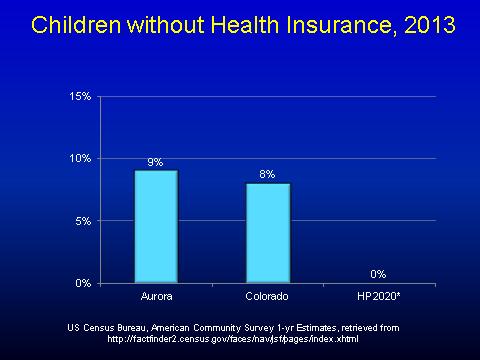
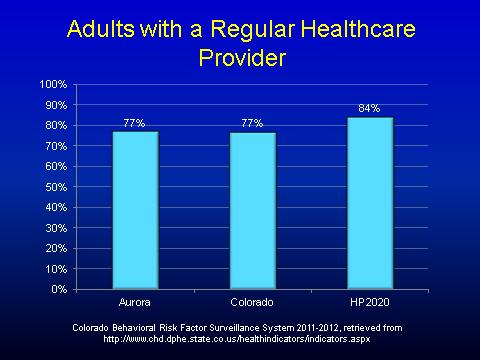
68 64
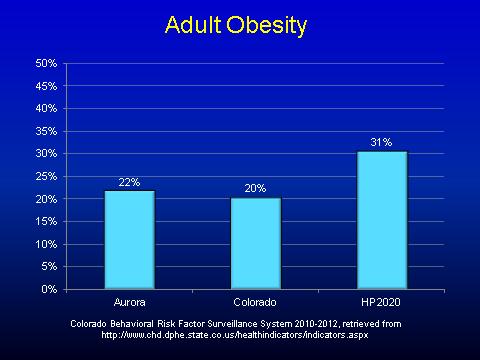
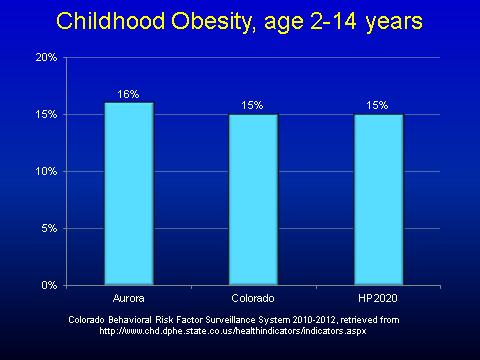
69 65
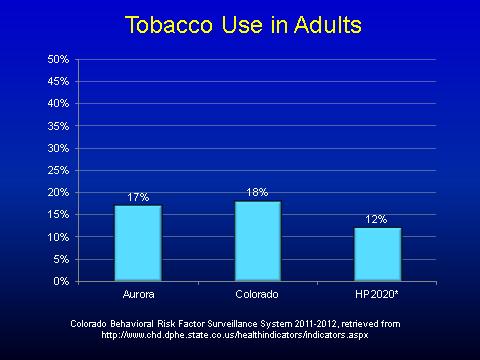
70 66
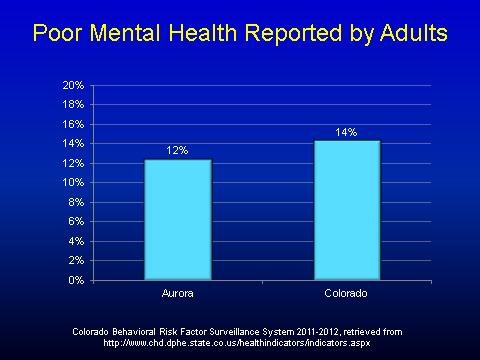
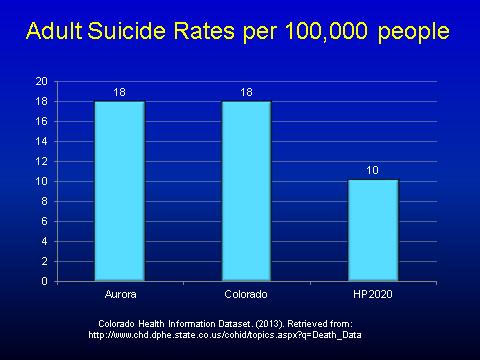
71 67
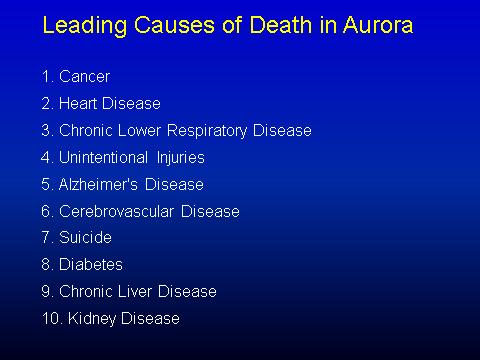
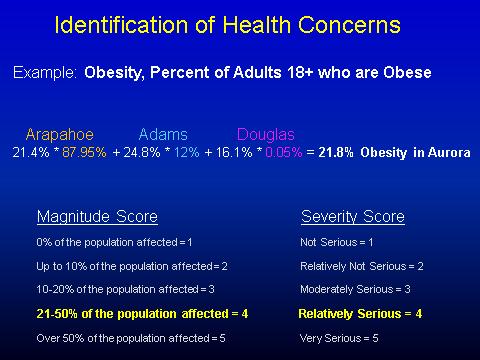
72 68
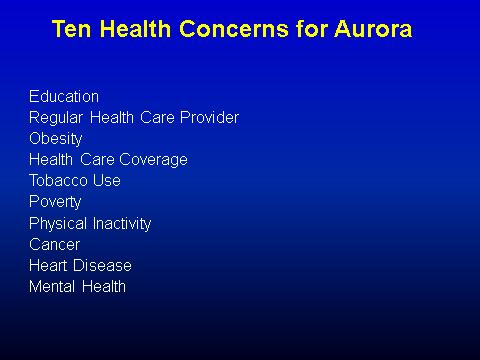
73 69
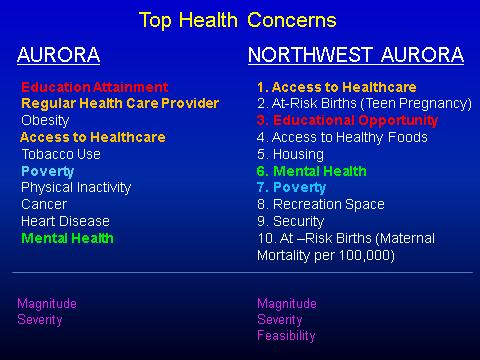

74 70
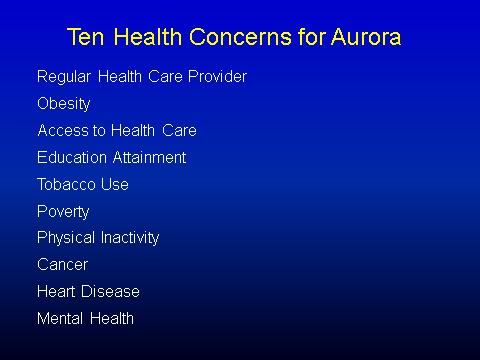
75 71
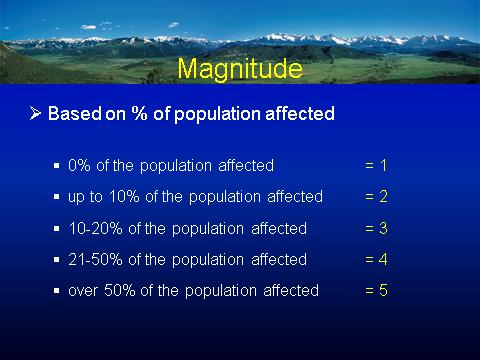
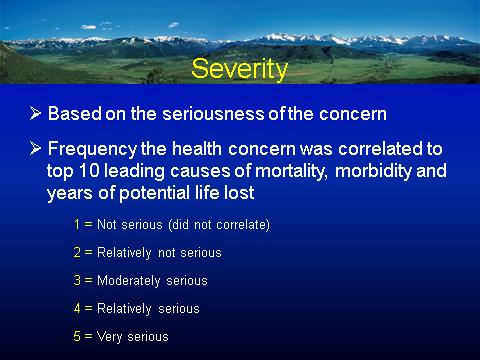
76 72
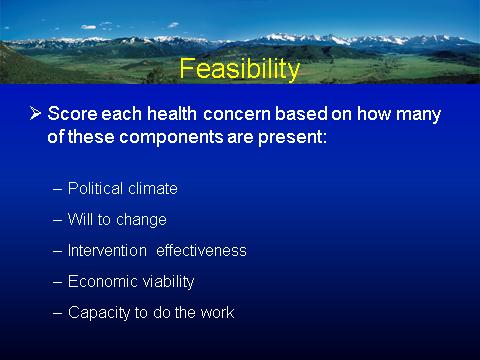
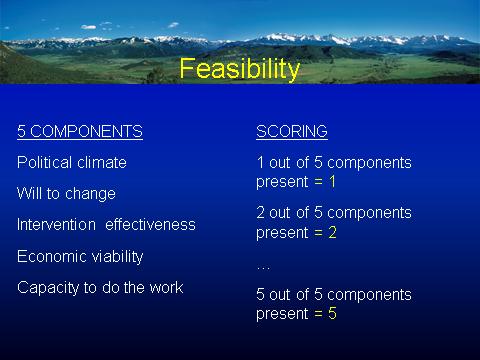
77 73
78 74
79 75
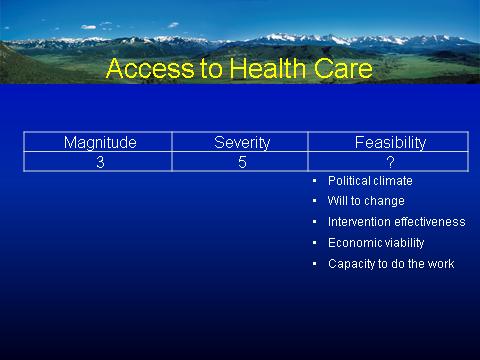
80 76
81 77
82 78


83 Appendix G: Selected Health Indicators for Aurora Health Assessment 79
Community Health Needs Assessment for Corning Hospital: Schuyler, NY and Steuben, NY:
 Community Health Needs Assessment for Corning Hospital: Schuyler, NY and Steuben, NY: November 2012 Approved February 20, 2013 One Guthrie Square Sayre, PA 18840 www.guthrie.org Page 1 of 18 Table of Contents
COMMUNITY HEALTH NEEDS ASSESSMENT HINDS, RANKIN, MADISON COUNTIES STATE OF MISSISSIPPI
 COMMUNITY HEALTH NEEDS ASSESSMENT HINDS, RANKIN, MADISON COUNTIES STATE OF MISSISSIPPI Sample CHNA. This document is intended to be used as a reference only. Some information and data has been altered
2015 DUPLIN COUNTY SOTCH REPORT
 2015 DUPLIN COUNTY SOTCH REPORT Reported March 2016 State of the County Health Report The State of the County Health Report provides a review of the current county health statistics and compares them to
STEUBEN COUNTY HEALTH PROFILE
 STEUBEN COUNTY HEALTH PROFILE 2017 ABOUT THE REPORT The purpose of this report is to provide a summary of health data specific to Steuben County. Where possible, benchmarks have been given to compare county
LIVINGSTON COUNTY HEALTH PROFILE. Finger Lakes Health Systems Agency, 2017
 LIVINGSTON COUNTY HEALTH PROFILE Finger Lakes Health Systems Agency, 2017 About the Report The purpose of this report is to provide a summary of health data specific to Livingston County. Where possible,
ONTARIO COUNTY HEALTH PROFILE. Finger Lakes Health Systems Agency, 2017
 ONTARIO COUNTY HEALTH PROFILE Finger Lakes Health Systems Agency, 2017 About the Report The purpose of this report is to provide a summary of health data specific to Ontario County. Where possible, benchmarks
MONROE COUNTY HEALTH PROFILE. Finger Lakes Health Systems Agency, 2017
 MONROE COUNTY HEALTH PROFILE Finger Lakes Health Systems Agency, 2017 About the Report The purpose of this report is to provide a summary of health data specific to Monroe County. Where possible, benchmarks
Community Health Needs Assessment 2016
 Community Health Needs Assessment 2016 OSF ST. FRANCIS HOSPITAL & MEDICAL GROUP DELTA COUNTY CHNA 2016 Delta County 2 TABLE OF CONTENTS Executive Summary... 3 Introduction... 5 Methods... 6 Chapter 1.
Model Community Health Needs Assessment and Implementation Strategy Summaries
 The Catholic Health Association of the United States 1 Model Community Health Needs Assessment and Implementation Strategy Summaries These model summaries of a community health needs assessment and an
STEUBEN COUNTY HEALTH PROFILE. Finger Lakes Health Systems Agency, 2017
 STEUBEN COUNTY HEALTH PROFILE Finger Lakes Health Systems Agency, 2017 About the Report The purpose of this report is to provide a summary of health data specific to Steuben County. Where possible, benchmarks
King County City Health Profile Seattle
 King County City Health Profile Seattle Shoreline Kenmore/LFP Bothell/Woodinville NW Seattle North Seattle Kirkland North Ballard Fremont/Greenlake NE Seattle Kirkland Redmond QA/Magnolia Capitol Hill/E.lake
2012 Community Health Needs Assessment
 2012 Community Health Needs Assessment University Hospitals (UH) long-standing commitment to the community spans more than 145 years. This commitment has grown and evolved through significant thought and
Community Health Needs Assessment
 Community Health Needs Assessment Bollinger County, Missouri This assessment will identify the health needs of the residents of Bollinger County, Missouri, and those needs will be prioritized and recommendations
Module 3 Identifying Health Problems
 Slide 1: Title Slide Module 3 Thank you for joining us for Module 3:. Now that we have defined our community, it s time to identify its priority health problems. Slide 2: Disclosures for Continuing Medical
CHEMUNG COUNTY HEALTH PROFILE. Finger Lakes Health Systems Agency, 2017
 CHEMUNG COUNTY HEALTH PROFILE Finger Lakes Health Systems Agency, 2017 About the Report The purpose of this report is to provide a summary of health data specific to Chemung County. Where possible, benchmarks
St. Lawrence County Community Health Improvement Plan
 St. Lawrence County Community Health Improvement Plan November 1, 2013 Contents Executive Summary... 3 What are the health priorities facing St. Lawrence County?... 3 Prevent Chronic Disease... 3 Promote
Union County Governance Public Health Partnership
 Union County Governance Public Health Partnership Community Health Improvement Plan 2013 Revisions CHIP PRIORITIES Contents Table of contents Table of contents.1 The Union County Governmental Public Health
2015 Community Health Needs Assessment Saint Joseph Hospital Denver, Colorado
 2015 Community Health Needs Assessment Saint Joseph Hospital Denver, Colorado December 11, 2015 [Type text] Page 1 Contributors Denver County Public Health Dr. Bill Burman, Director, and the team from
BARNES-JEWISH HOSPITAL 2016 COMMUNITY HEALTH NEEDS ASSESSMENT & IMPLEMENTATION PLAN
 BARNES-JEWISH HOSPITAL 2016 COMMUNITY HEALTH NEEDS ASSESSMENT & IMPLEMENTATION PLAN 1 TABLE OF CONTENTS Executive Summary... 3 Community Description... 4 Geography... 4 Population Trends... 5 Income...
Community Health Needs Assessment July 2015
 Community Health Needs Assessment July 2015 1 Executive Summary UNM Hospitals is committed to meeting the healthcare needs of our community. As a part of this commitment, UNM Hospitals has attended forums
CER Module ACCESS TO CARE January 14, AM 12:30 PM
 CER Module ACCESS TO CARE January 14, 2014. 830 AM 12:30 PM Topics 1. Definition, Model & equity of Access Ron Andersen (8:30 10:30) 2. Effectiveness, Efficiency & future of Access Martin Shapiro (10:30
Community Health Needs Assessment 2016
 Community Health Needs Assessment 2016 SAINT JAMES HOSPITAL known as OSF SAINT JAMES - JOHN W. ALBRECHT MEDICAL CENTER LIVINGSTON COUNTY CHNA 2016 Livingston County 2 TABLE OF CONTENTS Executive Summary...
Methodist McKinney Hospital Community Health Needs Assessment Overview:
 Methodist McKinney Hospital Community Health Needs Assessment Overview: 2017-2019 October 26, 2016 Prepared by MHS Planning CHNA Requirement: Overview In order to maintain tax exempt status, the Affordable
2012 Community Health Needs Assessment
 Indiana University Health Goshen 2012 Community Health Needs Assessment A Report on Implementation Strategies to Address Community Health Needs Summary Report Our Commitment to You We are here for you,
2016 Community Health Needs Assessment & Implementation Strategy
 2016 Community Health Needs Assessment & Implementation Strategy 2 The Community Health Needs Assessment and Implementation Strategy for the CHI St. Luke s Health The Vintage Hospital were conducted and
Community Health Needs Assessment and Implementation Strategy
 Community Health Needs Assessment and Implementation Strategy St. Luke s Lakeside Hospital October 29, 2013 The for the St. Luke s Lakeside Hospital were conducted and developed between April 22 and October
St. Anthony Hospital. Community Health Needs Assessment
 St. Anthony Hospital Community Health Needs Assessment Prepared by Tacoma-Pierce County Health Department Office of Assessment, Planning, and Improvement 1 Table of contents Key Findings... 3 Qualitative
St. Barnabas Hospital, Bronx NY [aka SBH Health System]
![St. Barnabas Hospital, Bronx NY [aka SBH Health System]](/thumbs/74/70151677.jpg "St. Barnabas Hospital, Bronx NY [aka SBH Health System]") St. Barnabas Hospital, Bronx NY [aka SBH Health System] NYS 2016 Community Health Assessment and Improvement Plan and Community Service Plan The Service area covered by this work plan are the NYC South
St. Barnabas Hospital, Bronx NY [aka SBH Health System] NYS 2016 Community Health Assessment and Improvement Plan and Community Service Plan The Service area covered by this work plan are the NYC South
AVAILABLE TOOLS FOR PUBLIC HEALTH CORE DATA FUNCTIONS
 CHAPTER VII AVAILABLE TOOLS FOR PUBLIC HEALTH CORE DATA FUNCTIONS This chapter includes background information and descriptions of the following tools FHOP has developed to assist local health jurisdictions
Community Health Needs Assessment FY
 Community Health Needs Assessment FY 2017-19 Contents Introduction... 3 Forward... 3 Executive Summary... 3 Organization Description... 3 Community Served by the Hospital... 5 Defined Community... 5 Identification
By: Patricia B. Crane, PhD, RN; Susan Letvak, PhD, RN; Lynne Lewallen, PhD, RN; Jie Hu, PhD, RN; and Ellen Jones, ND, APRN-BC
 Inclusion of Women in Nursing Research: 1995 2001 By: Patricia B. Crane, PhD, RN; Susan Letvak, PhD, RN; Lynne Lewallen, PhD, RN; Jie Hu, PhD, RN; and Ellen Jones, ND, APRN-BC Crane, P., Letvak, S., Lewallen,
MEDICARE ENROLLMENT, HEALTH STATUS, SERVICE USE AND PAYMENT DATA FOR AMERICAN INDIANS & ALASKA NATIVES
 American Indian & Alaska Native Data Project of the Centers for Medicare and Medicaid Services Tribal Technical Advisory Group MEDICARE ENROLLMENT, HEALTH STATUS, SERVICE USE AND PAYMENT DATA FOR AMERICAN
Implementation Strategy For the 2016 Community Health Needs Assessment North Texas Zone 2
 For the 2016 Community Health Needs Assessment North Texas Zone 2 Baylor Emergency Medical Center at Murphy Baylor Emergency Medical Center at Aubrey Baylor Emergency Medical Center at Colleyville Baylor
2016 Survey of Michigan Nurses
 2016 Survey of Michigan Nurses Survey Summary Report November 15, 2016 Office of Nursing Policy Michigan Department of Health and Human Services Prepared by the Michigan Public Health Institute Table of
Community Health Needs Assessment FY
 Community Health Needs Assessment FY 2017-19 Contents Introduction... 3 Forward... 3 Executive Summary... 3 Organization Description... 3 Community Served by the Hospital... 5 Defined Community... 5 Identification
Colorado s Health Care Safety Net
 PRIMER Colorado s Health Care Safety Net The same is true for Colorado s health care safety net, the network of clinics and providers that care for the most vulnerable residents. The state s safety net
Commonwealth Fund Scorecard on State Health System Performance, Baseline
 1 1 Commonwealth Fund Scorecard on Health System Performance, 017 Florida Florida's Scorecard s (a) Overall Access & Affordability Prevention & Treatment Avoidable Hospital Use & Cost 017 Baseline 39 39
Healthy Eating Research 2018 Call for Proposals
 Healthy Eating Research 2018 Call for Proposals Frequently Asked Questions 2018 Call for Proposals Frequently Asked Questions Table of Contents 1) Round 11 Grants... 2 2) Eligibility... 5 3) Proposal Content
St. Jude Medical Center St. Jude Heritage Healthcare. FY 09 FY 11 Community Benefit Plan
 St. Jude Medical Center St. Jude Heritage Healthcare FY 09 FY 11 Community Benefit Plan 1 St. Jude Medical Center FY 09 - FY 11 Community Benefit Plan TABLE OF CONTENTS Executive Summary 3 A. Community
Community Health Implementation Plan Swedish Health Services First Hill and Cherry Hill Seattle Campus
 Community Health Implementation Plan 2016-2018 Swedish Health Services First Hill and Cherry Hill Seattle Campus Table of contents Community Health Implementation Plan 2016-2018 Executive summary... page
North Shore Community Health Priority Assessment
 North Shore Community Health Priority Assessment 2017-2021 1 Letter from the Health Director/Officer In 2017, the North Shore Health Department began the process of creating a North Shore Community Health
Washington County Public Health
 Washington County Public Health Strategic Plan 2012-2016 Message from the Division Manager I am pleased to present the Washington County Public Health Division s strategic plan for fiscal years 2012 to
Community Health Needs Assessment 2013 Oakwood Heritage Hospital Implementation Strategy
 Community Health Needs Assessment 2013 Oakwood Heritage Hospital Implementation Strategy Community Health Needs Assessment 2013 Oakwood Healthcare CHNA Implementation Strategy Community Health Needs Assessment
Hendry County & Glades County, Florida. Hendry and Glades Rural Health Planning Council Strategic Plan
 The Health Planning Council of Southwest Florida Hendry and Glades Rural Health Planning Council Strategic Plan 2016-2019 Hendry County & Glades County, Florida Table of Contents Introduction......3 Methodology...
addressing racial and ethnic health care disparities
 addressing racial and ethnic health care disparities where do we go from here? racial and ethnic health care disparities: how much progress have we made? Former U.S. Surgeon General David Satcher, MD,
METHODOLOGY FOR INDICATOR SELECTION AND EVALUATION
 CHAPTER VIII METHODOLOGY FOR INDICATOR SELECTION AND EVALUATION The Report Card is designed to present an accurate, broad assessment of women s health and the challenges that the country must meet to improve
Intermountain Fillmore Community Hospital Community Health Needs Assessment 2016
 Intermountain Fillmore Community Hospital Community Health Needs Assessment 2016 Fillmore Community Hospital 674 South Highway 99 Fillmore, Utah 84631 Intermountain Fillmore Community Hospital 2016 Community
March of Dimes Washington State Community Grants Program. Community Award Application
 March of Dimes Washington State Community Grants Program March of Dimes Washington Kasey Rivas, MPH Maternal & Child Health Director 1904 Third Ave, Suite 230 Seattle, WA 98101 206-452-6631 krivas@marchofdimes.org
COURTENAY Local Health Area Profile 2015
 COURTENAY Local Health Area Profile 215 Courtenay Local Health Area (LHA) is one of 14 LHAs in Island Health and is located in Island Health s North Island Health Service Delivery Area (HSDA). Courtenay
Region 1 Parish Community Health Assessment Profile: St. Bernard Parish
 Region 1 Parish Community Health Assessment Profile: Spring 2014 FOREWORD The Regional Meeting on Health Priorities was held in Harvey, LA in November 2013, and was co-convened by the Department of Health
Oregon Health Authority Key Performance Measures Biennium
 Oregon Health Authority Key Performance Measures 2017 2017 Biennium Presented to the Human Services Legislative Subcommittee on Ways and Means April 6, 2015 Leslie Clement, Chief of Policy Lori Coyner,
BROWARD COUNTY TRANSIT MAJOR SERVICE CHANGE TO 595 EXPRESS SUNRISE - FORT LAUDERDALE. A Title VI Service Equity Analysis
 BROWARD COUNTY TRANSIT MAJOR SERVICE CHANGE TO 595 EXPRESS SUNRISE - FORT LAUDERDALE A Title VI Service Equity Analysis Prepared September 2015 Submitted for compliance with Title VI of the Civil Rights
Community Health Needs Assessment
 Community Health Needs Assessment 2017-2019 1 About Texas Health Institute: Texas Health Institute (THI) is a nonpartisan, nonprofit organization whose mission is to improve the health of Texans and their
Hendrick Medical Center. Community Health Needs Assessment Implementation Plan
 Hendrick Medical Center Community Health Needs Assessment Implementation Plan - 2014-2016 Hendrick Medical Center Community Health Needs Assessment Implementation Plan - 2014-2016 Overview: Hendrick Medical
Chronic Disease Surveillance and Office of Surveillance, Evaluation, and Research
 Chronic Disease Surveillance and Office of Surveillance, Evaluation, and Research Potentially Preventable Hospitalizations Program 2015 Annual Meeting Nimisha Bhakta, MPH September 29, 2015 Presentation
Request for Proposals (RFP) for CenteringPregnancy
 for CenteringPregnancy") March of Dimes State Community Grants Program Request for Proposals (RFP) for CenteringPregnancy March of Dimes Illinois 111 W. Jackson Blvd., Suite 1650 Chicago, IL 60604 (312) 765-9044 1 I. MARCH OF
March of Dimes State Community Grants Program Request for Proposals (RFP) for CenteringPregnancy March of Dimes Illinois 111 W. Jackson Blvd., Suite 1650 Chicago, IL 60604 (312) 765-9044 1 I. MARCH OF
Community Health Needs Assessment for Billings Clinic and Yellowstone County. Jeanne H. Manske Community Benefit Coordinator November 8, 2012
 Community Health Needs Assessment for Billings Clinic and Yellowstone County Jeanne H. Manske Community Benefit Coordinator November 8, 2012 Our Mission: Health Care, Education, Research Our Vision: Billings
EVALUATING AN EVIDENCE-BASED PROGRAM THAT ADDRESSES CHILDHOOD OBESITY IN A MIDDLE SCHOOL. Christina Smith. A Senior Honors Project Presented to the
 EVALUATING AN EVIDENCE-BASED PROGRAM THAT ADDRESSES CHILDHOOD OBESITY IN A MIDDLE SCHOOL by Christina Smith A Senior Honors Project Presented to the Honors College East Carolina University In Partial Fulfillment
Demographic Profile of the Officer, Enlisted, and Warrant Officer Populations of the National Guard September 2008 Snapshot
 Issue Paper #55 National Guard & Reserve MLDC Research Areas Definition of Diversity Legal Implications Outreach & Recruiting Leadership & Training Branching & Assignments Promotion Retention Implementation
How Wheaton Franciscan is meeting the NEEDS of our community. NSWERING HE CALL
 ANSWERING THE CALL MEETING OUR COMMUNITY NEEDS S July 1, 2013 June 30, 2016 S How Wheaton Franciscan is meeting the NEEDS of our community. NSWERING HE CALL COMMUNITY HEALTH NEEDS IMPLEMENTATION PLAN:
GREATER VICTORIA Local Health Area Profile 2015
 GREATER VICTORIA Local Health Area Profile 215 Greater Victoria LHA is one of 14 LHAs in Island Health and is located in Island Health s South Island Health Service Delivery Area (HSDA). The LHA is at
Community Health Needs Assessment
 Community Health Needs Assessment 2016 FINAL SUMMAR Y REPORT SUBMITTED BY June 2016 TABLE OF CONTENTS Executive Summary 1 Community Health Needs Assessment Overview 3 Community Health Needs Assessment
Demographic Profile of the Active-Duty Warrant Officer Corps September 2008 Snapshot
 Issue Paper #44 Implementation & Accountability MLDC Research Areas Definition of Diversity Legal Implications Outreach & Recruiting Leadership & Training Branching & Assignments Promotion Retention Implementation
Community Health Needs Assessment Supplement
 2016 Community Health Needs Assessment Supplement June 30, 2016 Mission Statement, Core Values, and Guiding Social Teachings We, St. Francis Medical Center and Trinity Health, serve together in the spirit
FINDING ANSWERS: A ROADMAP TO REDUCE RACIAL AND ETHNIC HEALTH DISPARITIES IN HEALTH CARE
 FINDING ANSWERS: A ROADMAP TO REDUCE RACIAL AND ETHNIC HEALTH DISPARITIES IN HEALTH CARE Addressing Health Disparities and Advancing Health Equity February 28, 2017 Angela Dawson, MS, MRC, LPC Executive
Community Health Needs Assessment IMPLEMENTATION STRATEGY. and
 2015-2018 Community Health Needs Assessment IMPLEMENTATION STRATEGY and Collaborative Health Improvement Plan Palisades Medical Center Implementation Strategy - 1- Introduction: Palisades Medical Center
Central Iowa Healthcare. Community Health Needs Assessment
 Central Iowa Healthcare Community Health Needs Assessment October 20, 2016 Table of Contents Executive Summary 1 Introduction 3 Summary Observations from Current CHNA 5 Information Sources and Data Collection
2016 Community Health Needs Assessment Implementation Plan
 2016 Community Health Needs Assessment Following the 2016 Community Health Needs Assessment, Saint Mary s Hospital developed an Implementation Strategy to illustrate the hospital s specific programs and
Norton Hospital Norton Audubon Hospital Norton Women s and Children s Hospital Norton Brownsboro Hospital Norton Children s Hospital
 Norton Hospital Norton Audubon Hospital Norton Women s and Children s Hospital Norton Brownsboro Hospital Norton Children s Hospital Community Health Needs Assessment 2016 Community Health Needs Assessment
BUSINESS CASE STUDY: Johnson & Johnson
 BUSINESS CASE STUDY: Johnson & Johnson Company Overview Sector: Manufacturing (Pharmaceuticals, medical devices, and other products) Number of Employees: 126,500 Headquarters: New Brunswick, New Jersey
Maternal, Child and Adolescent Health Report
 Maternal, Child and Adolescent Health Report San Francisco Health Commission Community and Public Health Committee Mary Hansell, DrPH, RN, Director September 18, 2012 Presentation Outline Overview Emerging
united hospital east metro region Community Health Needs Assessment and Implementation Plan
 united hospital east metro region Community Health Needs Assessment and Implementation Plan 2014 2016 east metro Identifying and Responding to Community Needs united hospital 333 North Smith Avenue Saint
Navigating Standard 3.1
 Navigating Standard 3.1 Annette Mercurio, MPH, MCHES City of Hope Duarte, CA Close Up is One Way to View It It s Helpful to Enlarge Perspective Standard 3.1 Patient Navigation Process A patient navigation
Grande Ronde Hospital, Inc. Community Needs Health Assessment Implementation Strategy Fiscal Years
 Grande Ronde Hospital, Inc. Community Needs Health Assessment Implementation Strategy Fiscal Years 2016-2018 In 2015, Grande Ronde Hospital (GRH) completed a wide-ranging, regionally inclusive Community
Fleet and Marine Corps Health Risk Assessment, 02 January December 31, 2015
 Fleet and Marine Corps Health Risk Assessment, 02 January December 31, 2015 Executive Summary The Fleet and Marine Corps Health Risk Appraisal is a 22-question anonymous self-assessment of the most common
Research Brief IUPUI Staff Survey. June 2000 Indiana University-Purdue University Indianapolis Vol. 7, No. 1
 Research Brief 1999 IUPUI Staff Survey June 2000 Indiana University-Purdue University Indianapolis Vol. 7, No. 1 Introduction This edition of Research Brief summarizes the results of the second IUPUI Staff
Community Grants Program for Idaho, Montana, North Dakota, South Dakota and Wyoming
 March of Dimes Community Grants Program for Idaho, Montana, North Dakota, South Dakota and Wyoming Request for Proposals (RFP) March of Dimes Contact: Gina Legaz 206-452-6638 glegaz@marchofdimes.org 1
NATIONAL HEALTH INTERVIEW SURVEY QUESTIONNAIRE REDESIGN
 National Center for Health Statistics NATIONAL HEALTH INTERVIEW SURVEY QUESTIONNAIRE REDESIGN Marcie Cynamon, Director Stephen Blumberg, Associate Director for Science Division of Health Interview Statistics
Area Served. El Paso County. Priorities. Obesity Intentional Injury Access to Care. Community Health Implementation Plan (CHIP) FY
 FY") Area Served El Paso County Priorities Obesity Intentional Injury Access to Care Community Health Implementation Plan (CHIP) FY 2017-2019 Community Health Action Plan (CHAP) FY 2018 (CHIP) FY 2017-2019
Area Served El Paso County Priorities Obesity Intentional Injury Access to Care Community Health Implementation Plan (CHIP) FY 2017-2019 Community Health Action Plan (CHAP) FY 2018 (CHIP) FY 2017-2019
Community Health Needs Assessment & Implementation Plan. July 1, 2013 June 30, 2016
 Community Health Needs Assessment & Implementation Plan July 1, 2013 June 30, 2016 For Period FY - July 1, 2013 June 30, 2016 Page 1 Introduction and Purpose The Patient Protection and Affordable Care
Analysis of 340B Disproportionate Share Hospital Services to Low- Income Patients
 Analysis of 340B Disproportionate Share Hospital Services to Low- Income Patients March 12, 2018 Prepared for: 340B Health Prepared by: L&M Policy Research, LLC 1743 Connecticut Ave NW, Suite 200 Washington,
Community Health Needs Assessment: St. John Owasso
 Community Health Needs Assessment: St. John Owasso IRC Section 501(r) requires healthcare organizations to assess the health needs of their communities and adopt implementation strategies to address identified
ASTHO Environmental Public Health Tracking Peer-to-Peer Fellowship Program. Final Report
 ASTHO Environmental Public Health Tracking Peer-to-Peer Fellowship Program Final Report Submitted by: Emily Hall, MPH Epidemiologist Texas Department of State Health Services Environmental and Injury Epidemiology
2004 BAKER COUNTY HEALTH NEEDS ASSESSMENT
 Taking the pulse of the community 2004 BAKER COUNTY HEALTH NEEDS ASSESSMENT Prepared by: Health Planning Council of Northeast Florida, Inc. 900 University Blvd North, Suite 110 Jacksonville, Florida 32211
Public Health Accreditation Board STANDARDS. Measures VERSION 1.0 APPLICATION PERIOD 2011-JULY 2014 APPROVED MAY 2011
 Public Health Accreditation Board STANDARDS & Measures VERSION 1.0 APPLICATION PERIOD 2011-JULY 2014 APPROVED MAY 2011 Introduction The Public Health Accreditation Board (PHAB) Standards and Measures document
Implementation Strategy Report For Community Health Needs
 Implementation Strategy Report 2015 For Community Health Needs Community Hospital Community Health Needs Assessment (CHNA) Implementation Strategy Report 2015 I. About Community Hospital Community Hospital
March of Dimes Louisiana Community Grants Program Request for Proposals (RFP) Application Guidelines for Education and Incentive Projects
 Application Guidelines for Education and Incentive Projects") March of Dimes Louisiana Community Grants Program 2017 Request for Proposals (RFP) Application Guidelines for Education and Incentive Projects March of Dimes Louisiana Maternal & Child Health Impact 11960
March of Dimes Louisiana Community Grants Program 2017 Request for Proposals (RFP) Application Guidelines for Education and Incentive Projects March of Dimes Louisiana Maternal & Child Health Impact 11960
TABLE OF CONTENTS. CHRISTUS Health Central Louisiana CHNA
 TABLE OF CONTENTS Figures... 3 Acknowledgements... 4 Executive Summary... 5 Introduction... 7 Methodology... 7 Advisory Committee... 8 Quantitative Indicators... 8 Key Informant Interview Protocol... 9
This report is made possible with the generous support of the Otho S.A. Sprague Memorial Institute.
 This report is made possible with the generous support of the Otho S.A. Sprague Memorial Institute. For more information contact Erica Salem, MPH at ESalem@hdadvocates.org Dear Friends, In March 204, the
Wake Forest Baptist Health Lexington Medical Center. CHNA Implementation Strategy
 Wake Forest Baptist Health Lexington Medical Center CHNA Implementation Strategy Background Wake Forest Baptist Health - Lexington Medical Center (LMC) is committed to understanding, anticipating, assessing,
Community Health Needs Assessment Implementation Strategy Adopted by St. Vincent Charity Medical Center Board of Directors on April 5, 2017
 St. Vincent Charity Medical Center Community Health Needs Assessment Implementation Strategy Adopted by St. Vincent Charity Medical Center Board of Directors on April 5, 2017 Introduction In 2016, St.
Evaluation of Health Care Homes:
 Division of Health Policy PO Box 64882 St. Paul, MN 55164-0882 651-201-3626 www.health.state.mn.us Evaluation of Health Care Homes: 2010-2012 Minnesota Department of Health Minnesota Department of Human
Acknowledgements. 2 broomfieldhealth.org
 Acknowledgements The City and County of Broomfield's Public Health Improvement Plan is a collaborative effort of many organizations and providers committed to improving the health of our residents. The
San Francisco is not exempt from the hypertension crisis, nor from the health disparities reflected in the African-American community.
 September 2017 San Francisco Health Network Heart Health Patient Communications and Community Events Project Brief and Request for Proposals I. Background Heart disease is the leading cause of death in
Racial and Ethnic Health Disparities in Health and Health Care St. Louis Regional Data
 Racial and Ethnic Health Disparities in Health and Health Care St. Louis Regional Data By Debbie Chase, MPA Consultant, Center for Health Policy University of Missouri -- Columbia 1 Quantitative Data Overview
Southwest General Health Center
 Southwest General Health Center Community Health Needs Assessment Executive Summary July 2016 Southwest General Health Center CHNA Executive Summary Introduction Southwest General Health Center, a 358-bed
Implementation Strategy Report for Community Health Needs
 2013 Implementation Strategy Report for Community Health Needs Kaiser Foundation Hospital WALNUT CREEK License #140000290 Kaiser Foundation Hospitals Community Health Needs Assessment (CHNA) Implementation
POLICY AND SYSTEMS CHANGE RFP INFORMATION SESSION OCTOBER 19, 2017
 POLICY AND SYSTEMS CHANGE RFP INFORMATION SESSION OCTOBER 19, 2017 Agenda 1. Introduction to Communities of Opportunity 2. Request for Proposal (RFP) Overview 3. Questions 4. What s Next Communities of
2012 Community Health Needs Assessment
 2012 Community Health Needs Assessment Table of Contents Executive Summary... 3 Overview of Key Findings.4 Conclusion...6 Introduction...7 1a. A Definition of the Community Served by the Hospital Facility...8
Cardiovascular Disease Prevention and Control: Interventions Engaging Community Health Workers
 Cardiovascular Disease Prevention and Control: Interventions Engaging Community Health Workers Community Preventive Services Task Force Finding and Rationale Statement Ratified March 2015 Table of Contents