Prepared by: Rural Wisconsin Health Cooperative Dale Guillickson, FHFMA Richard Donkle, CPA
|
|
|
- Ethelbert Jonas Maxwell
- 6 years ago
- Views:
Transcription


1 A publication by the WI ORH Office of Rural Health Prepared by: Rural Wisconsin Health Cooperative Dale Guillickson, FHFMA Richard Donkle, CPA 2013
2 Acknowledgements The authors would like to thank the funders of this report, the Wisconsin Office of Rural Health, as well as the Wisconsin Hospital Association and the Wisconsin Department of Health Services for use of their data. Funding from the WI-ORH comes via the Medicare Rural Hospital Flexibility Program, a program of the Federal Office of Rural Health Policy, Health Resources & Services Administration (HRSA).
3 TABLE OF CONTENTS Executive Summary 1 Location of Critical Access Hospitals 4 Number of US Critical Access Hospitals, Wisconsin Critical Access Hospitals 6 Introduction 9 Reimbursement Methodologies 9 Hospital Organization Changes 11 Financial Performance Analysis 13 Total Margin 18 Operating Margin Ratio 19 Operating/Total Margin Comparison 21 Net Days in Accounts Receivable 22 Days Cash on Hand 24 Deduction Ratio 26 Average Age of Plant 28 Debt-to-Capitalization 30 Changes In Services 33 Utilization 40 ICD-10-CM/PCS (International Classification of Diseases, 10th Edition, Clinical Modification /Procedure Coding System) CD Electronic Health Records 48 Recent Legislation 48 Patient Protection & Affordable Care Act 48 Supreme Court Decision 49 Health Insurance Exchanges 50 Delay in Employer Mandate 51 Individual Mandate 51 Quality & Patient Safety Measures 52 American Taxpayer Relief Act of
4 Medicare 55 Bad Debts 55 Sequestration 56 Current Developments 57 Traditional Government Program Utilization 59 Medicare Advantage Utilization 60 Uncompensated Care 62 Summary 65 Other Resources 67
5 EXECUTIVE SUMMARY Critical Access Hospital (CAH) designation was introduced through the Medicare Rural Hospital Flexibility Program (Flex Program) as part of the Balanced Budget Act (BBA) of Many low-volume rural hospitals were finding it difficult to recover their Medicare costs under the prospective payment system (PPS) rates. As a result, policymakers created the new designation of CAH, under which small facilities would be paid 101% of their Medicare costs for inpatient services, outpatient services (including laboratory and therapy services), and post-acute services in swing beds. The first Wisconsin CAH hospitals were certified in This study is the sixth since the CAH program was implemented. As with the prior Wisconsin CAH study financial performance studies completed in 2003, 2005, 2007, 2009, and 2011, the purpose of this study is to analyze the financial condition of Wisconsin s CAHs. There have been many recent changes in Medicare and Medicaid and many more related to healthcare reform are imminent. For Wisconsin hospitals (PPS & CAH, both Urban & Rural) this study shows that: The Total Margin for CAHs was 7.23% in 2010 and 7.30% in 2012 while the Total Margin for PPS hospitals was 9.32% in 2011 and 9.25% in Although CAHs Operating Margins improved in 2011 and 2012, they continue to experience lower Operating Margins than PPS hospitals. Average Age of Plant increased for PPS hospitals and decreased for CAHs in In 2012, CAH Age of Plant stayed the same while PPS hospitals Age of Plant increased slightly. CAH Age of Plant was less than PPS hospitals for both 2011 and Net Days in Accounts Receivable increased for PPS hospitals in This ratio decreased for CAHs and stayed about the same for PPS hospitals in Overall strength as measured by the Financial Strength Index increased in 2011 and 2012 for both CAHs and PPS hospitals. The improvement in Financial Strength was higher for CAH hospitals for both years than for PPS hospitals. There have been changes in services provided for both CAH and PPS hospitals. The reason for these changes may be related to financial considerations. Several key utilization statistics such as inpatient days, surgical operations, births, and emergency visits showed less growth or more rapid decline since 2000 for CAHs than experienced by PPS hospitals. CAHs outpatient revenue as a % of total revenue has increased since 2000 and CAHs have higher outpatient % revenue to total revenue than PPS hospitals. The % of Wisconsin Medicare beneficiaries covered by Medicare Advantage plans continues to rise. 1
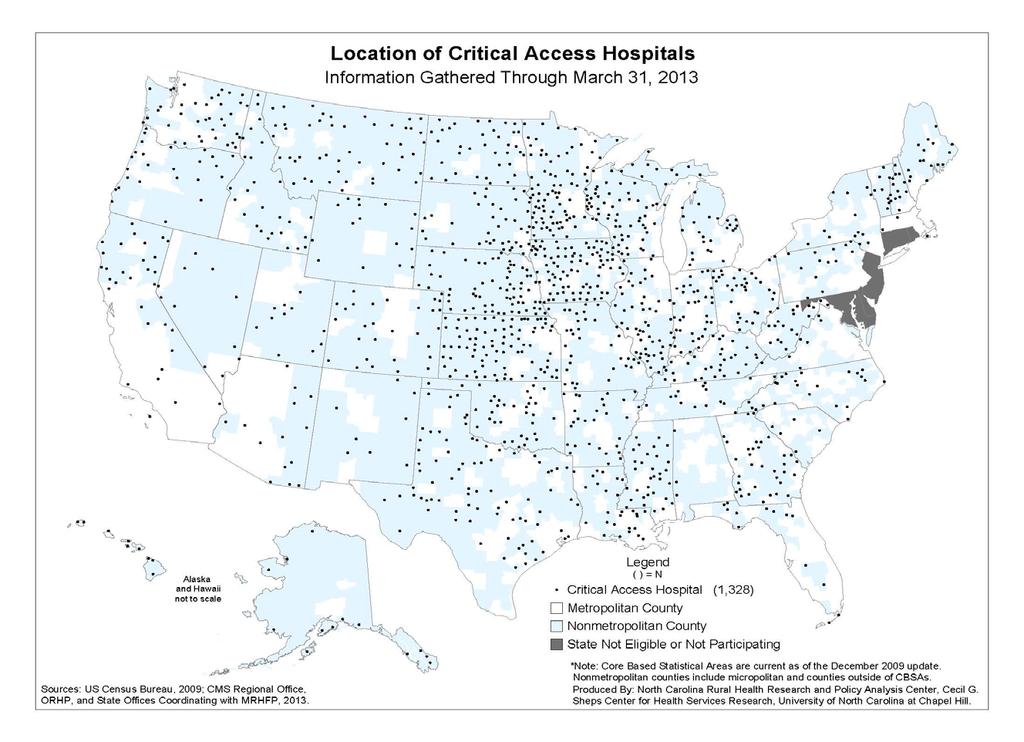
6 The % of Uncompensated Care increased slightly in 2011 and 2012 for both groups. The pending transition from ICD-9 code sets to ICD-10-CM/PCS (International Classification of Diseases, 10th Edition, Clinical Modification /Procedure Coding System) (ICD-10) code sets was to occur on October 1, In August, 2012, CMS announced the transition was being delayed one year to October 1, This transition could have major implications on cash flow. It is important to note that the Hospital Fiscal Survey does not include nursing home financial information. More CAHs have nursing homes than PPS facilities (see Changes in Services). Nursing homes typically generate lower contribution margins than hospital operations. Therefore, the study may overstate the strength of CAH facilities compared to the PPS group. The presence of EHR incentive payments and the method used to record their financial impact may have material effects on several ratio calculations. The impact of the reduction to the Medicare Bad Debt % for 2013 through 2015 is approximately $10M for CAHs, $4M for PPS facilities for a total of about $14M. The annual 2% sequestration reduction to Medicare inpatient, outpatient, and swing bed payments for CAHs about $9.5M, for PPS facilities $47M, for a total of about $56.5M. This does not include the impact of other types of Medicare payments that are subject to sequestration. See further discussion in the Medicare section of this study. A report issued in August, 2013 by the HHS Office of Inspector General (OIG) recommends that CMS reassess and decertify many CAH facilities for failing to fulfil location requirements. The OIG proposal would eliminate CAH status for as many as 53 Wisconsin CAH facilities. The Patient Protection and Affordable Care Act (PPACA) is discussed more extensively in the Recent Legislation section of this study. The number of CAHs nationally has grown steadily over the last ten years. As of March 2013, there were 1,329 CAHs in the United States (see following graph). Most CAHs are located geographically in the central part of the U.S. (see following map). The increase in CAHs is in part due to a series of legislative changes that made conversion to CAH status possible for more facilities to consider and, therefore, expanded the services that qualify for cost-based reimbursement. Prior to 2006, hospitals could convert to CAH status if they were (1) 35 miles by primary road or 15 miles by secondary road from the nearest hospital, or (2) their state declared them to be a necessary provider under criteria established by each state and approved by CMS. Starting in 2006, hospitals could no longer use the state necessary provider criteria to apply for CAH status. While many existing CAHs do not meet the distance test, they were 2
7 grandfathered into the program based on their necessary provider status. Among small rural hospitals that have not converted, most do not meet the distance requirement. Therefore, the number of CAHs since 2006 has remained fairly constant. 3
8 4

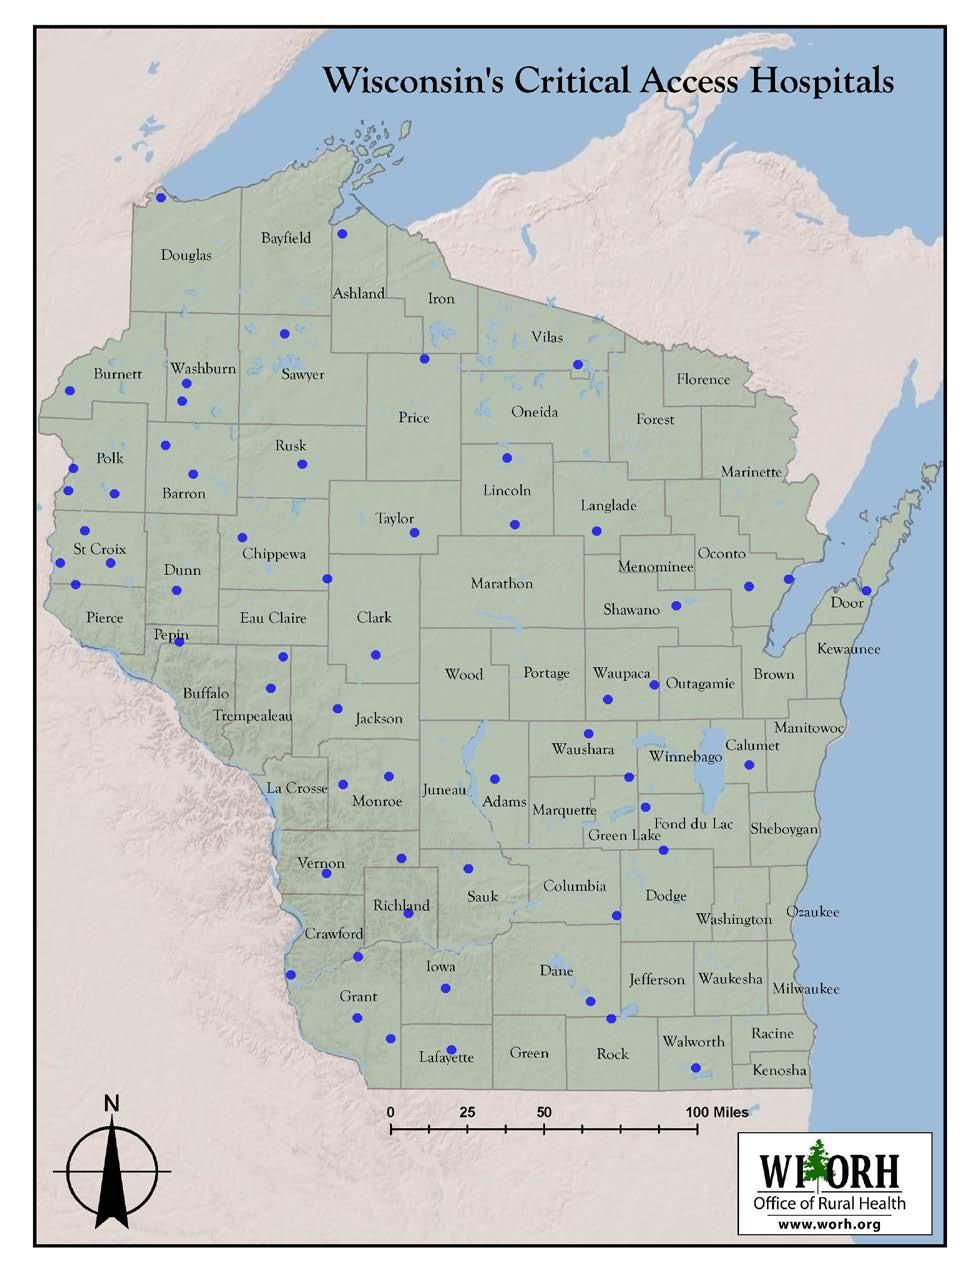
9 Currently, Wisconsin has 58 CAHs which means roughly 40% of all Wisconsin facilities were CAHs. Critical Access Hospitals are located in 41 of Wisconsin s 72 counties (see following map). Two facilities did not exist prior to 2005 and were not included in this or prior studies due to lack of historical financial data. One CAH facility closed in 2011 and was not included in this study. Of the 56 facilities in this study, 17 were certified in 1999, 2000, or 2001 (see Table 1). 5
10 6
11 Table 1: Wisconsin CAHs by Year of Certification YEAR Certified TOTAL FOR STUDY Total The facilities that converted to CAH status early were generally smaller and not as financially strong as the later converters. The largest group (31 facilities) received critical access certification during 2002, 2003, and The remaining nine study facilities converted in 2005, 2006, and One CAH facility closed in 2011 and was not included in this study. Financial and services data were analyzed for thirteen years (from 2000 through 2012). The 56 study facilities are categorized as CAHs. Table 2 shows if the study facility was paid as a CAH or under the Medicare PPS. It also shows if the facility converted during its fiscal year (PPS/CAH). 7
12 Table 2: Study Hospitals by Year and Medicare Payment Type YEAR PPS PPS/CAH CAH ALL STUDY Most charts graph CAH study facilities, all other hospitals, and both groups combined. Psychiatric, Children s, Veterans, and Rehabilitation hospitals were excluded from the study. The source of most of the study data was the Wisconsin Hospital Fiscal Survey and the Wisconsin Annual Survey of Hospitals. These surveys are completed annually by all Wisconsin hospitals and returned to the Wisconsin Hospital Association (WHA) Information Center. The Financial Strength Index (FSI) is a ratio that combines several key performance indicators (see further discussion in the Financial Performance section of this study). This ratio increased for both groups in In 2012, the PPS FSI stayed about the same but increased for CAHs. The FSI ratio shows both groups in the Good range in the FSI Rating Guide (see Table 6). For the first time, the Average Age of Plant in 2011 for CAHs was lower than for PPS facilities. Both CAHs and PPS facilities Age of Plant stayed approximately the same in 2012 (see further discussion in the Average Age of Plant Ratio section.) The Debt-to-Capitalization ratio is a new ratio added to the 2013 Critical Access Hospital study. This ratio measures the utilization of long-term sources of debt financing. This ratio may be used as a covenant in capital financings. This ratio is calculated by dividing Long-Term Debt by Long-Term Debt plus Fund Balance. Both PPS and CAHs show a decreasing trend in Debt-to-Capitalization from 2006 through CAHs have a higher Debt-to-Capitalization than PPS facilities (see further discussion in the Debt-to-Capitalization Ratio section) 8
13 INTRODUCTION The purpose of this study is to report on the financial impact of Wisconsin hospitals designated as CAHs. Similar reports were conducted in 2003, 2005, 2007, 2009, and As of August, 2013, Wisconsin had 58 CAH facilities. The first Wisconsin hospital received CAH designation on October 1, As noted in the Executive Summary, Table 2 shows when Wisconsin hospitals received CAH status and the number of facilities included in this update. This study primarily uses the information from the Wisconsin Hospital Fiscal Survey and the Annual Survey of Hospitals. Both of these surveys are submitted annually to the WHA Information Center. The information is reviewed for accuracy. The Hospital Fiscal Survey is designed to closely follow the hospital s audited financial statements. For these reasons, the source for most of the study data is the Fiscal and Annual Survey. It is important to note, however, that the annual Wisconsin Hospital Fiscal Survey does not include nursing home financial information. More CAHs in Wisconsin have nursing homes than do PPS facilities (see Changes in Services). Nursing homes typically generate lower contribution margins than hospital operations. Therefore, the study probably overstates the strength of CAH facilities compared to the PPS group. The years included in this study are from 2000 through Financial ratios were calculated and are shown in graphs to provide the user with a visual aid to measure trends. REIMBURSEMENT METHODOLOGIES CAH Medicare reimbursement is generally the same as presented in prior studies. Under PPS, inpatient reimbursement was based on diagnosis related groups (DRGs). Swing bed reimbursement was based on a combination of skilled nursing facility per diems for the nursing care and the Medicare program ancillary costs until July 1, At that time, swing bed reimbursement became based on the prospective resource utilization group (RUG) methodology. Prior to August 1, 2000, outpatient reimbursement was based on a combination of costs and fee schedules. Outpatient reimbursement is now based on ambulatory payment categories (APCs) and fee schedules. CAHs are paid costs for acute care, swing bed and outpatient services. Cost reporting methodology for CAHs splits nursing care costs between acute and swing bed services based on patient days. The resulting nursing cost per diems are equal. The per diem is multiplied by Medicare program acute and swing bed days. A decrease in acute or swing bed patient days will increase the cost per diem and increase Medicare payments. For CAH cost reports beginning on or after January 1, 2004, there is 9
14 a 1% add-on to allowable Medicare costs, making Medicare CAH reimbursement 101% of allowable costs. The Wisconsin Medical Assistance Program (Medicaid) CAH reimbursement used to be based on costs similar to Medicare reimbursement. Medicaid funding for CAHs no longer involves retrospective cost settlements. Major changes to the Wisconsin Medicaid State plan have been implemented recently. The new Medicaid hospital Outpatient rates effective April 1, 2013 involve a new reimbursement methodology called Enhanced Ambulatory Patient Groups (EAPGs). Under EAPGs, hospital outpatient services will be based upon the quantity and type of services provided. The base rate for CAHs is a prospective cost-based base rate, established using the most recently audited Medicare Cost Report and total adjusted EAPG weights for each provider. The base rate for all other hospitals paid under the EAPG reimbursement methodology was calculated from the remaining Department of Health Services (DHS) OP hospital budget and the total adjusted EAPG weights for all other providers. DHS has decided to limit the fiscal impact to individual providers during the first year of implementation to a +/- 5% corridor, of the projected payments the provider would have otherwise received under the historical per visit reimbursement methodology. Therefore, the rates effective April 1, 2013 are based upon this fiscal corridor adjustment to the Wisconsin statewide base rate. For Medicaid inpatient payments, the rate per inpatient discharge is calculated for and assigned to each hospital for the rate year. This calculation determines a unique "hospital-specific DRG base rate" for each hospital. This hospital-specific DRG base rate includes an adjustment for differences in wage levels between rural and metropolitan areas throughout the state. This rate also includes an amount for capital costs and, for qualifying hospitals, additional amounts for serving a disproportionate share of low-income persons, for direct and indirect costs of a medical education program, or for the hospital being located in a rural area. Payment to a hospital for the stay is determined by multiplying the hospital's specific DRG base rate by the weight assigned to the DRG into which the stay is classified by the grouper. As discussed in the 2011 study, Wisconsin implemented a 1.4 percent assessment on hospitals and ambulatory surgical centers gross revenue. Because Medicaid funding is a joint Federal and State program, this measure was intended to increase the state s Medicaid reimbursement by $300 million a year. Most of the revenues will be returned to the hospitals, but some of the revenue will be used to expand health coverage to low-income, childless adults. Most states have already implemented a similar provider assessment. 10
15 HOSPITAL ORGANIZATION CHANGES Wisconsin hospitals organizational structure has changed in the last 12 years. The Annual Survey collects data on whether the hospital is part of a health care system. The following chart shows what percent of Wisconsin CAHs, PPS facilities and both groups combined belong to a health care system. The chart indicates about 68% of Wisconsin hospitals belonged to a health care system in This is 12% higher than in % of PPS hospitals in 2012 belonged to a system while only about 54% of CAHs are part of a group. CAHs showed about a 13% increase since
16 Another Annual Survey question examines the relationship of Wisconsin hospitals with primary group practices. The survey response to whether or not the hospital owns or operates a primary group practice is graphed in the following chart. The chart shows that in 2001, the % of CAHs who owned or operated a primary group practice was below 23% while the % for PPS facilities was about 35%. In 2012, a higher % of CAHs (44%) own or operate a primary group practice than PPS hospitals (36%). The % of hospitals with primary group practices for both groups combined has increased from 28.9% to 40.3% in One reason CAHs may have a higher percentage of primary group practices is physician reimbursement concerns. Physicians with large Medicare populations are more likely to want to move to hospital-employed positions. 12
17 FINANCIAL PERFORMANCE ANALYSIS As with the prior studies, ratio analysis will be used to evaluate financial performance. The reader should be aware of the following disclaimer. The financial information for the most recent years for many of the CAH and PPS hospitals included in this study reflects EHR incentive payments. Another factor regarding EHR incentive payments is financial statement presentation. The Hospital Financial Management Association (HFMA) in December 2011 issued guidance for financial statement presentation of EHR Incentive payments. The guidance had recommendations but allowed some options to facilities on how to present these payments in their financial statements. This means not all EHR incentive payments are classified the same. In addition, the source of the study financial data does identify either the amount or how EHR payments were recorded. Therefore it is not possible to quantify the impact of removal of the payments on the ratios presented in this study. This obviously makes for inconsistent comparisons of financial performance. The presence of EHR incentive payments and the method used to record their financial impact may have material effects on several ratio calculations. Also new in this study is the Debt-to-Capitalization ratio. A discussion of key ratios selected for this project follows. Table 3: Financial Ratios and Description RATIO Days in Accounts Receivable (net) Days Cash on Hand Operating Margin Total Margin Average Age of Plant Deduction Ratio Financial Strength Index Debt-to- Capitalization DESCRIPTION This ratio measures the average number of days in the collection period. A larger number of days represent cash that is unavailable for use in operations. The number of days of expenses that the hospital can currently cover with its available cash. This ratio defines the % of operating income to total operating revenue. This ratio evaluates the overall profitability of the hospital using both operating surplus (loss) and non-operating surplus (loss). Age of plant is the average age of property, plant and equipment owned by the hospital. The deduction percentage measures the proportion of total patient charges that are given up as discounts and allowances. Composite of four components of entity s financial condition that reflects an organization s overall financial condition. The Debt-to-Capitalization ratio is a new ratio added to the 2013 Critical Access Hospital study. This ratio measures the utilization of long-term sources of debt financing. This ratio is many times used as a covenant in capital financings. Table 4 describes how each financial ratio is calculated. 13
18 Table 4: Financial Ratio Calculation RATIO Days in Accounts Receivable (net) Days Cash on Hand Operating Margin Total Margin Average Age of Plant Deduction Ratio Financial Strength Index Debt-to-Capitalization CALCULATION Net accounts receivable/net patient revenue per day Cash/(Operating expenses less depreciation/365) Total operating revenue-total operating expenses/total Operating revenue Excess of revenue over expenses/total revenue Accumulated depreciation/depreciation expense Total patient revenue-net patient revenue/total patient revenue See discussion below Long-Term Debt/Long-Term Debt plus Fund Balance The FSI is a financial measure that reflects an organization s overall financial condition. The FSI encompasses four major components of an entity s financial condition: liquidity, profitability, capital structure, and physical plant age. The formula for the FSI uses four financial ratios from an organization s balance sheet and income statement. Table 5: Financial Strength Index Dimensions and Measures Dimensions of Financial Measured by Strength Profits Total margin Liquidity Days cash on hand Debt expense Debt financing % Age of physical facilities Average age of plant Each of the four measures is normalized around a predefined average for the measure. Adding the four measures creates a composite indicator of total financial strength. Thus, the formula for calculating the FSI is as follows: FSI = [(Total Margin - 4.0) / 4.0] + [(Days Cash on Hand - 50) / 50] + [(50 - Debt Financing Percent) / 50] + [(9.0 - Average Age of Plant) / 9.0] Organizations that have high margins, lots of cash, little debt, and new facilities are in better financial condition and have higher FSI. On the other hand, entities with losses, little cash, lots of debt, and old physical facilities have lower ratios. Table 6 is a suggested guide to rate FSI. 14
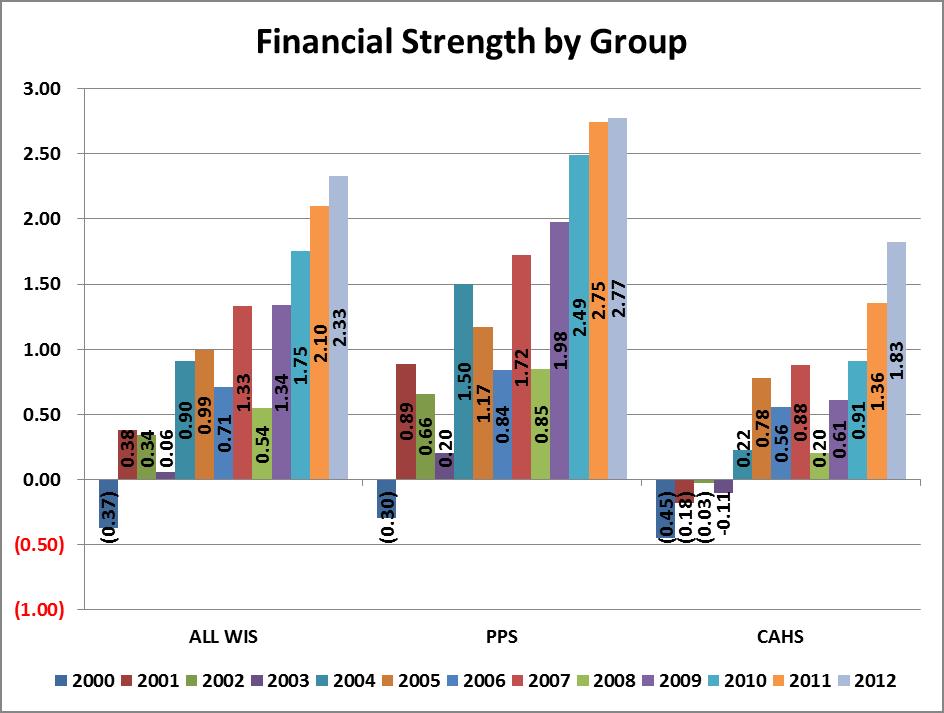
19 Table 6: Financial Strength Index Rating Guide Score Financial Health Greater than 3 Excellent 0 to 3 Good -2 to 0 Fair Less than -2 Poor FSI seeks to combine the effects of four financial performance ratios in order to reveal the impact of changes in the organization. If one area of the organization s finances improves but others regress, the FSI will properly reflect the tradeoff. For example, if an entity increased its cash position simply by issuing additional debt, the improvement in cash on hand will be offset by the increase in debt financing percent. No single financial measure, however, is capable of assessing the financial health of an organization. 1 Prior studies showed an improvement in the FSI for CAHs and PPS facilities in 2004, decreasing in 2005 and 2006 and increasing again in The FSI for both groups decreased in The following graph shows improvement in the FSI in 2009, 2010, 2011 and While the FSI for PPS continues to be higher than for CAHs, CAH FSI increased more than PPS facilities in 2011 and The 2012 FSI for both groups is Good according the FSI rating guide (See Table 6). 1 SOURCE: The Financial Strength Index: A Measure of a Firm s Overall Financial Health, by William O. Cleverley, Ph.D., President, Cleverley & Associates, and Andrew E. Cameron, Ph.D., MBA, Assistant Professor, Ohio State University. Published in the January 2003 issue of HFMA s newsletter, Executive Insights. 15
20 16
21 17

22 TOTAL MARGIN As indicated in Table 4, Total Margin represents the percent of Net Income to Net Patient Revenue. Total Margin ratio includes both operating and non-operating income. Increasing trends are favorable financial indicators. From 2000 through 2004, CAHs Total Margin lagged behind PPS facilities. In 2005 and 2006, Total Margin for CAHs was higher than for PPS hospitals. In 2007 and 2008, CAHs fell slightly below PPS but still had a Total Margin of approximately 8%. In 2009, Total Margin for CAHs increased slightly over 2008 to 4.88% while PPS facilities experienced a more dramatic increase to just over 8%. In 2010, CAHs Total Margin continued to improve to 5.63% and PPS facilities also showed a small increase to 9.05%. For 2011 and 2012, CAH Total Margin increased to slightly over 7% which was about 2% less than PPS facilities. 18

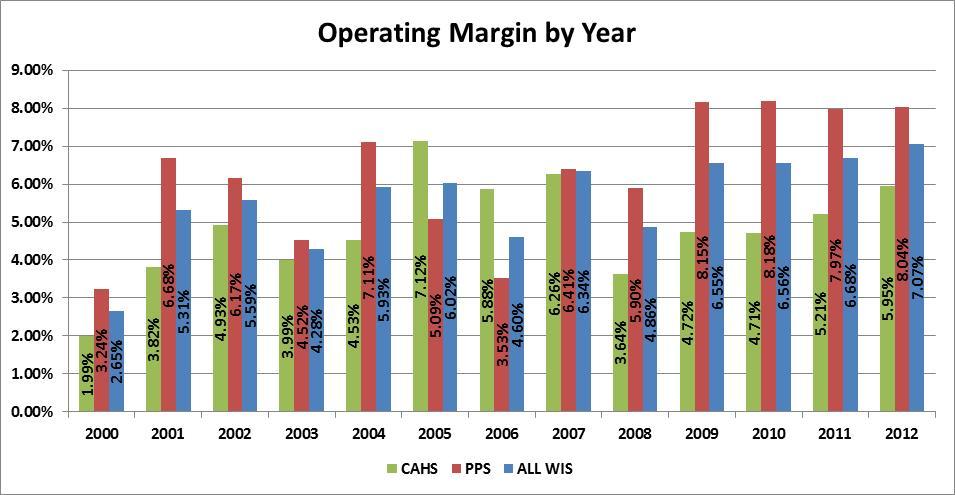
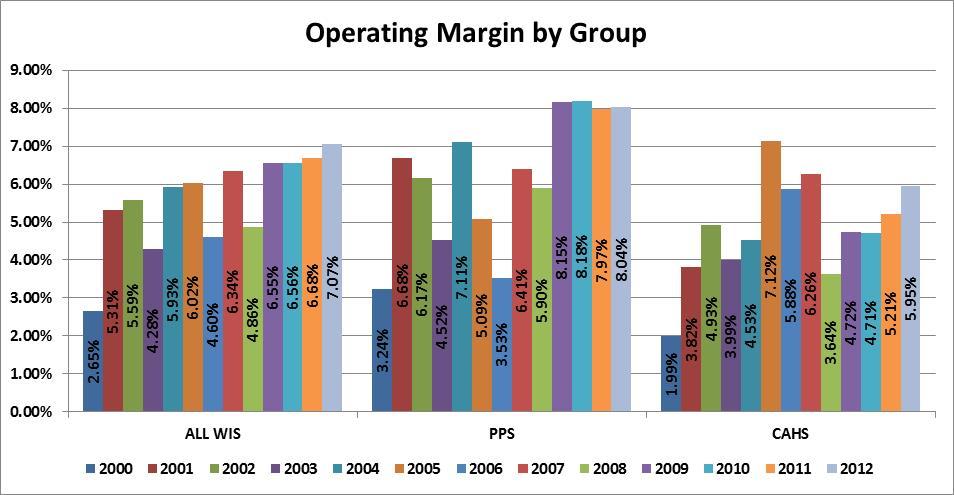
23 OPERATING MARGIN RATIO The Operating Margin ratio measures the percent of operating income to total operating revenue. It is used by many analysts as a primary measure of operating profitability. The Operating Margin ratio does not reflect investment income or losses. The following graphs indicate that PPS facilities since 2009 continue to have Operating Margins at about 8%. Operating Margins for CAHs increased in 2011 and CAH Operating Margin in 2012 was just under 6%. 19
24 20
25 OPERATING/TOTAL MARGIN COMPARISON Even though Operating Margins remained relatively flat for 2009 through 2012, because of improved non-operating investment performance, PPS and CAH facilities Total Margins increased during the most recent four year timeframe. CAH Total Margin was slightly over 7% in 2011 and 2012 while PPS Total Margin for the same two year period was just over 9%. 21
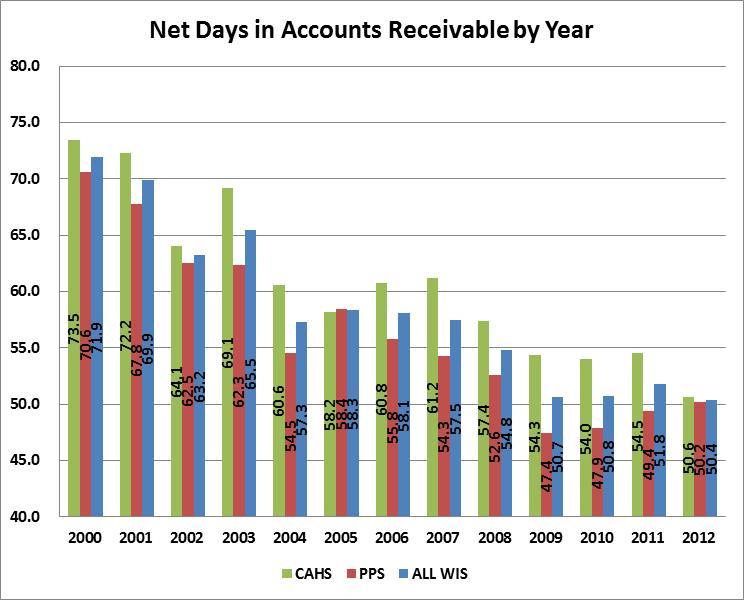
26 NET DAYS IN ACCOUNTS RECEIVABLE Net Days in Accounts Receivable is a ratio that indicates how quickly services are billed and paid. Generally, low numbers for this ratio are favorable. Decreasing trends show improvement in the collection process. Lower Net Days in Accounts Receivable is a positive trend that usually translates into higher cash account balances. Both groups have shown a general improvement in collecting accounts receivable from 2000 through CAHs Net Days decreased in 2008, 2009, and Net Days for both groups remained about the same from 2010 to CAHs Net Days in Accounts Receivable for 2012 decreased by approximately four days. CAH and PPS facilities both had about 50 Net Days in Accounts Receivable in The challenge for all facilities will be to maintain low Days in Accounts Receivable during the approaching transition to the ICD-10 coding system (discussed in the ICD-10-CM/PCS section of this study. 22
27 23

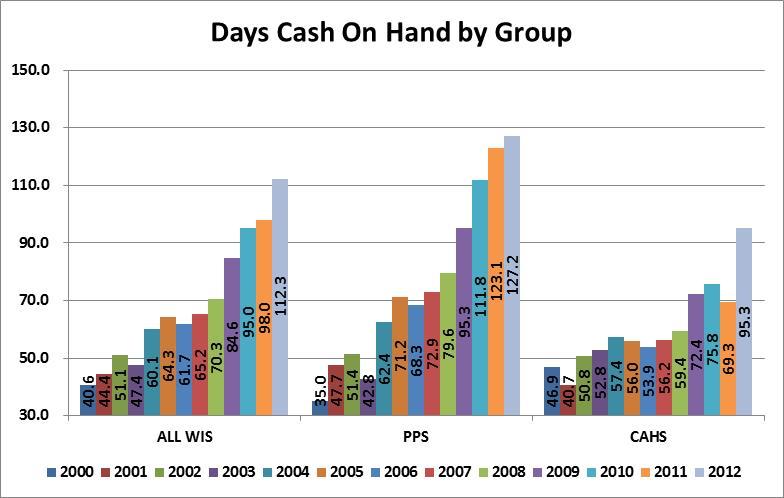
28 DAYS CASH ON HAND The Days Cash on Hand ratio indicates how many days cash the facility has based on the average daily cash expenditures. High ratios are favorable and an increasing trend in this ratio is also favorable. The following graphs show a substantial increase for both groups in However, Days Cash on Hand showed a higher increase in 2012 for CAH facilities than for PPS. As mentioned previously, Days in Accounts Receivable impacts Days Cash on Hand. The major imminent change to ICD-10 coding system discussed in this study could potentially increase Accounts Receivable Days and decrease Days Cash on Hand. 24
29 25
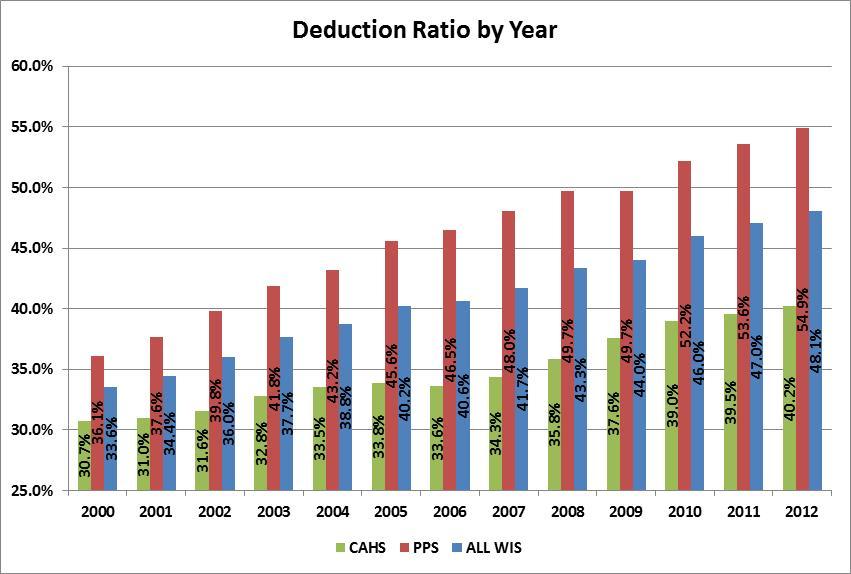
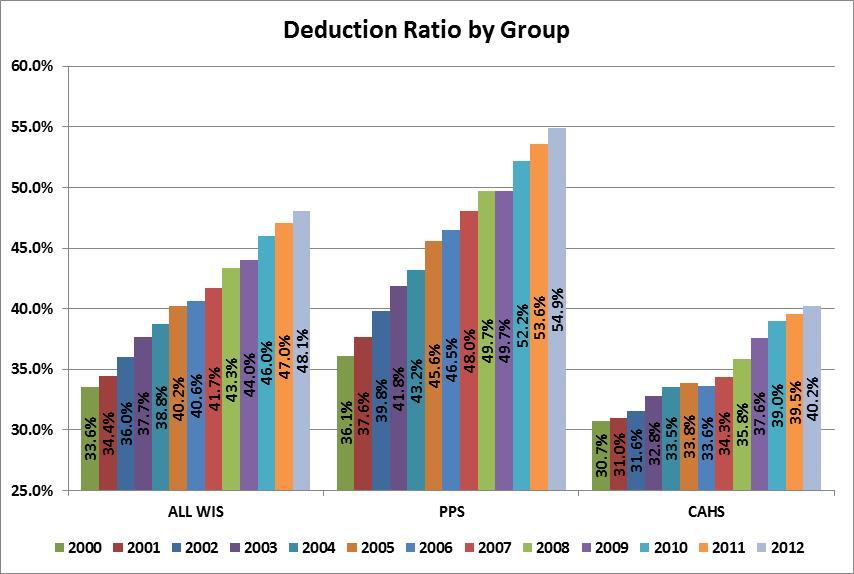
30 DEDUCTION RATIO The deduction ratio shows the percent difference between hospital charges and actual cash paid for services provided. The deductions include government payers such as traditional Medicare and Medicaid, Health Maintenance Organizations (HMO), Preferred Provider Organizations (PPO), Medicare Advantage plans, Medicaid HMO plans, and private pay discounts including charity care. During the study period, bad debts are considered expenses and are not included in the deduction ratio. However, in July 2011, the Financial Accounting Standards Board (FASB) published an Accounting Standards update for Healthcare Entities entitled Presentation and Disclosure of Patient Service Revenue, Provision for Bad Debts, and the Allowance for Doubtful Accounts for Certain Health Care Entities. The amendments in this update require certain health care entities to change the presentation of their statement of operations by reclassifying the provision for bad debts associated with patient service revenue from operating expense to deduction from patient service revenue (net of contractual allowances and discounts). This change to the treatment of bad debts will affect future financial statements and related financial rations. Although all periods covered in this report treat bad debts as an expense, future financial analysis will need to address this change. The gap in increases in hospital prices over increases in in Medicare inpatient prospective payments contributes to the rise in the deductible ratio. For CAHs, average charges increase typically more than cost-based reimbursement for traditional Medicare and potentially Medicare Advantage plans. The following graph indicates a steady increase in the deduction ratio for all groups from 2000 through It also shows a much higher ratio for PPS than for CAHs. Payer mix, managed care penetration, and charge structure are three reasons the deduction ratio may be higher for some facilities. 26
31 27
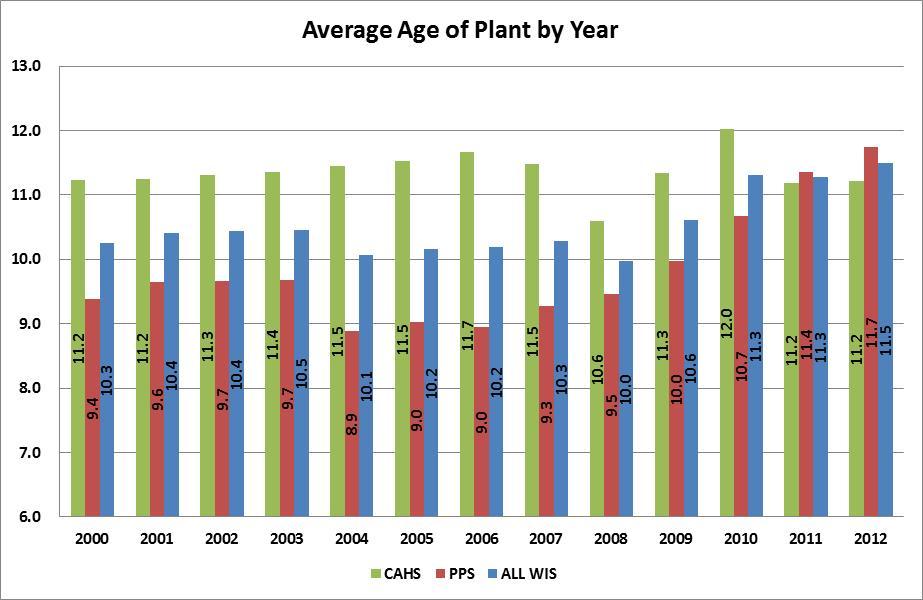
32 AVERAGE AGE OF PLANT Many hospitals, both PPS and CAHs, struggle to replace outdated facilities and equipment. Average Age of Plant is typically used as a benchmark to measure capital improvements. It is generally felt that the Average Age of Plant should be less than 10.0, and some financial analysts feel that it should be closer to 7.5. Average Age of Plant is calculated by dividing Accumulated Depreciation by Depreciation Expense. Lower ratios and decreasing trends are usually associated with financially strong organizations. The following graphs show a decrease in Average Age of Plant for CAHs in 2011 to PPS facilities showed an increase in Age of Plant in 2011 to 11.4 years. Average Age of Plant for both groups remained about the same in This is the first study that shows Age of Plant is higher in PPS hospitals than CAHs. Although many factors determine how much money hospitals invest in capital, the graph would seem to indicate that CAH status may be helping rural hospitals modernize plants and equipment. One factor which may affect future capital investment and the resulting Average Age of Plant ratio is the American Recovery and Reinvestment Act of 2009 (ARRA). This legislation helps provide hospitals the funding and incentives to implement systems such as Nurse Documentation, Electronic Medication Administration Records, Bedside Medication Verification Systems, or Computerized Practitioner Order entry. Utilized correctly, these systems can improve efficiency and the quality of patient care. This program is further discussed in the Health Information Technology section of this study. Access to capital will continue to be one a top priority of all hospitals. Smaller hospitals usually find it more difficult to access capital than larger organizations. Some rural hospitals are due for major renovation or replacement. Aged facilities can become very inefficient and affect quality of care and patient safety. Even financially strong hospitals have more limited borrowing options, higher cost of capital, and more restrictive debt terms. Capital needs continue to be near the top of the list of priorities for rural hospitals. Hospitals that cannot obtain capital may even need to secure partners or merge with larger organizations to access needed capital resources. Another factor that will affect Average Age of Plant is the potential impact of PPACA health care reform. Facilities may decide due to the financial uncertainties of healthcare reform to wait on major investments in capital projects. 28
33 29

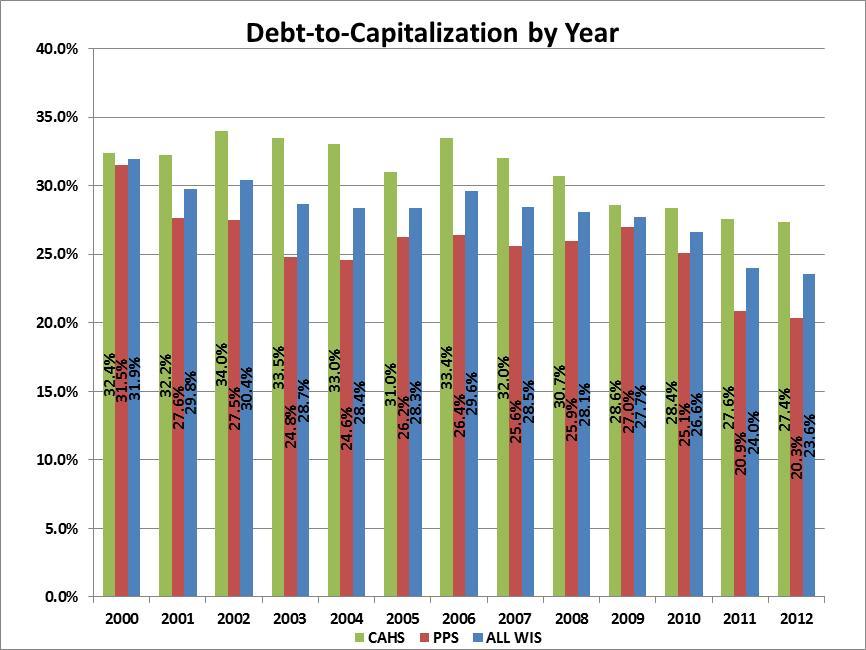
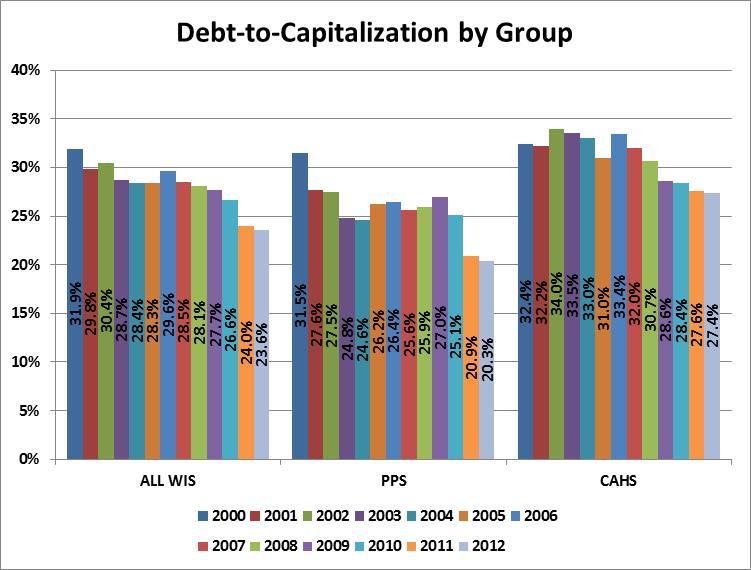
34 DEBT-TO-CAPITALIZATION The Debt-to-Capitalization ratio is a new ratio added to the 2013 Critical Access Hospital study. This ratio measures the utilization of long-term sources of debt financing. This ratio is many times used as a covenant in capital financings. A commonly used maximum debt-to-capitalization covenant is 60%. The Debt-to- Capitalization ratio is affected by the patterns of long-term borrowing, debt retirement, and changes in Fund Balance. It is especially important to maintain favorable debt-to-capitalization ratios when new financing is being completed. The ability to attract debt capital on favorable terms may be related to debt-tocapitalization experience. The Debt-to-Capitalization ratio is calculated by dividing Long-Term Debt by Long-Term Debt plus Fund Balance. Decreasing values for this ratio is favorable. Low values are also favorable. The following two graphs show a decreasing trend in Debt-to-Capitalization for both PPS and CAHs from 2006 through CAHs have a higher Debt-to-Capitalization than PPS facilities. 30
35 31
36 32
37 CHANGES IN SERVICES The first Wisconsin hospital converted to critical access status in We now have thirteen years of data from the Annual Survey of Hospitals. This is sufficient time to determine if there are trends in services Wisconsin hospitals are provide. The Fiscal and Annual Surveys for the last several years have been submitted to the WHA Information Center. The Annual Survey of Hospitals requires hospitals to report on a very comprehensive list of services. Typically, hospitals must indicate by a code number is the service is provided or not. The possible codes are from 1 to 5. The first 4 codes indicate how and where the service is provided or if the service is available through a contractual arrangement with another provider. Code 5 indicates the service is not available either by the hospital or through a formal contractual arrangement with another hospital or provider. As in the prior study, this report will determine the % of CAH or PPS facilities that do not provide the service (code 5). As mentioned, CAHs are reimbursed 101% of the cost they incur for covered hospital inpatient, outpatient, and swing bed services provided to Medicare beneficiaries. Medicare cost-finding reimbursement principles require that all services be subjected to the allocation of overhead costs such as depreciation, utilities, and housekeeping. For example, if a hospital provides long-term care, direct and indirect costs are allocated to Skilled Nursing Facility (SNF). Medicare does not pay for all services and their share of the services varies. For example, if a facility provides Meals-On-Wheels to members of their community, Medicare does not participate in the costs because this service is not covered by Medicare. Additionally, Nursery and Obstetric services are provided by almost all facilities but because Medicare beneficiaries are almost exclusively over 65, Medicare utilization is minimal. Another example of how financial considerations may affect which services CAHs provide is SNF. Although the SNF may be Medicare-certified, SNF s are not cost reimbursed. The SNF Medicare payment system is based on prospective Resource Utilization Groups (RUGS). CAHs may face low RUG rates and relatively low volume, the same problems they confronted when they were paid under the Medicare prospective payment system for hospital services. The following graphs show the % of hospitals that do not provide services by CAHs, PPS, and both groups combined. The % of CAHs that do not provide long-term care services has increased from 56% in 2000 to 73% in The % of CAHs providing long-term care services is still higher than for PPS facilities. In 2012, over 92% of PPS hospitals did not provide this service. 33
.")
38 In spite of the fact that the % of PPS facilities that do not provide Psychiatric inpatient care services has increased from slightly over 33% in 2000 to about 38% in 2012, a much higher % of CAHs do not provide this service than PPS hospitals (78% for CAHs in 2012 versus 38% for PPS). 34

39 The % of PPS facilities that do not provide Alcoholism and Chemical Dependency Inpatient Care has remained relatively unchanged from 2000 to 2012 (approximately 40%). However, there has been a substantial increase in the % of CAHs that do not provide this service. The % of CAHs that do not provide Alcoholism and Chemical Dependency Inpatient Care has risen from just under 60% in 2000 to over 87% in
40 The analysis of Home Health Services shows a similar trend to the prior graph of Alcoholism and Chemical Dependency Inpatient Care service. More CAHs are deciding not to provide Home Health services as the % that do not provide this service has increased from 31% in 2000 to over 41% in The % of PPS facilities that do not provide Home Health Services remained relatively stable at about 12% from 2000 through The % of PPS facilities not providing Home Health Services increased to almost 16% in
.")
41 The % of PPS hospitals not providing Hemodialysis Services increased from 7.7% in 2011 to about 10% in 2011 and slightly over 11% in In contrast, a much higher % of CAH facilities do not provide Hemodialysis (62.5% in 2012). The % of CAHs that do not provide Hemodialysis has remained about the same since

42 The analysis of Hospice Services shows more CAHs are deciding not to provide this service as the % not providing Hospice Care has increased from 10% in 2000 to 25% in The % of PPS facilities that do not provide Hospice Services increased from 17% in 2011 to 22% in
43 Hospitals decide what services to provide based on a number of factors such as community need, make-up of the medical staff, impact on overall financial performance or to gain advantage over competitors. Each facility must determine which services contribute to the health of their communities as well as their own financial health. Hospitals, either PPS or CAHs, may determine the net financial loss of providing a particular service outweighs any advantages. The financial impact on Medicare cost-based payments of providing certain services can be a factor for CAHs in deciding what services to provide. CAHs may decide that because of the cost report methodology for allocating cost to nonreimbursable service, the service cannot be provided without risking the financial health of the overall organization. PPS facilities may be able to continue to provide some services paid prospectively because their higher volumes help to cover fixed costs. Some services may also have a total positive financial impact on the organization. 39
44 UTILIZATION The following charts show the percentage change from the year 2000 through 2012 for several key services. CAHs inpatient days (excluding Swing Bed and Newborn Days), have decreased 36% from 2000 to Inpatient days increased for PPS facilities over the same period by 4.56%. 40

45 The number of surgical procedures for CAHs has increased by over 15% since 2000 while the number of surgical procedures for PPS facilities increased by over 48%. 41
46 The number of births at CAHs has decreased by slightly below 7% since 2000 while the number of births for PPS facilities increased by over 6%. 42

47 Newborn Days at CAHs have decreased by 5.59% from 2000 to The % increase in Newborn Days at PPS facilities over the same time period is 8.82%. 43

48 The % change in Emergency Room visits for PPS facilities from 2000 to 2012 is 39%. CAHs showed a % change over the same time period of almost 17%. The Utilization graphs show a decline for the CAH facilities over the 12 years for key statistics like Patient Days. Some of decrease in Patient Days can be attributed to the CAH rules regarding the 96 hour length-of-stay rule and the 25- bed limitation. However, even services that have increased like Surgical Procedures and Emergency Room Visits have not kept pace with the volumes at PPS facilities. One reason CAH's are experiencing a higher drop in inpatient activity than PPS hospitals is the shift to outpatient services. As the following charts show, even though Outpatient Revenue as a % of Gross Revenue for both PPS and CAHs is increasing, CAHs consistently have a much higher percentage of revenue from outpatient services than their PPS counterparts. 44
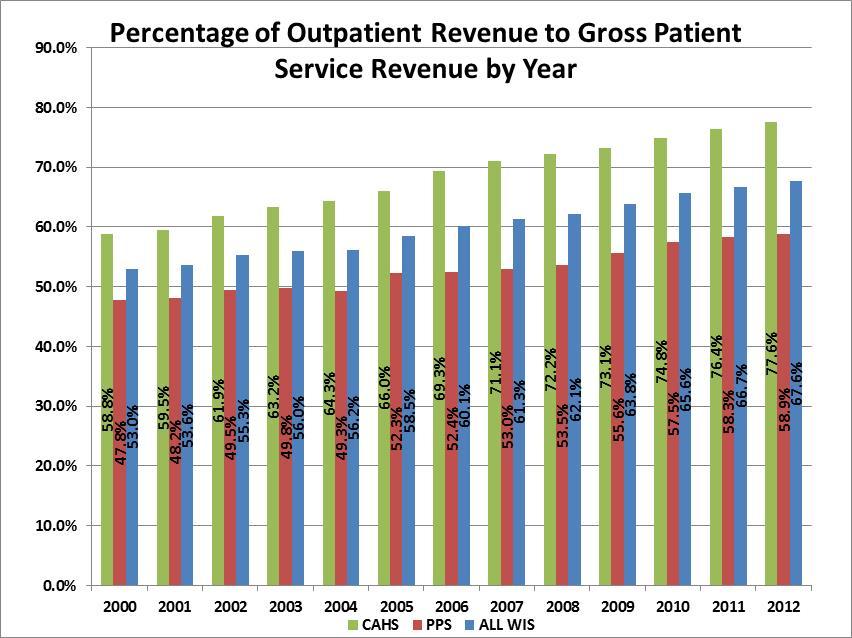
49 45
 (ICD-9) is a set of codes currently used by physicians, hospitals, and allied health workers to indicate diagnosis for all patient encounters. ICD-9 has been in use since the 1970 s.")
50 ICD-10-CM/PCS (International Classification of Diseases, 10th Edition, Clinical Modification /Procedure Coding System) CD-10 ICD-9-CM (International Classification of Diseases, 9th edition, Clinical Modification) (ICD-9) is a set of codes currently used by physicians, hospitals, and allied health workers to indicate diagnosis for all patient encounters. ICD-9 has been in use since the 1970 s. The 2011 Critical Access Hospital study discussed the pending transition from ICD-9 code sets to ICD-10-CM/PCS (International Classification of Diseases, 10th Edition, Clinical Modification /Procedure Coding System) (ICD-10) code sets. At the time the 2011 study was released the transition to ICD-10 codes was to occur on October 1, In August, 2012, CMS announced the transition was being delayed one year to October 1, In announcing the delay, CMS stated By delaying the compliance date of ICD-10 from October 1, 2013, to October 1, 2014, we are allowing more time for covered entities to prepare for the transition to ICD-10 and to conduct thorough testing. ICD-10 consists of two parts: ICD-10-CM captures diagnosis coding and will be used for all U.S. health care settings. ICD-10-PCS captures procedure coding and will be used only for inpatient procedure claims. One reason for the transition is because ICD-10 produces additional information about patients medical conditions and hospital inpatient procedures. This additional detail will be useful, for we are 46
51 entering into a world of data analytics where our data is being utilized for a multitude of functions and reimbursement related initiatives. Having ICD-10 details will add to the kind of intelligence that is needed to support these initiatives. Diagnosis coding under ICD-10-CM uses 3 to 7 alphanumeric characters instead of the 3 to 5 digits used with ICD-9-CM. ICD-10-PCS uses 7 alphanumeric characters instead of the 3 or 4 numeric digits used under ICD-9-CM procedure coding. Coding under ICD-10-PCS is much more specific and substantially different from ICD-9-CM procedure coding, as it will capture the body system and part, the approach and devices used. This will help to account for the length of stay, risks, utilization of ancillary services, as well as surgeon s skill. Many providers, payers, and software vendors developed a business plan early on for effectively completing the transition to ICD-10. They also have adequately budgeted for the substantial costs of the implementation of ICD-10. Health Information Managers have and continue to educate coders, clinicians, physicians, billers, Information Technology staff, and Finance Staff. They are working with their software vendors, clearinghouses, third-party billing services, and payers to ensure all affected parties are ready for this major transition. When CMS announced grounds for the delay, they indicated extensive internal as well as external testing of the new coding system would be vitally important to validate readiness and process claims accurately. Some surveys indicate many hospitals, especially smaller facilities, will not be ready for ICD-10. This is concerning, as hospitals risk delays in payments and will incur additional costs to resubmit claims if incorrect codes are used. Disruption of payment flow with resulting increase in receivables could result if claims are rejected. Payments could be affected for all code-based services. For PPS facilities, failure to use correct codes could negatively affect their Medicare case-mix index. Although some unspecified ICD-10 codes will be available for use, their frequent use may jeopardize payment and unjustly reports the acuity of the patient s condition. Clinical documentation improvement strategies will promote and support the ICD-10 data elements. Quality reporting could also be affected due to lack of adequate documentation. Because of the magnitude of the transition and the consequences of delays in billing and resulting payments, some providers have developed plans for the financial implications of decreased cash flow. The plans may include managing inventory levels, renegotiating payment terms with suppliers, and having contingency plans with financial institutions for working capital needs. CMS has indicated there will be no further delay in ICD-10 implementation, so a focused and disciplined effort towards ICD-10 transition will be essential as we move into
52 ELECTRONIC HEALTH RECORDS The 2011 study discussed the American Recovery and Reinvestment Act of 2009 (ARRA). The major goal of ARRA is to modernize health care through the use of information technology. To encourage adoption of electronic health records by 2015, the federal government is investing $36 billion in Medicare and Medicaid providers. To receive an Electronic Health Record (EHR) incentive payment, the provider (eligible professional (EP), eligible hospital or CAH must demonstrate meaningful use of certified EHR technology. As of June 2013, CMS reports that over $15 billion in EHR incentive payments have been distributed to eligible providers. Of that amount, almost $10 billion has been distributed to hospitals in Medicare and Medicaid payments. While some CAHs are struggling to meet meaningful use standards, many have already received Medicare and Medicaid EHR incentive payments. The accounting for these incentive payments in discussed further in the Financial Performance Analysis section of this study. Sequestration is also discussed separately in this study. It is noted here that Medicare EHR Incentive Payments will be reduced due to sequestration for reporting periods that end on or after April 1, Medicaid EHR Incentive Payments are exempt. RECENT LEGISLATION Although most legislation challenges health care providers, many healthcare experts would argue that the Patient Protection and Affordable Care Act (PPACA) could potentially change the entire health delivery system. Over the next several years, major changes in the health insurance market, federal incentives and tax changes for businesses and individuals, cost reduction programs, quality initiatives and the related issues of providing services to the newly insured will create many problems but also opportunities. Following is a discussion of the major healthcare initiatives since PATIENT PROTECTION AND AFFORDABLE CARE ACT The Patient Protection and Affordable Care Act (PPACA) (P.L ) was enacted March 23, 2010 and the related Health Care and Education Reconciliation Act of 2010 (P.L ) was enacted March 30, Since the 2011 study, implementation of PPACA has taken several turns. Following is a discussion of some of the federal and state developments since
 (5-4) is constitutional on the basis that is a tax rather than being")
53 SUPREME COURT DECISION Opponents of PPACA turned to the federal courts to challenge the constitutionality of the legislation. On June 28, 2012, the Supreme Court upheld most of the law, ruling the individual mandate (see following additional discussion) (5-4) is constitutional on the basis that is a tax rather than being authorized by the Commerce Clause. The court also determined that States could not be forced to participate in the Medicaid expansion, effectively allowing states to opt out of this provision. As of the date of this study, Wisconsin has chosen this option (see map below). The impact of opting out of Medicaid expansion is further discussed in the Medicaid section of this study. PPACA originally would have withheld all Medicaid funding from states declining to participate in the expansion. The Supreme Court decision ruled that this withdrawal of funding was unconstitutionally coercive, and that states have the right to opt out of the Medicaid expansion without losing existing Federal Medicaid funding. The Court decision meant all other provisions of PPACA would continue in effect or would take effect as scheduled (subject to States determination on Medicaid expansion). Medicaid Expansion by State, July 1, 2013 States expanding Medicaid States not expanding Medicaid States still debating Medicaid expansion 49
54 HEALTH INSURANCE EXCHANGES A Health Insurance Exchange is a set of government-regulated and standardized health care plans from which individuals may purchase health insurance eligible for federal subsidies. Under PPACA the individual mandate requires that all individuals purchase health insurance, at the risk of incurring a fine that grows every year. Within the exchanges, insurance plans are to be offered in four tiers designated from lowest premium to highest premium: bronze, silver, gold, and platinum. The four levels of coverage, which vary depending on how much the insurer pays, include: Bronze: benefits equivalent to 60% of the full actuarial value of plan benefits, Silver: benefits actuarially equivalent to 70% of full value, Gold: benefits actuarially equivalent to 80% full value, and Platinum: benefits actuarially equivalent to 90% of full value. Low to moderate income individuals and families who purchase coverage through the Exchanges may be eligible for premium subsidies in the form of tax credits starting in Generally, subsidies will not be available to people with access to health coverage through an employer. PPACA prohibits denying coverage for pre-existing conditions starting in PPACA requires plans and issuers that offer dependent coverage to make the coverage available until a child reaches the age of 26. PPACA requires every state to have an Insurance Exchange. While the law requires each state to have an Insurance Exchange, states have the option of running their own Exchange or handing that authority over to the federal government. On November 16, 2012, Wisconsin notified federal officials that it would default to a federally-facilitated health insurance exchange. The federal government will assume full responsibility for running a health insurance exchange in Wisconsin beginning in

55 The following map shows which States have chosen to default to the federal health insurance exchange: DELAY IN EMPLOYER MANDATE On July 2, 2013 the Department of Treasury announced that it would provide an additional year before the PPACA mandatory employer and insurer reporting requirements begin. PPACA imposes penalties on applicable employers that do not offer minimum essential coverage to full-time employees and dependents. The Obama Administration stated the reason for the delay was to allow time for it to consider ways to simplify the new reporting requirements consistent with the law. INDIVIDUAL MANDATE As previously discussed in the Supreme Court Decision section, the Supreme Court ruled the individual mandate is constitutional on the basis that is a tax rather than being authorized by the Commerce Clause. Beginning in 2014, 51
56 PPACA requires most citizens to have qualifying health insurance coverage (public or private) or pay a tax for not carrying insurance. Qualifying is broadly defined by the law. Government programs like Medicare, Medicaid, and CHIP automatically qualify. Taxes begin in 2014 and rise in years following. In each year, the tax consists of the higher of a dollar amount or a percentage of household income. For a given household, the tax applies to each individual, up to a maximum of three. Following is the schedule of taxes: 2014: The higher of $95 per person (up to 3 people, or $285) OR 1.0% of taxable income. 2015: The higher of $325 per person (up to 3 people, or $975) OR 2.0% of taxable income. 2016: The higher of $695 per person (up to 3 people, or $2,085) OR 2.5% of taxable income. After 2016: The same as 2016, but adjusted annually for cost-of-living increases. The individual mandate tax requires insurance or tax in lieu of insurance coverage. Subsidies, called health insurance premium tax credits may be available to eligible households. QUALITY AND PATIENT SAFETY MEASURES The challenge prior to the PPACA was to improve quality while reducing costs. PPACA made quality improvement and measurement an even higher priority for all healthcare providers, not just hospitals. There are more than 40 sections of the law that affect how to improve, measure, and pay for quality of care. It is beyond the scope of this study to analyze all the sections of PPACA related to quality issues but following is a general discussion of some of the changes. It must be noted that some Medicare penalties and provisions of PPACA affect prospective-payment providers and not cost-based payments to CAHs. However, regardless of financial class, many consumers will review and consider quality and patient safety measures when they select a healthcare provider for their own or family member s care. One area PPACA strongly addresses is readmission rates. PPACA will penalize hospitals with high readmission rates. The general definition of a readmission is a hospital admission 30 days from the date of discharge from the initial hospitalization hospital. Hospitals with high readmission rates could lose Medicare reimbursement of 1% in 2013, 2% in 2014, and 3% in The penalty will be in addition to other Medicare cuts. Other provisions of the PPACA, such as Medicare's Value-Based Purchasing Program (VBP) also 52
57 encourage providers to reduce readmissions. PPACA requires CMS to implement a VBP program that rewards hospitals for the quality of care they provide. Under the VBP program, CMS will evaluate hospitals performance during a performance period based on both achievement and improvement on selected measures. Hospitals will receive points on each measure based on the higher of their level of achievement relative to an established standard or their improvement in performance from their performance during a prior baseline period. Their combined scores on all the measures will be translated into valuebased incentive payments for discharges occurring on or after October 1, PPACA requires CMS to fund the aggregate VBP incentive payments by reducing the base operating diagnosis-related group (DRG) payment amounts that determine the Medicare payment for each hospital inpatient discharge. The law sets the reduction at 1 percent in FY 2013, rising to 2 percent by FY For the FY 2013 VBP program, CMS will measure hospital performance using two criteria: the clinical process of care criteria, which is comprised of 12 clinical processes of care measures, and the patient experience of care criteria, which is comprised of Hospital Consumer Assessment of Healthcare Providers and Systems (HCAHPS) survey measure. Hospitals are using several techniques to minimize avoidable readmission rates. One technique is improving communication and following up with discharged patients. Another technique that has become is the use of post-discharge clinics where the patient receives assistance until the primary care physician assumes responsibility for their care. A third technique is to provide a transition coach who monitors and educates the patient. One of the main goals of these techniques is to develop an effective readmission plan and avoid the penalties. Another goal of PPACA is to reduce Hospital-Acquired Conditions (HAC). Hospitals will be penalized for having a high incidence of HACs, and the 25 percent worst performing hospitals with respect to HACs will only be paid 99 percent of what they would otherwise receive from Medicare. Starting in FY 2015, hospitals will have to report on two domains of measures related to HACs. Payments may be affected starting in FY As mentioned, true to the Patient Protection part of the name, there are many provisions in PPACA related to quality and patient safety. Over the next several years, the emphasis will be to develop systems to accurately measure and reward quality and less on the quantity of services provided. One model that is being tested to accomplish the goals of higher quality and less cost is an accountable care organization (ACO). An ACO is a payment and care delivery model that seeks to tie provider reimbursements to quality cost savings for an assigned population of patients. ACOs are composed mostly of hospitals, physicians, and other healthcare professionals. Section 3022 of the PPACA 53
58 allowed for the establishment of ACO contracts with Medicare by January CMS recently reported early results of an accountable care organization (ACO) model called Pioneer. The Pioneer ACO model was specifically designed by CMS for organizations experienced in coordinated care and risk-sharing. CMS recently released the results from the first performance year of the Pioneer ACO model. The early results from the Pioneer ACO program show that a majority of participating health systems indicated improvement in care delivery and promise in the area of cost savings, including the ability to participate in those cost savings. More testing of ACO s will determine if this model consistently generates savings while improving quality. At this early stage, the long-term impact on providers is also unclear. AMERICAN TAXPAYER RELIEF ACT OF 2012 Although the American Taxpayer Relief Act of 2012 (the Act) enacted January 2, 2013, did not receive as much attention as PPACA, this law had many healthrelated provisions that providers must be aware of. The Act prevented scheduled Medicare payment cuts for physicians and other practitioners from taking effect on January 1, The Act provided for a zero percent update for physician services through December 31, The Act extended several provisions of the Middle Class Tax Relief and Job Creation Act of 2012 (Job Creation Act) as well as provisions of the Affordable Care Act (see Patient Protection and Affordable Care Act (PPACA), discussed in the Recent Legislation section of this study. Section 603 extends the exceptions process for outpatient therapy caps through December 31, Section 603 extends the application of the cap and threshold to therapy services furnished in a hospital outpatient department, and counts outpatient therapy services furnished in a Critical Access Hospital towards the cap and threshold. Section 604 extends several Job Creation Act ambulance payment provisions. Section 605 allows qualifying low-volume hospitals to receive add-on payments based on the number of Medicare discharges. To qualify, the hospital must have less than 1,600 Medicare discharges and be 15 miles or greater from the nearest like hospital. This provision extends the payment adjustment through September 30, 2013, retroactive to October 1, Section 606 extends the Medicare-Dependent Hospital (MDH) Program. The MDH program provides enhanced payment to support small rural hospitals for which Medicare patients make up a significant percentage of inpatient days or discharges. This provision extends the MDH program until October 1, 2013, and is retroactive to October 1, The Act also postponed implementation of the majority of sequestration until March 1, 2013, and Medicare cuts until April 1,
59 MEDICARE BAD DEBTS Starting in Federal Year 2013, Medicare bad debt payments will be reduced. Among the providers affected by this change will be PPS hospitals, skilled nursing facilities (SNFs), and CAHs. The Center for Medicare & Medicaid Services (CMS) expects the change in bad debt reimbursement to save Medicare almost $11 billion over 10 years. Until the end of fiscal year 2012 (September 30, 2012), CMS reimbursed 70% of the bad debt incurred by PPS hospitals and 100% of CAH bad debts. PPS bad debt reimbursement will decrease to 65% starting in FY CAH bad debt reimbursement will drop to 88% in FY 2013, 76% in FY 2014, and 65% in FY CMS noted in the Final rule that the reduction in bad debt reimbursement will have a significant impact on the operations of a substantial number of small entities and small rural hospitals. The following table from the November 9, 2012, Federal Register shows the percent of Medicare Bad Debt reimbursement by provider type for Federal Year 2013, 2014, and TABLE 7 SUMMARY OF MEDICARE BAD DEBT REIMBURSEMENT BY PROVIDER TYPES FOR COST REPORTING PERIODS THAT Begin During FY 2013, 2014, 2015 AND SUBSEQUENT YEARS Provider type Allowable bad debt amount during FY 2012 (percent) Allowable bad debt amount during FY 2013 (percent) Allowable bad debt amount during FY 2014 (percent) Hospitals Allowable bad debt amount during FY 2015 & subsequent FYs (percent) SNFs: Non-Full Dual Eligibles Swing Bed Hospitals: Non-Full Dual Eligibles SNFs: Full Dual Eligibles Hospital Swing Beds: Full Dual Eligibles CAHs ESRD Facilities CMHCs FQHCs RHCs Cost Based HMOs Health Care Pre-Payment Plans Competitive Medical Health Plans Source: Federal Register/Vol. 77, No. 218/Friday, November 9, 2012 (67519) 55
60 The following table shows the estimated impact of the reduction in the Medicare Bad Debt reimbursement % on CAH, PPS, and All Study hospitals for 2013, 2014, and 2015: Table 8-ESTIMATED IMPACT OF REDUCTION IN BAD DEBT % TOTAL CAH $1,685,000 $3,371,000 $4,916,000 $9,972,000 PPS $1,341,000 $1,341,000 $1,341,000 $4,023,000 ALL STUDY HOSPITALS $3,026,000 $4,712,000 $6,257,000 $13,995,000 SEQUESTRATION Sequestration began because of the 2011 legislative struggle to raise the debt limit. The American Taxpayer Relief Act of 2012 briefly postponed Medicare cuts until April 1, The 2% reduction to Medicare fee-for-service payments resulting from the sequestration order applies to all payments for services furnished in the one-year period after the reductions begin. For Medicare, the reductions began on the first day of the first month after the order was issued, meaning they began on April 1, Accordingly, the sequestration order covers all payments for services with dates of service or dates of discharge from April 1, 2013, through March 31, The estimated net impact on Wisconsin hospitals of sequestration is summarized in the following table: Table 9-ESTIMATED 2% SEQUESTER IMPACT (ANNUAL BASED ON MOST RECENT FILED COST REPORT) PART A PART B SWING BED TOTAL CAH $3,253,240 $5,040,900 $1,131,840 $9,425,980 PPS $32,784,280 $14,361,140 $6,360 $47,151,780 TOTAL STUDY HOSPITALS $36,037,520 $19,402,040 $1,138,200 $56,577,760 The estimated calculated impact on the study hospitals only includes Part A, Part B, and Swing Bed sequestration. It does not include SNF s, Renal Dialysis, Hospice, Home Health, Rural Health Clinics, Psychiatric and other Medicare subproviders, EHR Medicare incentive payments, or any professional services paid on the Medicare Physician Fee Schedule. The Wisconsin Hospital Association (WHA) estimates that total sequestration will cost state hospitals $2 million a week in Medicare payments. 56
61 CURRENT DEVELOPMENTS Although volumes of data and many studies, including this one, conclude that the Critical Access program has been successful in improving the financial condition of many rural hospitals, the challenges to the program continue. Some challenges may be attributed to misinterpretation or lack of reliable and complete data. Other challenges may be attributed to competition for limited resources. Often, the quality of care of CAHs is compared to other hospitals. One example is the Journal of the American Medical Association study released in April, 2013 which concluded that adjusted death rates among Medicare patients in CAHs rose from 2002 to 2010 whereas mortality in other hospitals declined. The three conditions studied were acute myocardial infarction (MI), congestive heart failure, and pneumonia. However, another JAMA study reported patients undergoing eight commonly performed surgical procedures at CAHs are no more likely to die in a CAH hospital than patients undergoing the same surgeries at non-cahs. Another challenge to the Critical Access program was issued by the HHS Office of Inspector General (OIG) in August, The OIG report stated Medicare spent an extra $449 million in 2011 reimbursing facilities that do not meet the location requirements for critical access hospital status. The American Hospital Association, the National Rural Health Association, the Wisconsin Hospital Association (WHA) and the Rural Wisconsin Health Cooperative (RWHC) are among those who have objected to the OIG recommendation that CMS reassess and decertify many critical access hospitals for failing to fulfil location requirements. The OIG proposal would eliminate CAH status for as many as 53 Wisconsin CAH facilities. In a joint statement on the OIG proposal, WHA and RWHC stated: CAH status was enacted under the Balanced Budget Act of 1997 as Congress sought to address the closure of hundreds of rural hospitals across the country, which, due to their small size and care for disproportionately older, sicker and poorer patients, could not financially survive under Medicare s traditional payment system. Since that time the CAH program has operated efficiently, represents less than five percent of Medicare s total hospital budget, and has provided more than 60 million rural Medicare beneficiaries in the U.S. with access to health care that is close to home. 57
 than for urban service areas (see chart below): On a positive note, ivantage Health Analytics, a privately held company providing comprehensive and objective information and")
62 Also, a recent analysis by Stroudwater Associates based on data provided by Dartmouth Atlas of Healthcare (2010), the costs per Medicare beneficiary is lower for Rural PPS and Rural CAH Hospital Service Areas (HSA) than for urban service areas (see chart below): On a positive note, ivantage Health Analytics, a privately held company providing comprehensive and objective information and analytic solutions to help hospitals and health systems, released a report in March, 2013 of the Top 100 CAHs. The company rates hospitals on market condition, clinical and operational performance, and financial and qualitative outcomes. The Top 100 CAHs perform as well or better at the median overall than the full census of all U.S. general acute care hospitals and their Quality is near the Top Quartile when compared to all U.S. general acute care hospitals. Wisconsin led the nation by placing 13 hospitals in the Top 100. The hospitals are: HOSPITAL NAME CITY STATE Red Cedar Medical Center - Mayo Health Menomonie WI Tomah Memorial Hospital Tomah WI The Richland Hospital Richland Center WI River Falls Area Hospital River Falls WI Door County Memorial Hospital Sturgeon Bay WI Waupun Memorial Hospital Waupun WI Ministry Good Samaritan Health Center Merrill WI Upland Hills Health Dodgeville WI Memorial Health Center Medford WI Hudson Hospital Hudson WI Prairie du Chien Memorial Hospital Prairie du Chien WI Hayward Area Memorial Hospital Hayward WI Black River Memorial Hospital Black River Falls WI 58
63 Also, the National Rural Health Association (NRHA) recently announced Stoughton Hospital as one of the 20 highest ranked critical access hospitals (CAHs) in the country for patient satisfaction. CAHs named have achieved success in patient satisfaction, based on ivantage Health Analytics tabulation. To measure patient satisfaction hospitals send a patient satisfaction survey to patients asking about their experiences during a recent hospital stay. Stoughton Hospital was rated in the 99 th percentile based on two of those measures overall rating and highly recommend. TRADITIONAL GOVERNMENT PROGRAM UTILIZATION After several years of declines, Wisconsin hospital traditional or fee-for-service Medicare program utilization in 2011 and 2012 remained relatively flat. Table 10 shows traditional Medicare utilization based on program revenue to total revenue increased only slightly in 2011 and Traditional Medicare utilization continues to be higher in CAHs than in PPS facilities. For PPS hospitals, Medicaid fee-for service continued to decline the last two years. CAHs had higher Medicaid FFS utilization than PPS facilities but also experienced a decrease for 2011 and Total FFS government program utilization remained about the same for PPS facilities for 2011 and 2012 but CAH s utilization increased slightly. Table 10 Government Program Utilization Based On Revenue YEAR MEDICARE UTILIZATION* ALL WIS 44.8% % 42.5% 41.8% 41.6% 40.8% 38.5% 37.2% 36.3% 35.2% 35.6% 35.7% % PPS 42.1% % 40.6% 39.5% 39.6% 39.2% 37.3% 36.3% 35.0% 34.5% 34.8% 34.4% % CAH 47.8% % 44.7% 44.6% 44.0% 42.6% 39.8% 38.2% 37.7% 36.0% 36.5% 37.1% % MEDICAID UTILIZATION* ALL WIS 4.9% 5.6% 6.5% 6.8% 7.8% 7.6% 7.0% 7.1% 6.8% 6.3% 6.4% 6.2% 5.9% PPS 4.6% 5.5% 6.2% 6.6% 7.7% 7.5% 6.7% 6.6% 6.4% 5.6% 6.2% 6.1% 5.6% CAH 5.2% 5.6% 6.8% 7.1% 7.9% 7.8% 7.4% 7.7% 7.3% 7.0% 6.5% 6.4% 6.2% TOTAL GOV. PROGRAM UTILIZATION* ALL WIS 49.6% 49.2 % PPS 46.7% 46.2 % CAH 53.0% 52.5 % 49.7% 49.3% 49.6% 49.2% 47.8% 45.6% 43.9% 42.5% 41.6% 41.8% 41.6% 47.4% 47.1% 47.2% 47.1% 45.9% 43.9% 42.6% 40.6% 40.8% 40.9% 40.1% 52.4% 51.8% 52.4% 51.8% 50.1% 47.5% 45.5% 44.7% 42.5% 42.9% 43.3% *BASED ON PROGRAM REVENUE/TOTAL REVENUE 59
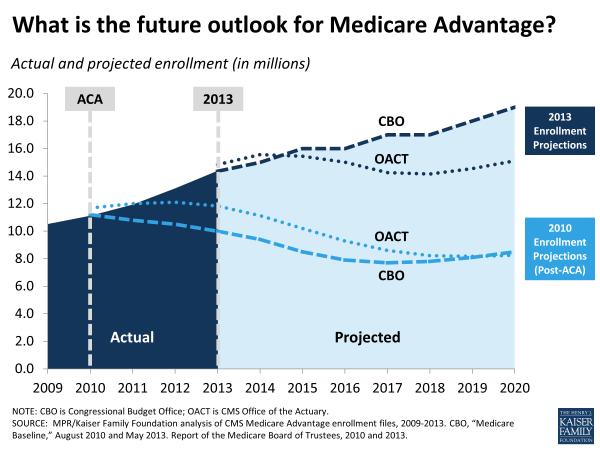
64 MEDICARE ADVANTAGE UTILIZATION The utilization of Medicare Advantage Plans continues to be higher in Wisconsin than for the entire United States (see Table 11). Wisconsin Medicare Advantage utilization also increased in 2011 to 32% of Medicare beneficiaries and to 33% for the 2013 enrollment period. Table 11 Wisconsin vs. National Medicare Advantage Plan Penetration MEDICARE ADVANTAGE PLAN PENETRATION* YEAR US 16.8% 15.0% 13.2% 12.2% 12.1% 12.7% 16.3% 19.0% 21.0% 22.5% 23.6% 25.6% 27.0% 28.0% WI 5.1% 5.0% 2.6% 3.1% 4.7% 7.0% 15.0% 20.4% 23.3% 26.1% 29.0% 30.1% 32.0% 33.0% *Penetration % is number of Medicare Advantage Enrollees/Medicare Beneficiaries SOURCE: KAISER FAMILY FOUNDATION The PPACA includes many changes to the Medicare Advantage plans. The changes revolve around three areas to save costs. They are: Rewards for quality: CMS will provide incentive payments based on how plans rate on measures including how many members are up-to-date on screenings, vaccines, and members satisfaction with the plan. Over $2 billion has been allocated for quality payments. Most of the cost-savings will come from changing the way Medicare sets the private plan payment rates. Each county will be ranked based on their per capita health care spending for traditional Medicare. Plans will receive 95% of traditional Medicare costs for their county. The new rate-setting plan is estimated to annually save over $12 billion. The rebate paid to Medicare Advantage plans will be reduced from 75% of the difference between the set benchmark rate and the plan s bid to provide coverage to Medicare enrollees to 50%. It is estimated this change will yield about $640 million in savings per year. It remains to be seen what the future impact of PPACA will be on Medicare Advantage enrollment. The following graph, however, shows enrollment may level off or decrease slightly for several years before continuing to rise. Obviously, Medicare Advantage enrollment will be influenced by how the plans structure benefits and cost sharing. 60
65 61
66 UNCOMPENSATED CARE Uncompensated Care is defined as the total of Bad Debts and Charity Care (sometimes referred to as community care or indigent care). The term uncompensated health care is used to encompass charity care and bad debt. Both represent services for which the hospital does not receive payment. Charity care is care for which a hospital does not expect payment because the patient cannot afford to pay. Bad debt, however, is care for which payment is expected, but the hospital is unable to collect. Distinguishing charity care from bad debt has been complex because of the way hospitals defined and reported these components for accounting purposes. For example, one hospital may write off charges as bad debt, while another hospital may call such charges charity care. In the past, some hospitals did not account separately for charity care and bad debts. The distinction, however, between charity care and bad debt is becoming even more important. The PPACA discussed in Recent Legislation requires non-profit hospitals to conduct community health needs assessments every three years and adopt an implementation strategy to meet the needs of the community identified through the assessment. This requirement is effective during tax years beginning after March 23, Charity services are an important indicator of a hospital s fulfillment of its charitable obligations. 62

67 The following graph is a stacked bar graph which shows the average Bad Debts and Charity Care % of Total Revenue for CAHs, PPS, and both groups combined from 2005 through After a steady increase in the average uncompensated care from 2005 through 2008, both groups experienced a leveling off in 2009, a slight decline in 2010, and increasing uncompensated care in 2011 and The numbers of patients who are uninsured or underinsured obviously affect Uncompensated Care as does changes in health insurance plans coverage and beneficiary deductibles and coinsurance. Coverage under tax-advantaged private plans, employer based plans, or government programs will also affect Uncompensated Care. One trend in the graph is that since 2006, CAHs provide higher levels of uncompensated care compared to PPS hospitals. The graph indicates this is a result of higher bad debts. The economic strength of the communities CAHs serve may contribute to the trend. In 2011, Uncompensated Care for CAHs increased while PPS hospitals remained relatively flat. In 2012, Uncompensated 63
The Financial Effects of Wisconsin Critical Access Hospital Conversion
 The Financial Effects of Wisconsin Critical Access Hospital Conversion Richard Donkle, CPA Dale Gullickson, FHFMA Rural Wisconsin Health Cooperative For the Wisconsin Office of Rural Health Acknowledgements
paymentbasics The IPPS payment rates are intended to cover the costs that reasonably efficient providers would incur in furnishing highquality
 Hospital ACUTE inpatient services system basics Revised: October 2015 This document does not reflect proposed legislation or regulatory actions. 425 I Street, NW Suite 701 Washington, DC 20001 ph: 202-220-3700
CRS Report for Congress Received through the CRS Web
 CRS Report for Congress Received through the CRS Web Order Code RS20386 Updated April 16, 2001 Medicare's Skilled Nursing Facility Benefit Summary Heidi G. Yacker Information Research Specialist Information
Working Paper Series
 The Financial Benefits of Critical Access Hospital Conversion for FY 1999 and FY 2000 Converters Working Paper Series Jeffrey Stensland, Ph.D. Project HOPE (and currently MedPAC) Gestur Davidson, Ph.D.
Appendix B: Formulae Used for Calculation of Hospital Performance Measures
 Appendix B: Formulae Used for Calculation of Hospital Performance Measures ADJUSTMENTS Adjustment Factor Case Mix Adjustment Wage Index Adjustment Gross Patient Revenue / Gross Inpatient Acute Care Revenue
Medicaid Hospital Rate Advisory Group
 Medicaid Hospital Rate Advisory Group Wisconsin Department of Health Services Division of Health Care Access and Accountability Bureau of Fiscal Management October 16, 2012 1 Agenda 1. Introduction and
paymentbasics Defining the inpatient acute care products Medicare buys Under the IPPS, Medicare sets perdischarge
 Hospital ACUTE inpatient services system basics Revised: October 2007 This document does not reflect proposed legislation or regulatory actions. 601 New Jersey Ave., NW Suite 9000 Washington, DC 20001
Final Report No. 101 April Trends in Skilled Nursing Facility and Swing Bed Use in Rural Areas Following the Medicare Modernization Act of 2003
 Final Report No. 101 April 2011 Trends in Skilled Nursing Facility and Swing Bed Use in Rural Areas Following the Medicare Modernization Act of 2003 The North Carolina Rural Health Research & Policy Analysis
Prepared for North Gunther Hospital Medicare ID August 06, 2012
 Prepared for North Gunther Hospital Medicare ID 000001 August 06, 2012 TABLE OF CONTENTS Introduction: Benchmarking Your Hospital 3 Section 1: Hospital Operating Costs 5 Section 2: Margins 10 Section 3:
Hospital-Based Ambulatory Care
 C H A P T E R 2 Hospital-Based Ambulatory Care ANSWERS TO KNOWLEDGE-BASED QUESTIONS 1. What has been the trend in the utilization of hospital-based services? What factors help to account for this trend?
May 3, 2018 Rick Reid Director, Provider Payment Analytics Michael Felczak Director, Provider Payment Analytics
 Hot Reimbursement Topics Rural Area Hospitals May 3, 2018 Rick Reid Director, Provider Payment Analytics Michael Felczak Director, Provider Payment Analytics RICHARD S. REID, MPA, FHFMA, CPA, Director,
A McKesson Perspective: ICD-10-CM/PCS
 A McKesson Perspective: ICD-10-CM/PCS Its Far-Reaching Effect on the Healthcare Industry Executive Overview While many healthcare organizations are focused on qualifying for American Recovery & Reinvestment
MEDICARE FFY 2017 PPS PROPOSED RULES OVERVIEW OHA Finance/PFS Webinar Series. May 10, 2016
 MEDICARE FFY 2017 PPS PROPOSED RULES OVERVIEW 2016 OHA Finance/PFS Webinar Series May 10, 2016 Spring is Medicare PPS Proposed Rules Season Inpatient Hospital Long-Term Acute Care Hospital Inpatient Rehabilitation
Chapter 6 Section 3. Hospital Reimbursement - TRICARE DRG-Based Payment System (Basis Of Payment)
") Diagnostic Related Groups (DRGs) Chapter 6 Section 3 Hospital Reimbursement - TRICARE DRG-Based Payment System (Basis Of Payment) Issue Date: October 8, 1987 Authority: 32 CFR 199.14(a)(1) 1.0 APPLICABIITY
Diagnostic Related Groups (DRGs) Chapter 6 Section 3 Hospital Reimbursement - TRICARE DRG-Based Payment System (Basis Of Payment) Issue Date: October 8, 1987 Authority: 32 CFR 199.14(a)(1) 1.0 APPLICABIITY
Overview of the Federal 340B Drug Pricing Program
 Overview of the Federal 340B Drug Pricing Program Presented by: James A. Raley, CPA Senior Manager Health Care Services Arnett Carbis Toothman LLP 345 340B Program: Overview Provides discounts on outpatient
time to replace adjusted discharges
 REPRINT May 2014 William O. Cleverley healthcare financial management association hfma.org time to replace adjusted discharges A new metric for measuring total hospital volume correlates significantly
Report to the Greater Milwaukee Business Foundation on Health
 Report to the Greater Milwaukee Business Foundation on Health Key Factors Influencing 2003 2012 Southeast Wisconsin Commercial Payer Hospital Payment Levels Presented by: Keith Kieffer, CPA, RPh Management
Findings Brief. NC Rural Health Research Program
 Do Current Medicare Rural Hospital Payment Systems Align with Cost Determinants? Kristin Moss, MBA, MSPH; G. Mark Holmes, PhD; George H. Pink, PhD BACKGROUND The financial performance of small, rural hospitals
Division C: Increasing Choice, Access, and Quality in Health Care for Americans TITLE XV: Provisions Relating to Medicare Part A
 Division C: Increasing Choice, Access, and Quality in Health Care for Americans TITLE XV: Provisions Relating to Medicare Part A Sec. 15001. Development of Medicare study for HCPCS versions of MS-DRG codes
Critical Access Hospital Quality
 Critical Access Hospital Quality Current Performance and the Development of Relevant Measures Ira Moscovice, PhD Mayo Professor & Head Division of Health Policy & Management School of Public Health, University
Reimbursement Models of the Future A Look at Proposed Models
 Experience the Eide Bailly Difference Reimbursement Models of the Future A Look at Proposed Models Ralph J. Llewellyn, CPA, CHFP Partner rllewellyn@eidebailly.com 701.239.8594 Introduction CAH reimbursement
PROPOSED POLICY AND PAYMENT CHANGES FOR INPATIENT STAYS IN ACUTE-CARE HOSPITALS AND LONG-TERM CARE HOSPITALS IN FY 2014
 DEPARTMENT OF HEALTH & HUMAN SERVICES Centers for Medicare & Medicaid Services Room 352-G 200 Independence Avenue, SW Washington, DC 20201 FACT SHEET FOR IMMEDIATE RELEASE Contact: CMS Media Relations
Medicare Skilled Nursing Facility Prospective Payment System
 Final Rule Summary Medicare Skilled Nursing Facility Prospective Payment System Program Year: FY2019 August 2018 1 TABLE OF CONTENTS Overview and Resources... 2 SNF Payment Rates... 2 Wage Index and Labor-Related
Trends in Skilled Nursing and Swing-bed Use in Rural Areas,
 Trends in Skilled Nursing and Swing-bed Use in Rural Areas, 1996- Working Paper No. 83 WORKING PAPER SERIES North Carolina Rural Health Research and Policy Analysis Center Cecil G. Sheps Center for Health
907 KAR 10:815. Per diem inpatient hospital reimbursement.
 907 KAR 10:815. Per diem inpatient hospital reimbursement. RELATES TO: KRS 13B.140, 205.510(16), 205.637, 205.639, 205.640, 205.641, 216.380, 42 C.F.R. Parts 412, 413, 440.10, 440.140, 447.250-447.280,
Overview of Select Health Provisions FY 2015 Administration Budget Proposal
 Overview of Select Health Provisions FY 2015 Administration Budget Proposal On March 4, 2014, President Obama released his Administration s FY 2015 budget proposal to Congress. The budget contains a number
Outpatient Hospital Facilities
 Outpatient Hospital Facilities Chapter 6 Chapter Outline Introduce students to 1. Different outpatient facilities 2. Different departments involved in the reimbursement process 3. The Chargemaster 4. Terminology
Medi-Cal APR-DRG Updates. Medi-Cal Updates. Agenda. Medi-Cal APR-DRG Updates Quality Assurance Fee (QAF) Program
 Program") Medi-Cal Updates Amber Ott California Hospital Association Agenda Medi-Cal APR-DRG Updates Quality Assurance Fee (QAF) Program Current QAF Law (SB239) Prop 52 Medicaid Managed Care Final Rules QAF 5 Development
Medi-Cal Updates Amber Ott California Hospital Association Agenda Medi-Cal APR-DRG Updates Quality Assurance Fee (QAF) Program Current QAF Law (SB239) Prop 52 Medicaid Managed Care Final Rules QAF 5 Development
Submission #1. Short Description: Medicare Payment to HOPDs, Section 603 of BiBA 2015
 Submission #1 Medicare Payment to HOPDs, Section 603 of BiBA 2015 Within the span of a week, Section 603 of the Bipartisan Budget Act of 2015 was enacted. It included a significant policy/payment change
Medi-Pak Advantage: Reimbursement Methodology
 Medi-Pak Advantage: Reimbursement Methodology The information located on the following pages is intended to summarize the reimbursement methodologies for Medi-Pak Advantage: Medi-Pak Advantage reimburses
The Patient Protection and Affordable Care Act Summary of Key Health Information Technology Provisions June 1, 2010
 The Patient Protection and Affordable Care Act Summary of Key Health Information Technology Provisions June 1, 2010 This document is a summary of the key health information technology (IT) related provisions
State of Kansas Department of Social and Rehabilitation Services Department on Aging Kansas Health Policy Authority
 State of Kansas Department of Social and Rehabilitation Services Department on Aging Kansas Health Policy Authority Notice of Proposed Nursing Facility Medicaid Rates for State Fiscal Year 2010; Methodology
August 25, Dear Ms. Verma:
 Seema Verma Administrator Centers for Medicare & Medicaid Services Hubert H. Humphrey Building 200 Independence Avenue, S.W. Room 445-G Washington, DC 20201 CMS 1686 ANPRM, Medicare Program; Prospective
Summary of U.S. Senate Finance Committee Health Reform Bill
 Summary of U.S. Senate Finance Committee Health Reform Bill September 2009 The following is a summary of the major hospital and health system provisions included in the Finance Committee bill, the America
ICD-10/APR-DRG. HP Provider Relations/September 2015
 ICD-10/APR-DRG HP Provider Relations/September 2015 Agenda ICD-10 ICD-10 General Overview Who is affected Preparation Testing Prior Authorization APR-DRG Inpatient hospital rates Crosswalks Questions 2
Final Rule Summary. Medicare Skilled Nursing Facility Prospective Payment System Fiscal Year 2017
 Final Rule Summary Medicare Skilled Nursing Facility Prospective Payment System Fiscal Year 2017 August 2016 Table of Contents Overview and Resources... 2 Skilled Nursing Facility (SNF) Payment Rates...
Inpatient Hospital Rates Rebasing Report
 This document is made available electronically by the Minnesota Legislative Reference Library as part of an ongoing digital archiving project. http://www.leg.state.mn.us/lrl/lrl.asp Inpatient Hospital
10/12/2017 COST REPORTING 201. October 18, Michael K. Westerfield, CPA, FHFMA Senior Manager
 COST REPORTING 201 October 18, 2017 Michael K. Westerfield, CPA, FHFMA Senior Manager 1 AGENDA Cost Report 101 Review Wage Index Disproportionate Share S-10 Indirect Medical Education (IME) Graduate Medical
Payment Methodology. Acute Care Hospital - Inpatient Services
 Grid Medi-Pak Advantage generally reimburses deemed providers the amount they would have received under Original Medicare for Medicare covered services, minus any amounts paid directly by Original Medicare
Chapter 9 Section 1. Ambulatory Surgical Center (ASC) Reimbursement
 Reimbursement") Ambulatory Surgery Centers (ASCs) Chapter 9 Section 1 Issue Date: August 26, 1985 Authority: 32 CFR 199.14(d) Copyright: CPT only 2006 American Medical Association (or such other date of publication of
Ambulatory Surgery Centers (ASCs) Chapter 9 Section 1 Issue Date: August 26, 1985 Authority: 32 CFR 199.14(d) Copyright: CPT only 2006 American Medical Association (or such other date of publication of
Medicare Home Health Prospective Payment System Calendar Year 2015
 Proposed Rule Summary Medicare Home Health Prospective Payment System Calendar Year 2015 August 2014 1 P age TABLE OF CONTENTS Overview, Resources and Comment Submission... 1 Home Health Payment Rates...
Regulatory Advisor Volume Eight
 Regulatory Advisor Volume Eight 2018 Final Inpatient Prospective Payment System (IPPS) Rule Focused on Quality by Steve Kowske WEALTH ADVISORY OUTSOURCING AUDIT, TAX, AND CONSULTING 2017 CliftonLarsonAllen
American Health Lawyers Association Institute on Medicare and Medicaid Payment Issues. History of the Physician Fee Schedule
 American Health Lawyers Association Institute on Medicare and Medicaid Payment Issues March 20-22, 2013 Baltimore, Maryland Sidney S. Welch, Esq. 1 History of the Physician Fee Schedule Prior to 1992,
Payment of hospital inpatient services. (A) HPP.
 HPP.") ACTION: Final DATE: 01/22/2018 8:09 AM 4123-6-37.1 Payment of hospital inpatient services. (A) HPP. Unless an MCO has negotiated a different payment rate with a hospital pursuant to rule 4123-6-10 of the
ACTION: Final DATE: 01/22/2018 8:09 AM 4123-6-37.1 Payment of hospital inpatient services. (A) HPP. Unless an MCO has negotiated a different payment rate with a hospital pursuant to rule 4123-6-10 of the
Impact of Financial and Operational Interventions Funded by the Flex Program
 Impact of Financial and Operational Interventions Funded by the Flex Program KEY FINDINGS Flex Monitoring Team Policy Brief #41 Rebecca Garr Whitaker, MSPH; George H. Pink, PhD; G. Mark Holmes, PhD University
January 10, Glenn M. Hackbarth, J.D Hunnell Road Bend, OR Dear Mr. Hackbarth:
 Glenn M. Hackbarth, J.D. 64275 Hunnell Road Bend, OR 97701 Dear Mr. Hackbarth: The Medicare Payment Advisory Commission (MedPAC or the Commission) will vote next week on payment recommendations for fiscal
INPATIENT HOSPITAL REIMBURSEMENT
 HCRA CLAIMS PROCESSING Reimbursement: HCRA is not Medicaid; however, HCRA covered services are reimbursed at the hospital s outpatient or inpatient reimbursement rate allowed for Florida Medicaid. The
Decrease in Hospital Uncompensated Care in Michigan, 2015
 Decrease in Hospital Uncompensated Care in Michigan, 2015 July 2017 Introduction The Affordable Care Act (ACA) expanded access to health insurance coverage for Michigan residents in 2014 through the creation
Hospital Financial Analysis
 Hospital Financial Analysis By David Belk MD The following information is derived mostly from data obtained from three primary sources: The Centers for Medicare and Medicaid Services (CMS) including Medicare
Abbreviated Client Stay means an Inpatient stay ending in client death or in which the client leaves against medical advice.
 DEPARTMENT OF HEALTH CARE POLICY AND FINANCING Medical Services Board MEDICAL ASSISTANCE - SECTION 8.300 10 CCR 2505-10 8.300 [Editor s Notes follow the text of the rules at the end of this CCR Document.]
N C RURAL HEALTH RESEARCH POLICY ANALYSIS CENTER
 N C RURAL HEALTH RESEARCH & POLICY ANALYSIS CENTER A Comparison of Rural Hospitals with Special Medicare Payment Provisions to Urban and Rural Hospitals Paid Under Prospective Payment Final Report No.
Analysis of 340B Disproportionate Share Hospital Services to Low- Income Patients
 Analysis of 340B Disproportionate Share Hospital Services to Low- Income Patients March 12, 2018 Prepared for: 340B Health Prepared by: L&M Policy Research, LLC 1743 Connecticut Ave NW, Suite 200 Washington,
a critical cause 10 steps to improve CAH financial performance
 MAY 2007 healthcare financial management FEATURE STORY Lawrence A. Fogel Joseph M. Watt a critical cause 10 steps to improve CAH financial performance Critical access hospitals need to learn how to operate
ICD-10 Frequently Asked Questions for Providers Q Updates
 ICD-10 Frequently Asked Questions for Providers Q4 2012 Updates What is ICD-10? International Classification of Diseases, 10th Revision (ICD-10) is a diagnostic and procedure coding system endorsed by
Chapter 9 Section 1. Ambulatory Surgical Center (ASC) Reimbursement
 Reimbursement") Ambulatory Surgery Centers (ASCs) Chapter 9 Section 1 Issue Date: August 26, 1985 Authority: 32 CFR 199.14(d) Copyright: CPT only 2006 American Medical Association (or such other date of publication of
Ambulatory Surgery Centers (ASCs) Chapter 9 Section 1 Issue Date: August 26, 1985 Authority: 32 CFR 199.14(d) Copyright: CPT only 2006 American Medical Association (or such other date of publication of
HB 254 AN ACT. The General Assembly of the Commonwealth of Pennsylvania hereby enacts as follows:
 PUBLIC WELFARE CODE - DEPARTMENT OF PUBLIC WELFARE POWERS, DETERMINING WHETHER APPLICANTS ARE VETERANS, MEDICAL ASSISTANCE PAYMENTS FOR INSTITUTIONAL CARE AND STATEWIDE QUALITY CARE ASSESSMENT Act of Jul.
Assignment of Medicare Fee-for-Service Beneficiaries
 February 6, 2015 Ms. Marilyn B. Tavenner, Administrator Centers for Medicare & Medicaid Services Department of Health and Human Services Attention: CMS-1461-P Room 445-G, Hubert H. Humphrey Building 200
Hospital Rate Setting
 Hospital Rate Setting Calendar Year 2014 Wisconsin Department of Health Services Division of Health Care Access and Accountability Bureau of Fiscal Management September 6, 2013 1 Agenda 1. Introduction
Wisconsin Medicaid Hospital Update
 Rural Hospital Finance Workshop Division of Health Care Access and Accountability Bureau of Fiscal Management August 26, 2016 1 Agenda 1. SFY 2016 Hospital Medicaid Expenditures 2. 3. APR DRG Training
HCCA South Central Regional Annual Conference November 21, 2014 Nashville, TN. Post Acute Provider Specific Sections from OIG Work Plans
 HCCA South Central Regional Annual Conference November 21, 2014 Nashville, TN Kelly Priegnitz # Chris Puri # Kim Looney Post Acute Provider Specific Sections from 2012-2015 OIG Work Plans I. NURSING HOMES
Estimated Decrease in Expenditure by Service Category
 Public Notice for June 2009 Release PUBLIC NOTICE COLORADO MEDICAID Department of Health Care Policy and Financing Fee-for-Service Provider Payments Effective July 1, 2009, in an effort to reduce expenditures
Minnesota health care price transparency laws and rules
 Minnesota health care price transparency laws and rules Minnesota Statutes 2013 62J.81 DISCLOSURE OF PAYMENTS FOR HEALTH CARE SERVICES. Subdivision 1.Required disclosure of estimated payment. (a) A health
For further information call: Robert B. Murray * For release 1:30 p.m. EST * Wednesday, July 6, 2005
 For further information call: Robert B. Murray * For release 1:30 p.m. EST 410-764-2605 * Wednesday, July 6, 2005 Average Amount Paid For A Hospital Stay in Maryland The rate of increase in charges for
The Medicare Prospective Payntent Systent
 The Medicare Prospective Payntent Systent (Medicare, occupational therapy, prospective payment systems, third party reimbursement) Susan J. Scott In 1983 Congress adopted the most significant change in
Medicare Home Health Prospective Payment System
 Medicare Home Health Prospective Payment System Payment Rule Brief Final Rule Program Year: CY 2013 Overview On November 8, 2012, the Centers for Medicare and Medicaid Services (CMS) officially released
MI Health Link Calendar Year 2016 Medicaid Capitation Rate Development
 MI Health Link Calendar Year 2016 Medicaid Capitation Rate Development January 1, 2016 through December 31, 2016 State of Michigan Department of Health and Human Services Prepared for: Penny Rutledge Director,
Rural Essential Access Community Hospitals (REACH) For Rural America
 For Rural America") Rural Essential Access Community Hospitals (REACH) For Rural America Adopted, 3/29/01 This proposal was developed by individuals convened by the National Rural Health Association. This proposal is intended
Rural Essential Access Community Hospitals (REACH) For Rural America Adopted, 3/29/01 This proposal was developed by individuals convened by the National Rural Health Association. This proposal is intended
(Cont.) FORM CMS Line 3--This is an institution which meets the requirements of 1861(e) or 1861(mm)(1) of the Act and participate
 FORM CMS Line 3--This is an institution which meets the requirements of 1861(e) or 1861(mm)(1) of the Act and participate") 11-16 FORM CMS-2552-10 4004.1 4004. WORKSHEET S-2 - HOSPITAL AND HOSPITAL HEALTH CARE COMPLEX IDENTIFICATION DATA This worksheet consists of two parts: Part I - Hospital and Hospital Health Care Complex
11-16 FORM CMS-2552-10 4004.1 4004. WORKSHEET S-2 - HOSPITAL AND HOSPITAL HEALTH CARE COMPLEX IDENTIFICATION DATA This worksheet consists of two parts: Part I - Hospital and Hospital Health Care Complex
Scope of services offered by Critical Access Hospitals: Results of the 2004 National CAH survey
 University of Southern Maine USM Digital Commons Rural Hospitals (Flex Program) Maine Rural Health Research Center (MRHRC) 3-2005 Scope of services offered by Critical Access Hospitals: Results of the
Medicare Cost Report Hot Topics!
 Medicare Cost Report Hot Topics! Montana HFMA April 2017 Presented by: Shar Sheaffer, Owner Outline Occupational mix Swing bed days Uncompensated care costs Common cost report issues Medicare bad debts
Seema Verma Centers for Medicare & Medicaid Services Department of Health and Human Services Attn: CMS-1696-P P.O. Box 8016 Baltimore, MD
 June 26, 2018 Seema Verma Centers for Medicare & Medicaid Services Department of Health and Human Services Attn: CMS-1696-P P.O. Box 8016 Baltimore, MD 21244-1850 Re: CMS-1696-P Medicare Program; Prospective
HOMECARE AND HOSPICE REIMBURSEMENT
 Hospice Modeling Hospice Changes to Prepare for Medicare Reimbursement and Care Delivery Reform Robert J. Simione Managing Principal Simione Healthcare Consultants, LLC HOMECARE AND HOSPICE REIMBURSEMENT
Rural Health Clinics
 Rural Health Clinics * An Issue Paper of the National Rural Health Association originally issued in February 1997 This paper summarizes the history of the development and current status of Rural Health
Final Rule Summary. Medicare Skilled Nursing Facility Prospective Payment System Fiscal Year 2016
 Final Rule Summary Medicare Skilled Nursing Facility Prospective Payment System Fiscal Year 2016 August 2015 Table of Contents Overview and Resources... 2 SNF Payment Rates... 2 Effect of Sequestration...
CMS-0044-P; Proposed Rule: Medicare and Medicaid Programs; Electronic Health Record Incentive Program Stage 2
 May 7, 2012 Submitted Electronically Ms. Marilyn Tavenner Acting Administrator Centers for Medicare and Medicaid Services Department of Health and Human Services Room 445-G, Hubert H. Humphrey Building
Medicare Cost Reporting and PPS FFY 2015 Proposed Rule Why it Still Matters. Glenn Grigsby, CPA OACHC 2014 Annual Spring Conference March 11, 2014
 Medicare Cost Reporting and PPS FFY 2015 Proposed Rule Why it Still Matters Glenn Grigsby, CPA OACHC 2014 Annual Spring Conference March 11, 2014 Agenda Medicare cost report myths Common cost reporting
District of Columbia Medicaid Specialty Hospital Payment Method Frequently Asked Questions
 District of Columbia Medicaid Specialty Hospital Payment Method Frequently Asked Questions Version Date: July 20, 2017 Updates for October 1, 2017 Effective October 1, 2017 (the District s fiscal year
District of Columbia Medicaid Specialty Hospital Project Frequently Asked Questions
 District of Columbia Medicaid Specialty Hospital Project Frequently Asked Questions Version Date: September 22, 2014 UPDATE: The District of Columbia Department of Health Care Finance (DHCF) is submitting
Paying for Outcomes not Performance
 Paying for Outcomes not Performance 1 3M. All Rights Reserved. Norbert Goldfield, M.D. Medical Director 3M Health Information Systems, Inc. #Health Information Systems- Clinical Research Group Created
Medicaid Hospital Incentive Payments Calculations
 Medicaid Hospital Incentive Payments Calculations Note: This guidance is intended to assist hospitals and others in understanding Medicaid hospital incentive payment calculations. However, all hospitals
The Financial Performance of Rural Hospitals and Implications for Elimination of the Critical Access Hospital Program
 The Financial Performance of Rural Hospitals and Implications for Elimination of the Critical Access Hospital Program George M. Holmes, George H. Pink, and Sarah A. Friedman University of North Carolina
Medicare Inpatient Psychiatric Facility Prospective Payment System
 Medicare Inpatient Psychiatric Facility Prospective Payment System Payment Rule Brief PROPOSED RULE Program Year: FFY 2016 Overview and Resources On April 24, 2015, the Centers for Medicare and Medicaid
LOUISIANA MEDICAID PROGRAM ISSUED: 11/30/12 REPLACED: 07/01/11 CHAPTER 25: HOSPITAL SERVICES SECTION 25.7: REIMBURSEMENT PAGE(S) 17 REIMBURSEMENT
 17 REIMBURSEMENT") REIMBURSEMENT This chapter is an overview of inpatient reimbursement methodology and does not address all issues or questions that a hospital may have regarding reimbursement. If a provider has a question
REIMBURSEMENT This chapter is an overview of inpatient reimbursement methodology and does not address all issues or questions that a hospital may have regarding reimbursement. If a provider has a question
Hospital Strength INDEX Methodology
 2017 Hospital Strength INDEX 2017 The Chartis Group, LLC. Table of Contents Research and Analytic Team... 2 Hospital Strength INDEX Summary... 3 Figure 1. Summary... 3 Summary... 4 Hospitals in the Study
Comparison of the Health Provisions in HR 1 American Recovery and Reinvestment Act
 APPROPRIATIONS Comparative Effectiveness Research $1.1B for comparative effectiveness programs, including $300 M for AHRQ, $400 M for NIH, and $400 M for HHS. Establishes a Federal Coordinating Council.
The Evolving Landscape of Healthcare Payment: Incentive Programs and ACO Model Optimization. Quality Forum August 19, 2015
 The Evolving Landscape of Healthcare Payment: Incentive Programs and ACO Model Optimization Quality Forum August 19, 2015 Ross Manson rmanson@eidebailly.com 701.239.8634 Barb Pritchard bpritchard@eidebailly.com
Audit of Indigent Care Agreement with Shands - #804 Executive Summary
 Council Auditor s Office City of Jacksonville, Fl Audit of Indigent Care Agreement with Shands - #804 Executive Summary Why CAO Did This Review Pursuant to Section 5.10 of the Charter of the City of Jacksonville
How to Account for Hospice Reimbursement Changes. Indiana Association for Home & Hospice Care Annual Conference May 10-11, 2016
 How to Account for Hospice Changes Indiana Association for Home & Hospice Care Annual Conference May 10-11, 2016 marcumllp.com Disclaimer This Presentation has been prepared for informational purposes
Data Shows Rural Hospitals At Risk Without Special Attention from Lawmakers
 Data Shows Rural Hospitals At Risk Without Special Attention from Lawmakers As Affordable Care Act Faces Uncertainty in America s Healthcare Future, Rural Hospitals Barely Hang On Compared to Urban Hospital
Ernst & Young Schedule H Benchmark Report for the American Hospital Association Tax Years 2009 & 2010
 Ernst & Young Schedule H Benchmark Report for the American Hospital Association Tax Years 2009 & 2010 Improving the health of their communities is at the heart of every hospital s mission. For two consecutive
Maximizing your Medicaid Rate
 Maximizing your Medicaid Rate RICK HOLLOWAY, ADMINISTRATOR IDAHO STATE VETERANS HOME-BOISE OCTOBER 6, 2016 Outline and Objectives Can you impact your Medicaid rate What goes into your Medicaid rate What
Medicaid Prospective Payment Update
 Medicaid Prospective Payment Update Tom Parker Director of Reimbursement Florida Heath Care Association Lorne Simmons Healthcare Manager Moore Stephens Lovelace CPA s & Advisors 1 Presentation Outline
AHA Survey on Hospitals Ability to Meet Meaningful Use Requirements of the Medicare and Medicaid Electronic Health Records Incentive Programs
 AHA Survey on Hospitals Ability to Meet Meaningful Use Requirements of the Medicare and Medicaid Electronic Health Records Incentive Programs February 7, 2011 Executive Summary The vast majority of hospitals
ICD-10: Capturing the Complexities of Health Care
 ICD-10: Capturing the Complexities of Health Care This project is a collaborative effort by 3M Health Information Systems and the Healthcare Financial Management Association Coding is the language of health
WHITE PAPER. Taking Meaningful Use to the Next Level: What You Need to Know about the MACRA Advancing Care Information Component
 Taking Meaningful Use to the Next Level: What You Need to Know Table of Contents Introduction 1 1. ACI Versus Meaningful Use 2 EHR Certification 2 Reporting Periods 2 Reporting Methods 3 Group Reporting
HEALTH CARE REFORM IN THE U.S.
 HEALTH CARE REFORM IN THE U.S. A LOOK AT THE PAST, PRESENT AND FUTURE Carolyn Belk January 11, 2016 0 HEALTH CARE REFORM BIRTH OF THE AFFORDABLE CARE ACT Health care reform in the U.S. has been an ongoing
Maximizing your Medicaid Rate
 Maximizing your Medicaid Rate RICK HOLLOWAY, ADMINISTRATOR IDAHO STATE VETERANS HOME-BOISE APRIL 26, 2017 Outline and Objectives Can you impact your Medicaid rate What goes into your Medicaid rate What
1. The new state-based insurance exchange for small businesses (SHOP) stands for:
 stands for:") Chapter 5 Review Questions 1. The new state-based insurance exchange for small businesses (SHOP) stands for: a. Small Business Health Options Program b. Small Business Health Option Plans c. State Health
Chapter 5 Review Questions 1. The new state-based insurance exchange for small businesses (SHOP) stands for: a. Small Business Health Options Program b. Small Business Health Option Plans c. State Health
Hospital Value-Based Purchasing (VBP) Program
 Program") Fiscal Year (FY) 2018 Percentage Payment Summary Report (PPSR) Overview Questions & Answers Moderator Maria Gugliuzza, MBA Project Manager, Hospital VBP Program Hospital Inpatient Value, Incentives, and
Fiscal Year (FY) 2018 Percentage Payment Summary Report (PPSR) Overview Questions & Answers Moderator Maria Gugliuzza, MBA Project Manager, Hospital VBP Program Hospital Inpatient Value, Incentives, and
The Pain or the Gain?
 The Pain or the Gain? Comprehensive Care Joint Replacement (CJR) Model DRG 469 (Major joint replacement with major complications) DRG 470 (Major joint without major complications or comorbidities) Actual