Kauai County Community Health Needs Assessment. February 28, 2013
|
|
|
- Bruno Jefferson
- 6 years ago
- Views:
Transcription

1 Kauai County Community Health Needs Assessment February 28, 2013
2 Table of Contents Executive Summary... 3 Introduction... 3 Approach... 3 Data Sources and Methods... 3 Areas of Need... 4 Selected Priority Areas... 5 Note to the Reader Introduction Summary of CHNA Report Objectives and context Healthcare Association of Hawaii Member Hospitals Advisory Committee Consultants Hospital Community Benefit Team and Goals Definition of Community + Map Methods Core Indicator Summary Data Sources Comparisons: Analytic Approach Indicator and Topic Area Scoring Shortage Area Map Hospitalization Rates Key Informant Interviews Community Survey Community Health Needs Assessment Findings Demographics Population Economy Education Overview of Needs Assessment Access to Health Services Cancer Diabetes Disabilities Economy Education Environment Exercise, Nutrition & Weight Family Planning Heart Disease & Stroke Immunizations & Infectious Diseases Injury Prevention & Safety Maternal, Fetal & Infant Health Mental Health & Mental Disorders
3 Older Adults & Aging Oral Health Respiratory Diseases Social Environment Substance Abuse & Lifestyle Transportation Community Health Needs Summary Findings/Conclusions Disparities Highlights Identified Data Gaps Limitations and Other Considerations Selected Priority Areas Appendix A: HCI Provided Data About HCI Provided Data Framework for Indicator/Data and Topic Selection Core Indicator Data Summary: Analytic Approach and Scoring Methodology Core Indicator Data Appendix B: Hospitalization Data Hospital Service Areas Hospitalization Rates Appendix C: Key Informant Interview Participants Completed Interviews Attempted Interviews Appendix D: Identified Community Resources Statewide Health Related Resources Identified from Aloha United Way Kauai County Health Related Resources Identified through Hawaii Department of Health Contracts Kauai County Licensed Health Care Facilities Reported by the Centers for Medicare & Medicaid Services Appendix E: Referenced Reports Appendix F: Road map to IRS Requirements in Schedule H Form Appendix G: Authors Appendix H: Assets Mapping: Kaua i Island
4 Tables Table 3.1: Population Density and Change Table 3.2: Core Indicator Summary Scores Table 3.3: Hospitalization Rates due to Preventable Causes in Kauai County, Table 3.4: Core Indicators Access to Health Services Table 3.5: Core Indicators Cancer Table 3.6: Percent of Persons with a Disability, Table 3.7: Core Indicators Education Table 3.8: Core Indicators Family Planning Table 3.9: Core Indicators Immunizations & Infectious Diseases Table 3.10: Core Indicators Injury Prevention & Safety Table 3.11: Core Indicators Maternal, Fetal & Infant Health Table 3.12: Core Indicators Mental Health & Mental Disorders Table 3.13: Core Indicators Substance Abuse & Lifestyle Table 3.14: Core Indicators Transportation Figures Figure 1.1 Service Area Map... 9 Figure 2.1: Comparison Methods Figure 3.1: Population by Age, Figure 3.2: Population by Race/Ethnicity, Figure 3.3: Breakdown of Population Reporting Race of Asian Only, Figure 3.4: Poverty by Race/Ethnicity, Figure 3.5: PQI Composite Hospitalization Rates Figure 3.6: Key Informant Interview Word Cloud Figure 3.7: High Risk Race/Ethnicity Groups Identified through Community Survey Figure 3.8: Federally Designated Medically Underserved Populations Figure 3.9: Hospitalization Rates due to Diabetes, Figure 3.10: Percent of Persons with a Disability by Race/Ethnicity: Kauai, Figure 3.11: Poverty in Kauai County by Census Tract, Figure 3.12: Hospitalization Rates due to Heart Disease, Figure 3.13: Hospitalization Rates due to Bacterial Pneumonia, Figure 3.14: Low Birth Weight Rate per 100 Live Births, Figure 3.15: Federally Designated Mental Health Professional Shortage Areas by Census Tracts Figure 3.16: Mental Health Hospitalizations by Race: Kauai County, Figure 3.17: Unadjusted Composite Hospitalization Rates: Kauai County, Figure 3.18: Hospitalization Rates due to COPD or Asthma in Older Adults, Figure 4.1: Areas of Disparity for Race/Ethnicity Groups Figure 5.1: Kauai County Hospital Service Areas
5 Executive Summary Introduction The Healthcare Association of Hawaii and its member hospitals are pleased to present the Kauai County Community Health Needs Assessment (CHNA). This CHNA report was developed through a collaborative process and provides an overview of the health needs in Kauai County. The goal of this report is to offer a meaningful understanding of the health needs in the community, as well as help guide the hospitals in their community benefit planning efforts and development of an implementation strategy to address prioritized needs. Special attention has been given to identify health disparities, the needs of vulnerable populations, and unmet health needs or gaps in services. Although this report focuses on needs within the community, it is important to note there are also innumerable community assets and a true aloha spirit that provide ample foundation for community health improvement. Approach In Fall 2012, the Healthcare Association of Hawaii partnered with Healthy Communities Institute to conduct a CHNA for Kauai County. Our approach followed the public health model of assessing and understanding community health holistically. A framework for analysis was constructed based on determinants of health; the framework included a broad definition of community health that considers extensive secondary data on the social, economic, and physical environments, as well as health risks and outcomes. The influence of mauka ( toward the mountains ), or upstream factors, and the resulting makai ( toward the ocean ), or downstream impacts, on health is a transcending theme. Key informant interviews with those having special knowledge of health needs, health disparities, and vulnerable populations provided vital information that increased the understanding of the health needs in Kauai County. A small set of community residents provided additional insights on the health needs in Kauai County. It is hoped that this report will provide a foundation for community health improvement efforts and that community health partners will build on this report. Data Sources and Methods An extensive array of secondary and primary data was collected and synthesized for this report. Core Indicators: Secondary data was analyzed using Hawaii Health Matters ( a publicly available data platform with a dashboard of over 100 indicators from over 20 sources; much of the data comes from Hawaii Department of Health, allowing for Hawaii specific race, age and gender details. This extensive core data was analyzed using a highly systematic and quantitative approach that incorporated multiple benchmarks and comparisons to understand the question: How is Kauai County performing? Hospitalization Indicators: Eighteen indicators on key preventable causes of hospitalization, analyzed at the sub county/hospital service area level, supplemented the core indicators. This data was provided by Hawaii Health Information Corporation (HHIC) and enabled valuable insights into utilization patterns, geographic disparities in hospitalization rates, and enhanced the core indicator data for important topic areas. Supplemental Information: Recently published reports on Kauai County s health and access to care were reviewed for additional key information on important topics such as health disparities, primary care needs, and mental health. Key Informant Interviews: Storyline Consulting, a local partner of the project, interviewed 13 key informants who had knowledge of the health needs in Kauai County. The selection of the key informants 3
6 was guided by preliminary core indicator data findings and followed a structured nomination and selection process by the HAH Advisory Committee. These 13 Kauai specific interviews were supplemented by relevant information provided by additional key informants who were interviewed for the State of Hawaii. The input by local key informants was invaluable and greatly enhanced the understanding of health needs and offered insight into health resources and health improvement approaches. Community Survey: A small sample of community residents, via an online survey, supplemented the key informant interviews. Highlights of these surveys, or Voices from the Community, are incorporated throughout the report. Areas of Need This report provides an overview of Kauai County s community health needs. Community health was assessed for Kauai County as a whole, for race sub groups, and for sub geographies. The findings revealed overall or sub population community needs in the following areas: Access to Health Services Cancer Diabetes Disabilities Economy Education Environment Exercise, Nutrition, & Weight Family Planning Heart Disease & Stroke Immunizations & Infectious Diseases Injury Prevention & Safety Maternal, Fetal & Infant Health Mental Health & Mental Disorders Older Adults & Aging Oral Health Respiratory Diseases Social Environment Substance Abuse & Lifestyle Transportation Several overarching themes emerged across the topic areas: All groups experience adverse health outcomes due to chronic disease and health risk behaviors Individuals from all geographies, race, gender, and age groups experience poor health outcomes. Evidence from high rates of chronic disease patterns, hospitalizations due to preventable causes, and patterns of unhealthy behaviors compels those seeking to improve health to consider interventions at the structural, policy, and community wide level in order to positively impact the long term health of as many Kauai County residents as possible. Special consideration for mental health, a chronic condition that significantly influences overall health, is critical for achieving population health goals. Greater socio economic need and health impacts are found among certain groups and places in Kauai County Poverty is unevenly distributed around the county, with the North Shore and northern portion of the East Side most heavily impacted. Poor residents do not have the resources to lead a healthy lifestyle or seek adequate care when they become ill. As both health status and poverty are closely tied to educational attainment, the issues surrounding education in Kauai County including reduced individualized attention for students and low levels of proficiency in math and English are especially concerning. Individuals with less education often have lower levels of health and technology literacy, and have fewer job opportunities. 4
7 Cultural and language barriers inhibit effective intervention for the most impacted populations Because of the strong correlation between poverty and race/ethnicity, some of the groups most impacted by health issues often face cultural barriers to health improvement. Language differences, including limited English proficiency, and poor health behaviors that are common within a culture are challenges that must be overcome in order to effectively prevent disease and enhance wellness. Perceptions of Western medical care and the stigmatization of health issues in certain cultures prevent some residents from seeking care when they need it. Key informants repeatedly stressed the need to find culturally appropriate ways of disseminating health knowledge. Limited access to care results in greater health impacts Like the other Neighbor Islands, Kauai County suffers from limited access to various types of care. The Health Resources and Services Administration designated the entirety of the county as medically underserved. Comprehensive treatment for all types of chronic diseases, including diabetes, heart disease, and cancer is not always available in Kauai; affordable home health care for older adults is a challenge. Substance abuse and mental health is a significant issue, but there are few resources for treatment in Kauai County. Mental health providers are in particularly short supply. The shortage of mental health services means other segments of the health care system, including emergency departments and primary care providers, are overwhelmed by the large need in this area. Certain parts of Kauai also have further difficulties accessing care; most health centers are located around Lihue, requiring residents of other areas to find transportation across the county. Community health centers and schools are key community assets for effective interventions Key informants highlighted the primary assets of community health centers and schools as venues that can provide culturally appropriate services and education that promotes healthy lifestyles and health literacy. Community based clinics and schools can address human needs in an integrated manner. Children spend the majority of their waking hours in schools and one of the best chances for improving the health of the next generation is through schools. Childhood obesity can be addressed in school by increasing physical activity time and sports; dental health can be improved by implementing evidencebased strategies that are provided in the school environment. While Kauai County has existing community health centers, funding is often a limitation of providing services through these venues. Public schools face critical funding challenges that impact their ability to meet the spectrum of student needs. Kauai County is rich with organizations, agencies, and individuals that understand the impact of social determinants of health and seek opportunities to partner or collaborate to improve the health of the community. Despite the rich human capital in Kauai County and true aloha spirit, however, there is a shortage of funding to support communities crucial work in upstream wellness issues. Selected Priority Areas Wilcox Health has selected the following two priorities: 1. Access to Health Services 2. Exercise, Nutrition & Weight Details about the prioritization process can be found in Section 5. 5
8 Note to the Reader Beyond the Executive Summary, readers may choose to study the entire report or alternatively focus on a particular topic area. An overview is provided for each key type of data included in the report: core indicators, hospitalization rates, key informant interviews, and online community survey. To more deeply understand a topic area, the reader can turn to any of the 20 topic area presentations and find all data for the topic and summary conclusions. Each topic specific section is organized in the following way: Core Indicators and Supplemental Information Hospitalization Rates (when available) Key Informant Interview Information Summary of Topic Area 6
9 1 Introduction 1.1 Summary of CHNA Report Objectives and context The state of Hawaii is unique in that all of its community hospitals and hospital systems joined efforts to fulfill new requirements under the Affordable Care Act, which the IRS developed guidelines to implement. The Healthcare Association of Hawaii (HAH) led this collaboration to conduct state and county wide assessments for its members Healthcare Association of Hawaii HAH is the unifying voice of Hawaii s health care providers and an authoritative and respected leader in shaping Hawaii s health care policy. Founded in 1939, HAH represents the state s hospitals, nursing facilities, home health agencies, hospices, durable medical equipment suppliers, and other health care providers who employ about 20,000 people in Hawaii. HAH works with committed partners and stakeholders to establish a more equitable, sustainable health care system driven to improve quality, efficiency, and effectiveness for patients and communities Member Hospitals Twenty six of 28 Hawaii hospitals, 1 including all Kauai County hospitals, participated in the CHNA project. Located in Kauai County: Samuel Mahelona Memorial Hospital West Kauai Medical Center & Kauai Veterans Memorial Hospital Wilcox Memorial Hospital Serve Kauai County residents: Kahi Mohala Behavioral Health Kaiser Permanente Medical Center Kapi`olani Medical Center for Women & Children Rehabilitation Hospital of the Pacific Shriners Hospitals for Children Honolulu The Queen s Medical Center Straub Clinic and Hospital Advisory Committee The CHNA process has been informed by hospital leaders and other key stakeholders from the community who constitute the Advisory Committee. The following individuals shared their insights and knowledge about health care, public health, and their respective communities as part of this group. Howard Ainsley Hawaii Health Systems Corporation Bruce Anderson, PhD Hawaii Health Systems Corporation Joy Barua Kaiser Permanente Hawaii Maile Ballesteros St. Francis Home Care Kauai Wendi Barber, CPA, MBA Castle Medical Center 1 Tripler Army Medical Center and the Hawaii State Hospital are not subject to the IRS CHNA requirement and were not a part of this initiative. 7
10 Rose Choy Kahi Mohala Behavioral Health Kathleen Deknis, RN, MPH Home Health by Hale Makua Karen Fernandez Wahiawa General Hospital Mark Forman, JD Hawaii Medical Service Association Foundation Loretta J. Fuddy, ACSW, MPH State of Hawaii Department of Health Robert Hirokawa, DrPH Hawaii Primary Care Association Mari Jo Hokama Kahi Mohala Behavioral Health Fred Horwitz Life Care Center of Hilo Susan Hunt, MHA Hawaii Island Beacon Community Richard Keene The Queen s Health Systems Jeannette Koijane, MPH Kokua Mau Jay Kreuzer Hawaii Health Systems Corporation Greg LaGoy, ND, MBA Hospice Maui Bernadette Ledesma, MPH Pearl City Nursing Home Vince Lee, ACSW, MPH Hawaii Health Systems Corporation Wesley Lo Hawaii Health Systems Corporation Pat Miyasawa Shriners Hospitals for Children Honolulu R. Don Olden Wahiawa General Hospital Quin Ogawa Kuakini Health System Jason Paret, MBA North Hawaii Community Hospital Ginny Pressler, MD, MBA, FACS Hawaii Pacific Health Hilton Raethel, MBA, MHA Hawaii Medical Service Association Hardy Spoehr Papa Ola Lokahi Jerry Walker Hawaii Health Systems Corporation Katherine Werner Ciano, MS, RN North Hawaii Hospice Ken Zeri, RN, MSN Hospice Hawai`i Lori Miller Kauai Hospice Marie Ruhland, RN Home Healthcare Services of Hilo Medical Center Neill Schultz Castle Medical Center Corinne Suzuka, RN, BNS, MA St. Francis Home Care Peter Sybinsky, PhD Hawaii Health Information Corporation Ty Tomimoto Rehabilitation Hospital of the Pacific Sharlene Tsuda The Queen s Health Systems Stephany Vaioleti, LSW, JD Kahuku Medical Center Sharon Vitousek, MD North Hawaii Outcomes Project Consultants Healthy Communities Institute The Healthy Communities Institute (HCI) mission is to improve the health, environmental sustainability and economic vitality of cities, counties and communities worldwide. The company is rooted in work started in 2002 in concert with the Healthy Cities Movement at the University of California at Berkeley. HCI offers a spectrum of technology and services to support community health improvement. HCI s webbased dashboard system makes data easy to understand and visualize. The web system and services enable planners and community stakeholders to understand all types and sources of data, and then take concrete action to improve target areas of interest. HCI has over 100 implementations of its dashboard for clients in 40+ states. 8

11 The HCI team is composed of experts in public health, health informatics, and health policy. The services team provides customized research, analysis, convening, planning and report writing to meet the organizational goals of health departments, hospitals, and community organizations. To learn more about Healthy Communities Institute please visit Storyline Consulting Storyline Consulting is dedicated to serving and enhancing Hawaii s nonprofit and public sectors. Storyline provides planning, research, evaluation, grant writing, and other organizational development support and guidance. By gathering and presenting data and testimonies in a clear and effective way, Storyline helps organizations to improve decision making, illustrate impact, and increase resources. To learn more about Storyline Consulting please visit Hospital Community Benefit Team and Goals Wilcox Memorial Hospital formed a Community Benefit Team to guide the hospital s CHNA and Implementation Strategy. The Team includes the following internal participants: Chief Executive Officer, Vice President Patient Services/Chief Nurse Executive, Director Ancillary Services, Director Patient Accounting, Director Quality and Patient Safety, Financial Partner, Manager Case Management and Marketing Manager. The work and results will be reported to the Wilcox Memorial Hospital Board. There is an opportunity to work in partnership with the community and other Hawai i Pacific Health facilities Definition of Community + Map The hospital service area is defined by a geographical boundary of Kauai County, which encompasses the inhabited islands of Kauai and Niihau. Kauai County will serve as the unit of analysis for this Community Health Needs Assessment. Hence, the health needs discussed in this assessment will pertain to individuals living within this geographic boundary. When possible, highlights for sub geographies within Kauai County are provided. The specific area served by hospital is indicated in Figure 1.1. Figure 1.1 9
12 2 Methods The starting point for this needs assessment is a summary of secondary or core indicator data, which applies a systematic and quantitative method of comparing the relative severity of health indicators across 20 topic areas. When possible, other data are considered, including rates of hospitalization due to preventable causes, to more closely examine the most severe health needs and their impact on health care utilization. The secondary data findings are further informed by collected primary data. Individuals with special knowledge regarding the health needs of the community, including those with expertise in public health and community health were interviewed through a key informant interview process. An online survey collected additional opinions from community residents. The quantitative, secondary data is then combined with the knowledge of key informants who have awareness of health needs specific to their community and highlighted with resident opinions on community health concerns. 2.1 Core Indicator Summary Data Sources The core indicators included in this summary originated from Hawaii Health Matters ( a publicly available data platform with a dashboard of over 100 indicators from over 20 sources. Hawaii Health Matters (HHM) was developed as a partnership between Hawaii Health Data Warehouse and Hawaii Department of Health, with technology provided by Healthy Communities Institute. The core indicators cover health outcomes, behaviors that contribute to health, and other factors that are correlated with health. The secondary data available on HHM is continuously updated as sources release new data. The data included in this summary is as of October 17, 2012, and may not reflect data currently on the site. Additional data specific to race, gender, and age subgroups was obtained directly from Hawaii Department of Health. Each of the indicators was categorized into one of 20 topic areas, spanning both health and quality of life issues. All indicators, including measurement date, sources and topic area assignment, are included in the Appendix of this report Comparisons: Analytic Approach The status of Kauai County was assessed one indicator at a time using up to four comparison methods. 1. First, Kauai County was compared geographically, to the rest of the state as well as the nation. Comparisons of Kauai County to the United States, the state average, and the county in Hawaii with the best value for the indicator were averaged (see Appendix A for more details and an example). This average was used to determine whether Kauai County compares poorly to other geographies. 2. The second comparison examined the trend of the data. A line of best fit was calculated for all available data points, and the slope of the line was used to determine the average percent change per year. If Kauai County s indicator value had worsened by at least 2.5% of the baseline value per year, the trend for the indicator was considered poor. 3. A third comparison measured disparities among sub populations in Kauai County. If one subpopulation had a value at least four times worse than another for the indicator, then the disparity measurement was considered poor. 4. Finally, the indicator value was compared to nationally recognized Healthy People 2020 (HP2020) benchmarks. The indicator was considered poor if Kauai County had not yet met the target set by the U.S. Department of Health and Human Services (see Appendix A for more information on HP2020 benchmarks). 10


13 Figure 2.1: Comparison Methods As many comparisons as possible were applied to each indicator. The possible comparisons varied for each indicator depending on the availability of data. Geographic comparisons were only possible when national data was available for the same indicator and time period. Trend comparisons were only possible when at least three periods of measure were available to avoid misinterpreting slight changes between two periods. The availability of subpopulation data varied by indicator, and so disparity comparisons were incorporated whenever possible. Finally, HP2020 benchmarks only exist for a subset of the indicators included in the summary. Please see Appendix A for more details and examples of this process Indicator and Topic Area Scoring After the status of all possible comparisons was assessed, indicators were aggregated into their respective topic areas. The total number of poor comparisons was divided by the total possible comparisons within the topic area to calculate the topic area score. This score, measuring the proportion of poor comparisons within the topic, ranges from zero to one. Scores were not calculated for topic areas that had one or zero indicators, as these areas were deemed to lack an adequate number of indicators. The top ten topic areas with the highest scores were used to guide primary data collection. Please see Appendix A for more details and an example of this process Shortage Area Map Core indicator data for relevant topic areas was supplemented with maps illustrating the following types of federally designated shortage populations: Medically underserved populations Mental health professional shortage areas Criteria for medically underserved areas and populations can be found at: Criteria for health professional shortage areas can be found at: Maps of shortage areas and populations were based upon shapes generated using the Community Issues Management site s mapping tool: network.org/cim/tools/ Maps were further customized by Healthy Communities Institute. 11
14 2.2 Hospitalization Rates While the Core Indicator Summary included several unadjusted hospitalization rate indicators, further risk adjusted rates were obtained for comparison between geographies of varying population makeup. Rates were provided by Hawaii Health Information Corporation (HHIC), and are defined by the Agency for Healthcare Research and Quality (AHRQ) as a set of measures that can be used to identify quality of outpatient care that can potentially prevent the need for hospitalization. Risk adjustment attempts to account for differences in indicators across providers and geographic areas that are attributable to variations in patient mix. AHRQ s risk adjustment methodology employs multivariate ordinary least squares regression to estimate an expected value of each indicator an area would exhibit with an average case mix. The model adjusts for patient demographics, including age, sex, all age sex combinations, All Payer Refined DRGs (a refinement of CMS s DRGs that additionally classifies non Medicare cases) and severity of illness. HHIC applies AHRQ s risk adjustment methodology to further control for the top four dominant races in Hawaii, as determined by the Hawaii State Department of Health s Hawaii Health Survey. Risk adjustment coefficients are estimated using the Healthcare Cost and Utilization Project s (HCUP) State Inpatient Databases (SID). Rates are risk adjusted based on the Healthcare Cost and Utilization Project s State Inpatient Databases. Please see for a complete definition of indicators. Because the area of mental health was not well represented in the Core Indicator Summary, HHIC also provided unadjusted rates of hospitalization for any mental health related primary diagnosis. Sub county hospitalization rates are included for Hospital Service Areas (HSA), which were defined in 1995 by hospital CEOs and are composed of contiguous zip codes surrounding a hospital s self defined service area. Please see Appendix B for a list of the zip codes contained within each HSA. Also included in Appendix B are unadjusted rates for age, gender, and race/ethnicity sub populations. The inclusion of these rates in the Findings discussion is limited due to uncertainties in the comparability of these unadjusted rates with the risk adjusted rates. All rates are based upon patient residence, and values were suppressed if there were fewer than 10 cases. Population estimates are based on the U.S. Census Bureau, Population Division, Intercensal Estimates of the Resident Population for Counties of Hawaii and Hawaii State Department of Health, Office of Health Status Monitoring, Hawaii Health Survey. Sub county demographic counts are based on estimates/projections provided by Pitney Bowes Business Insight, Population estimates by race were provided by the Hawaii State Department of Health, Office of Health Status Monitoring, Hawaii Health Survey Hospitalization rate area maps were created by HCI using HHIC provided Hospital Service Area maps, where darker shading of Hospital Service Areas reflects higher rates. 2.3 Key Informant Interviews In order to supplement the quantitative findings, key informants were interviewed to further assess the underlying drivers for health outcomes, current community efforts, and obstacles to health. These key informants were chosen by the HAH Advisory Committee on November 7 8, 2012 through a structured nomination and selection process, which followed a thorough review of the preliminary core indicator data. Advisory members nominated community members with expertise in public health, in the top ten topic areas from the core indicator analysis, as well as in those topic areas where there were data gaps. Key informants were also nominated for their knowledge of vulnerable populations, such as low income or more adversely impacted racial/ethnic groups. After the nomination process, the advisory members prioritized the list through a voting process. 12
15 The key informant interview process was part of a larger state wide CHNA effort in which a total of 105 community experts were nominated, then prioritized down to a list of 75. The remaining 30 nominated key informants were maintained on an alternate list, in the event that a key informant was not available. Roughly 15 key informants were allotted for each of the four counties and for the overall state perspective. For this Kauai County report, 13 key informants were interviewed for their specific knowledge of the health needs of this community. When certain topic areas were lacking an interview specific to Kauai County, findings from the state wide perspective were included. The interviews were conducted by local consultants, Storyline Consulting. The interviews took place between November 19, 2012 and January 2, 2013 and lasted minutes in length. Most interviews took place by phone; a few took place in person. Storyline Consulting typed notes from the interviews during the conversation, capturing the bulk of the conversation verbatim. Interview notes were then condensed and entered into a data collection spreadsheet. The information obtained from these interviews was incorporated into this report in three ways. A summary qualitative analysis tool called a word cloud was produced using TagCrowd.com to identify the most common themes and topics. Words or phrases that were mentioned most often display in the word cloud in the largest and darkest font (see Figure 3.6). Next, input from the key informants was included in each relevant topic area in Section 3.2. Lastly, any recommended community programs or resources are referenced in Appendix D: Identified Community Resources. A Key Informant Interview Guide was developed to guide the interviews. Storyline Consulting adapted the interview guide to best suit Hawaii s context, unique ethnic/racial profile, and culture. The questions used in the guide are listed below: Q1: Could you tell me a little bit about yourself, your background, and your organization? Q2: You were selected for this interview because of your specialized knowledge in the area of [topic area]. What are the biggest needs or concerns in this area? Q3: What is the impact of this health issue on low income, underserved/uninsured persons? Q4: Could you speak to the impact on different ethnic groups of this health concern? Q5: Could you tell me about some of the strengths and resources in your community that address [topic area]? Q6: Are their opportunities for larger collaboration with hospitals and/or the health department that you want us to take note of? Q7: What advice do you have for a group developing a community health improvement plan to address these needs? Q8: What are the other major health needs/issues you see in the community? Q9: Is there anything else you d like us to note? 13
16 2.4 Community Survey An online survey was used to collect community opinions on the greatest health needs for Kauai County. The survey link was virally distributed by members of the HAH Advisory Committee and was posted on several local websites, including The survey was open from November 28 to December 24, Because the survey sample is a convenience sample, it is not expected to be representative of the population as a whole. Survey respondents provided select personal characteristics, including gender, age, sex, and zip code of residence and whether or not the resident works in the health field. Residents were asked to rank the top ten topic areas from the core indicator analysis in order of importance for their community, as well as informing us about other topic areas of concern. Respondents were also asked which racial/ethnic groups they felt experienced more health problems than average. Lastly, there was an open ended question asking the resident if there was anything else they would like to share with us, in terms of health concerns in their community. Opinions gathered with this survey are included in this report as highlights, called Voices from the Community, in describing notable areas of need. 14

17 3 Community Health Needs Assessment Findings 3.1 Demographics The demographics of a community significantly impact its health profile. Different ethnic, age, and socioeconomic groups may have unique needs and take varied approaches to health. This section provides an overview of the demographics of Kauai County, with comparisons to Hawaii and the United States for reference. All estimates are sourced from the U.S. Census Bureau s American Community Survey unless otherwise indicated Population In 2011, Kauai County had a population of 67,701. As measured by the decennial Census, the county had a population density between those of Hawaii and the U.S. While the county is home to just 4.9% of the state s population, Kauai County grew at a faster rate than both the state and nation between Population density, 2010 Population change, Table 3.1: Population Density and Change Kauai County Hawaii U.S. 108 persons/sq. mi 212 persons/sq. mi 87 persons/sq. mi 14.8% 12.3% 9.7% *2010 U.S. Census Age As seen in Figure 3.1, the Kauai County population is older than that of Hawaii and the rest of the country, with a median age of 42.2 (compared to 38.5 for Hawaii and 37.3 for the U.S.). The age group in particular is much smaller, at just 6.3% of the total population. Conversely, the county s population (30.2%) is quite a bit larger than both the state and the nation. Figure 3.1: Population by Age,
 are")
18 Racial/Ethnic Diversity Kauai County s racial/ethnic makeup, and that of the state as a whole, differs quite a bit from the rest of the country. In Figure 3.2 below, the race groups displayed to the left of the blue line include residents reporting one race only, while residents reporting two or more races and Hispanic/Latino ethnicity (of any race) are shown to the right of this line. The population in Kauai County reporting a race of White only makes up 32.9% of the population, compared to 25.0% in Hawaii and 74.1% in the U.S. Black/African American, Hispanic/Latino, and Other race/ethnicity groups are also much smaller than the U.S. overall. While the American Indian/Alaska Native population in the U.S. is already small, so few individuals of this group live in Kauai County that their population rounds to 0.0% of the total. Figure 3.2: Population by Race/Ethnicity, 2011 The largest single race group in Kauai County is Asian at 37.5%. The majority of the Asian population is Filipino, as seen in Figure 3.3 (which includes all residents reporting a race of Asian only regardless of Hispanic/Latino ethnicity). Kauai County also has much larger Native Hawaiian/Other Pacific Islander (9.2%) and multiracial populations (19.2%) than the rest of the country. A higher percent of Kauai County is foreign born compared to the U.S., but not to Hawaii. In , 13.7% of Kauai County was foreign born, compared to 17.7% of Hawaii and 12.7% of the U.S. overall. However, a substantially lower percent of Kauai County households were linguistically isolated compared to both the state and nation: just 2.7% of households reported that all of its members ages 14 and over had some difficulty speaking English, contrasted with 6.2% of households in Hawaii and 4.8% of households in the U.S. Figure 3.3: Breakdown of Population Reporting Race of Asian Only,
 was lower than both those of Hawaii ($28,882) and the U.S. ($27,334).")
19 3.1.2 Economy Median household income in for Kauai County was $62,531, higher than the national value of $51,914 but lower than the state s $66,420. Per capita income in the county ($26,513) was lower than both those of Hawaii ($28,882) and the U.S. ($27,334). While income in Kauai County is not as high as that of Hawaii, it is tied with Honolulu County for the lowest levels of poverty in the state (8.8% vs. 9.6% for the state). On the Island of Kauai (the only portion of the county where poverty data is available), poverty is concentrated in the northern part of the island. Certain race/ethnicity groups are also more affected by poverty, as seen in Figure 3.4. The Other and American Indian/Alaska Native populations have the highest poverty rates at 17.1% and 12.7% respectively. The two least impoverished groups are Asian (6.0%) and Native Hawaiian/Other Pacific Islander (6.8%). It is important to note that federal definitions of poverty are not geographically adjusted, so the data may not adequately reflect the proportion of Hawaii residents who struggle to provide for themselves due to the high cost of living in the state. Figure 3.4: Poverty by Race/Ethnicity, Education A greater proportion of Kauai County residents aged 25 and older have at least a high school degree (88.3%) compared to the U.S. overall (85.0%). However, the county falls short of meeting the state value of 89.8%. Kauai County also has a lower percentage of adults aged 25 and older who have a bachelor s degree or higher, compared to both the state and the nation, at just 22.7%; 29.4% of Hawaii and 27.9% of the U.S. have at least a bachelor s degree. 17
20 3.2 Overview of Needs Assessment Core Indicator Summary Ninety three indicators of health drivers and outcomes were included in the systematic review of secondary data. Table 3.2 shows the weighted ranking scores for each topic area, from most severe to least. Table 3.2: Core Indicator Summary Scores Topic Area Indicators Score Rank Family Planning Substance Abuse & Lifestyle Mental Health & Mental Disorders Education Transportation Access to Health Services Cancer Immunizations & Infectious Diseases Injury Prevention & Safety Maternal, Fetal & Infant Health Environment Economy Oral Health Heart Disease & Stroke Respiratory Diseases Exercise, Nutrition, & Weight Diabetes 1 n/a n/a Disabilities 0 n/a n/a Older Adults & Aging 1 n/a n/a Social Environment 1 n/a n/a The ranking of scores for the topic areas provides a systematic way to assess a large number of indicators across many topic areas. Because the absolute and relative scores are influenced by the number of available inputs for the scoring equation, scoring differences can arise due to availability of data, so it is important to consider the scores in the context of the primary data and the interrelatedness of many of the topic areas. Findings of both quantitative and qualitative nature are presented below by topic area, along with a discussion of what can be learned from these results. For a complete list of indicators included in the core indicator summary, see Appendix A. Hospitalization Rates Risk adjusted hospitalization rates due to preventable causes in Kauai County for the most recent year available, 2011, are presented in Table 3.3. The specific causes of hospitalization with the three highest overall rates are Mental Health, Bacterial Pneumonia, and Heart Failure. Prevention Quality Indicator (PQI) Composite Rates are a summary of preventable causes as described in the table footnote. Specific causes of hospitalization are further discussed in applicable topic areas below. All hospitalization rates are listed in Appendix B. 18
 Bacterial Pneumonia 141 247.1 (206.3 287.8) Heart Failure 130 225.1 (186.4 263.8) COPD in Older Adults (Ages 40+) 111 317.2 (258.2 376.2) Urinary Tract Infection 66 118.5 (89.9 147.")
 Hypertension 16 28.6 (14.6 42.")
 PQI Composite Chronic Conditions 342 604.4 (540.3 668.4) PQI Composite 577 1020 (936.8 1103.")
21 Table 3.3: Hospitalization Rates due to Preventable Causes in Kauai County, 2011 Preventable Cause Hospitalizations Risk Adjusted Rate per 100,000 (95% CI) Mental Health* ( ) Bacterial Pneumonia ( ) Heart Failure ( ) COPD in Older Adults (Ages 40+) ( ) Urinary Tract Infection ( ) Diabetes Long Term Complication ( ) Low Birth Weight** ( ) Dehydration ( ) Diabetes Short Term Complication ( ) Perforated Appendix*** ( ) Hypertension ( ) Rate of Lower Extremity Amputation <10 suppressed Angina Without Procedure <10 suppressed Asthma in Younger Adults (Ages 18 39) <10 suppressed Uncontrolled Diabetes <10 suppressed Composite Hospitalization Rates PQI Composite Acute Conditions ( ) PQI Composite Chronic Conditions ( ) PQI Composite ( ) * Rate for this cause is unadjusted **Rate is per 100 live births ***Rate is per 100 appendicitis admissions Included in Acute Condi ons Composite Rate Included in Chronic Conditions Composite Rate The rate of hospitalizations due to chronic conditions in 2011 was greater for the East & North Kauai HSA, while the rate due to acute conditions was greater for the West Kauai HSA. Figure 3.5: PQI Composite Hospitalization Rates 19

22 Key Informant Interviews The word cloud below illustrates the Kauai County needs mentioned most often by key informants, where the size and shading of the word reflects the frequency of its use. The concerns include both those pertaining to the informants specific areas of expertise, as well as other issues they see in the community as a whole. Interviews are summarized by the topic area covered by the interviewees expertise in sections through Figure 3.6: Key Informant Interview Word Cloud Community Survey During the period of November 28 to December 24, 2012, 224 surveys were completed for Kauai County. As the survey was a convenience sample, it was not expected to be representative of the county population as a whole. Of the respondents, 73.7% were female, 25.9% male. Over half of respondents were between the ages of 45 and 64; 37.5% were under 45 and 4.5% were 65 or older. Most respondents were Community Health or Public Health Professionals (87.1%). Highest Ranked Topic Areas Transportation Injury Prevention & Safety Maternal, Fetal & Infant Health Mental Health & Mental Disorders Family Planning From the topics that scored highest in the core indicator summary, residents ranked the topic areas to the left highest. From the topic areas that did not score high based on core indicator data, five were selected as also being a concern by at least 50% of respondents. Other Areas of Concern Exercise, Nutrition, & Weight Diabetes Older adults & Aging Economy Heart Disease & Stroke As seen in Figure 3.7, the race/ethnic group most commonly reported as experiencing health problems was Native Hawaiians, followed by Other Pacific Islanders. Health professionals were more likely than non health professionals to include Filipinos as experiencing more health problems than average. Please see highlights throughout this report of respondent opinions titled Voices from the Community. 20


23 Figure 3.7: High Risk Race/Ethnicity Groups Identified through Community Survey Q: In your opinion, which racial or ethnic groups in your community experience more health problems than average? The sections below, , will describe the findings by topic area in the following format: Core Indicators and Supplemental Information This section is more extensive for those topics where need demonstrated in the Core Indicator Summary was greatest. The top ten scoring topic areas include a list of highlights followed by a table including the indicators, most recent value, and how Kauai County fared across the four comparison methods. Green checkmarks indicate that the comparison was good, red X s indicate a poor comparison, and a blank cell indicates no comparison was possible. Further information about core indicators is included in Appendix A. When possible, data is supplemented by additional information obtained from previous needs assessments and reports. Hospitalization Rates As applicable, preventable hospitalization rates are compared to values across the State of Hawaii. Rates by Hospital Service Area are presented to identify the sub county geographies with the highest level of burden. All hospitalization data for Kauai County and a description of the Hospital Service Areas are included in Appendix B. Key Informant Interviews The information gleaned from key informants who were interviewed for their expertise in the relevant topic area is summarized in a table. Main points made by interviewees are organized by the needs and concerns for Kauai County; the impact on low income, underserved or uninsured, and/or race or ethnic groups; and the opportunities and strengths that they have identified in their community. Summary All findings are summarized for the topic with a focus on common themes. 21


24 3.2.1 Access to Health Services Core Indicators and Supplemental Information Core indicators for Access to Health Services in Kauai County compare poorly to the rest of the state: A lower percentage of adults reported having one or more persons they think of as their personal doctor or health care provider than the state average (86.4%) Kauai has the highest proportion of adults without health insurance out of all Hawaii counties The proportion of children without insurance is twice the state average (2.2%) and increased from 3.5% in 2003 to 4.4% in 2005 Figure 3.8: Federally Designated Medically Underserved Populations In addition, the Health Resources and Services Administration has designated the entire county as having a Medically Underserved Population, as illustrated in Figure 3.8. Table 3.4: Core Indicators Access to Health Services Key Informant Interviews Needs/Concerns *Some people are falling through the cracks with spotty health care coverage *After hours primary care not accessible so people go to the ER *Economy is still adversely affecting people s decisions to undergo elective surgeries that require time off work Impact on Low Income, Underserved/Uninsured, Race/Ethnic Groups *Enough primary care practices on the island, but they no longer accept patients who can t pay *There are language & cultural barriers preventing some groups, such as Native Hawaiians, from accessing certain types of care/ treatment even when they are available Opportunities/Strengths *Good, quality care available and expanding *Radiation & chemo available, though cardiac patients must go to another island *Hospitals have quality staff who are from local communities and are familiar with patient population *Move toward looking at keeping 22
25 *In a bad economy, basic needs must be met before addressing other health needs *Homelessness is a big issue *Few psychiatrists and they are all retiring soon people healthy, instead of making them well Summary Although health services are available in Kauai County, financial costs are prohibitive for residents as health insurance coverage lags behind other Hawaii counties. For some groups, language and cultural barriers further impede utilization of available services. Key informants stress that social determinants must be addressed to improve access to care. Voices from the Community So many residents do not understand or are [not] able to communicate their health issues Cancer Core Indicators and Supplemental Information While there are many drivers of cancer, early detection and steps toward prevention can lessen the burden on a community s health. In Kauai County, this area ranked fifth highest. Regarding screenings: The percent of women aged 40 and over who had a mammogram in the past two years was lower than the state average (76.5%). The HP2020 target of 81.1% was unmet The percent of women aged 18 and older who had a pap smear in the past three years was lower than the state average (77.4%). The HP2020 target of 93.0% was unmet The proportion of adults ages 50 and older who have had a blood stool test within the past two years decreased from 46.2% in 2003 to 15.6% in 2010, and compares poorly to both the state (24.7%) and the nation (17.2%) Regarding new cases and mortality rates: Cervical Cancer Incidence was higher than the state average (8.2%), and in the worst quartile of U.S. counties Prostate Cancer Incidence increased from cases/100,000 males in to cases/100,000 males in Colorectal cancer incidence has not met the HP2020 target of 38.6 cases/100,000 population. The colon cancer death rate is also higher than the state average (13.5 deaths/100,000 population) Liver & bile duct cancer incidence rate increased from 6.8 cases/100,000 population in to 7.9 cases/100,000 population in Melanoma incidence rate for Kauai County is higher than the state average of 20.6 cases/100,000 population 23


26 Table 3.5: Core Indicators Cancer Key Informant Interviews Needs/Concerns *Obesity and environmental factors place people at risk, and should be addressed before cancer develops *High cost when found at late stages *Increasing aging population means increased number of people diagnosed with cancer Impact on Low Income, Underserved/Uninsured, Race/Ethnic Groups *Low income women fall through the gaps with screening *Native Hawaiian, Pacific Islanders, and Filipino groups have poorer health outcomes and the women have higher breast/cervical cancer mortality rates *Higher incidence of cancer in Micronesians exposed to nuclear testing radiation *Cancer treatment centers are concentrated on Oahu and are costly to access from other islands Opportunities/Strengths *Breast and Cervical Cancer Control Program reaches out to groups with higher mortality rates *Micronesians formed tight organizations and sports programs; when youth come out for sports they talk to them about disease and health *Hawaii has progressive policies to curb cigarette smoking and to provide free screening for colon and breast cancer *American Cancer Society program to improve access by picking up patients and taking them to their appointments; provides materials in Spanish, Tagalog and Ilocano


27 Summary Kauai County is burdened by many types of cancer. Incidence rates of cervical cancer and melanoma are higher than the state average. Cancer screening for women has not met national targets, and colon cancer screening has decreased in recent years. Given that Kauai County s population is slightly older than the rest of the state, improving screening is important for reducing the health and financial costs of late diagnoses. Key informants highlight the importance of prevention and early diagnosis, but treatment centers are mostly on Oahu and difficult to get to from Kauai Diabetes Core Indicators and Supplemental Information Diabetes as a topic area was not ranked in the Core Indicator Summary due to a limited number of available indicators for the topic. The one indicator available shows that Kauai County has a lower proportion of adults with diabetes (6.1%) than the average for the state (8.3%) and the nation (8.7%). Older adults are much more likely to have diabetes, with a prevalence of 18.4% among ages Hospitalization Rates Kauai County has lower rates of diabetes related hospitalizations compared to the state. The rates of hospitalization due to uncontrolled diabetes and lower extremity amputations in Kauai County have been suppressed due to low case counts in The East & North Kauai Hospital Service Area had a higher rate of hospitalizations due to long term complications of diabetes compared to West Kauai in The Hospitalization rate due to short term complications in West Kauai has been suppressed due to the low case count in Figure 3.9: Hospitalization Rates due to Diabetes,
28 Key Informant Interviews Needs/Concerns *National trend is that 1 in 3 children will have Type II diabetes; in Hawaii, much higher rate of 1 in 2 children *Childhood obesity will lead to diabetes becoming an even bigger problem in the future; the amount of resources spent on diabetes will double *Diabetes is going undiagnosed in many Hawaii residents Impact on Low Income, Underserved/Uninsured, Race/Ethnic Groups *Native Hawaiians have a higher rate of diabetes, and those living in rural areas have little access to specialists *Higher prevalence for diabetes among Native Hawaiians, other Pacific Islanders, Japanese, and Filipinos and we have such a blend of those bloodlines in Hawaii. *Difficulties in translating messages to Samoan and other Pacific Island languages *The high rates in outlying areas and low income populations could be due to lack of self assessment of health conditions and lack of access to critical care Opportunities/Strengths *Work with American Heart and American Cancer Associations to combat obesity *Work with schools to increase physical activity *Can ask legislature to put physical education back in schools Summary Although less of a burden in comparison to other Hawaii counties, the impact of diabetes is projected to increase in severity due to childhood obesity. Diabetes greatest impact is on low income residents with low access to medical care. Key informants also call attention to the need to translate information for non English speakers in some of the higher prevalence populations. Hospitalization rates in East & North Kauai suggest poor disease management in these areas leading to more severe disease. Reducing the impact of diabetes in Kauai County will require combatting obesity, which may be effectively done by collaborating with chronic disease and wellness associations and promoting physical activity, especially in schools and among youth Disabilities Figure 3.10: Percent of Persons with a Disability by Race/Ethnicity: Kauai, Core Indicators and Supplemental Information There was no data included in the Core Indicator Summary specific to Disabilities (please see Section for a discussion on data gaps). Based on data from the 2011 American Community Survey, 11.5% of Kauai residents have a disability, which is lower than the national average of 12.1%. Of people ages 20 to 64 with a disability in Kauai, 21.7% are living in poverty. 2 The most 2 U.S. Census, American Community Survey, 2011 Estimates 26


, 2 the living needs (including housing, transportation, health care, and social support) of the aged and disabled population must be strongly considered in community planning.")

29 common type of difficulty is ambulatory (serious difficulty walking or climbing stairs), as seen in Table 3.6. Table 3.6: Percent of Persons with a Disability, A review of the recent statewide report Maternal and Child Health Needs Assessment Summary identifies two priorities for children with special health care needs: 3 Promote the identification of children with developmental delay Promote the transition of adolescents with special health care needs to adult health care Includes all ages unless otherwise indicated Furthermore, given the large proportion of aging adults 65+ with a disability (42.7%), 2 the living needs (including housing, transportation, health care, and social support) of the aged and disabled population must be strongly considered in community planning. Summary The population of Kauai County with a disability must not be ignored in a needs assessment as their needs may require special attention. Adults with a disability may require special housing, transportation, and health care services. Early identification of needs among children is needed to lessen the burden of disability on their health and wellness, and special focus may be needed to ensure a smooth transition from pediatric to adult health care. Although there are fewer persons living with a disability compared to the nation, a larger percentage of disabled persons live in poverty in Kauai County compared to the population at large. Socioeconomic constraints put this population at further disadvantage Economy Core Indicators and Supplemental Information Economic conditions are highly correlated with health. Although many economic indicators for Kauai County indicate strength, it should be noted that income inequality in Kauai County is the second worst Figure 3.11: Poverty in Kauai County by Census Tract, Map created with Community Issues Management tool: network.org/cim/ in the state and some sub populations are more affected by poverty. Additionally, the proportion of households with cash public assistance income is in the highest quartile of U.S. counties. The unemployment rate was the second highest in the state as of June Poverty is unevenly distributed in the county, as seen in Figure Among the ethnicities represented in Kauai County, the highest poverty levels are found in the Other (17.1%) and American Indian/Alaska Native (12.7%) subpopulations. 4 3 From the Family Health Services Division, Hawaii Department of Health Report: State of Hawaii Maternal & Child Health Needs Assessment Summary, November NASummary


30 Moreover, 15.7% of children in Kauai County live in households receiving government assistance. 5 Key Informant Interviews Although no key informants were interviewed specifically for their knowledge on the economy of Kauai County, the effects of poverty on health were mentioned in several interviews spanning many topics. Please see a discussion of the impact of socioeconomics in Section 4.1. Summary The economic disparity in Kauai County drives many of the health disparities discussed throughout this report. Key informants in many other topic areas discussed the effect of socioeconomic factors on health and quality of life for Kauai s residents. Because federal definitions of poverty do not adjust for geographic variations in the cost of living, secondary data may not adequately reflect the proportion of residents who struggle to provide for themselves due to the high cost of living in Hawaii. The necessity of addressing health and quality of life needs among the 5,710 persons who have income below the federal poverty level 6 is critical in order to realize a healthy community Education Core Indicators and Supplemental Information The education core indicators reflect the disparity that exists in Kauai County for opportunities towards economic and social advancement: Although the proportion of adults without a high school degree (3.5%) is lower than the state and national averages, the groups with the highest proportions are Native Hawaiians (3.9%) and Filipinos (3.9%) A lower proportion of people have a Bachelor s degree (22.7%) than the state average (29.4%) The student to teacher ratio (16.5 students/teacher) is higher than any other county in Hawaii and in the worst quartile among all U.S. counties Table 3.7: Core Indicators Education 4 U.S. Census, American Community Survey, Estimates 5 From the Family Health Services Division, Hawaii Department of Health Report: State of Hawaii Primary Care Needs Assessment Data Book 2012, July U.S. Census, American Community Survey, Estimates 28
31 Key Informant Interviews Needs/Concerns *High quality early childhood education is a critical foundation for later success, but many young children are not mentally stimulated enough *Hawaii does not have universal preschool or mandatory kindergarten *Teen dropouts impact not only their education but also their ability to advocate for their own health and wellness *Teenagers are at risk with alcohol and drug use, chronic diseases like diabetes, and teen pregnancies *Students are graduating unprepared in math and English *Large population of year olds that aren't working or going to school *The necessity of education is not fully appreciated, because of history as a plantation community Impact on Low Income, Underserved/Uninsured, Race/Ethnic Groups *Challenges for low income students include nutrition, adequate sleep, and family dynamics that create depression *Culture is especially important to students who have lost their sense of belonging *More recent immigrants face more challenges, including low education and income in families *Gap between Native Hawaiians and peers at community college level Opportunities/Strengths *Single most important thing to be done today is establishing an early learning base *Many after school support systems are in place today, which are incredibly important *Groups are making home visits to dropouts to re engage them in learning *Should develop village oriented efforts to share success and accountability with community *Prioritize funding for children *Local administrators are making strides with island students by developing themed K 12 educational opportunities to leverage students' interests *Program to support students who weren t planning on attending college by providing tuition, textbook costs, & support services Summary Kauai County faces several challenges in education, including a high student to teacher ratio and a low rate of higher educational attainment among adults. Key informants note cultural barriers to education, especially for Native Hawaiian and recent immigrant students. Several efforts to promote education are underway, including programs to engage K 12 students and to provide financial and social support for at risk college students Environment Core Indicators and Supplemental Information Air quality measures in Kauai County are good, with zero pounds of PBT or Recognized Carcinogens Released into the Air in However, more beach water quality samples exceeded health standards for the presence of pathogenic organisms in Kauai County than elsewhere in the state in Summary While the environment did not arise as a great need for Kauai County, it should be noted that environmental safety can vary within the county on a more local level for which data is not available. Air and water quality has the strongest health effect on the most vulnerable in the community, including 29
32 children and older adults. Pathogens found in recreational water samples can cause a wide variety of acute illnesses, including gastroenteritis, respiratory infection, diarrhea, ear infection, and others Exercise, Nutrition & Weight Core Indicators and Supplemental Information Healthy activity patterns, diet, and weight have profound effects on chronic disease. With the exception of recreation/fitness facility density and SNAP certified store density, Kauai County compared favorably to the U.S. and other Hawaii counties for all core indicators. One alarming trend in Kauai County is the growing proportion of Adults who are Obese, which increased from 14.3% in 2003 to 23.0% in Furthermore, a recent statewide needs assessment of Maternal and Child Health Needs identified reducing the rate of overweight and obesity in young children ages 0 5 as a priority for children in the state. 7 Key Informant Interviews Needs/Concerns *People are not getting enough physical activity, largely because of how car centric society has become *Built environment discourages pedestrians; even when people want to walk they don t have safe options Impact on Low Income, Underserved/Uninsured, Race/Ethnic Groups *Native Hawaiians have higher obesity rates, partly because of culture Opportunities/Strengths *There are many working on policy/advocacy, but the programs are just as important for educating and enlightening *There could be more workplace wellness programs, including healthier food in vending machines and free drinking water *Need to develop safe routes to school to encourage physical activity *Multi organization partnership brought electronic benefit transfer (EBT) payment systems to farmers markets and, with a county grant, doubled the value of tokens so lower income population could buy fresh fruits and vegetables *In schools, sugary treats are prohibited while gardens are taking root Summary Obesity among adults is a worsening problem in Kauai County, which may be partially attributable to the community s culture and physical environment. Native Hawaiians in the community are more likely to be obese. One key informant notes that while some successful programs have already effected positive 7 From the Family Health Services Division, Hawaii Department of Health Report: State of Hawaii Maternal & Child Health Needs Assessment Summary, November NASummary

 and is especially high among Native Hawaiian/Pacific Islanders (198.")
33 changes in the community s eating habits, other initiatives (e.g. workplace wellness programs, safe routes to school) are necessary to continue improving health Family Planning Core Indicators and Supplemental Information Family Planning ranked highest among core indicator topic areas, with poor comparisons across all indicators in this area: Kauai County has a lower rate of intended pregnancies compared to the state average (52.6%) and has not met the HP2020 target of 56.0% The teen birth rate is higher than the state average (29.9%) and is especially high among Native Hawaiian/Pacific Islanders (198.1 births per 1,000 women aged years) The proportion of infants born to mothers with less than 12 years of education is higher than the state average of 7.3% Table 3.8: Core Indicators Family Planning Furthermore, a recent statewide needs assessment of Maternal and Child Health Needs identified reducing the rate of unintended pregnancy (including a focus on teen pregnancy) as a priority for Women and Infants. 8 Key Informant Interviews Needs/Concerns *Drug addiction leads to poor choices about use of protection during sex; babies are neglected or abused or have fetal alcohol syndrome *High teen pregnancy rate *Planned Parenthood closed after hurricane 20 years ago and only reopened this past year, currently only for one day/week Impact on Low Income, Underserved/Uninsured, Race/Ethnic Groups *Youth in foster care are twice as likely to be pregnant by the time they are 21 Opportunities/Strengths *Teenagers that have children can still complete their education through program that allows them to bring infants to school 8 From the Family Health Services Division, Hawaii Department of Health Report: State of Hawaii Maternal & Child Health Needs Assessment Summary, November NASummary

34 *Schools do not provide sexual health education, focus only on abstinence *Need to develop a community health plan that allows evidencebased comprehensive sexual health education & easier access to contraception Summary The family planning issues in Kauai County revolve around pregnancies in young mothers. Attributed by key informants to a lack of adequate sex education in public schools and access to family planning services, the high birth rate among teens is affecting the social and educational development of young women and placing infants at higher risk of adverse health outcomes Heart Disease & Stroke Core Indicators and Supplemental Information Kauai County ranked relatively well in heart health core indicator data. High cholesterol prevalence, while low compared to the state and the nation, did increase from 28.9% in 2003 to 34.1% 2009 and is far from meeting the HP2020 target of 13.5%. Hospitalization Rates Among Hawaii counties in 2011, Kauai County had the second highest rate of hospitalization due to hypertension, and the second lowest due to heart failure. Due to low case counts, the rate for angina without procedure has been suppressed for Kauai County. Only hospitalization rates due to heart failure had case counts high enough to be compared by HSA; East & North Kauai had a higher rate than West Kauai. Figure 3.12: Hospitalization Rates due to Heart Disease,
35 Key Informant Interviews Needs/Concerns *Need for education on smoking prevention/cessation, blood pressure control, weight control, aspirin *Lack of resources for quick EMS response, heart/stroke patient rehabilitation *Need to look toward primary prevention and wellness, developing awareness and healthy habits *Kids are getting driven to structured activities instead of playing outside *Parents don t have time to cook at home and end up eating less healthy but faster food *Food is an important component of many cultural events, but many times the food being served is unhealthy Impact on Low Income, Underserved/Uninsured, Race/Ethnic Groups *Disproportionate impact on Native Hawaiians and Filipinos *Language barriers for Filipino immigrant population *Storytelling is an important way of communicating among the Pacific Island populations, and health information should be shared with this in mind *Access to technology and computer illiteracy may be barriers to utilizing online tools Opportunities/Strengths *A lot of resources are available, it s a matter of leveraging and collaborating *Ability to collaborate when everyone brings their strengths, resources, expertise, and knowledge to the table Summary Kauai County fares relatively well in the area of heart disease and stroke. However, the increase in high cholesterol prevalence as well as the rate of hospitalization due to hypertension may suggest that many adults may have health conditions that indicate poor heart health. According to key informants, Native Hawaiians and Filipinos are most affected by heart disease and stroke; culture and language awareness is critical for addressing this issue. The social environment is also identified as a promoter of unhealthy behaviors among families and the younger generations Immunizations & Infectious Diseases Core Indicators and Supplemental Information Immunizations and infectious disease ranked eighth among Kauai County s areas of need, with tuberculosis incidence a particular area of concern: The tuberculosis incidence rate is 31% higher than the state average (9.0 cases/100,000 population), and also does not meet the HP2020 target of 1.0 case/100,000 population The two other HP2020 targets in this topic area are also unmet: vaccinations rates among older adults for both influenza (target: 90.0%) and pneumonia (target: 90.0%) AIDS Incidence Rate is 24% higher than best Hawaii county (Honolulu, at 7.6 cases/100,000 population) 33


36 Table 3.9: Core Indicators Immunizations & Infectious Diseases Hospitalization Rates Kauai County had the highest rate of hospitalization due to bacterial pneumonia out of all Hawaii counties in 2011; bacterial pneumonia was also the second most frequent cause of hospitalizations in the county (n=141) among the 15 preventable causes studied. Within the county, West Kauai experienced higher hospitalization rates. Figure 3.13: Hospitalization Rates due to Bacterial Pneumonia, 2011 Key Informant Interviews Needs/Concerns *Schools are no longer providing some of the vaccines they used to *Lack of communication between vaccination providers can mean some patients are receiving duplicate vaccinations or no vaccinations *More people are refusing vaccines; needs to be more public education Impact on Low Income, Underserved/Uninsured, Race/Ethnic Groups *Attitudes towards immunization are determined by socioeconomic factors more than race/ethnicity *Migrant populations, unlike immigrants, don t need a health clearance to enter the country *Language and cultural barriers to effective communication and care Opportunities/Strengths *Availability of vaccines through pharmacies has been beneficial *The Hawaii legislature began seriously addressing HIV/AIDS 15 years ago by making it a line item in the communicable diseases budget; Hawaii is now considered a lowprevalence state *Malama Pono performs an 34
37 about the importance of vaccines * Hep B and viral hepatitis are big problems because of the large immigrant population on the island * Viral hepatitis surveillance is poor in the state * Hep C a big problem because Kauai has a fairly large injection drug use problem, and screening is stigmatized * Highest TB rates in the state *Insufficient resources, especially in terms of community health nurses for the Pacific Islander population *Many in the Pacific Islander communities are not used to medical facilities, so nurses provide education and outreach in churches & other social venues instead *Community education is adapted for different cultures: general, Filipino, and Pacific Islander; survey & educational materials are now provided in Samoan, Tongan, Marshallese, Chuukese, Tagalog, Ilocano *Pacific Islanders are denied many Medicaid benefits, and it s unclear how they will be impacted by the Affordable Care Act automatic screening of anyone who visits a physician on the island *Mainland pharmaceutical company has sponsored radio based community education & education for Kauai nurses for 3 years now *Chow Project for syringe exchange, which has drastically reduced the spread of hepatitis and HIV *Local officials, University of Hawaii at Manoa advanced nursing students, Kauai Community School of Nursing students are all collaborating on a Hep B elimination project for the next 3 years *Collaborative efforts should be further encouraged in funding design Summary High tuberculosis and hepatitis incidence rates are concerns in Kauai County, which has a large immigrant population as well as a migrant population that is not required to be screened for infectious diseases when entering the U.S. The county also has the highest rate of hospitalizations for bacterial pneumonia in the state. The frequent hospitalizations due to bacterial pneumonia could, in many cases, be prevented by increasing vaccination rates among adults ages 65 and older from the 69.3% coverage rate to the HP2020 target of 90% coverage. While successful initiatives have reduced HIV prevalence over the years, Kauai County still doesn t compare well to the rest of Hawaii in terms of AIDS incidence. Key informants stress the importance of reaching and educating the immigrant and migrant communities through culturally appropriate methods and venues. Voices from the Community Chronic Hep B is the single biggest infection issue at this time on Kauai Injury Prevention & Safety Core Indicators and Supplemental Information Injuries are a concern for Kauai County; some types of injury cause significant deaths and hospitalizations among residents: The tuberculosis incidence rate is 31% higher than the state average (9.0 cases/100,000 population), and also does not meet the HP2020 target of 1.0 case/100,000 population Motor vehicle collision death rate (12.8 deaths/100,000 population) is higher than the state average (7.8 deaths/100,000 population); the hospitalization rate due to motor vehicle collisions (86.2 hospitalizations/100,000 population) is also higher than the state (63.6 hospitalizations/100,000 population) 35
 is over twice state average (2.4 deaths/100,000 population) Table 3.")

38 The death rate resulting from motor vehicle collisions is much higher for Native Hawaiian/Pacific Islanders in particular (47.5 deaths/100,000 pop) The drowning death rate (5.3 deaths/100,000 population) is over twice state average (2.4 deaths/100,000 population) Table 3.10: Core Indicators Injury Prevention & Safety Key Informant Interviews Needs/Concerns *Difficult for people to leave unsafe situations in a rural island community *Everyone knows everyone else in the small community, making it hard for sexual assault victims to remain anonymous and avoid their attackers afterwards *Challenge to find safe long term housing for homeless families after they reach the 90 day limit at the shelter *Fall prevention for elderly, since falls are the #1 cause of Impact on Low Income, Underserved/Uninsured, Race/Ethnic Groups *Health disparities might not seem as obvious as with chronic disease, but they do exist *Car seats and helmets may be costly for low income families *In the YWCA s anger management classes, racial undertones can be detected *People with less education may be less likely to engage in protective risk reduction factors (e.g. wearing a seatbelt) *Not every culture believes in or Opportunities/Strengths *Collaboration around safe routes to school *Kauai Path has developed paths that provide many areas, including low income neighborhoods, with safe exercise routes *Kauai YWCA provides 24 hour crisis services and lines for domestic violence and sexual assault *YWCA also provides afterschool programs and education on youth violence prevention *YWCA shelter works with families to obtain health insurance coverage 36
 pose high risk for injury *Some communities/groups are less likely to call 911 or for ambulance services (Med QUEST) *Progress with seatbelt and car seat use, especially after")

39 hospitalization and a communityidentified priority in the state values prevention *Accepted behaviors in some cultures (e.g. drinking and driving) pose high risk for injury *Some communities/groups are less likely to call 911 or for ambulance services (Med QUEST) *Progress with seatbelt and car seat use, especially after car seat fitting programs Summary In Kauai County, motor vehicle collisions and drowning have particularly high tolls compared to the rest of the state. Native Hawaiians are impacted most heavily by motor vehicle collisions, which may be related to different cultural attitudes towards safety and prevention. Kauai County has relatively low hospitalization rates due to assault, but the county s small, rural community settings pose unique challenges for assault victims to avoid their attackers. Recent years have seen progress on establishing safe walking routes and with seatbelt/car seat use, but cost and lack of education still prevent some people from adopting risk reducing behaviors Maternal, Fetal & Infant Health Core Indicators and Supplemental Information Maternal, fetal & infant health is an area of concern in Kauai County, particularly when compared to the rest of the state: The proportion of mothers who smoked during pregnancy is 40% higher in Kauai County than in the best ranked Hawaii county (Maui, at 7.2%) Women who binge drink prior to pregnancy is 29% higher than the state average of 23.1% The infant mortality rate is more than twice that of the best ranked Hawaii county (Maui, at 2.1 deaths/1,000 live births) Preterm births in the county increased from 8.6% in 2003 to 10.4% in 2011 Table 3.11: Core Indicators Maternal, Fetal & Infant Health 37

40 Furthermore, a recent statewide needs assessment of Maternal and Child Health Needs identified reducing the use of alcohol during pregnancy as one of its priorities for Women and Infants. 9 Hospitalization Rates Based on the one hospitalization indicator available in this topic area, Kauai County is doing well relative to other Hawaii counties, with the lowest hospitalization rate due to low birth weight. East & North Kauai has higher hospitalization rates than West Kauai. Figure 3.14: Low Birth Weight Rate per 100 Live Births, 2011 Key Informant Interviews Needs/Concerns *Teenage pregnancies have increased *Kauai has higher rates of grandparents caring for children *Domestic violence is a concern, including among teenage parents Impact on Low Income, Underserved/Uninsured, Race/Ethnic Groups *Youth in foster care are much more likely to become young parents, and usually struggle to adequately care for their infants and children Opportunities/Strengths *Recently received Title 10 dollars to expand Planned Parenthood services to support pregnancy, birth, and infant care *A group, Keiki to Career, is focused on many holistic health objectives from birth throughout childhood and adolescence Summary Kauai County is tracking poorly on many maternal, fetal, and infant indicators compared to other Hawaii counties. Expectant mothers are engaging in risky behaviors, including smoking and binge drinking. Infant mortality rates are high, as are preterm births, which have been increasing over time. Although the county overall has a high percent of mothers who receive early prenatal care, certain populations (such as Micronesian women) do not have a tradition of seeking such care. Key informants identify another issue in this area related to family planning: high rates of teen births. This has led more grandparents to take on caring for infants and children. 9 From the Family Health Services Division, Hawaii Department of Health Report: State of Hawaii Maternal & Child Health Needs Assessment Summary, November NASummary


41 Mental Health & Mental Disorders Core Indicators and Supplemental Information Mental health ranked third among Kauai County s areas of need, indicating it is a topic of significant concern. Kauai County is tracking particularly poorly in this area when contrasted with its geographic comparisons: Fewer Kauai County adults reported good physical and mental health in 2010 (55.4%) than the state average (56.4%) The county s suicide death rate is 40% higher than best Hawaii county, Honolulu (10.9 deaths/100,000 population). The suicide rate also increased from 10.5 to 15.3 deaths/100,000 population between and , and does not meet the HP2020 Target of 10.2 deaths/100,000 population The proportion of adults with a depressive disorder is 40% higher than the state average of 8.9% Table 3.12: Core Indicators Mental Health & Mental Disorders Figure 3.15: Federally Designated Mental Health Professional Shortage Areas by Census Tracts The Health Resources and Services Administration has designated a large portion of Kauai both the Waimea and Kauai East regions as mental health professional shortage areas. Voices from the Community Psychiatric patients have no community support structure in place. Hospitalization Rates It is notable that mental health was the most frequent cause for hospitalization among the 15 different preventable hospitalizations that were studied 220 hospitalizations were due to mental health in Kauai County in Almost all mental health admissions were among ages (90.0%), even though this 39


42 group represents only 61.9% of the total population. Also, more than half of mental health admissions were for males (58.2%). Figure 3.16 presents the proportion of mental health hospitalizations by race as well as the population proportions of these race groups according to HHIC provided data. While Whites only make up 31% of the county population, 52% of mental health hospitalizations were among Whites. The same pattern is seen among the Other Race category, which accounted for 25% of hospitalizations while making up only 11% of the population. Japanese, Filipinos, and Hawaiians meanwhile had a disproportionately low number of hospitalizations relative to their populations. Because mental health hospitalization rates are not risk or age adjusted, the mental health admission rates are not compared across geographies due to uncertainties in varying population characteristics. All 2011 values are included in Appendix B. Further data on mental health hospitalizations at a sub county level can be found in the State of Hawaii Primary Care Needs Assessment Data Book Figure 3.16: Mental Health Hospitalizations by Race: Kauai County, 2011 Key Informant Interviews Needs/Concerns *Mental health is a big problem in Kauai, as are the related issues of homelessness and substance abuse *Only about 4 psychiatrists on the island, all over the age of 75 *Funding cuts have heavily impacted mental health services *More patients who need mental health support are showing up in primary care and in the ER, sometimes off their medications *Mental health care system needs additional support Impact on Low Income, Underserved/Uninsured, Race/Ethnic Groups *Many homeless people suffer from mental illness or substance abuse or both. *Mental health services may be a foreign concept to some cultural groups *Culturally sensitive services are hard to find Opportunities/Strengths *Opportunity for collaboration with state facilities, which has not happened yet *Great providers and high quality programs, but not enough capacity 10 Family Health Services Division, Hawaii Department of Health Report: State of Hawaii Primary Care Needs Assessment Data Book 2012, July

43 *Long term care facilities don t have specialized units to deal with psychological issues Summary Core indicators and hospitalization data clearly show mental health is an area of great concern for its residents. As illustrated in the word cloud in Section 3.2, mental health was mentioned most frequently as a concern during the interview process. Key informants also noted that the severe shortages of mental health resources have impacted other parts of the health care system, including hospitals emergency departments. In addition, mental illnesses are closely tied to homelessness and substance abuse. Some cultures traditionally do not seek out mental health services, and may struggle with finding culturally sensitive care when they do. Even though the need is great, mental health resources have been cut due to funding decisions Older Adults & Aging Core Indicators and Supplemental Information Little data specific to older adults was included in the core indicator data summary. The rate of hospitalization due to falls among people aged 65 and older in Kauai County increased slightly between 2003 and 2009, but is still the lowest in the state. As seen under Immunizations & Infectious Diseases (section ), vaccination rates among people 65 and older have not met Healthy People 2020 targets. Voices from the Community [We] need to address the elderly 85 year oldand over population that can t live at home alone and are dropped off to hospital ERs for nonmedical needs because no one [is] available at home to care for them. Hospitalization Rates Overall, most hospitalizations occur among older adults. With the exception of hospitalizations due to short term complications of diabetes and mental health hospitalizations, the unadjusted hospitalization rate was much higher for adults aged 65 and older. Figure 3.17: Unadjusted Composite Hospitalization Rates: Kauai County,
44 Key Informant Interviews Needs/Concerns *Biggest challenge is finding providers who can give safe, adequate care to patients in their homes *Community resources for home care are limited, and hiring private care becomes very costly for individuals *Transition from hospital to homebased or other long term care is another area of concern, especially for individuals who don t have a primary caregiver *Gap group of 50 to 64 year olds who don't qualify for aid as "seniors" but who are significantly affected if illness/injury hampers their ability to provide for their family *A lot of trust is required to allow non family caretakers into the home and care for a loved one *With funding cuts, fewer resources to provide additional support, such as overseeing medication regimen Impact on Low Income, Underserved/Uninsured, Race/Ethnic Groups *Without insurance, home care costs are prohibitive *County program helps some, but it is not enough to cover the full cost of care *People who are employed but don't have insurance coverage have to work while also providing care to multiple generations (children, elderly parents) *Culturally, there may be some groups where families are more involved in care *In recent years, hospice patient population has become more diverse went from being predominantly Caucasian to include more Native Hawaiians, Filipinos, Japanese Opportunities/Strengths *Kauai s Agency on Elderly Affairs helps connect people with services and helps pay for some personal services through grants *The agency has a useful website, but a physical "one stop shop" would be great for mobile seniors to conveniently get information various services, since not everyone has a computer or internet access *Share the Care is a new program to help prevent caregiver burnout *Grief and bereavement support after a loved one passes is important; Kauai Hospice offers telephone calls, support groups, recognition of important dates *Volunteer program to assist people who can t afford a private caregiver but also don t qualify for long term care support *Kauai Hospice has collaborated with other nonprofits, but sees an opportunity for strengthening partnership with DOH Summary Although health data for seniors is lacking, longevity in Hawaii is leading to an increased need for care for seniors. Improved coordination of care could help reduce the burden of managing advice and medications from multiple providers and more effectively deliver health services for this growing population. A particular area of concern identified by key informants is access to affordable, reliable home based care. Some nonprofit groups are working to fill this need, but the cost of care remains burdensome for many elderly residents and their families Oral Health Core Indicators and Supplemental Information In adult oral health indicators, Kauai County fares worse than the state overall. The county compares unfavorably to both the state and the nation in the percent of adults who visited a dentist (66.7% vs. 70.1% and 69.7%, respectively). However, fewer Kauai County adults have tooth extractions and tooth loss compared to the rest of the nation, and do not experience large race, gender, or age disparities. 42
45 Although no oral health indicators in the summary addressed children, a report by the Pew Research Center gave the State of Hawaii a grade of F for meeting only one out of eight benchmarks for key policy indicators. In The State of Children s Dental Health: Making Coverage Matter, 11 Hawaii compared poorly to the nation due to several factors, including: Sealant programs were in place in 0% of high risk schools in 2010 Optimally fluoridated water was provided to only 10.8% of citizens on community systems in 2008 As of 2010, the Medicaid program does not reimburse medical care providers for preventive dental health services Key Informant Interviews Needs/Concerns *Unfluoridated water *Kids don't get preventative dental care *When kids teeth rot, the only option is to get them pulled *Inadequate dental care can lead to life threatening illnesses Impact on Low Income, Underserved/Uninsured, Race/Ethnic Groups *Many dentists don t accept Medicaid for child or adult dental care, even though it should be covered Opportunities/Strengths *Need to support the expansion of community health centers to improve dental care access Summary Both the secondary data and key informant interviews highlight the lack of oral health care available in Kauai County. Given the large impact oral health has on overall health and wellbeing, it is important that residents gain access to and utilize preventative dental care. Possible avenues for improving oral health include fluoridating the drinking water supply, strengthening Medicaid coverage, and supporting dental care provided through community health centers and schools Respiratory Diseases Core Indicators and Supplemental Information Overall, Kauai County compares favorably to the state and nation in respiratory disease indicators (see Appendix A for all values and comparisons). Within the county, where 5.6% of adults have asthma, higher prevalence is seen among the Caucasian (8.7%) and Filipino (6.3%) populations. Hospitalization Rates Among adults aged 40 and older, the hospitalization rate due to chronic obstructive pulmonary disease (COPD) or asthma is higher in Kauai County than all other Hawaii counties. West Kauai sees particularly high hospitalization rates. The hospitalization rate due to asthma in younger adults has been suppressed for Kauai County due to low case counts. 11 From the Pew Research Center s The State of Children s Dental Health: Making Coverage Matter, May


46 Figure 3.18: Hospitalization Rates due to COPD or Asthma in Older Adults, 2011 Key Informant Interviews Needs/Concerns *Tobacco related respiratory illness is preventable *Women who are pregnant and smoking is a concern; women who resume smoking after pregnancy also put children s respiratory health at risk *Asthma correlated with obesity for unknown reasons *Asthma prevalence is significant in kids ages 0 4 *Asthma most common reason for child to be hospitalized *Asthma causes school absenteeism and grades drop Impact on Low Income, Underserved/Uninsured, Race/Ethnic Groups *Lower socioeconomic levels correlated with higher smoking rates *Native Hawaiian, Pacific Islander, and Filipino populations also have higher smoking rates *Asthma more prevalent with poverty; higher rates where housing conditions are not good *Native Hawaiians have highest rate of asthma & chronic disease Opportunities/Strengths *Hawaii s progressive laws have positively impacted smoking rates in last 10 years * Catch a roach program in public housing helps reduce this asthma trigger *Chronic disease self management programs *Data collection and analysis efforts play an important role in educating and empowering people *Community health centers are a great model Summary Residents living in poverty are more likely to smoke and more likely to live in conditions that may trigger asthma. Controlling asthma is particularly important for children, whose education can be negatively affected by the disorder. Key informants praise progressive laws that have impacted smoking rates, and recommend chronic disease self management programs and further data collection and analysis to inform efforts in this area. 44
47 Social Environment Core Indicators and Supplemental Information Little secondary data was available for the core indicator summary that directly pertains to Kauai County s social environment. A smaller proportion of the county s children live in single parent family households than both the state and the nation. A lower percent of Kauai County households were linguistically isolated compared to both the state and nation as well: just 2.7% of households reported that all of its members ages 14 and over had some difficulty speaking English, contrasted with 6.2% of households in Hawaii and 4.8% of households in the U.S. 12 An additional consideration for the Social Environment is the inclusion of two priorities in a recent statewide needs assessment of Maternal and Child Health Needs: 13 Reduce the rate of child abuse and neglect with special attention on ages 0 5 years Prevent bullying behavior among children with special attention on adolescents age Key Informant Interviews Needs/Concerns *The biggest killers (heart disease, cancer, accidents, etc.) are all linked to social determinants of health *Upstream interventions are crucial to public health, yet are not given enough credit *Drivers of health (like housing, education, income, time to exercise) are not addressed in the health care environment *Need to focus on improved outcomes, not just on improved process this is a problem in both public and private sectors *Need to introduce interventions to families early enough so children don t grow up in an environment where alcohol/drug use is the norm Impact on Low Income, Underserved/Uninsured, Race/Ethnic Groups *Traditional Hawaiian culture was disrupted, and it s important for Hawaiians to reconnect with a healthy, sustainable lifestyle *Food banks don t offer any fresh food *A lot of low income, underserved people already have too much on their plate and have difficulty making time for physical activity Voices from the Community [There is a need for] homeless access to affordable health care clinics as a preventive measure to frequent readmits. Opportunities/Strengths *Prevention and upstream interventions are the most important *A lot of Kauai residents are involved in upstream issues *Many groups are already doing great work in Kauai and should be empowered & funded to continue (e.g. Get Fit Kauai, elderly groups, housing advocates, Habitat for Humanity, Kauai PACT) *Opportunity for hospitals to invest in upstream issues in their communities 12 U.S. Census, American Community Survey, Estimates 13 From the Family Health Services Division, Hawaii Department of Health Report: State of Hawaii Maternal & Child Health Needs Assessment Summary, November NASummary


48 Summary In Kauai County, a growing number of people recognize the importance of addressing upstream issues. Largely driven by economic insecurity, social issues such as unemployment, education, alcoholism, and domestic violence all influence a community s health. Low income residents are most impacted by poor social environments that limit opportunities for economic and social advancement. Although there are groups in Kauai County focused on improving these drivers of health, long term funding is required to reap the benefits of their interventions downstream Substance Abuse & Lifestyle Core Indicators and Supplemental Information Measures of substance abuse in Kauai County earn the topic area the second highest ranking among all areas of need: The proportion of adults who binge drink is 50% higher than the U.S. average (15.1%) and 27% higher than state average (17.9%). This proportion has increased over time, from 18.8% in 2006 to 22.7% in Binge drinking is much more common among males (37.6%) than females (8.4%) The county has a higher percent of adults who smoke than the state (14.5%) and the nation (17.3%), and does not meet the HP2020 Target for this indicator (12.0%). Adult smoking prevalence is highest among Native Hawaiians (28.4%) Table 3.13: Core Indicators Substance Abuse & Lifestyle In Kauai County in , the overall percent of hospital admissions that were associated with a substance related disorder (8.1%) was lower than the state average of 8.9%. However, the percentage was higher in the sub county areas of Hanalei (11.5%) and Kapaa (9.3%). 14 Key Informant Interviews Needs/Concerns *Substance abuse has a strong genetic component, but environmental influences also need to be addressed *Long term abusers enter hospice care, which is very expensive Impact on Low Income, Underserved/Uninsured, Race/Ethnic Groups *Underserved are often nonfunctioning addicts, meaning they can't/don't work and become dependent on the others to care for them and their families *Native Hawaiians make up a large Opportunities/Strengths *First time teenage alcohol/ substance abuse offenders go to a teen court, where Hale Opio Kauai connects with the families and implements a family based intervention 14 From the Family Health Services Division, Hawaii Department of Health Report: State of Hawaii Primary Care Needs Assessment Data Book 2012, July

49 *No inpatient or strong outpatient treatment facilities on the island *Adult substance abuse is increasing island wide *Crystal meth is still an issue *Prescription drugs are becoming a big problem share of the substance abuser population Summary Kauai County s problems with substance abuse and lifestyle have wide impacts on the health of the community. Substance abuse rates are high and increasing. Prescription drug addiction is an emerging problem, while drinking, smoking, and crystal meth use continue to be issues. Native Hawaiians in particular represent a large portion of those struggling with substance abuse. Addicts cannot care for their families and sometimes enter hospice care, which becomes very costly. Intervening on psychosocial disorders and other mental health issues may indirectly assist in controlling substance abuse in Kauai County Transportation Core Indicators and Supplemental Information Reliable transportation is essential for accessing health services, and the choices a community makes for daily transportation can have a great impact on the environment. Kauai County residents have the shortest average commute time to work in the state, but compares poorly on the two other transportation indicators: The proportion of workers commuting by public transportation is only a fraction of state average (6%). The share is lowest for people of Two or More Races (0.2%) The percent of workers who walk to work ranks Kauai County in the bottom 50 th percentile of U.S. counties. Again, the race group with the lowest percent is Two or More Races (0.5%), while the age group with the lowest share is (0.2%) Table 3.14: Core Indicators Transportation 47
50 Key Informant Interviews Needs/Concerns *People may be unable to take advantage of bus service if they live far from the main streets with bus routes *Health centers on the island are mostly concentrated around Lihue Impact on Low Income, Underserved/Uninsured, Race/Ethnic Groups *When gas prices increased, many people didn t want to drive but didn t have an alternative transportation option Opportunities/Strengths *The first county to pass a complete streets resolution to accommodate and encourage bicyclists, public transportation, and all ages of pedestrians *Opportunities for more partnerships with the DOH *Safe routes to school are being established, and a statewide bill was just passed to increase the fine for traffic violations in school zones/safe routes to school *Transportation on the island has come a long way, with expanded schedules *Although services are concentrated in Lihue, the western portion of the island also has some facilities (including the Kauai Veterans Hospital, West Kauai Medical Center, community clinics) Summary Public transportation options have improved in Kauai County, but some residents still live too far from bus routes to take advantage of public transportation. The lack of an extensive bus network requires residents to continue driving even when it is costly due to high gas prices. People living outside of Lihue will also have a harder time getting to medical care facilities. 48
51 4 Community Health Needs Summary 4.1 Findings/Conclusions The community health needs of Kauai County span across all of the topics included in this report. Some health issues impact a larger proportion of the population, while others are of greatest impact to particular groups or sub geographies. In order to assess the health needs in Kauai, both objective indicator data and subjective interviews were considered. While indicator data provided a good starting point for determining where attention should be focused, sometimes the data was lacking in depth or breadth on important topics. Interviewing key informants who have local knowledge on the topics helped to fill in details and bring attention to data gaps. Surveying residents elicited health concerns from a small proportion of the community and added highlights to this. Planners will want to consider how to impact these areas, as many areas can be addressed concurrently with appropriate primary and holistic interventions. Several common themes emerge in this assessment that can guide community health improvement planning: All groups experience adverse health outcomes due to chronic disease and health risk behaviors Individuals from all geographies, race, gender, and age groups experience poor health outcomes. High rates of chronic disease patterns, hospitalizations due to preventable causes, and patterns of unhealthy behaviors compels those seeking to improve health to consider interventions at the structural, policy, and community wide level in order to positively impact the long term health of as many Kauai residents as possible. Key informants identified asthma as the most common reason for students to miss school and be hospitalized, although interventions to reduce the frequency and intensity of asthma symptoms have been introduced. The community has also designated the reduction of overweight and obesity among children as a priority, particularly in light of the fact that children in Hawaii have a much higher likelihood of developing Type II diabetes than the rest of the country. Special consideration for mental health, a chronic condition that significantly influences overall health, is critical for achieving population health goals. Substance abuse, often associated with poor mental health, is a problem among teens and is increasing among adults. Many injury related hospitalizations and deaths may be attributable to substance abuse, including motor vehicle collision deaths caused by driving under the influence of alcohol. As highlighted in the primary data, Kauai County does not have the capacity to serve the mental health and substance abuse needs of its residents. Greater socioeconomic need and health impacts are found among certain groups and places in Kauai County Across many topic areas, key informants identified the low income population as both the most vulnerable and the most difficult to reach. Because Census estimates of poverty do not adjust for the higher cost of living in Hawaii, the number of Kauai County residents impacted by poverty is likely underestimated. Among other conditions, poor residents are much more likely to have diabetes and unhealthy body weights. They do not have the time or energy to focus on leading healthy lifestyles and often also forgo cancer screening, dental care, and use of car seats due to costs. Multigenerational lowincome families particularly struggle to find affordable and reliable care for their older members. Poverty is unevenly distributed around the county, with the North Shore and northern portion of the East Side most heavily impacted. As both health status and poverty are closely tied to educational attainment, the issues surrounding education in Kauai County including reduced individualized attention for students and low levels of proficiency in math and English are especially concerning. 49
52 Individuals with less education often have lower levels of health and technology literacy, and have fewer job opportunities open to them. These factors impact the less educated population s ability to recognize potential health issues, seek care, and afford treatment when necessary. Cultural and language barriers inhibit effective intervention for the most impacted populations Because of the strong correlation between poverty and race/ethnicity, some of the groups most impacted by health issues often face cultural barriers to health improvement. Language differences, including limited English proficiency, and poor health behaviors that are common within a culture are challenges that must be overcome in order to effectively prevent disease. Furthermore, perceptions of Western medical care and the stigmatization of health issues in certain cultures prevent some residents from seeking care when they need it. The effects can range from not calling 911 during a medical emergency to not acknowledging ongoing mental health problems. Cultural differences also impact attitudes toward healthy eating habits and the importance of education. Key informants repeatedly stressed the need to find culturally appropriate ways of disseminating health knowledge. The Pacific Islander immigrant population in particular was identified as a group unaccustomed to formal medical facilities, so informants advocated reaching out in more familiar settings, including churches and other social venues. See Section for further discussion of health disparities by race/ethnicity. Limited access to care results in greater health impacts Like the other Neighbor Islands, Kauai County suffers from limited access to various types of care. The Health Resources and Services Administration has designated the entirety of the county as medically underserved. Centers for cancer prevention, screening, and treatment are mostly located on Oahu. As mentioned above, older adults have trouble finding home health care providers they can afford. Substance abuse is a significant issue, but there are few resources for treatment in Kauai County. Key informants noted a dearth of diabetes specialists in rural areas, leading to under diagnosis of diabetes. Mental health providers are in particularly short supply. The shortage of mental health services means other segments of the health care system, including emergency departments and primary care providers, are overwhelmed by the large need in this area. Certain parts of Kauai also have further difficulties accessing care: most health centers are located around Lihue, requiring residents of other areas to find transportation across the county. Community health centers and schools are key community assets for effective interventions Community health centers were recommended by key informants as optimal ways to provide services, particularly for oral health care and treatment of respiratory disease. Locally based care has many advantages, including the ability to bring primary care services that are culturally appropriate to rural areas. Furthermore, community health centers are a natural complement to the many initiatives that have been developed through community efforts. Key informants highlighted residents collaborative spirit as an important asset to addressing drivers of health, including education, access to healthy foods and recreational facilities, and social support. Organizations, too, have collaborated to tackle social issues larger than their individual areas of focus. Despite the rich human capital in Kauai County, however, there is a shortage of funding to support communities crucial work in upstream issues. The allocation of more financial resources is needed to continue improving the health of Kauai s communities. School based programs also hold promise in addressing the many health challenges faced by children and young adults. Childhood obesity can be addressed in school by increasing physical activity time and sports activities, an important step towards reducing future chronic disease. Dental health can be improved by implementing evidence based strategies that are provided in the school environment. Schools can also play an important role in addressing the high teen pregnancy rate among certain 50

 are listed in Figure 4.1 below.")
53 groups; key informants called for improved education surrounding family planning. Health interventions for children and teens can have a two fold benefit of establishing healthy life long behaviors among Kauai County s youth, as well as influencing the health of their families Disparities Highlights Although the root causes of health disparities are attributable to socioeconomics, race/ethnicity is a correlate for which data is more often available. The topic areas for which each race/ethnic group was noted to have a severe disparity (either by a key informant or for at least one indicator) are listed in Figure 4.1 below. Note that some race/ethnic category definitions differ between secondary data sources, and the degree to which disparities could be assessed depend on data availability. A significant finding is that Native Hawaiians and Pacific Islanders are faring worse across more topic areas than any other group. Figure 4.1: Areas of Disparity for Race/Ethnicity Groups 51
54 4.1.2 Identified Data Gaps There were four topic areas for which so little data was available that a secondary data summary score was not calculated: Diabetes, Disabilities, Older Adults & Aging, and Social Environment. Although Diabetes was further informed by hospitalization rates, more data is needed on the disease regarding children and teens. Obesity indicators, while correlated with diabetes, are not necessarily predictive of diabetes impact. Although the population affected by disabilities was described with data from the American Community Survey, information on the specific needs and challenges of this group is lacking. The health needs of Older Adults can be further described with data from other topics such as tooth loss, immunization rates for adults 65 and older, and age specific hospitalization rates, but data describing the social isolation, disability, and care needs faced by this population is lacking. While some secondary data shed light on the topic of mental health, primary data brought further attention to this critical area that impacts many other health behaviors and outcomes. For Immunizations & Infectious Diseases, little sub population data is available to examine disparities. Secondary data specific to children and teens in the topic areas of Exercise, Nutrition & Weight, Oral Health, and Injury Prevention & Safety are scarce, although key informants included these areas in their discussion of child health issues. Another area where available data does not fully describe the health needs is with new immigrant and transient populations. Primary data did highlight the populations arriving in Hawaii under the Compact of Free Association and the new challenges this growing group presents to the state s health care system. Due to this population s mobility, marginalized existence, and cultural isolation, traditional public health surveys and population statistics typically do not capture their data and circumstance. However, acute care settings are challenged to provide services and community infrastructure to support the new populations. 4.2 Limitations and Other Considerations This needs assessment is subject to limitations of the methods used for summarizing secondary data and key informant interview findings. Topic areas to which core indicators were assigned are not truly independent of each other, and the scoring system used could not account for the inherent relationships between health and wellness topics. The number of indicators available for each topic area varied, and while the scoring system numerically accounted for this variation, the impact of a given indicator on the final scoring for a topic area was greater if fewer indicators and/or comparisons were available. Nonetheless, this needs assessment utilized an extensive data set, derived from the best public health data made available by the Hawaii State Department of Health and the Hawaii Health Data Warehouse. By using the local website source for indicator data, available from the most recent, least aggregated across years, and most detailed race/ethnicity disparity data possible was considered. Race and ethnicity breakout data from this source provides information on the numerous subgroups in Hawaii (Japanese, Filipino, Chinese, Native Hawaiian, Pacific Islander), allowing this report to understand health needs and disparities for groups that together compose a majority of the population in Kauai County. Indicators from national data sources had limitations, including combining important race and ethnic groups together and thus masking disparities. Importantly, in assessing poverty and economic measures, data sources did not account for the higher cost of living on the islands, resulting in an underestimation of poverty in Kauai County. The variability in accuracy and precision of secondary data indicators, as well as the comparisons used, are further limitations. Some indicators, such as those from vital statistics, are based on accurate counts and are the most exact. Other indicators which are based on surveys are subject to variability due to
55 sampling error and accuracy of self reported data. The small number of counties in Hawaii allowed for few in state comparisons. Because of the varying amount of historical data available for different sources, trend comparisons were not equal between indicators. Additionally, many indicators from surveys conducted in Hawaii, including the Hawaii Health Survey (HHS) and Pregnancy Risk Assessment Monitoring System (PRAMS), could not be compared to a national value or benchmark due to lack of equivalent data. When national comparisons were available, sometimes the indicator was in an area where the nation as a whole is doing very poorly and a favorable comparison for Kauai County did not necessarily reflect good health; examples of this include obesity and physical activity measures. Healthy People 2020 benchmarks were used for comparisons, when available, though some of these can be ambitious targets for communities to meet. While preventable hospitalization rate indicators provided by HHIC were invaluable for their insight into the underlying health of the community at a sub county level, it should also be considered that the variation in rates may reflect geographic differences in access and timeliness of care. Further analysis may be needed to better understand Kauai County s preventable hospitalization patterns. One challenge in conducting this community health needs assessment was the condensed timeline. All of this work was compressed into a 5½ month time frame, overlapping the winter holidays, which impacted the primary data collection strategy. However, the key public health officials and community health leaders of Kauai County were successfully included in the key informant process (See Appendix C for a full list of key informants interviewed). The online community survey was aimed to further complete the understanding of the local needs in Kauai County, although the limited participation makes it difficult to assess if findings accurately reflect the broader community s perspective. While invaluable data was provided through the primary data collected for this report, a future CHNA process would benefit from a longer time horizon and would allow for expanded involvement and input from the community. Regardless of the limitations, this report provides a snapshot of the health and quality of life challenges in Kauai County. The needs outlined provide a guide for community benefit planning, but subsequent efforts may be needed to delve deeper into specific areas of need and the most effective methods of intervention. While there are many areas of need, there are also innumerable community assets and a true aloha spirit that provide ample foundation for community health improvement activities 53
56 5 Selected Priority Areas On March 5, 2013, HCI presented the Community Health Needs Assessment findings for Kauai County to the Wilcox Health Community Benefit team. Following the presentation, HCI facilitated a prioritization process whereby the team of nine narrowed down the 20 topic areas of need from the CHNA report to two priorities. These two priorities will be the focus for Wilcox s implementation strategy planning. The group used the Nominal Group Planning Process. The group determined the following criteria for selecting priorities: Magnitude/severity of problem Opportunity to intervene at prevention level Alignment with Wilcox s mission/strengths/programs Opportunity for partnership Solution could impact multiple problems Feasibility of change Importance of problem to community Each member of the community benefit team was given a ballot that listed the 20 topic areas of need highlighted in the CHNA report. Each member cast their vote, selecting three topic areas as the key areas of need to focus community benefit efforts. The team members understood that the selected priorities would become the areas of focus for their implementation strategy planning. After one round of voting and discussion, the top two topic areas selected as priorities were: 1. Access to Health Services 2. Exercise, Nutrition & Weight HCI then asked for nominations for key stakeholders so that their priorities could be validated and communicated to the larger community. The group nominated the following individuals: Dileep Bal, District Health Officer for Kauai County Bernard P. Carvalho, Mayor of Kauai HCI conducted these key stakeholder interviews and were able to share and validate the hospital s priorities and learn about partnership opportunities. 54
57 Appendix A: HCI Provided Data About HCI Provided Data Healthy Communities Institute (HCI), in partnership with the Hawaii Department of Health and the Hawaii Health Data Warehouse, provides demographic and secondary indicator data on health, health determinants, and quality of life topics. Data is typically presented in comparison to the distribution of counties, state average, national average, or Healthy People 2020 targets. Data is primarily derived from state and national public health sources. HCI also provides a database of promising practices from a variety of sources, including the Centers for Disease Control and Prevention. All of the HCI content is presented in a public web platform that also serves as a publishing tool for components of Community Health Needs Assessments. Framework for Indicator/Data and Topic Selection The framework for indicator selection within the Health category is based on the Department of Health and Human Services (DHHS) Healthy People initiative. Healthy People establishes science based national objectives for improving the health of the nation. The initiative establishes benchmarks every ten years and tracks progress toward these achievable goals. This framework encourages collaboration across sectors and allows communities to track important health and quality of life indicators focusing on general health status, health related quality of life and wellbeing, determinants of health and disparities. The Health subcategories are based on the Healthy People framework, and multiple indicators across the health sub topics that correspond with Healthy People targets have been chosen (based on data availability, reliability and validity from the source). Indicators in the other categories were selected according to national consensus and feedback from a wide set of advisors, public health officials, health departments, and local stakeholders from various sectors in the community. For example, the education indicators are based on the National Center for Health Research and Statistics and United Way of America, and the standards and goals they set forth to help track educational attainment in the U.S. Economic indicators were selected in conjunction with economic development and chamber of commerce input. All of the selected indicators have gone through a vetting process where HCI s advisory board, as well as stakeholders in communities who have implemented HCI systems, provide feedback to refine the core indicators in order to best reflect local priorities. The indicator selection process evolves over time with changing health priorities, new research models and national benchmarks. HCI continues to incorporate models and standards from nationally recognized institutions such HHS s Healthy People, AHRQ s PQI s, EPA Air Quality standards, National Center for Education Research and Statistics priorities, United Way, and United States Department of Agriculture s Food Atlas, among many others. Core Indicator Data Summary: Analytic Approach and Scoring Methodology As discussed in Section 2.1, the selection of topic areas for primary data collection relied on four types of Core Indicator comparisons: geographic, trend, disparity, and benchmark. A four point system was used to evaluate each indicator on these four comparison methods, as illustrated in the examples below. Please note the data in this section is presented only to demonstrate the methodology and may not reflect data referenced elsewhere in this report. 55


58 Geographic Comparison The core indicator was assigned a geographic comparison point if it was worse than its comparison values on average: Relative to the comparison geography s value, the county value receives one of three designations, which is translated into points to calculate an average: Better/same 0 points Worse 1 point For example, this breast cancer core indicator for Honolulu County would be assigned a geographic comparison point. Much worse 2 points The following criteria were used to assign points for worse or much worse comparisons: Comparison Worse 1 point Much worse 2 points National* worse than U.S. value *or* worst 50th percentile of U.S. counties >25% worse than U.S. value *or* worst 25th percentile of U.S. counties State worse than state value >25% worse than state value HI counties worse than best county value >25% worse than best county value *National comparison uses either the U.S. value or a distribution of U.S. counties depending on data availability. An indicator with a national comparison will be compared to either the U.S. value or the county distribution, never both. Average was calculated as total points divided by number of possible geographic comparisons. If average was at least 1 (worse), then geographic comparison was considered poor for indicator. National The county value is in the worst 25 th percentile of U.S. counties 2 points State The county value is worse than the state value of cases per 100,000 females, but not more than 25% worse 1 point HI counties The county value is worse than the best county value (Kauai, at cases per 100,000 females), but not more than 25% worse Sum of Points 1 point 4 points Since the average was greater than 1, this breast cancer incidence rate core indicator was assigned a geographic comparison point. 56

59 Trend Comparison The indicator was assigned a point if the value was worsening by at least 2.5% on average. In this example of a colon cancer screening indicator, a point would be assigned because the value decreased by 7.9% on average: Disparity Analysis The indicator was assigned a point if there were large disparities among subpopulations. In this Core Indicator analysis, any indicator with a maximum disparity ratio of 4 or greater received a point. This example of an adult smoking indicator would receive a point because its maximum disparity ratio is 4: Healthy People 2020 Target Comparison The indicator was assigned a point if it did not meet a Healthy People 2020 target. In this high cholesterol prevalence example, a point would be assigned because the county did not meet the target of 13.5%: 57
60 Scoring The total earned points and total possible points were tallied for each indicator. In this example of a mammogram history indicator, four points were possible since all four comparisons were available. Out of the four potential points, the indicator earned only one point, for not meeting the Healthy People 2020 target: The total earned points and total possible points were then tallied for all indicators in a topic area to calculate the topic area summary score. In this cancer topic area example, 15 points were earned out of 38 possible points, giving the topic area a summary score of These summary scores were then ranked in descending order to help guide the primary data collection process. 58

61 Core Indicator Data Most of the core indicator data included in this report can be found on Hawaii Health Matters ( 59
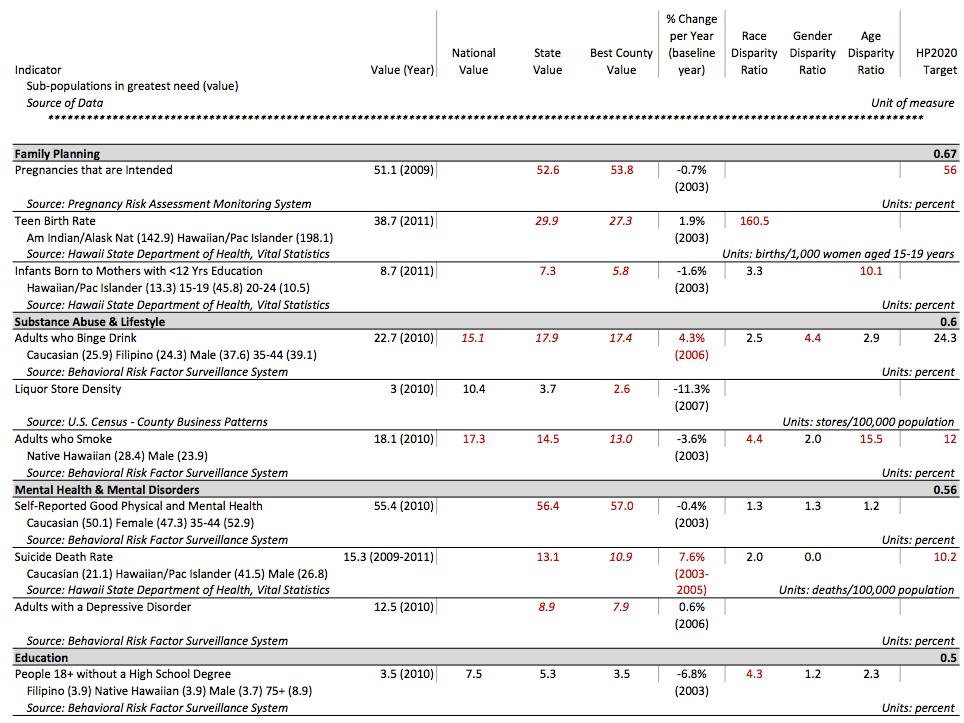
62 60
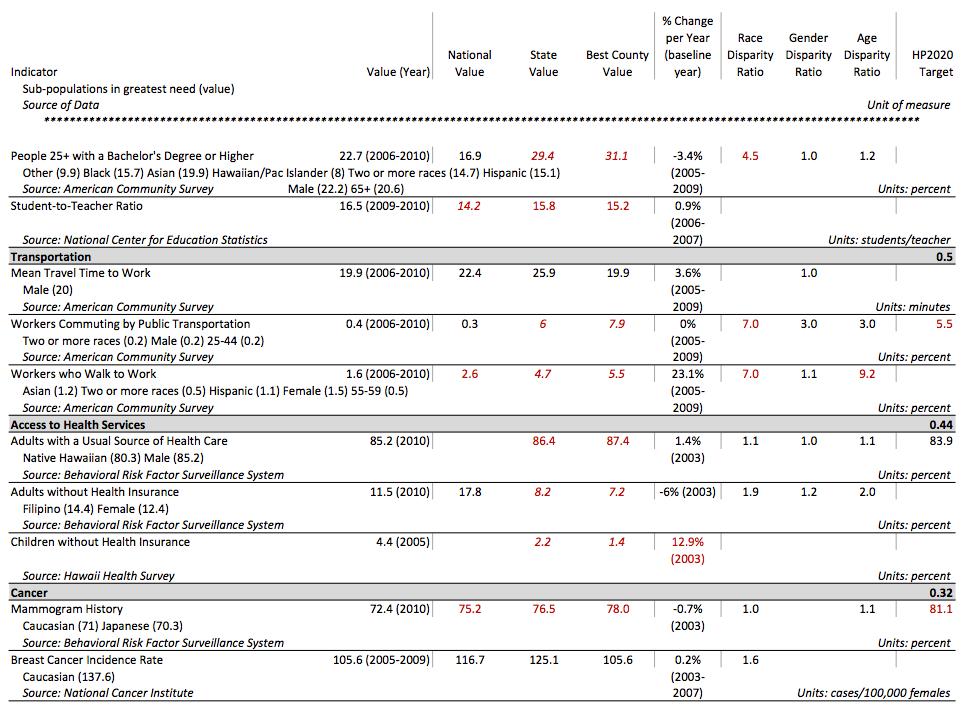
63 61
64 62
65 63
66 64
67 65
68 66
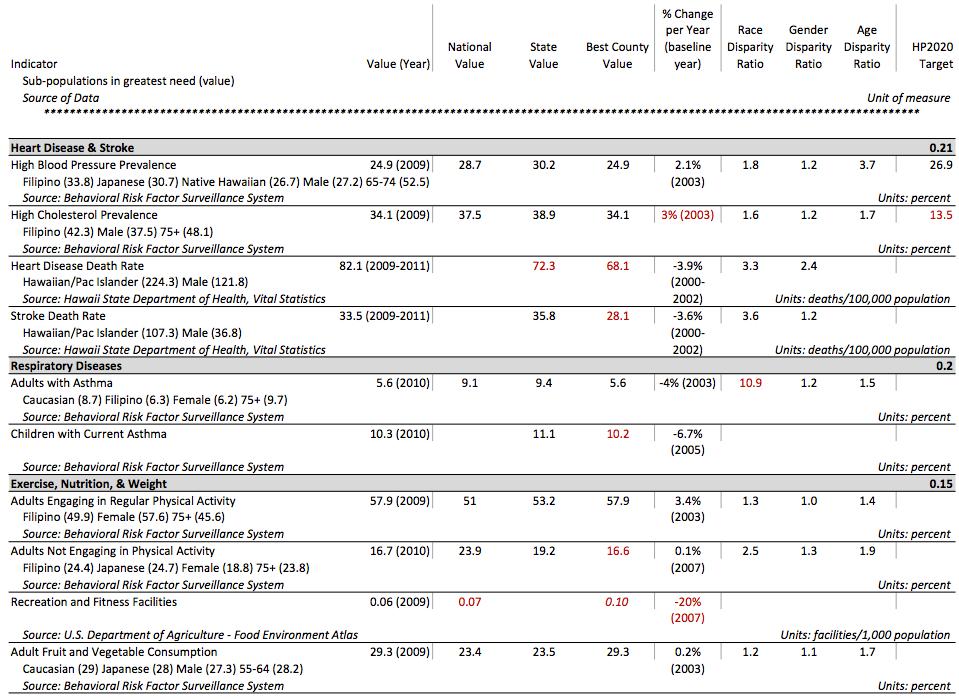
69 67
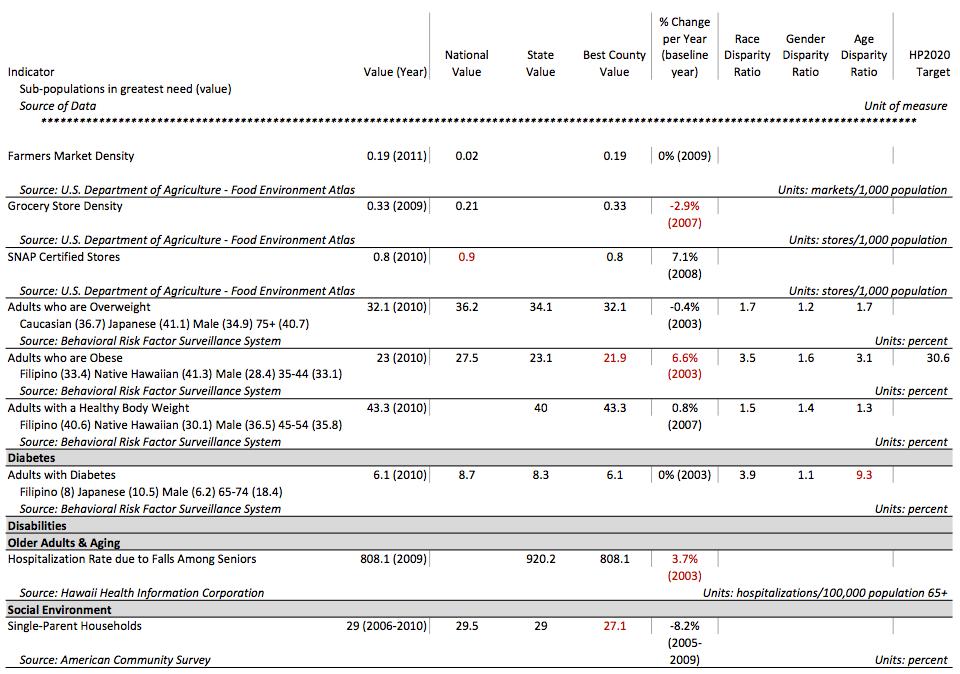
70 68
 derived the Hospital Service Areas (HSAs) used in this report.")

71 Appendix B: Hospitalization Data Hospital Service Areas Figure 5.1: Kauai County Hospital Service Areas The Hawaii Health Information Corporation (HHIC) derived the Hospital Service Areas (HSAs) used in this report. These HSAs are composed of contiguous zip codes surrounding hospitals self defined service areas, and were delineated by hospital CEOs in The following zip codes are included in each HSA: East & North Kauai West Kauai Hospitalization Rates Rates were provided by HHIC, and are defined by the Agency for Healthcare Research and Quality (AHRQ) as a set of measures that can be used to identify quality of outpatient care which can potentially prevent the need for hospitalization. Rates are risk adjusted based on the Healthcare Cost and Utilization Project s State Inpatient Databases. Please see for a complete definition of indicators. Because the area of mental health was not well represented in the Core Indicator Summary, HHIC also provided unadjusted rates of hospitalization for any mental health related primary diagnosis. For all rates, values were suppressed if based on fewer than 10 cases. Population estimates are based on the U.S. Census Bureau, Population Division, Intercensal Estimates of the Resident Population for Counties of Hawaii. Sub county demographic counts are based on estimates/projections provided by Pitney Bowes Business Insight, Population estimates by race were provided by the Hawaii State Department of Health, Office of Health Status Monitoring, Hawaii Health Survey The tables below include risk adjusted hospitalization rates with 95% confidence intervals for Kauai County and all contained Hospital Service Areas for 2009, 2010, and Unadjusted rates by age, gender, and race are for 2011 only (race specific rates unavailable at HSA level). All mental health hospitalization rates are unadjusted. Use caution when comparing unadjusted rates, as they may represent populations of differing age distribution. State values are also provided for comparison. 69
Pali Momi Medical Center Community Health Needs Assessment. April 23, 2013
 Pali Momi Medical Center Community Health Needs Assessment April 23, 2013 Table of Contents Executive Summary... 6 Introduction... 6 Approach... 6 Data Sources and Methods... 6 Areas of Need... 7 Selected
Castle Medical Center Community Health Needs Assessment
 h hh Castle Medical Center Community Health Needs Assessment December 16, 2013 Caring for our community, Sharing God s Love Mālama ana i kō kākou kaiāulu, Ka ana i ke aloha o ke Akua Table of Contents
COMMUNITY HEALTH NEEDS ASSESSMENT ST. VINCENT MADISON COUNTY SERVICE AREA COMMUNITY HEALTH NEEDS ASSESSMENT REPORT 2016
 2016 COMMUNITY HEALTH NEEDS ASSESSMENT ST. VINCENT MADISON COUNTY SERVICE AREA COMMUNITY HEALTH NEEDS ASSESSMENT REPORT 2016 COMMUNITY HEALTH NEEDS ASSESSMENT - 2 CONTENTS EXECUTIVE SUMMARY... 5 DEMOGRAPHICS...5
Potentially Avoidable Hospitalizations in Tennessee, Final Report. May 2006
 The Methodist LeBonheur Center for Healthcare Economics 312 Fogelman College of Business & Economics Memphis, Tennessee 38152-3120 Office: 901.678.3565 Fax: 901.678.2865 Potentially Avoidable Hospitalizations
Community Health Needs Assessment for Corning Hospital: Schuyler, NY and Steuben, NY:
 Community Health Needs Assessment for Corning Hospital: Schuyler, NY and Steuben, NY: November 2012 Approved February 20, 2013 One Guthrie Square Sayre, PA 18840 www.guthrie.org Page 1 of 18 Table of Contents
2012 Community Health Needs Assessment
 2012 Community Health Needs Assessment University Hospitals (UH) long-standing commitment to the community spans more than 145 years. This commitment has grown and evolved through significant thought and
Community Health Needs Assessment Supplement
 2016 Community Health Needs Assessment Supplement June 30, 2016 Mission Statement, Core Values, and Guiding Social Teachings We, St. Francis Medical Center and Trinity Health, serve together in the spirit
Health Indicators. for the Dallas/Fort Worth Combined Metropolitan Statistical Area Brad Walsh and Sue Pickens Owens
 Health Indicators Our Community Health for the Dallas/ Fort Worth Combined Metropolitan Statistical Area Checkup 2007 for the Dallas/Fort Worth Combined Metropolitan Statistical Area Brad Walsh and Sue
Implementation Strategy
 2017-2019 Implementation Strategy Table of Contents Introduction... 2 2016 Community Health Needs Assessment Summary... 2 Definition of the Community Service Area... 3 Significant Health Needs the Hospital
WilCo Wellness Alliance. Summit Presentation. Cara Woodard Account Manager. April 25, 2017
 WilCo Wellness Alliance Summit Presentation Cara Woodard Account Manager April 25, 2017 Background and Overview Healthy Communities Institute Mission Headquarters Improve the health, vitality and environmental
COMMUNITY HEALTH NEEDS ASSESSMENT HINDS, RANKIN, MADISON COUNTIES STATE OF MISSISSIPPI
 COMMUNITY HEALTH NEEDS ASSESSMENT HINDS, RANKIN, MADISON COUNTIES STATE OF MISSISSIPPI Sample CHNA. This document is intended to be used as a reference only. Some information and data has been altered
2015 Community Health Needs Assessment Saint Joseph Hospital Denver, Colorado
 2015 Community Health Needs Assessment Saint Joseph Hospital Denver, Colorado December 11, 2015 [Type text] Page 1 Contributors Denver County Public Health Dr. Bill Burman, Director, and the team from
Hospital Discharge Data, 2005 From The University of Memphis Methodist Le Bonheur Center for Healthcare Economics
 Hospital Discharge Data, 2005 From The University of Memphis Methodist Le Bonheur Center for Healthcare Economics August 22, 2008 Potentially Avoidable Pediatric Hospitalizations in Tennessee, 2005 Cyril
MEDICARE ENROLLMENT, HEALTH STATUS, SERVICE USE AND PAYMENT DATA FOR AMERICAN INDIANS & ALASKA NATIVES
 American Indian & Alaska Native Data Project of the Centers for Medicare and Medicaid Services Tribal Technical Advisory Group MEDICARE ENROLLMENT, HEALTH STATUS, SERVICE USE AND PAYMENT DATA FOR AMERICAN
Chapter VII. Health Data Warehouse
 Broward County Health Plan Chapter VII Health Data Warehouse CHAPTER VII: THE HEALTH DATA WAREHOUSE Table of Contents INTRODUCTION... 3 ICD-9-CM to ICD-10-CM TRANSITION... 3 PREVENTION QUALITY INDICATORS...
MONROE COUNTY HEALTH PROFILE. Finger Lakes Health Systems Agency, 2017
 MONROE COUNTY HEALTH PROFILE Finger Lakes Health Systems Agency, 2017 About the Report The purpose of this report is to provide a summary of health data specific to Monroe County. Where possible, benchmarks
BARNES-JEWISH HOSPITAL 2016 COMMUNITY HEALTH NEEDS ASSESSMENT & IMPLEMENTATION PLAN
 BARNES-JEWISH HOSPITAL 2016 COMMUNITY HEALTH NEEDS ASSESSMENT & IMPLEMENTATION PLAN 1 TABLE OF CONTENTS Executive Summary... 3 Community Description... 4 Geography... 4 Population Trends... 5 Income...
STEUBEN COUNTY HEALTH PROFILE. Finger Lakes Health Systems Agency, 2017
 STEUBEN COUNTY HEALTH PROFILE Finger Lakes Health Systems Agency, 2017 About the Report The purpose of this report is to provide a summary of health data specific to Steuben County. Where possible, benchmarks
September 2013 COMMUNITY HEALTH NEEDS ASSESSMENT: EXECUTIVE SUMMARY. Prepared by: Tripp Umbach TOURO INFIRMARY
 September 2013 COMMUNITY HEALTH NEEDS ASSESSMENT: EXECUTIVE SUMMARY Prepared by: Tripp Umbach TOURO INFIRMARY Introduction Touro Infirmary (Touro) is New Orleans' only community based, not for profit,
Implementation Strategy For the 2016 Community Health Needs Assessment North Texas Zone 2
 For the 2016 Community Health Needs Assessment North Texas Zone 2 Baylor Emergency Medical Center at Murphy Baylor Emergency Medical Center at Aubrey Baylor Emergency Medical Center at Colleyville Baylor
Ambulatory-care-sensitive admission rates: A key metric in evaluating health plan medicalmanagement effectiveness
 Milliman Prepared by: Kathryn Fitch, RN, MEd Principal, Healthcare Management Consultant Kosuke Iwasaki, FIAJ, MAAA Consulting Actuary Ambulatory-care-sensitive admission rates: A key metric in evaluating
STEUBEN COUNTY HEALTH PROFILE
 STEUBEN COUNTY HEALTH PROFILE 2017 ABOUT THE REPORT The purpose of this report is to provide a summary of health data specific to Steuben County. Where possible, benchmarks have been given to compare county
LIVINGSTON COUNTY HEALTH PROFILE. Finger Lakes Health Systems Agency, 2017
 LIVINGSTON COUNTY HEALTH PROFILE Finger Lakes Health Systems Agency, 2017 About the Report The purpose of this report is to provide a summary of health data specific to Livingston County. Where possible,
Chronic Disease Surveillance and Office of Surveillance, Evaluation, and Research
 Chronic Disease Surveillance and Office of Surveillance, Evaluation, and Research Potentially Preventable Hospitalizations Program 2015 Annual Meeting Nimisha Bhakta, MPH September 29, 2015 Presentation
ONTARIO COUNTY HEALTH PROFILE. Finger Lakes Health Systems Agency, 2017
 ONTARIO COUNTY HEALTH PROFILE Finger Lakes Health Systems Agency, 2017 About the Report The purpose of this report is to provide a summary of health data specific to Ontario County. Where possible, benchmarks
Community Performance Report
 : Wenatchee Current Year: Q1 217 through Q4 217 Qualis Health Communities for Safer Transitions of Care Performance Report : Wenatchee Includes Data Through: Q4 217 Report Created: May 3, 218 Purpose of
CER Module ACCESS TO CARE January 14, AM 12:30 PM
 CER Module ACCESS TO CARE January 14, 2014. 830 AM 12:30 PM Topics 1. Definition, Model & equity of Access Ron Andersen (8:30 10:30) 2. Effectiveness, Efficiency & future of Access Martin Shapiro (10:30
2016 Keck Hospital of USC Implementation Strategy
 2016 Keck Hospital of USC Implementation Strategy INTRODUCTION Keck Hospital of USC is a private, nonprofit 411-bed acute care hospital staffed by the faculty at the Keck School of Medicine of the University
CHEMUNG COUNTY HEALTH PROFILE. Finger Lakes Health Systems Agency, 2017
 CHEMUNG COUNTY HEALTH PROFILE Finger Lakes Health Systems Agency, 2017 About the Report The purpose of this report is to provide a summary of health data specific to Chemung County. Where possible, benchmarks
2016 Community Health Needs Assessment. Kaiser Foundation Hospital Fontana/Ontario License #
 2016 Community Health Needs Assessment Kaiser Foundation Hospital Fontana/Ontario License #240000159 To provide feedback about this Community Health Needs Assessment, email CHNA-communications@kp.org Approved
Community Health Needs Assessment: St. John Owasso
 Community Health Needs Assessment: St. John Owasso IRC Section 501(r) requires healthcare organizations to assess the health needs of their communities and adopt implementation strategies to address identified
Union County Community Health Needs Assessment
 Community Health Needs Assessment November 2007 This page is intentionally left blank Community Health Needs Assessment November 2007 Health Department Needs Assessment Committee Winifred M. Holland, MPH,
Model Community Health Needs Assessment and Implementation Strategy Summaries
 The Catholic Health Association of the United States 1 Model Community Health Needs Assessment and Implementation Strategy Summaries These model summaries of a community health needs assessment and an
CALIFORNIA HEALTHCARE FOUNDATION. Medi-Cal Versus Employer- Based Coverage: Comparing Access to Care JULY 2015 (REVISED JANUARY 2016)
") CALIFORNIA HEALTHCARE FOUNDATION Medi-Cal Versus Employer- Based Coverage: Comparing Access to Care JULY 2015 (REVISED JANUARY 2016) Contents About the Authors Tara Becker, PhD, is a statistician at the
CALIFORNIA HEALTHCARE FOUNDATION Medi-Cal Versus Employer- Based Coverage: Comparing Access to Care JULY 2015 (REVISED JANUARY 2016) Contents About the Authors Tara Becker, PhD, is a statistician at the
Community Health Needs Assessment 2016
 Community Health Needs Assessment 2016 OSF ST. FRANCIS HOSPITAL & MEDICAL GROUP DELTA COUNTY CHNA 2016 Delta County 2 TABLE OF CONTENTS Executive Summary... 3 Introduction... 5 Methods... 6 Chapter 1.
Community Health Needs Assessment. Implementation Plan FISCA L Y E AR
 Community Health Needs Assessment Implementation Plan FISCA L Y E AR 2 0 1 5-2 0 1 8 Table of Contents: I. Background 1 II. Areas of Priority 2 a. Preventive Care and Chronic Conditions b. Community Health
Implementation Strategy Report for Community Health Needs
 2013 Implementation Strategy Report for Community Health Needs Kaiser Foundation Hospital WALNUT CREEK License #140000290 Kaiser Foundation Hospitals Community Health Needs Assessment (CHNA) Implementation
Introduction. Background. Service Area Description/Determination
 Introduction UC Davis Medical Center, part of the UC Davis Health System, is a comprehensive academic medical center where clinical practice, teaching and research converge to advance human health. Centers
Addressing Low Health Literacy to Achieve Racial and Ethnic Health Equity
 Hedge Health Funds 2/28/04 October 2009 Addressing Low Health to Achieve Racial and Ethnic Health Equity Anne Beal, MD, MPH President Aetna Foundation, Inc. Minorities Are More Likely to Have Diabetes
Findings Brief. NC Rural Health Research Program
 Safety Net Clinics Serving the Elderly in Rural Areas: Rural Health Clinic Patients Compared to Federally Qualified Health Center Patients BACKGROUND Andrea D. Radford, DrPH; Victoria A. Freeman, RN, DrPH;
EXECUTIVE SUMMARY... Page 3. I. Objectives of a Community Health Needs Assessment... Page 9. II. Definition of the UPMC Mercy Community...
 June 30, 2016 3 TABLE OF CONTENTS EXECUTIVE SUMMARY... Page 3 I. Objectives of a Community Health Needs Assessment... Page 9 II. Definition of the UPMC Mercy Community... Page 10 III. Methods Used to Conduct
Southwest General Health Center
 Southwest General Health Center Community Health Needs Assessment Executive Summary July 2016 Southwest General Health Center CHNA Executive Summary Introduction Southwest General Health Center, a 358-bed
Updated validation of AHRQ Prevention Quality Indicators in the USA
 Updated validation of AHRQ Prevention Quality Indicators in the USA Patrick S. Romano, MD MPH UC Davis Center for Healthcare Policy and Research Organization for Economic Cooperation and Development October
METHODOLOGY FOR INDICATOR SELECTION AND EVALUATION
 CHAPTER VIII METHODOLOGY FOR INDICATOR SELECTION AND EVALUATION The Report Card is designed to present an accurate, broad assessment of women s health and the challenges that the country must meet to improve
Methodist McKinney Hospital Community Health Needs Assessment Overview:
 Methodist McKinney Hospital Community Health Needs Assessment Overview: 2017-2019 October 26, 2016 Prepared by MHS Planning CHNA Requirement: Overview In order to maintain tax exempt status, the Affordable
Licensed Nurses in Florida: Trends and Longitudinal Analysis
 Licensed Nurses in Florida: 2007-2009 Trends and Longitudinal Analysis March 2009 Addressing Nurse Workforce Issues for the Health of Florida www.flcenterfornursing.org March 2009 2007-2009 Licensure Trends
Washington County Public Health
 Washington County Public Health Strategic Plan 2012-2016 Message from the Division Manager I am pleased to present the Washington County Public Health Division s strategic plan for fiscal years 2012 to
A Battelle White Paper. How Do You Turn Hospital Quality Data into Insight?
 A Battelle White Paper How Do You Turn Hospital Quality Data into Insight? Data-driven quality improvement is one of the cornerstones of modern healthcare. Hospitals and healthcare providers now record,
Community Health Needs Assessment. And. Community Health Strategic Plan
 Community Health Needs Assessment And Community Health Strategic Plan June 30, 2013 TABLE OF CONTENTS EXECUTIVE SUMMARY... Page 3 I. Objectives of a Community Health Needs Assessment... Page 7 II. Definition
Collaborative Activation of Resources and Empowerment Services Building Programs to Fit Patients vs. Bending Patients to Fit Programs
 Organization: Solution Title: Calvert Memorial Hospital Calvert CARES: Collaborative Activation of Resources and Empowerment Services Building Programs to Fit Patients vs. Bending Patients to Fit Programs
Carthage Area Hospital, Inc.
 Carthage Area Hospital, Inc. 1. Mission: Carthage Area Hospital provides quality comprehensive healthcare services in a community setting. 2. Service Area: Located in Northern New York, Carthage Area Hospital
DoDEA Seniors Postsecondary Plans and Scholarships SY
 DoDEA Seniors Postsecondary Plans and Scholarships SY 2011 12 Department of Defense Education Activity (DoDEA) Research and Evaluation Branch Ashley Griffin, PhD D e p a r t m e n t o f D e f e n s e E
Community Health Needs Assessment and Implementation Strategy
 Community Health Needs Assessment and Implementation Strategy St. Luke s Lakeside Hospital October 29, 2013 The for the St. Luke s Lakeside Hospital were conducted and developed between April 22 and October
Methodist Hospital of Sacramento Community Health Needs Assessment 2013 Community Benefit Implementation Plan
 Methodist Hospital of Sacramento 2013 Community Health Needs Assessment 2013 Community Benefit Implementation Plan Table of Contents I. 2013 Methodist Hospital of Sacramento Community Health Needs Assessment
Appendix A Registered Nurse Nonresponse Analyses and Sample Weighting
 Appendix A Registered Nurse Nonresponse Analyses and Sample Weighting A formal nonresponse bias analysis was conducted following the close of the survey. Although response rates are a valuable indicator
Community Health Needs Assessment Implementation Strategy Adopted by St. Vincent Charity Medical Center Board of Directors on April 5, 2017
 St. Vincent Charity Medical Center Community Health Needs Assessment Implementation Strategy Adopted by St. Vincent Charity Medical Center Board of Directors on April 5, 2017 Introduction In 2016, St.
Leveraging the Community Health Needs Assessment Process to Improve Population Health: Lessons Learned from Kaiser Permanente
 Leveraging the Community Health Needs Assessment Process to Improve Population Health: Lessons Learned from Kaiser Permanente Association for Community Health Improvement (ACHI) 2015 Conference What We
2013 Community Health Needs Assessment-Lakewood Hospital
 2013 Community Health Needs Assessment-Lakewood Hospital Founded in 1907, Lakewood Hospital is an acute care facility with 263 staffed beds offering advanced medical and surgical care, sophisticated technology,
Maximizing the Community Health Impact of Community Health Needs Assessments Conducted by Tax-exempt Hospitals
 Maximizing the Community Health Impact of Community Health Needs Assessments Conducted by Tax-exempt Hospitals Consensus Statement from American Public Health Association (APHA), Association of Schools
Inpatient Experience Survey 2012 Research conducted by Ipsos MORI on behalf of Great Ormond Street Hospital
 1 Version 2 Internal Use Only Inpatient Experience Survey 2012 Research conducted by Ipsos MORI on behalf of Great Ormond Street Hospital Table of Contents 2 Introduction Overall findings and key messages
Module 3 Identifying Health Problems
 Slide 1: Title Slide Module 3 Thank you for joining us for Module 3:. Now that we have defined our community, it s time to identify its priority health problems. Slide 2: Disclosures for Continuing Medical
Community Health Needs Assessment 2016
 Community Health Needs Assessment 2016 SAINT JAMES HOSPITAL known as OSF SAINT JAMES - JOHN W. ALBRECHT MEDICAL CENTER LIVINGSTON COUNTY CHNA 2016 Livingston County 2 TABLE OF CONTENTS Executive Summary...
TECHNICAL ASSISTANCE GUIDE
 TECHNICAL ASSISTANCE GUIDE COE DEVELOPED CSBG ORGANIZATIONAL STANDARDS Category 3 Community Assessment Community Action Partnership 1140 Connecticut Avenue, NW, Suite 1210 Washington, DC 20036 202.265.7546
2016 Survey of Michigan Nurses
 2016 Survey of Michigan Nurses Survey Summary Report November 15, 2016 Office of Nursing Policy Michigan Department of Health and Human Services Prepared by the Michigan Public Health Institute Table of
Community Analysis Summary Report for Clinical Care
 Community Analysis Summary Report for Clinical Care BACKGROUND ABOUT THE HEALTHY COMMUNITY STUDY The Rockford Health Council (RHC) exists to build and improve community health in the region. To address
Demographic Profile of the Officer, Enlisted, and Warrant Officer Populations of the National Guard September 2008 Snapshot
 Issue Paper #55 National Guard & Reserve MLDC Research Areas Definition of Diversity Legal Implications Outreach & Recruiting Leadership & Training Branching & Assignments Promotion Retention Implementation
St. Barnabas Hospital, Bronx NY [aka SBH Health System]
![St. Barnabas Hospital, Bronx NY [aka SBH Health System]](/thumbs/74/70151677.jpg "St. Barnabas Hospital, Bronx NY [aka SBH Health System]") St. Barnabas Hospital, Bronx NY [aka SBH Health System] NYS 2016 Community Health Assessment and Improvement Plan and Community Service Plan The Service area covered by this work plan are the NYC South
St. Barnabas Hospital, Bronx NY [aka SBH Health System] NYS 2016 Community Health Assessment and Improvement Plan and Community Service Plan The Service area covered by this work plan are the NYC South
1A) National-level Data Examples: Free or Inexpensive NHANES - National Health and Nutrition Examination Survey (NHANES). .
 National-level Data Examples: Free or Inexpensive NHANES - National Health and Nutrition Examination Survey (NHANES). .") 1A) National-level Data Examples: Free or Inexpensive NHANES - National Health and Nutrition Examination Survey (NHANES). Selected diseases and conditions including those undiagnosed or undetected - Nutrition
1A) National-level Data Examples: Free or Inexpensive NHANES - National Health and Nutrition Examination Survey (NHANES). Selected diseases and conditions including those undiagnosed or undetected - Nutrition
Texas Health Presbyterian Hospital Denton Community Health Needs Assessment: Implementation Strategy Report
 Texas Presbyterian Hospital Denton 2016 Needs Assessment: Implementation Strategy Report Implementation Strategy Outline 2 Report Contents Background About the Organizations CHNA Overview Implementation
Outpatient Experience Survey 2012
 1 Version 2 Internal Use Only Outpatient Experience Survey 2012 Research conducted by Ipsos MORI on behalf of Great Ormond Street Hospital 16/11/12 Table of Contents 2 Introduction Overall findings and
NCQA s Patient-Centered Medical Home (PCMH) 2011 Standards 11/21/11
 2011 Standards 11/21/11") NCQA s Patient-Centered Medical Home (PCMH) 2011 Standards 11/21/11 28 PCMH 1: Enhance Access and Continuity PCMH 1: Enhance Access and Continuity 20 points provides access to culturally and linguistically
NCQA s Patient-Centered Medical Home (PCMH) 2011 Standards 11/21/11 28 PCMH 1: Enhance Access and Continuity PCMH 1: Enhance Access and Continuity 20 points provides access to culturally and linguistically
Suicide Among Veterans and Other Americans Office of Suicide Prevention
 Suicide Among Veterans and Other Americans 21 214 Office of Suicide Prevention 3 August 216 Contents I. Introduction... 3 II. Executive Summary... 4 III. Background... 5 IV. Methodology... 5 V. Results
Prepared for North Gunther Hospital Medicare ID August 06, 2012
 Prepared for North Gunther Hospital Medicare ID 000001 August 06, 2012 TABLE OF CONTENTS Introduction: Benchmarking Your Hospital 3 Section 1: Hospital Operating Costs 5 Section 2: Margins 10 Section 3:
Sutter Health Novato Community Hospital
 Sutter Health Novato Community Hospital 2016 2018 Implementation Strategy Responding to the 2016 Community Health Needs Assessment 180 Rowland Way, Novato CA 94945 FACILITY LICENSE #110000375 www.sutterhealth.org
HEDIS Ad-Hoc Public Comment: Table of Contents
 HEDIS 1 2018 Ad-Hoc Public Comment: Table of Contents HEDIS Overview... 1 The HEDIS Measure Development Process... Synopsis... Submitting Comments... NCQA Review of Public Comments... Value Set Directory...
Geiger Gibson / RCHN Community Health Foundation Research Collaborative. Policy Research Brief # 42
 Geiger Gibson Program in Community Health Policy Geiger Gibson / RCHN Community Health Foundation Research Collaborative Policy Research Brief # 42 How Has the Affordable Care Act Benefitted Medically
Colorado s Health Care Safety Net
 PRIMER Colorado s Health Care Safety Net The same is true for Colorado s health care safety net, the network of clinics and providers that care for the most vulnerable residents. The state s safety net
Community Health Needs Assessment & Implementation Strategy
 Community Health Needs Assessment & Implementation Strategy Fiscal Years 2014 2016 for Beth Israel Deaconess Hospital - Milton This report was prepared by: 95 Berkeley Street, Suite 208 Boston, MA 02116
Community Health Needs Assessment July 2015
 Community Health Needs Assessment July 2015 1 Executive Summary UNM Hospitals is committed to meeting the healthcare needs of our community. As a part of this commitment, UNM Hospitals has attended forums
TABLE OF CONTENTS. CHRISTUS Health Central Louisiana CHNA
 TABLE OF CONTENTS Figures... 3 Acknowledgements... 4 Executive Summary... 5 Introduction... 7 Methodology... 7 Advisory Committee... 8 Quantitative Indicators... 8 Key Informant Interview Protocol... 9
Evaluation of Health Care Homes:
 Division of Health Policy PO Box 64882 St. Paul, MN 55164-0882 651-201-3626 www.health.state.mn.us Evaluation of Health Care Homes: 2010-2012 Minnesota Department of Health Minnesota Department of Human
2017 SPECIALTY REPORT ANNUAL REPORT
 2017 SPECIALTY REPORT ANNUAL REPORT National Commission on Certification of Physician Assistants Table of Contents Message from the President... 3 About the Data Collection and Methodology...4 All Specialties....
2014 MASTER PROJECT LIST
 Promoting Integrated Care for Dual Eligibles (PRIDE) This project addressed a set of organizational challenges that high performing plans must resolve in order to scale up to serve larger numbers of dual
DELAWARE FACTBOOK EXECUTIVE SUMMARY
 DELAWARE FACTBOOK EXECUTIVE SUMMARY DaimlerChrysler and the International Union, United Auto Workers (UAW) launched a Community Health Initiative in Delaware to encourage continued improvement in the state
2012 Community Health Needs Assessment
 Indiana University Health Goshen 2012 Community Health Needs Assessment A Report on Implementation Strategies to Address Community Health Needs Summary Report Our Commitment to You We are here for you,
Achieving Health Equity After the ACA: Implications for cost, quality and access
 Achieving Health Equity After the ACA: Implications for cost, quality and access Michelle Cabrera, Research Director SEIU State Council April 23, 2015 SEIU California 700,000 Members Majority people of
Diversity & Disparities: A Benchmark Study of U.S. Hospitals.
 Diversity & Disparities: A Benchmark Study of U.S. Hospitals http://www.hpoe.org/diversity-disparities Contents Executive Summary...2 Survey Methods...4 Collection and Use of REAL Data...5 Cultural Competency
Cite as: LeVasseur, S.A. (2015) Nursing Education Programs Hawai i State Center for Nursing, University of Hawai i at Mānoa, Honolulu.
 Nursing Education Programs Hawai i State Center for Nursing, University of Hawai i at Mānoa, Honolulu.") Nursing Education Program Capacity 2012-2013 1 Written by: Dr. Sandra A. LeVasseur, PhD, RN Associate Director, Research Hawai i State Center for Nursing University of Hawai i at Mānoa, Honolulu, Hawai
Nursing Education Program Capacity 2012-2013 1 Written by: Dr. Sandra A. LeVasseur, PhD, RN Associate Director, Research Hawai i State Center for Nursing University of Hawai i at Mānoa, Honolulu, Hawai
Minnesota Statewide Quality Reporting and Measurement System: Quality Incentive Payment System
 Minnesota Statewide Quality Reporting and Measurement System: Quality Incentive Payment System JUNE 2015 DIVISION OF HEALTH POLICY/HEALTH ECONOMICS PROGRAM Minnesota Statewide Quality Reporting and Measurement
Center for State Health Policy
 Center for State Health Policy A Unit of the Institute for Health, Health Care Policy and Aging Research Opportunities for Better Care and Lower Cost: Data Book on Hospital Utilization and Cost in Camden
(For care delivered in 2008)
") (For care delivered in 2008) Report Preparation Directed By: Anne M Snowden, MPH, CPHQ Director of Performance Measurement and Reporting, MNCM Key Contributors: Angeline Carlson, PhD Director of Research,
(For care delivered in 2008) Report Preparation Directed By: Anne M Snowden, MPH, CPHQ Director of Performance Measurement and Reporting, MNCM Key Contributors: Angeline Carlson, PhD Director of Research,
Total Cost of Care Technical Appendix April 2015
 Total Cost of Care Technical Appendix April 2015 This technical appendix supplements the Spring 2015 adult and pediatric Clinic Comparison Reports released by the Oregon Health Care Quality Corporation
2016 Community Health Needs Assessment
 2016 Community Health Needs Assessment Approved by Marin General Hospital Board of Directors August 2, 2016 Marin County Community Health Needs Assessment ACKNOWLEDGEMENTS Many individuals and organizations
s n a p s h o t Medi-Cal at a Crossroads: What Enrollees Say About the Program
 s n a p s h o t Medi-Cal at a Crossroads: What Enrollees Say About the Program May 2012 Introduction Medi-Cal, which currently provides health and long term care coverage for more than 7.5 million Californians,
COMM T T DS A M T. o or ve Assess en y De oness e h Sys e O un y e h re, S. M ry s ea h n e y of Sou hwe ern n n n e orn s Foun on
 COMM T T DS A M T o or ve Assess en y De oness e h Sys e O un y e h re, S. M ry s ea h n e y of Sou hwe ern n n n e orn s Foun on P RODU CE D B Y HE ALT HY CO MMUNIT IES INSTIT UTE, OC TOB E R 201 5 WWW.
Navigating Standard 3.1
 Navigating Standard 3.1 Annette Mercurio, MPH, MCHES City of Hope Duarte, CA Close Up is One Way to View It It s Helpful to Enlarge Perspective Standard 3.1 Patient Navigation Process A patient navigation
=======================================================================
 ======================================================================= ----------------------------------------------------------------------- DEPARTMENT OF HEALTH AND HUMAN SERVICES Office of the Secretary
Survey of Nurses 2015
 Survey of Nurses 2015 Prepared by Public Sector Consultants Inc. Lansing, Michigan www.pscinc.com There are an estimated... 104,351 &17,559 LPNs RNs onehundredfourteenthousdfourhundredtwentyregisterednursesactiveinmichigan
COMMUNITY HEALTH NEEDS ASSESSMENT. TMC Hospital Hill
 COMMUNITY HEALTH NEEDS ASSESSMENT TMC Hospital Hill TABLE OF CONTENTS 1 2 Letter from CEO 3 Purpose of the Report 4 Mission and Vision of Organization 5 Service Area 7 Process to Determine Priority Needs
2016 Community Health Needs Assessment. Kaiser Foundation Hospital Roseville License #
 To provide feedback about this Community Health Needs Assessment, email CHNA communications@kp.org 2016 Community Health Needs Assessment Kaiser Foundation Hospital Roseville License #550001681 Approved