THE REPUBLIC OF UGANDA. Annual Health Sector Performance Report
|
|
|
- May Dixon
- 6 years ago
- Views:
Transcription


1 THE REPUBLIC OF UGANDA Annual Health Sector Performance Report Financial Year 2010/2011
2


3 Foreword The Annual Health Sector Performance Report for provides progress of the annual workplan as well as the overall health sector performance against the set targets for the Financial Year 2010/11. The 2010/11 annual report also marks the beginning of the Health Sector Strategic and Investment Plan 2010/ /15. It also reports on implementation progress against the sector priorities set at the 7 th National Health Assembly and the 16 th Joint Review Mission. The Government of Uganda recognizes the contribution of Health Development Partners, Civil Society, the Private Sector and all Ugandans in the achievement of the progress reported in the sector performance. The sector is committed to refocusing priorities to interventions aimed at making positive progress towards achieving the National Development Plan targets and Millennium Development Goals. This report coincides with the launching of the Monitoring and Evaluation Plan for the HSSIP 2010/ /15. The Monitoring and Evaluation Plan has been aligned to the Monitoring and Evaluation Strategy of the National Development Plan to regularly and systematically track progress of implementation of priority initiatives of the HSSIP and assess performance at all levels in accordance with the agreed objectives and performance indicators. The sector will continue to prioritize interventions defined in the Uganda National Minimum Health Care Package under a Sector-Wide Approach arrangement, so as to maximize gains from invested resources. This will further be supported by the International Health Partnerships, the Paris Declaration on Harmonization and Alignment and the Accra Agenda for Action and related initiatives. I wish to thank the Technical Working Groups, the Task force and Partners that compiled this report. For God and My Country Hon. Dr. Ondoa D.J Christine MINISTER OF HEALTH iii
4 iv


5 Dr. Christine Ondoa Minister of Health Dr. Richard Nduhura Minister of State (General Duties) v


6 Dr. Asuman Lukwago Ag: Permanent Secretary Dr. Ruth Aceng Director General Health Service Dr. Nathan Kenya- Mugisha Director Health Services Clinical and Community Health Dr. Isaac Ezati Director Health Services Planning and Development vi
7 Table of Contents Foreword... iii List of Tables... xi List of Figures... xiii Acronyms... xiv Executive Summary... xviii 1 CHAPTER ONE INTRODUCTION Background Vision, Mission, Goal and Strategic Objectives during the HSSIP 2010/ / Vision Mission Goal Strategic Objectives Projected Demographics for The framework for achieving Millennium Development Goals (MDGs), National Development Goals and HSSIP 2010/ / The Annual Health Sector Performance Report FY 2010/ The drafting process Sources of Information Overview of the report outline OVERALL PROGRESS AND PERFORMANCE Overall Summary of Progress towards NDP Indicators Overall Summary Progress towards MDG, JAF and HSSIP 2010/ /15 Indicators Health Impact Indicators Morbidity: Level and Trends Performance against lead indicators for HIV/AIDS, Malaria and TB vii
8 2.2 Health Services Coverage Coverage with Other Health Determinants Health Quality and Outputs Health Investments Benchmarking Uganda's progress relative to 11 peer countries Summary of the Financial Report 2010/11 FY Trends of the health sector funding (2000/ /11) Financial Performance for Local Governments (LGs) Summary Assessment of the Health System / Health Sector Support System Global Fund (GF) Supported Interventions 2010/ Global Alliance for Vaccines and Immunisation (GAVI) Progress 2010/ Health Partnerships Performance Decentralized Responses Progress made towards achieving international resolutions and obligations e.g. WHO, ECSA, IHP Local Government Performance District League Table Performance Service Delivery Hospital Performance Regional Referral Hospitals General Hospitals Functionality of HC IVs Assessment of Village Health Team (VHT) Functionality Conclusion viii
9 3 ANNEX Assessment of Performance against Planned Key Outputs in the MPS 2010/ The Compact for implementation of the HSSIP 2010/ / Delivery of the Uganda National Minimum Health Care Package (UNMHCP) Cluster 1: Health promotion, disease prevention, and community health initiatives Cluster 2: Maternal and Child Health Prevention and Control of Communicable Diseases Diseases Targeted for Elimination Prevention and Control of Non-communicable Conditions Integrated Health Sector Support Systems Human Resources for Health Health Infrastructure Development and Management Management of Essential Medicines and Supplies National Drug Authority Information for Decision Making Quality of Care Health Policy, Planning and Support Services Legal and Regulatory Framework Research Uganda National Health Research Organisation Natural Chemotherapeutics Research Institute (NCRI) Uganda Virus Research Institute (UVRI) Public Private Partnership for Health Health Services and Health Status in Recovery Areas Monitoring and Evaluation of Implementation of the HSSIP 2010/ / Data Quality report ix
10 3.7 Progress on Implementation of the Priority Actions of the 16 th Joint Review Mission Progress on Implementation of the Recommendations of the 7 th Annual Health Assembly Annual Epidemics Update July 2010 to June Development Partner Support Areas District League Table 2010/ x
11 List of Tables List of Tables Table 1: Demographic Information...2 Table 2: Performance against the 8 NDP indicators for the HSSIP 2010/ /15 Period...6 Table 3: Top ten causes of hospital based mortality for all ages in 2010/11 FY...9 Table 4: Top ten causes of morbidity among all ages from 2009/10 to 2010/11 FY...12 Table 5: Performance against selected HIV/AIDS Programme lead indicators...13 Table 6: Performance against selected Malaria Control Programme lead indicators...14 Table 7: Performance against the TB Programme Lead Indicators...14 Table 8: Performance for health services core indicators...15 Table 9: Performance for coverage for other health determinants and risk factors indicators during 2010/11 FY...17 Table 10: Performance for health system output (availability, access, quality, safety) indicators...18 Table 11: Performance for coverage for health investments and governance indicators...20 Table 12: Staffing Levels in the public sector filled by trained health personnel - October Table 13: Cadre: Population Ratio...22 Table 14: Rank for key health indicators for 12 countries, including Uganda (WHO, 2011)...24 Table 15: Government allocation to the Health Sector 2000/01 to 2010/ Table 16: Primary Health Care Grants FY 2000/ /11 in billions of Ug. Shillings...27 Table 17: Government of Uganda health sector budget performance for FY 2010/11 (excluding donor projects)...28 Table 18: Local Government Grant Performance for FY 2010/ Table 19: Financial Performance for Central Institutions and Referral Hospitals for FY 2010/11 (UGX Billion)...29 Table 20: Summary of performance by Vote Function...32 Table 21: Summary Matrix for monitoring progress of implementation of the Compact...34 Table 22: HPAC Institutional representatives attendance Jul 2010 Jun Table 23: Project Support to Local Governments...36 Table 24: Top 15 performing districts...42 Table 25: Bottom 15 performing districts...42 Table 26: District ranking for the top new districts...42 Table 27: District ranking for the bottom new districts...42 Table 28: District ranking for districts with regional/national referral hospitals...43 Table 29: District ranking for hard-to-reach districts...44 Table 30: District ranking for Peace Recovery and Development Plan (PRDP) districts...44 Table 31: District ranking by district population...45 Table 32: Staffing levels for top ten districts Table 33: Staffing Levels for Bottom ten districts.47 Table 34: Financial Performance for RRHs for FY 2010/11 (UGX Billions)...49 Table 35: Positions filled in Regional Referral Hospitals...50 Table 36: Overall performance for Regional Referral and Large PNFP Hospitals...51 Table 37: Key Hospital Outputs in RRHs and Large PNFP Hospitals...53 Table 38: Selected Efficiency Parameters RRHs and Large PNFP hospitals 2010/ Table 39: Summary of Efficiency Parameters RRHs and Large PNFP hospitals 2010/ xi
12 Table 40: Outputs from the General Hospitals FY 2010/ Table 41: Selected efficiency parameters for General Hospitals Table 42: HC IVs with 11 of the 11 functionality indicators Table 43: Provision of selected key health services by HC IVS Table 44: Progress in implementation of the Country Compact 2010/ /15 during 2010/11 FY Table 45: NUSAF2 support to Health Sector Table 46: District monthly reporting completeness rate and districts with poor completeness rate 166 Table 47: Facility reporting completeness rate and districts with poor completeness rate Table 48: Extreme and moderate outliers among data points for 2008/09 and 2010/11 for 4 indicators Table 49: Percentage difference between monthly data and end-of-year data at the national level, and districts with a large discrepancy Table 50: Consistency ratio for ANC1 at national level, and districts with very low and very high consistency ratios Table 51: Comparison of coverage rates from surveys and from facility reports Table 52: Top 15 and bottom 15 scoring districts based on ranking using adjusted district populations xii
13 List of Figures Figure 1: Under 5 Mortality trends in Uganda... 8 Figure 2: Trends in IP Mortality Figure 3: MMR Trends in Uganda Figure 4: Health facility-based maternal deaths in FY 2009/10 and 2010/ Figure 5: The Density of Health Personnel GOU and PNFP Figure 6: Uganda's progress benchmarked relative to the peer countries over time for the period 1990 to Figure 7: Trends in PHC Grant Allocations 2000/ / Figure 8: District population vs. total score Figure 9: Filled staff positions in RRHs Figure 10: Volume of Outputs Regional Referral and Large PNFP hospitals Figure 11: Trends in Caesarean Section and Blood transfusion Figure 12: Reported number of Stillbirths by month Figure 13: Vitamin A Supplementation among under fives Figure 14: Total average district league scores districts for Uganda and Karamoja region Figure 15: District league scores Karamoja Figure 16: National health facility data quality assessment: summary of results Figure 17: Trend in DTP3 coverage under 1 year of age (%), Uganda Figure 18: Comparison of HMIS and DHS coverage rates for institutional deliveries and ANC four or more visits Figure 19: DPT3 Coverage by district FY2010/11... Figure 20: Deliveries in Government and PNFP facilities by district FY2010/11... Figure 21: OPD utilization by district FY 2010/ Figure 22: HIV testing in infants born of HIV positive women by district FY 2010/11... Figure 23: Latrine coverage in households by districts FY 2010/11... Figure 24: Pregnant women receiving 2nd dose of Fansidar for IPT by district FY 2010/11... Figure 25: Pregnant women attending ANC 4th visit by district FY 2010/ Figure 26: Approved posts that are filled by district FY 2010/ xiii
14 Acronyms ACT AHSPR AIDS ANC ART ARVs BFHI CAO CB-DOTS CCM CDC CDD CDP CDR CEmoC CPR CPT CSO CYP DHO DHMT DLT DOTS DPs DPT EAC ECSA-HC EID EMHS EmOC FP FY GAVI GBV GF GH GoU HAART HC HCI USAID Artemisinin Combination Therapies Annual Health Sector Performance Report Acquired Immuno-Deficiency Syndrome Ante Natal Care Anti-retroviral Therapy Antiretroviral Drugs Baby Friendly Health Initiative Chief Administrative Officer Community Based TB Directly Observed Treatment Country Coordinating Mechanism Centres for Disease Control Control of Diarrhoeal Diseases Child Days Plus Case Detection Rate Comprehensive Emergency Obstetric Care Contraceptive Prevalence Rate Cotrimoxazole Prophylaxis Civil Society Organization Couple Years of Protection District Health Officer District Health Management Team District League Table Directly Observed Treatment, short course (for TB) Development Partners Diphtheria, Pertussis (whooping cough) and Tetanus vaccine East African Community East Central and Southern Africa - Health Community Early Infant Diagnosis Essential Medicines and Health Supplies Emergency Obstetric Care Family Planning Financial Year Global Alliance for vaccines and Immunization Gender Based Violence Global Fund General Hospital Government of Uganda Highly Active Anti-Retroviral Therapy Health Centre Health Care Improvement Project xiv
15 HCT HDP HIV HMBF HMIS HPAC HRH HSD HSSIP HSSP ICU IDSR IEC IMAM IMCI IPT IRS ITNs JAF JBSF JICA JMS JRM KDS LG LLINs MCH MDGs MDR MMR MOFPED MoGLSD MOH MOLG MOPS MOPS MOU MTEF NCD NCRI HIV/AIDS Counselling and Testing Health Development Partners Human Immuno-Deficiency Virus Home Based Management of Fever Health Management Information System Health Policy Advisory Committee Human Resources for Health Health Sub-Districts Health Sector Strategic Investment Plan Health Sector Strategic Plan Intensive Care Unit Integrated Disease Surveillance and Response Information Education and Communication Integrated Management of Acute Malnutrition Integrated Management of Childhood Illness Intermittent Presumptive Treatment for malaria Indoor Residual Spraying Insecticide Treated Nets Joint Assessment Framework Joint Budget Support Framework Japan International Cooperation Agency Joint Medical Stores Joint Review Mission Kampala Declaration on Sanitation Local Government Long Lasting Insecticide Treated Nets Maternal and Child Health Millennium Development Goals Multi-drug Resistant Maternal Mortality Ratio Ministry of Finance, Planning and Economic Development Ministry of Gender, Labour and Social Development Ministry Of Health Ministry of Local Government Ministry of Planning and Survey Ministry of Public Service Memorandum of Understanding Medium Term Expenditure Framework Non Communicable Diseases National Chemotherapeutic Research Institute xv
16 NDA NGOs NHA NHP NMCP NMS NTDs NTLP OPD OPM OPV ORS ORT PHA PHAST PHC PLWHA PMTCT PNFP PPPH PRDP RH RRH RUTF SHSSPP SLD SMC SMER SP STI SUO SWAP TB TMC TSR TT TWG UACP UBOS UBTS UCI National Drug Authority Non-Governmental Organisations National Health Assembly National Health Policy National Malaria Control Programme National Medical Stores Neglected Tropical Diseases National Tuberculosis and Leprosy Control Program Out Patients Department Office of the Prime Minister Oral Polio Vaccine Oral Rehydration Salt Oral Rehydration Therapy People with HIV/AIDS Participatory Hygiene and Sanitation Transformation Primary Health Care People with HIV/AIDS Prevention of Mother to Child Transmission Private Not for Profit Public Private Partnership for Health Peace Recovery and Development Plan Reproductive Health Regional Referral Hospital Ready to Use Foods Support to the Health Sector Strategic Plan Project Second Line Drugs Senior Management Committee Supervision, Monitoring, Evaluation and Research Sulfadoxine/Pyrimethamine Sexually Transmitted Infection Standard unit of Output Sector-Wide Approach Tuberculosis Top Management Committee Treatment Success Rate Tetanus Toxoid Technical Working Group Uganda Aids Control Program Uganda Bureau of Statistics Uganda Blood Transfusion Services Uganda Cancer Institute xvi
17 UDHS UGFATM UHSSP UHI UNEPI UNFPA UNHRO UNICEF UNMHCP UVRI VHT WHO Uganda Demographic and Health Survey Uganda Global Fund for AIDS, TB and Malaria Uganda Health Systems Strengthening Project Uganda Heart Institute Uganda Expanded Programme on Immunization United Nations Fund for Population Activities Uganda National Health Research Organisation United Nations Children s Fund Uganda National Minimum Health Care Package Uganda Virus Research Institute Village Health Teams World Health Organisation xvii
18 Executive Summary This Annual Health Sector Performance Report marks the beginning the Health Sector Strategic and Investment Plan (HSSIP) 2010/ /15. The report mainly focuses on the progress of the annual workplan as well as overall sector performance against the targets set for the FY 2010/11, the first year of the HSSIP 2010/ /15 but also provides progress in relation to performance of the previous years. The development process of the AHSPR 2010/11 was widely consultative with stakeholders from all departments of the Ministry of Health (MoH), Development Partners (DPs) and Implementing Partners. The overall coordination and technical support was provided by a MoH Task Force (TF). Background This Annual Health Sector Performance Report is the first report for the Health Sector Strategic and Investment Plan (HSSIP) 2010/ /15. The delivery of the Uganda National Minimum Health Care Package is central to the implementation of the HSSIP and the attainment of the sector goals and objectives. This report focuses on the progress of the annual workplan, as well as the overall sector performance against the targets set for the FY 2010/11, the first year of the HSSIP 2010/ /15. The development process of the AHSPR 2010/11 was widely consultative with involvement from all departments of the Ministry of Health (MoH), Development Partners (DPs) and Implementing Partners. The overall coordination and technical support was provided by a MoH Task Force. Data The report focuses on the core indicators of the monitoring and evaluation plan of HSSIP, which are linked with the monitoring of the National Development Plan and international initiatives such as the MDG. The report is based on the health facility and district reports gathered as part of the HMIS, administrative sources and programme data, including both quantitative and qualitative data. A thorough analysis of the quality of the HMIS data shows that overall reporting can be considered fairly reliable, but that there is considerable variation between districts which affects the league tables. Coverage estimates based on the HMIS data use population projections to estimate the target populations and should be considered as only indicative as the last census was conducted in No new household survey data were available for this performance report. No separate verification of data quality and facility service readiness (e.g. medicines availability) was conducted. National progress and performance Inputs and processes: money, policies and workforce The total public health expenditure per capita decreased from UGX 24,423 (US$11.1) in 2009/10 to UGX 20,765 (US$ 9.4) in 2010/11, mainly because of a decrease in externally contributions which only constituted 14% of total public health expenditure in 2010/11, xviii
19 compared with 39% in the three preceding years. The government expenditure on health as a percent of total government expenditure remained around 9%, as it has been for the last decade, well off from the Abuja target of 15% but on target for HSSIP 2010/11 (8.8%). The amount spent on health, however, increased because of economic growth. Limiting the large fluctuations in external funding for health and ways to increase the government contribution should be priority areas for planning. There was a remarkable increase in the proportion of villages/wards with trained village health teams (VHTs), according to a survey in 2010, in line with the expansion to a further 18 districts. Medical professionals however are well below the WHO minimum target of 23 health workers per 10,000 population: Uganda had 15 health workers per 10,000, including 0.36 doctors, 0.71 clinical officers, 2.8 nurses and 1.4 midwives. The health sector efforts in ensuring attainment and maintenance of an adequately sized, equitably distributed and appropriately skilled workforce were hampered by the ban on recruitment as a result of a limited wage will. Overall, 56% of public sector positions were filled, short of the 60% target for 2010/11 FY. The shortfall is greatest in district health units where 52% of 27,180 positions were filled. There is need to advocate for increasing staffing levels for the entire critical cadre for effective and efficient utilisation of health investments. Among the central level vote functions, the Support to Health Sector Strategic Plan Project performed best against planned outputs in the MPS (score 80%), followed by pharmaceutical and other supplies (75%) and sector monitoring and quality assurance (60%). The majority of the vote functions had performance moderate performance (40 80%) and the major challenges were related to procurement for infrastructure development projects, inadequate funding and delayed release of funds for other operational activities. The Country Compact 2010/ /15, signed by MoH, HDPs, CSOs and the private sector, has 14 key planned outputs in the areas of planning and budgeting, monitoring programme implementation and performance, and policy guidance and monitoring. Overall, only 4 of the 14 outputs received good marks (>80% implementation), 4 moderate (40-80%) and 6 were rated as poor (<40%). The performance was poorest in planning and budgeting and adequate in policy guidance and monitoring. There is need to establish an efficient M&E system for the Compact and Senior Management Structures. Considerable progress made towards achieving international resolutions and obligations specifically East Central and Southern Africa Health Community. With the recruitment of a Global Desk Officer, the sector expects better monitoring and documentation. Service outputs Drug availability improved significantly, with 43% of facilities reporting no stock out of the six tracer drugs in the first and last quarters of 2010/11, up from 21% in the preceding year. The proportion of Health Centre IV to provide comprehensive emergency obstetric care (blood transfusion and Caesarian section) remained low: 24% compared with 23% in the year before. TB treatment success rates, an indicator of the quality of care, increased slightly from 66% to xix
20 69%, but fell short of the 75% target of FY 2010/11. Access to HIV counseling and testing services remained the same (38% of 4,980 facilities), but the percent of facilities offering PMTCT services increased from 23% in FY 2009/10 to 32% in FY 2010/11. Outpatient department (OPD) service utilization is an indicator of accessibility of the services. There were 34.9 million OPD visits in FY 2010/11, compared with 36.8 million in the year before. The average was 1.1 OPD visit per person per year (target 1.0 visit). The top three diagnoses for OPD visits are malaria (36% of all visits), common cold or cough (19%) and intestinal worms (5%), which was very similar to the years before. Service coverage and determinants There was varied performance in the health services coverage indicators, but overall trends were positive. More women delivered in health facilities (39%, up from 33% in 2009/10), but fewer pregnant women made four antenatal care visits (32%, down from 47%) and received IPT 2 for malaria risk reduction (43%, down from 47%). There is need to investigate the reversal or stagnation of trends in the maternal health services. Immunization coverage with pentavalent vaccine was 90%, up from 76% in the preceding year, and so was measles (85%, up from 72%), most likely due to vaccination campaigns in many districts and strengthening of the delivery system. Contraceptive use, measured by Couple Years of Protection and the UBOS panel survey, also increased to 33% in No reliable facility data were available to ascertain trends in coverage of HIV services, except that almost all HIV positive people were initiated on co-trimoxazole (95%). TB case notifications increased from 43,335 in FY 2009/10 to 45,546 in FY 2010/11, but it was estimated that case detection rate remained low at 54%. The proportion of TB patients tested for HIV increased from 72% to 81% and the percent HIV-TB patients started on CPT increased from 86% to 90%, and both indicators were on FY 2010/11 target. Performance assessment for coverage for other health determinants and risk factors is not conclusive for the year under review. Information is available for only one (% of household with latrine which improved from 69.7% to 71%) out of four indicators. Health impact There are no new child and maternal mortality data available until the UDHS 2011 results are out. The maternal mortality reporting system is currently inadequate, but figures suggest indicate that maternal mortality in hospitals and health centres, where 39% of deliveries take place, is at least 200 per 100,000 live births, and national rates should be considerably higher. Figures from the many hospitals are currently high and it should be a priority to develop a high quality maternal mortality surveillance and response system. Malaria is the leading cause of mortality among all ages in hospitals, causing 27% of 5,331 deaths, followed by anaemia (12%) and pneumonia (11%). A comparison with 11 peer countries in the African region shows that Uganda's performance on coverage and health outcome indicators is about average for the group. Uganda does better xx
21 than average on inputs (money, health workers), less than average on coverage of MCH interventions, and about average on mortality. In terms of progress during Uganda made average or slightly better than average progress on most indicators. Local government performance Local Government performance assessment was done using an improved set of 12 indicators (three management and nine access/quality/coverage indicators) for the 112 districts. In general, there is better performance for the coverage indicators compared to the management indicators. Kampala remains the top ranking district this year, followed by Bushenyi and Kabarole. Bulambuli, a new district, is at the bottom of the league table. The national score for the league table index is 58%; 3 rd dose Pentavalent vaccine coverage 90%, OPD utilization 1.0; HIV testing in infants born to HIV positive mothers 30%; latrine coverage 71%; IPT 2 43%; 4 th ANC visit 32%; TB cure rate 77%; approved posts filled 52%; HMIS reporting 77%, completeness 94%, timeliness 84%; planned DHMT meetings held 10%; medicines orders submitted timely 47%. The 32 new districts had lower performance scores compared to existing districts, with Kyegegwa being the highest scoring new district ranked at 48 th (out of 111). All new districts scored lower than the national average. Hospital and HC IV performance There are 13 Regional Referral Hospitals and 4 large PNFP hospitals. Masaka and Mbarara RRH data were not available for analysis. Overall, 76% of the positions were filled. The lowest rates were for pharmacists (40%) and doctors (44%). Funds were released by the government to the hospitals according to the budget (104%), with the exception of Moroto RRH (66%). Most measures indicate high utilization: 86% average bed occupancy (93% in 2009/10), 5.0 days average length of stay and 1,802 standard units of output (SUO, an index of workload) per staff among the regional referral and large PNFP hospitals. The SUO per staff ranges from 742 in Mengo RRH to 2,280 in Soroti RRH. The 78 reporting general hospitals also received government funds in accordance with the budget (98%). Reporting of staffing was poor but in a sample of 26 public general hospitals on average only 55% of the norm of 190 positions were filled. Bed occupancy rates were 69%, down from 74% in 2009/10, while the average length of stay increased from 4.6 to 5.0 days. The SUO per staff increased from 1,487 to 1,577, slightly lower than the RRHs. From the information the average for three outputs are down compared to last year (2009/10), inpatient, antenatal and immunization, while the outpatients, deliveries and major operations, including cesarean sections have gone up. Of deliveries, 24% were done by Cesarean section. The average outputs from each HC IV for outpatient, inpatient, deliveries and ART services, were 21,028; 1,864; 1,996 and 292 respectively. Compared to 2009/10 many service utilization indicators went down in 2010/11 except, deliveries, HIV counseling and testing, PMTCT and Dental service utilization. The bed occupancy rate in 2010/11 declined compared to the year before down from 43% to 38%, in addition there was a reduction in average length of stay xxi
22 from 3 days in 2009/10 to 2.3 days. There were on average of 1,864 admissions in 2010/11. The case fatality rate remained the same as the year before, 0.7%. Only 24% of the HC IVs were functional in 2010/11 an increase from 23% found in 2009/10. Overall, the larger health facilities - hospitals and health centres IV - play a key role in the provision of health services in Uganda. The facilities received resources according to budget but are understaffed. The performance of the larger health facilities appears adequate in terms of efficiency (bed occupancy, length of stay, SUO/staff) but there are important differences between hospitals and HC IVs that need to be taken into account in allocating resources. No data on the quality of care were available, and it will be important to complement the access and efficiency data with such data in the coming years. In addition, reporting needs to be improved urgently, starting with maternal mortality. xxii
23 1 CHAPTER ONE INTRODUCTION 1.1 Background The Ministry of Health (MOH) has been producing an Annual Health Sector Performance Report (AHSPR) since The annual report is an institutional requirement produced to highlight progress, challenges, lessons learnt and propose way of moving the health sector forward. This AHSPR for the Financial Year (FY) 2010/11 marks the beginning of the Health Sector Strategic and Investment Plan (HSSIP) 2010/ /15. The report mainly focuses on the progress of the annual workplan as well as overall health sector performance against the targets set for the FY 2010/11, the first year of the HSSIP 2010/ /15. It takes into consideration the annual performance in terms of 1) The effectiveness, responsiveness and equity in the health care delivery system 2) How well the integrated support systems have been strengthened as well as the status of programme implementation and overall development mechanisms. The sector performance will be deliberated upon at the 17 th Joint Review Mission (JRM) in October Vision, Mission, Goal and Strategic Objectives during the HSSIP 2010/ / Vision A healthy and productive population that contributes to socio-economic growth and national development Mission To provide the highest possible level of health services to all people in Uganda through delivery of promotive, preventive, curative, palliative and rehabilitative health services at all levels Goal The overall goal for the Health Sector during HSSIP 2010/ /15 is To attain a good standard of health for all people in Uganda in order to promote a healthy and productive life Strategic Objectives To achieve this goal, the health sector shall focus on achieving universal coverage with quality health, and health related services through addressing the following strategic objectives. 1. Scale up critical interventions for health, and health related services, with emphasis on vulnerable populations. 2. Improve the levels, and equity in access and demand to defined services needed for health. 3. Accelerate quality and safety improvements for health and health services through implementation of identified interventions. 1
24 4. Improve on the efficiency, and effectiveness of resource management for service delivery in the sector. 5. Deepen stewardship of the health agenda, by the Ministry of Health. 1.3 Projected Demographics for 2010 The projected population demographics for the period under review are based on the population census of 2002 and annual projections by Uganda Bureau of Statistics (UBOS). Table 1: Demographic Information Demographic Variables Proportion Population Total Population 100% 31,784,600 Children below 18 years 56% 17,799,376 Adolescents (10 24 years) 34.7% 11,029,256 Orphans (for children below 18 years) 10.9% 1,940,132 Infants below one year 4.3% 1,366,738 Children below 5 years 19.5% 6,197,997 Women of child bearing age (15 49 years) 23% 7,310,458 Women expected to become pregnant 5% 1,589,230 UBOS 2010 Midyear Projection 1.4 The framework for achieving Millennium Development Goals (MDGs), National Development Goals and HSSIP 2010/ /15 The delivery of the Uganda National Minimum Health Care Package (UNMHCP) is central to the implementation of the HSSIP 2010/ /15 and the attainment of the sector goals and objectives. The NMHCP is aligned to the Second National Health Policy (NHP II) and National Development Plan (NDP) 2010/ /15, the overarching national policy and strategic framework governing the health sector in Uganda. Additionally, the UNMHCP core strategies are aligned to the Millennium Development Goals (MDGs), to which Uganda is a signatory. The NDP (through sector plans) and the HSSIP 2010/ /15 are being implemented in a sector-wide approach (SWAp), which addresses the health sector as a whole in planning and management, and in resource mobilization and allocation. The AHSPR 2010/11 is therefore one of the major SWAp management tools that assess sector progress in achieving the HSSIP 2010/ /15 outputs and outcomes. 2
25 1.5 The Annual Health Sector Performance Report FY 2010/11 The objective of the AHSPR 2010/11 is to review the performance of the sector for the FY 2010/11 against targets, actions and indicators set out in the Ministerial Policy Statement (MPS) 2010/11 FY, MoH Activity Workplan 2010/11 FY, Joint Assessment Framework (JAF) under the Joint Budget Support Framework (JBSF) and against the HSSIP 2010/ /15 core indicators. Thus, the report provides progress on: i) Sector performance and annual trends for the NDP, JAF indicators and HSSIP 2010/ /15 indicators; ii) Financial Report for the FY 2010/11 including a donor-expenditure analysis; iii) Overall health service coverage levels iv) Status of implementation of the Integrated Health Sector Support Systems and governance at central level v) Local Government (District) performance using the League Table vi) The individual and collective contribution of the National, Regional Referral and General Hospitals as well as the PNFP hospitals at similar levels; vii) Implementation progress on the delivery of the UNMHCP and health support systems basing on planned outputs in the MPS 2010/11 viii) Monitoring implementation of the HSSIP 2010/ /15 ix) Progress made towards the 7 th National Health Assembly Resolutions and 16 th Joint Review Mission priorities. The report also addresses the data quality issues in terms of completeness, accuracy, external comparison and adjustments The drafting process The development process of the AHSPR 2010/11 was widely consultative /with stakeholders from all departments of the MoH, Development Partners (DPs) and Implementing Partners. The overall coordination and technical support was provided by a MoH Task Force (TF). The composition of the TF was drawn from all departments of the MoH and included chairpersons and secretaries of the seven Technical Working Groups (TWGs). The TF had representation from districts, Referral Hospitals, the Civil Society and Health Development Partners. A secretariat of staff from the Health Planning and Quality Assurance Departments, and WHO provided overall leadership of the preparation process in close collaboration with the TF and sub-committees. The WHO Uganda Country office facilitated the process of acquiring Consultants from WHO Geneva who provided technical support in reviewing the AHSPR report format. This was through a development process which included a data analysis workshop. A Consultant was recruited and provided support in the report compilation, formatting and collating process in close collaboration with the Secretariat and TF. Meetings were held weekly, to assess progress of development of the AHSPR and provide feed-back on the drafts. Draft submissions were made by secretaries of TWGs/heads of Divisions and sections. Gaps identified were rectified by the relevant submitting authority. The draft was presented to Senior Management Committee 3
26 (SMC), Health Policy Advisory Committee (HPAC) and Senior Top Management (STM) for comments and approval Sources of Information The information used in compiling the AHSPR 2010/11 is both quantitative and qualitative. As it is stipulated in the HSSIP 2010/11 monitoring and evaluation framework, the Health Management Information System (HMIS) under the Resource Centre is the main source of statistical data. In order to maintain consistency with previous reporting periods, this AHSPR uses the HMIS aggregated monthly reports for the entire financial year. Population figures were based on the 2010 midterm population projections from the UBOS statistical abstract. Several indicators do not have new data, as they rely on household surveys, especially DHS. The most important components of the HMIS are the health facility monthly and annual reports. These reports are, like any source of data, prone to errors associated with incomplete or inaccurate reporting. In order to maximize the quality of the statistics for the performance indicators, a major effort was made to gather as much facility and district information as possible, and assess for possible errors. A detailed report of the data quality assessment is presented in an annex (section 6). Other key sources of information included: i. HSSIP 2010/ /15 ii. Ministerial Policy Statement (MPS) 2010/11 iii. MoH activity plan 2010/11 iv. FY 2010/11 quarterly sector performance review reports v. MoH programmes and other central level institutions reports vi. MoH submissions from the Output Budgeting Tool (OBT) to the Ministry of Finance, Planning and Economic Development (MoFPED) vii. Previous AHSPR for the FY 2006/07, 2008/09 and 2009/10 viii. The HIV/AIDS Epidemiological Surveillance report 2010 ix. Medicines availability study 2010 x. Malaria Indicator Survey 2010 xi. Uganda Demographic Health Survey (UDHS) reports xii. Millennium Development Goal Report for Uganda 2010 xiii. Additional sources of information are included in the reference list Overview of the report outline The AHSPR 2010/11 is divided into three sections as follows; Section 1 is an introduction that covers the background to the AHSPR 2010/11 FY in relation to the framework for achieving the MDGs, NDP and HSSIP 2010/ /15 goals, drafting process and sources of information. 4
27 Section 2 provides an overview of the sector performance for FY 2010/11 and includes the overall performance of the sector against the HSSIP 2010/ /15 indicators, JAF 3 indicators and; an assessment of central level performance against planned key outputs from the MPS 2010/11; comparison of district performance using the District League Table; and comparison of hospital performance using the Standard Unit Output (SUO). Section 3 Annex detailing progress in implementation of priority activities under the; 1. Uganda National Minimum Health Care Package (UNMHCP). 2. Integrated Health Sector Support Systems. 3. Monitoring and Evaluation of the HSSIP 2010/ /15. 5
28 2 OVERALL PROGRESS AND PERFORMANCE This chapter presents an overview of the overall progress and health sector performance for FY 2010/11. It therefore includes an assessment of performance of the sector using the HSSIP 2010/ /15 core indicators marking progress towards achievement of the MDGs, NDP 2010/ /15, JAF 3, MPS 2010/11 and Activity Plan 2010/11 targets. 2.1 Overall Summary of Progress towards NDP Indicators Twenty six core indicators were identified to monitor progress in implementation of the HSSIP 2010/ /15. Of these, eight (8) indicators are used to monitor progress of the health sector towards NDP targets. Table 1 summarizes the performance in the first year of the NDP and the HSSIP 20/ /15 for the NDP indicators. Table 2: Performance against the 8 NDP indicators for the HSSIP 2010/ /15 Period Indicator Baseline, (year) 2009/10 NDP Target Annualized HSSIP Target 2010/2011 Achievement 2010/2011 Performance Trend from HSSIP Baseline % pregnant women attending 4 ANC sessions 47 60% 50% 32% Reversal % deliveries in health facilities 33 35% 40% 39% Improving but below target % children under one year immunized with 3 rd dose Pentavalent vaccine (m/f) % U5 children with weight /age below lower line (wasting) (m/f) 76 90% 80% 90% Positive 16%# 15% 15% NA No current information Contraceptive Prevalence Rate (CPR) 33% 34% 34% NA To be updated by the UDHS-5 % of health facilities without stock outs of any of the six tracer medicines in the previous 6 months % of approved posts filled by trained health workers 21 28% 50% 43% Positive 56 56% 60% 56% Static % Annual reduction in absenteeism rate 46 28% 20% NA Awaiting Panel Survey findings # 2006 data 6
29 Assessment of the eight indicators revealed two having improved; one improved but not on target; one static; one reversing; and there being no data for the other three, as the panel survey findings and conduction of the UDHS are still awaited. The proportion of deliveries in health facilities improved from 33% (2009/10) to 39% (2010/11); proportion of under one year immunized with 3 rd dose pentavalent vaccine from 76% (2009/10) to 90% (2010/11); and proportion of health facilities without stock outs of any of the six tracer medicines in the previous 6 months increased from 41% (09/10) to 47% (2010/11). The improvement in proportion of deliveries could be attributed to the increased supply mama kits through the essential medicines kit as districts including hospitals no longer have to pay for mama kits at the NMS, as well as availability of other medicines and health supplies including misoprostol. The marked increase in under one year immunized with 3 rd dose pentavalent vaccine could be attributed to the recent review of child days implementation and focus on poorly performing districts, which included catch up immunization services; House - to - House SIAs in 48 districts and, stimulation of districts to work towards improved performance; where districts are prompted to do specific district assessment and come up with innovative ways to improve routine immunization. In addition, monthly feedback was provided to all the 112 districts regarding their performance; and improvement was also registered in district supply of vaccines and injection materials from the centre. The shift from pull to a push system and reintroduction of the essential medicines kit contributed to the reduction in stock out of tracer medicines in the previous year. Further improvements have been realized in 2010/11 due to increased allocations to Vote 116 and tracking of medicine distribution. The last mile delivery introduced in May 2011 is anticipated to result in further improvements in medicines availability. The sector recorded a reversal in trends in proportion of pregnant women attending 4 ANC sessions from 47% (09/10) to 32% (10/11). This is in contrast to the increase in deliveries at the health facilities, and is probably due to the relative effort and campaign on facility deliveries compared to ANC. In addition, failure to appreciate the importance of ANC by the mothers remains a challenge. Another possible reason is the recent national mass distribution of ITNs in the community; some mothers previously sought ANC services in anticipation of a net. Even then, further investigations need to be carried out to establish the cause of the reversal in trends to almost half of the expected target. The level of staffing with trained health workers was static at 56% and this is attributed to no recruitments taking place in the Local Governments during the year under review as directed by the MoLG. The three indicators not documented for the year under review are got from data sources outside the MoH and not collected on an annual basis. The ongoing UDHS-5 will provide the current levels for these three indicators which include % of U5 children with weight / age below lower line (wasting); CPR. Information of the % of annual reduction in absenteeism rate will be obtained from the annual panel survey conducted by UBOS. 7
30 2.1 Overall Summary Progress towards MDG, JAF and HSSIP 2010/ /15 Indicators Health Impact Indicators Five impact indicators are used to assess the analysis of impact of health service delivery. Four measure the distribution of health across different life cohorts and these are; Maternal Mortality Ratio (MMR), Neonatal Mortality Rate (NMR), Infant Mortality Rate (IMR), and Under 5 Mortality Rate. The fifth, proportion of household experiencing catastrophic payments, measures financial risk (protection). Indicators for maternal, neonatal, infant and child mortality are collected every five years during the UDHS carried out by UBOS. For the year under review the UDHS 2006 indicators will still be applied as the UDHS -5 was started at the end of the financial year 2010/11. Maternal Mortality Ratio ( ) 435 per 100,000 live births Neonatal Mortality rate ( ) 29 per 1,000 live births Infant Mortality Rate ( ) 76 per 1,000 live births Under 5 mortality rate ( ) 137 per 1,000 live births Three of the impact indicators (Maternal Mortality Ratio, Infant Mortality Rate, and Under 5 Mortality Rate) are monitored among the MDG targets. MDG 4: Reduce Child Mortality Target 4.A: Reduce, by two thirds, between 1990 and 2015, the under five mortality rate. Figure 1: Under 5 Mortality trends in Uganda Figure 1: Under 5 Mortality trends in Uganda The MDG report for Uganda 2010 indicates slow progress towards achievement of the set target. Hospital based mortality data indicates that malaria is the top most (27.2%) cause of under five mortality followed by anaemia (12.1%), pneumonia (11.4%), perinatal conditions (7.8%) and septicaemia (5.0%). Most of the deaths occur early during admission due to the delayed presentation of most of these conditions at the hospital and shortages of blood for transfusion in some facilities, as well as high chronic malnutrition and micronutrient deficiencies in the populations. More than one third of the deaths in the first year of life occur in newborns
31 days, mostly in the immediate period after birth and are due to perinatal conditions like birth asphyxia, pre term birth and infection Hospital Based Mortality for all Ages A total of 13,761 hospital deaths were reported during 2010/11 FY. Malaria was the top (20.9%) cause of mortality followed by AIDS (9.4%), pneumonia (7.8%), anaemia (7.6%) and tuberculosis (3.9%) among the top five. The highest number of mortality was among males above 5 years (36.1%) followed by male under 5 (20.2%), females above 5 years (25.1%) and female under 5 (18.5%). (See Table 3) Among children under 5 years malaria is the highest (27.2%) cause of mortality followed by anaemia (12.1%), pneumonia (11.4%), Perinatal conditions (7.8%) and septicaemia (5.0%) among the top five causes of mortality. This trend remains the same from 2009 to 2010 (see Figure 2). Table 3: Top ten causes of hospital based mortality for all ages in 2010/11 FY IPD Diagnosis < 5 years Deaths Above 5 years Deaths Total Male Female Male Female % Malaria , % AIDS , % Pneumonia , % Anaemia , % Tuberculosis % Perinatal conditions (in New borns 0 to 28 days) % Septicaemia % Other Types of Meningitis % Respiratory Infections (Other) % Injuries - Road Traffic Accidents % All Others ,189 1,660 5, % Total 2,778 2,553 4,974 3,456 13, % Source: HMIS 2010/11 Among adults malaria and AIDS are the top most causes of mortality a three year period. Conclusions cannot be deduced now on the top ten causes of death in 2011 because available data was for the first 6 months. 9
32 Figure 2: Trends in IP Mortality MDG 5: Improve Maternal Health Target 5.A: Reduce by three quarters, between 1990 and 2015, the Maternal Mortality Ratio. Target 5.B: Achieve, by 2015, universal access to reproductive health care 10

33 The MDG report for Uganda 2010 indicates although there has been a reduction in MMR, the attainment of target 5A has been slow. Figure 3: MMR Trends in Uganda The HMIS indicates that on average countrywide there has been a slight reduction in hospital based maternal deaths from 1,143 maternal deaths reported in the health facilities in 2009/10 to 1,015 that occurred in 2010/11. With over 500,000 deliveries occurring in health facilities, this corresponds with a hospital maternal mortality ratio of almost 200 per 100,000 live births. It must be noted however that the quality of reporting of maternal deaths is variable between institutions. The figures cannot be considered more than indicative and more work is urgently needed to improve the quality of reporting and statistics. Figure 4: Health facility-based maternal deaths in FY 2009/10 and 2010/ / / Source: MoH HMIS Morbidity: Level and Trends There was decline in the number of reported new outpatient attendances for all ages (34,853,345) compared to the previous FY where reported new outpatient attendances were 36,808,680. Overall, this implies an average of 1.0 OPD visit per person per year. Communicable diseases are still the leading causes of morbidity with malaria ranking highest (36%) among all age groups, followed by no pneumonia cough or cold 19% and intestinal worms 5%. (See Table 4) 11
34 Table 4: Top ten causes of morbidity among all ages from 2009/10 to 2010/11 FY Diagnosis 2008/ / / New cases % New cases % New cases % Malaria 11,748,978 37% 14,164,008 38% 12,614,609 36% No Pneumonia- Cough or Cold 5,794,516 18% 6,851,602 19% 6,712,597 19% Intestinal Worms 1,767,586 6% 1,866,559 5% 1,826,240 5% Skin Diseases 1,117,313 4% 1,101,113 3% 1,118,221 3% Diarrhoea-Acute 965,145 3% 1,031,914 3% 1,029,615 3% Eye Conditions 748,997 2% 751,508 2% 935,445 3% Gastro-Intestinal Disorders (Noninfective) 726,862 2% 817,146 2% 825,338 2% Pneumonia 887,917 3% 912,263 2% 819,180 2% Urinary Tract Infections 646,326 2% 1,297,733 4% 747,354 2% Injuries = (Trauma due to Other Causes) 627,412 2% 641,987 2% 657,542 2% All Others 6,830,314 21% 7,372,847 20% 7,567,204 22% Total 31,861, % 36,808, % 34,853, % Source: MoH HMIS 2008/09 to 2010/11 (Expected reports received 89% 2008/09; 91% 2009/10; 93% 2010/11) Performance against lead indicators for HIV/AIDS, Malaria and TB During the year under review malaria, Tuberculosis (TB) and HIV/AIDS prevention, control and management interventions were among the key sector priorities. These three diseases are of focus under MDG 6 and therefore need to actively monitor progress towards achieving the MDG targets. Performance during the year 2010/11 shows positive but slow progress for most of the program lead indicators and reversal in some indicators for example; % of household sprayed with insecticides (99% in 2009/10 (in six districts) to 96% (in ten districts) in 2010/11) we need to report this correctly, one might think this is a national l average yet it data for only 6 10 out of 112 districts, this should be stated here, better even to be quiet about because the two figures are not comparable!, % of RBM partnership review meetings (75% in 2009/10 to 50% in 2010/11), TB Case Detection Rate (56% in 2009/10 to 54% in 2010/11), even though the number of notified cases went up) and TB treatment success rate (75% in 2008/09, 67% in 2009/10 and 69% in 2010/11). Overall there is marked improvement in TB program lead indicators compared to HIV/AIDS and malaria. MDG 6: Combat HIV/AIDS, Malaria and Other Diseases 12
35 Target Target 6.A: Have halted by 2010 and begun to reverse the spread of HIV/AIDS Target 6.B: Achieve, by 2010, universal access to treatment for HIV/AIDS for all who need it. Target 6.C: Have halted by 2015 and begun to reverse the incidence of malaria and other major diseases. Progress Reversal in progress On track Slow Source: Uganda MDG Report 2010 Table 5: Performance against selected HIV/AIDS Programme lead indicators Indicator 2009/ /11 Comments Proportion of health facilities with HCT services 37% (1,840/4,980) 38% (1,904/4,980) Minimal scale up of HCT services up to HC II level. Progress slow due to inadequate supply of kits and availability of trained personnel Proportion of health facilities with PMTCT services 23% (1,150/4,980) 32% (1,589/4,980) There is an increase in the number of facilities providing PMTCT services Proportion of pregnant women accessing HCT in ANC 83% at 90% reporting 82% at 70% reporting Not able to deduce actual performance due to poor reporting. Need to strengthen M&E component Number of males circumcised Not known as the intervention was very new Not known as Most circumcision is done by partners and not captured in the HMIS. Need to include safe male circumcision in the HMIS. No. people counseled and tested for HIV (m, f) M= 999,728 F= 1,992,665 M=833,393 F=1,413,127 There is a big discrepancy between the number of people counseled and tested and the laboratory tests done (8,338,860). T= 2,992,393 T= 2,246,520* Number of HIV positives enrolled in care Number of HIV positives eligible for ART Number of eligible clients initiated on ART Number of HIV positives screened for TB Source: UACP Database NA NA NA NA NA NA NA NA * HMIS data however 8,338,860 lab tests were done No reliable facility data were available to ascertain trends in coverage of HIV services, except that almost all HIV positive people were initiated on co-trimoxazole (95%). 13
36 The performance indicators for the MCP and NTLP show slow progress towards halting the incidence of malaria and TB. Table 6: Performance against selected Malaria Control Programme lead indicators Indicator 2009/ /11 Comment % of under-fives with fever who receive malaria treatment within 24 hours from a VHT 13.7 (UMIS) No data Roll out of ACTs to community level still awaiting release of AMFm and GF Round 10 grant currently delayed but under negotiation. % of pregnant women who have completed IPT2 uptake % of households sprayed with insecticide in the last 12 months Case fatality rate (%) among malaria in-patients under five % of public and PNFP health facilities without any stock outs of first line antimalarial medicines % of planned RBM partnership review meetings held 47 (HMIS) 43 (HMIS) (HMIS) 1.2 (HMIS) No national data VHTs in at least 27 districts are distributing ACTs (procured by partners) as part of the iccm, which targets U5 children with malaria, pneumonia and diarrhea. Reduction. Need for new thoughts & approached on improving performance 2009/10 results were from 6 districts while 2010/11 results are from 10 districts but still in the same geographical area Data yet to be validated and adjusted for the more representative figures 39 Results from support supervision in 128 out of a total of 363 health facilities in 34 Districts Modalities for engagement with partners currently under review including recent appointment of partnership coordinator Table 7: Performance against the TB Programme Lead Indicators Indicator 2008/ / /11 HSSIP Target 2010/11 FY Case Detection Rate (CDR) 57% 56% 54% 60% Treatment Success Rate (TSR) 75% 67% 70% 75% Cure Rate in % 31% 28% 40% NA % TB patients tested for HIV 63% 72% 81% 80% % HIV +TB patients started on CPT 71% 86% 90% 90% Total number of TB cases notified 43,862 43,335 45,546 NA 14
37 2.2 Health Services Coverage There are eight core health service coverage indicators for monitoring the HSSIP 2010/ /15 implementation. The routine HMIS is the major source of data for these indicators and therefore progress reported monthly is aggregated for the annual performance report. Table 8 summarizes the sector performance in relation to the core HSSIP 2010/ /15 health service coverage indicators. Table 8: Performance for health services core indicators Indicator Source Baseline, (year) NDP Target JAF 3 Target HSSIP Target 2010/11 Achievement Performance Trend from HSSIP Baseline % pregnant women attending 4 ANC sessions HMIS 47 (09/10) 60% N/A 50% 32% Reversal % deliveries in health facilities HMIS 33 (09/10) 35% 40% 40% 39% Positive % children under one year immunized with 3 rd dose Pentavalent vaccine (m/f) % one year old children immunized against measles (m/f) % pregnant women who have completed IPT2 HMIS 76 (09/10) 90% 88% 80% 90% Positive HMIS 72 (09/10) N/A N/A 75% 85% Positive HMIS 47 (09/10) N/A N/A 50 43% Reversal % of children exposed to HIV from their mothers accessing HIV testing within 12 months (m/f) EID database 29 (08/09) N/A N/A 35 30% Minimal improvement % U5s with fever receiving malaria treatment within 24 hours from VHT (m/f) NA 13.7 (09/10) N/A N/A 20 No data No national figure information CBHMIS not yet established % eligible persons receiving ARV therapy (m/f) UACP database 53 (2009) N/A N/A 55 NA No data N/A: these are not NDP and or JAF 3 indicators respectively Coverage for immunization services improved with proportion of under one year immunized with third dose of pentavalent vaccine increasing from 76% in 2009/10 FY to 90% in 2010/11 FY. 15
38 There was also remarkable improvement in the proportion of one year old children immunized against measles from 72% to 85% achieving the HSSIP 2010/11 14/15 target of 75%. The proportion of deliveries in health facilities increased from 33% to 39% above the NDP (35%), but below the JAF 3 and HSSIP annualized targets (40%). There was a marked reversal in trends for the proportion of women attending the 4 ANC sessions from 47% in 2009/10 to 32% in 2010/11 FY. This is well below the NDP (60%) and HSSIP (50%) targets. The proportion of pregnant women who completed second dose of suphadoxine/pyrimethamine for Intermittent Presumptive Treatment (IPT) for malaria declined from 47% in 2009/10 to 43% in 2010/11. There was a marked increase of Total Couple Year Protection (CYP) from 447,713 in 2009/10 to 787, in 2010/11. This increase was also reflected in the Panel Survey of 2010 that indicated an increase of Contraceptive Prevalence Rate to 33%. The proportion of children exposed to HIV from their mothers accessing HIV testing within 12 months was only 30% compared to 29% in 2009/10. This is very minimal progress and much below the HSSIP target of 35% for the year under review. The proportion of children under five years receiving malaria treatment within 24 hours from VHT was not assessed due to lack of information. It is expected that this information will be captured after rolling out of the HMIS 2010 which has a Community Information System component. Information on the proportion of eligible persons receiving ARV treatment therapy was not available. Overall there was varied performance in the health services coverage indicators with remarkable improvement in immunization coverage indicators above the HSSIP annual targets and reversal in progress in proportion of pregnant women attending 4 ANC sessions and receiving IPT 2. There is need to investigate the reversal or stagnation of trends in the maternal health services. 2.3 Coverage with Other Health Determinants Four core HSSIP 2010/ /15 indicators provide information on the overall contribution of coverage by services addressing other health determinants are having on the health status. Only one indicator on coverage of other health determinants and risk factors has been assessed in this report. This is because the source of information for the remaining indicators is not from the routine HMIS or program databases. The proportion of households with latrines increased from 69.7% in 2009/10 to 71% in 2010/11. This is a positive trend and is above the HSSIP 2010/ /15 annual target (68.5%). Information on household latrine coverage is generated from the annual environmental health data collection tool. 16
39 Current estimates for indicators on nutritional status for under fives will be obtained from the ongoing UDHS 5. Preliminary results from the UNPS conducted by UBOS in 2009/10 indicate an increase of Contraceptive Prevalence Rate (CPR) to 33%. The ongoing UDHS 5 survey, will also further provide an update on the status of CPR. Table 9: Performance for coverage for other health determinants and risk factors indicators during 2010/11 FY Indicator Source Baseline, (year) NDP Target JAF 3 Target HSSIP Target 2010/11 Achievement Performance Trend from HSSIP Baseline % of households with latrine EHD Data tool 69.7 % (09/10) N/A N/A 68.5% 71% On track % U5 children with height /age below lower line (stunting) (m/f) % U5 children with weight /age below lower line (wasting) (m/f) UDHS 38% (2006) UDHS 16% (2006) N/A N/A 36% No data No information 15% N/A 15% No data No information Contraceptive Prevalence Rate Uganda National Panel Survey / UDHS 33% (09/10) 34% 34% 34% No data Will further be updated by the UDHS 2011/12 Performance assessment for coverage for other health determinants and risk factors is not conclusive for the year under review. Information is available for only one (% of household with latrine which improved from 69.7% to 71%) out of four indicators. If a similar trend is sustained for all indicators in this category throughout the HSSIP there should be improvement in health status particularly of children under five. 2.4 Health Quality and Outputs Health quality and output indicators provide information on the direct output from investments made in health services. They are a measure of improvements made in access, quality, and safety of health services provided. 17
40 Table 10: Performance for health system output (availability, access, quality, safety) indicators Indicator Source Baseline, (year) NDP Target JAF 3 Target HSSIP Target 2010/11 Achievem ent Performance Trend from HSSIP Baseline % of new TB smear + cases notified compared to expected ( TB case detection rate) (m/f) NTLP Database 56 (09/10) N/A N/A % Reversal awaiting data from Mualgo for update Per capita OPD utilization rate (m/f) % clients expressing satisfaction with health services (waiting time) HMIS 0.9 (09/10) N/A N/A On track Survey 46 (2008) N/A N/A 50 No data No current information. Survey to be conducted 2011/12 % of health facilities without stock outs of any of the six tracer medicines in the previous 6 months (1 st line antimalarials, Depoprovera, S/P, measles vaccine, ORS, Cotrimoxazole) Drug availability study % (09/10) (41% when ACT are excluded) 28% 60% 50% 43% Improving 47% excluding ACTs % of functional Health Centre IVs (providing EMOC) HMIS 23 (09/10) N/A N/A 28 24% Slight improvement N/A: these are not NDP and or JAF 3 indicators respectively N/A: these are not NDP and or JAF 3 indicators respectively The proportion of new TB smear positive cases notified compared to expected (TB case detection rate) has declined from 56% in 2009/10 to 54% in 2010/11. A number of factors including uncertainty on magnitude of TB problem, the tendency for smear negative and EP TB to increase disproportionately in areas with high HIV prevalence and HIV-TB co-infected rate settings, poor R&R. Some districts also reported stock outs of laboratory reagents and supply of poor quality laboratory reagents, this could have negatively impacted on the case detection. Per capita Out Patients Department (OPD) utilization rate improved from 0.9 in 2009/10 to /11 achieving the HSSIP annual target. There is no national level information on the current status of client satisfaction (waiting time). The National client satisfaction survey will be carried out during 2011/12 FY. Facility based client satisfaction surveys were carried out by sites implementing 5S and findings indicated 18
41 improvement in client satisfaction after introduction of 5S. About 80% of patients at Gombe GH appreciated improvements on cleanliness and staff attitude, and 55% of them on waiting hours. About 90 % of patients at Entebbe GH recognized the improvement on cleanliness, 60% of them on staff attitude, and 30% of them on waiting time. (Monitoring Report of the JICA 5S Project in Uganda, March 2011) A survey conducted by UNHCO in 8 districts showed that 61.4% of the people interviewed in these districts are satisfied with the MCH services provided by the health facilities. The medicines availability study conducted in August 2011, shows that 43% of health facilities did not have any stock out of the tracer medicines in the 1 st and 4 th quarters of FY 2010/11 and 47% when excluding ACTs. It is worth noting that facilities without stock out considering ACTs were 21% in 2009/10. In the period under review, the country experienced some stock out period of Cotrimoxazole tablets for HIV/AIDs prophylaxis, thereby creating an increased pressure on what had been procured for routine treatment. As a result, the stock status was this time round affected by stock out of Cotrimoxazole tablets. Only 24% of the HC IVs were functional in 2010/11 a minimal increase from 23% found in 2009/10. HC IV functionality is being able to provide intervention in case of complications during delivery, which includes the ability to provide a Caesarean Section and Blood Transfusion; HC IVs have been judged functional if they have been able to carry out at least one Caesarean Section. The level of utilization of health services has improved as evidenced by the OPD utilization with the highest utilization rate among females above 5 years (63%) compared to 37% among males above 5 years. Utilization rate among females and males under five years is 51% and 48% respectively. Overall there is improvement in performance for most of the health systems output indicators with the exception of TB case detection rate and client satisfaction where there is no current data. The improvement in performance is an indication that availability, access and quality of services are likely to have improved. Other studies like national client satisfaction survey and Service Availability Readiness Assessment should be carried out to verify this. 19
42 2.5 Health Investments Indicators on health investments provide information on the amount of investments available for health services. Village Health Teams: According to a survey conducted by MoH / UNICEF, there was remarkable increase in the proportion of villages / wards with trained VHTs from 31% in 2009/10 to 72% in 2010/11. Again here we should mention that this is only for few districts where iccm is implemented. Health Financing: Allocation to health as a percentage of total government budget reduced from 9.6% in 2009/10 to 8.9% but in line with the MTEF target. Table 11: Performance for coverage for health investments and governance indicators Indicator Source Baseline, (year) NDP Target JAF 3 Target 2010/11 HSSIP Target Achievement Performance Trend from HSSIP Baseline % of approved posts filled by trained health workers HRIS 56 (09/10) 56% 59% 60% 56% Static % Annual reduction in absenteeism rate UNPS 46 (09/10) (Actual Absenteeism rate) 28% 20% (37% absenteeism) 20% No data Awaiting Panel Survey findings % of villages / wards with trained VHTs VHT Situation Analysis Report (09/10) NA NA 50 72% MoH/ UNICEF Survey General Government allocation for health as % of total government budget MTEF 9.6 (09/10) NA NA On track N/A: these are not NDP and or JAF 3 indicators respectively Human Resources for Health The proportion of approved posts filled by trained health workers stagnated at 56%. Annual reduction in absenteeism rate is expected at 20% of the baseline which is 46% absenteeism rate. Performance for this indicator is to be obtained in November from the annual UNPS conducted by UBOS. At the national level including all the hospitals, MoH institutions and LGs, the proportion of filled positions by trained health workers stands at 56%. This calculation excludes those health 20

43 workers who are not registered by health professional councils such as nutritionists, administrators, nursing assistants and drivers. Furthermore, the calculation also does not include administrative and support staff such as the accountants and secretaries. For this workers who are not registered by health professional councils such as nutritionists, indicator, there has been a fall from 75% in FY 2005/06 to 56% in FY 2010/2011 which can be administrators, nursing assistants and drivers. Furthermore, the calculation also does not attributed to the increased number of health facilities and thereby increasing the overall include administrative and support staff such as the accountants and secretaries. For this denominator. Furthermore, staffing norms were revised and increased in line with the indicator, there has been a fall from 75% in FY 2005/06 to 56% in FY 2010/2011 which can be workload at the different levels of care. The staffing levels are better in referral hospitals than attributed to the increased number of health facilities and thereby increasing the overall in district health units, where only 52% of the posts are filled. denominator. Furthermore, staffing norms were revised and increased in line with the Table 12: workload Staffing Levels at the in different the public levels sector of filled care. by The trained staffing health levels personnel are better - October in referral 2010 hospitals than in district health units, where only 52% of the posts are filled. Cadre of Staff Mulago Butabika RRHs DHOs Districts Health Units Norms Filled % filled Table 12: Staffing Levels in the public sector filled by trained health personnel - October 2010 Cadre of Norms Staff Filled Mulago Norms Filled Butabika Norms Filled RRHs Norms Filled DHOs NormsDistricts Filled Health Total Total Units Norms Filled % filled Doctors , % Norms Filled Norms Filled Norms Filled Norms Filled Norms Filled Clinical Officers ,598 1,678 3,050 2,014 66% Doctors , % Nurses Clinical Officers , , ,0982,5984,721 1,67811,643 3,050 6,806 2,014 58% 66% Midwives Nurses , , ,5369,0983,002 4,721 5,358 11,643 3,574 6,806 67% 58% Pharmacists Midwives , , , ,574 28% 67% Pharmacists % Dispensers % Dispensers % Lab. Scientists , ,485 1,128 45% Lab. Scientists , ,485 1,128 45% Radiographers % Radiographers % Health Assistants ,573 1,570 2,573 1,570 61% Health Assistants ,573 1,570 2,573 1,570 61% Other Medical Other Medical Related Staff Related Staff ,9514,9511,816 1,816 5,966 5,966 2,459 2,459 41% 41% Grand Total Grand Total 1,737 1,481 1,737 1, , ,692 2,409 2, ,180 27,180 14,154 14,15433,383 33,38318,599 18,599 56% 56% Percent filled Percent filled Source: Uganda Human Resources for Health Biannual Report October 2010 to March 2011 Source: Uganda Human Resources for Health Biannual Report October 2010 to March ,978 8,072 9,000 8,978 8,000 F 6,371 8,072 9,0007,000 8,0006,000 i 4,535 F 6,371 4,309 7,0005,000 6,000 i 4,000 g 3,000 1,148 2,272 4,535 1,481 4,309 5,000 1,000 2,000 u g 202 4,000 3,000 r 1, ,272 1,481 1,000 2,000 u e r e Total Total 5: The Density of Health Personnel GOU and PNFP 21
44 Analysis of HRH data for both the public and PNFP sub-sectors put together indicated that the country has 37,368 health workers. Out of these 8,978 (24%) are nurses and 4,535 (12%) are midwives and 1,148 (3%) are doctors. The data also indicates that the nursing assistants still form a big number of the health workers 6,371 (17%). This implies that more effort is needed to recruit and retain the qualified health staff particularly at HC II, HC III and HC IV levels. The density of health personnel is Uganda is still very low as shown by the health worker population ratio in Table 13. Overall, there are 1.49 core health workers per 1,000 population, still well below the WHO recommended minimum of 2.3 per 1,000. Table 13: Cadre: Population Ratio Health Worker H/W : Population ratio Density per 1,000 population Doctors 1 : 27, / 1,000 Clinical Officers 1 : 13, / 1,000 Nurses 1 : 3, / 1,000 Midwives 1 : 7, / 1,000 Diagnostic Staff 1 : 21, / 1,000 Main challenges Poor attraction and retention of staff across the country remains critical. The situation gets even worse for cadres like-; Doctors, Midwives, Anesthetic staff, Radiographers Pharmacists and Dispensers. Limited funding for recruitment, salaries and wages has resulted into high vacancy levels. Inequitable distribution of Health Workers to districts due to peculiar disadvantages of such districts has resulted into some districts not having the minimum staffing levels. The remuneration of health workers still remains a challenge. The needs of health workers are much more than the monthly payments across all cadres. Another challenge results from poor health worker attitudes. What make people efficient are their attitudes and this stems from personal attributes of maturity. Observation of most health workers reveals reduced commitment which results into little attention to professional standards. Some of the negative consequences have been increased late coming and absenteeism of staff. In some cases, the public has lost confidence in health workers. 22
45 Poor attitude of health staff has a correlation with the selection procedures of student health workers coming for training. Selection of students is done based on the academics only without subjecting the would-be health workers to an entry interview for most of the cadres. Students do not know what they are going in for. They are in most cases poorly informed of what they need to do on qualifying. The sector has also registered shortages of role models for various health professionals. The health sector also faces poor and unsupportive work environment resulting into dissatisfaction of health cadres. There is generally constricted career structure with implications on promotions and new appointments of health staff. This limitation is more marked at the district level. There is lack of recognition of health workers by communities and political leaders. This together with poor management and leadership in some cases within health facilities has negated the positive gains reached in the health sector. Recommendations for annual plan 2012/13 Improve funding to the sector especially wage bill provisions to enhance both the numbers and remuneration levels. Improve working conditions (Equipment and accommodation) Strengthen Management and supervision of health workers at all levels. Apart from the remarkable increase in the proportion of villages / wards with trained VHTs there is no improvement in the amount of health investments expected for delivery of quality health services. The health sector efforts in ensuring attainment and maintenance of an adequately sized, equitably distributed and appropriately skilled workforce (60% target for 2010/11 FY) were hampered by the ban on recruitment as a result of a limited wage will. There is need to advocate for increasing staffing levels for the entire critical cadre for effective and efficient utilisation of health investments. 2.6 Benchmarking Uganda's progress relative to 11 peer countries Benchmarking performance helps to put national progress into perspective. There are many issues that limit the comparability of the current situation and trends between countries, but international statistics are useful to provide a rough idea. Table 14 using data from the WHO World Health Statistics, compares the current situation in Uganda with 11 peer countries: Burundi, DR Congo, Ethiopia, Ghana, Kenya, Malawi, Mozambique, Rwanda, Tanzania, Zambia and Zimbabwe. These countries are similar in terms of socio-economic development, epidemiological situation and geographic location. Uganda scores high on the health inputs (average rank of 3 out 12 for the 3 health input indicators), but poorer on the coverage (average rank of 10 out of 12 for the 3 coverage 23
46 indicators) and health outcome indicators (average rank of 7 out 12 for the 3 outcome indicators). Note that most data pertain to 2009 and 2010, and do not include the recent 2010/11 figures in this report, such as pentavalent /DTP3 coverage. Table 14: Rank for key health indicators for 12 countries, including Uganda (WHO, 2011) INPUT BEST POOREST RANK GNI per capita (PPP int.$) (2008) UG PER CAPITA TOTAL EXPENDITURE (PPP int. $) (2009) UG GOVERNMENT EXPENDITURE ON HEALTH (% TOTAL GOVERNMENT EXPENDITURE) (2009) UG CORE HEALTH WORKER DENSITY ( ) UG COVERAGE BIRTHS ATTENDED BY SKILLED HEALTH PERSONNEL (%) (2009) DTP3 IMMUNIZATION COVERAGE AMONG 1-YEAR-OLDS (%) (2009) CONTRACEPTIVE PREVALENCE RATE ( ) UG UG UG OUTCOME MATERNAL MORTALITY RATIO (2008) UNDER FIVE MORTALITY RATE (2008) TOTAL FERTILITY RATE (2009) UG UG UG Figure 6 examines the progress that Uganda has made during compared to the average progress of its peer countries. Economic growth was 1.6 faster in Uganda than the average, but expenditure on health was much slower than in peer countries (70% slower). Overall, the coverage and health outcome indicators indicate the progress in Uganda has been slower than in the peer countries during Although Uganda is ranked 12 out of 12 for 3 rd dose pentavalent vaccine coverage, the increase over this period was nearly 1.5 times greater than peer countries. Figure 6: Uganda's General progress government benchmarked relative to the peer countries over time for the period expenditure on health to Per capita General total government exp. (PPP expenditure int.$) on health Births Per attended capita total by exp. skilled health (PPP int.$) personnel (%) Births attended by DTP3 immunization skilled health coverage among personnel 1- (%) year-olds (%) DTP3 immunization coverage among 1- Maternal mortality year-olds (%) ratio Maternal mortality ratio Under five child mortality Under five child mortality -0.1 Total fertility rate -0.5 Total fertility rate Figure 2: Uganda's progress -1 benchmarked relative 0.5 to the 1 peer 1.5 countries. 2 The progress 2.5 of 3 the peer Figure 2: Uganda's progress benchmarked relative to the peer countries. The progress of the peer countries has been standardized at 0. countries has been standardized at 0. The progress The progress of the of peer the peer countries has has been been standardized at (GGE= General government expenditure expenditure on health on health as a as a percentage of of total government expenditure, U5= U5= Under Under five five mortality; mortality; SBA= SBA= Births Births attended attended by by skilled skilled health personnel; TFR= Total Fertility rate). rate). (Source (Source WHO 2011) WHO 2011) Summary of Annual the Financial Health Sector Report Performance 2010/11 FY Report 2010/ Summary of the Financial Report 2010/11 FY Health service delivery is financed by the government, private sources and development
47 2.7 Summary of the Financial Report 2010/11 FY Health service delivery is financed by the government, private sources and development assistance under the sector wide arrangement. Of the Government of Uganda expenditure on health for the FY 2010/11, capital expenditure accounted for 17% of health sector public expenditure while recurrent expenditure such as wages, utilities and other operational costs accounted for 83%. Donor funding is mainly for development items. The GoU funds are channeled through the MOH, LGs and the OPM. Therefore, the ability of a health system to protect the poor against unaffordable health care need and avoid impoverishment resulting from excessive health care costs (catastrophic expenses) is the core of health care financing. This can be achieved through; i. Increasing government per capita expenditure on health and ii. Raising the proportion of household financing mobilized through prepayments The Health Financing Review 2009/2010 points out that there has been significant increase in the expenditure, from 16 US$ per person in , to the current total expenditure on health of over US$ 27 per person per year (representing a 69% increase in total health expenditure). However, this is less than US$ 44 per person per year the WHO World Health Report 2010 defined as the current estimates needs for provision of an appropriate basic package of services in low income settings. 25
48 2.7.1 Trends of the health sector funding (2000/ /11) The trend in allocation of funds to the health sector shows that there has been a steady increase in budget allocation over the past 10 years as illustrated in the table below. Table 15: Government allocation to the Health Sector 2000/01 to 2010/11 Year GoU Funding (Ushs bns) Donor Projects and GHIs (Ushs bns) Total (Ushs bns) Per capita public health exp (UGX) Per capita public health exp (US $)) GoU health expenditure as % of total government expenditure 2000/ , / , / , / , / , / , / , / , / , / , / , Analysis of the table above reveals the following; i. The GoU allocation to the health sector has been rising steadily over the last ten years, owing to economic growth, but the proportion of the budget spent on health did not increase. ii. ii. ii. iii. iii. The donor project component reduced significantly in FY 2010/11. The decline is on The The donor project component reduced significantly in in FY FY 2010/11. The The decline is is on on account of the exit of some Development Partners, like DANIDA, from the sector. account of of the the exit exit of of some Development Partners, like like DANIDA, from the the sector. The The proportion of of the the total Government budget to to health still still averages at at 9% 9% which is is short of of the the Abuja target of of 15% Financial Performance for for Local Governments (LGs) The The overall PHC budget performance for for financial year 2010/11 for for LGs LGs was was Shs billion out out of of an an approved budget of of Shs billion representing 106% budget out out turn. This funding excludes project funds and and funds meant for for medicines and and health supplies. There was was over budget performance under PHC wages due due to to supplementary budget releases for for health workers salaries amounting to to Shs Shs 18.5 billion. The The supplementary budget provision was was due due to to inadequate provision of of funds for for PHC wages for for staff in in post in in financial year 2010/11. The The supplementary budget provision led led to to the the over performance of of the the budget. The The worst budget performance for for grants to to LGs LGs was was under PHC development grant where Shs. illion representing 90% 40.1 billion was was released out out of of the the approved budget of of Shs Shs 44.5 billion representing 90% budget out turn. budget out out turn. General hospitals and NGO health facilities budget out turn was 98% and 97% respectively. General hospitals and and NGO health facilities budget out out turn was was 98% and and 97% respectively. 26However some general hospitals Annual Health and NGO Sector hospitals Performance did not Report receive 2010/ the 11 th quarter funds in However some general hospitals and and NGO hospitals did did not not receive the the 4 th 4 th quarter funds in in financial year 2010/11 due to non compliancy of the LGs in reporting to MoFPED on the health financial year 2010/11 due due to to non non compliancy of of the the LGs LGs in in reporting to to MoFPED on on the the health facility inventories.
49 2.7.2 Financial Performance for Local Governments (LGs) The overall PHC budget performance for financial year 2010/11 for LGs was Shs billion out of an approved budget of Shs billion representing 106% budget out turn. This funding excludes project funds and funds meant for medicines and health supplies. There was over budget performance under PHC wages due to supplementary budget releases for health workers salaries amounting to Shs 18.5 billion. The supplementary budget provision was due to inadequate provision of funds for PHC wages for staff in post in financial year 2010/11. The supplementary budget provision led to the over performance of the budget. The worst budget performance for grants to LGs was under PHC development grant where Shs billion was released out of the approved budget of Shs 44.5 billion representing 90% budget out turn. General hospitals and NGO health facilities budget out turn was 98% and 97% respectively. However some general hospitals and NGO hospitals did not receive the 4 th quarter funds in financial year 2010/11 due to non compliancy of the LGs in reporting to MoFPED on the health facility inventories. Key issues under LG Financing i. Low per capita allocation for Health services especially at health centre levels. ii. Prevalence of Off- Budget/project funding which necessarily do not address key sector priorities. iii. Inefficiencies in procurement of services and works. Table 16: Primary Health Care Grants FY 2000/ /11 in billions of Ug. Shillings FY PHC (WAGES) PHC (NON- WAGE) PHC NGOs ( PNFP) GENERAL HOSPITALS PHC ( DEV'T GRANT) TOTAL 2000/ / / / / / / / / / / Source: Approved Budget Estimates of Revenue and Expenditure- MOFPED. 27

50 Figure 7 shows that there has been steady increase in PHC wages over the last ten years, with no increase in the remaining components of the PHC grant. In FY 2010/11, there was a 39% decrease in the PHC Non-wage despite the increase in the number of districts. This severely affected delivery of services including management services like support supervision at LG level. Figure 7: Trends in PHC Grant Allocations 2000/ / PHC( WAGES) PHC (NON- WAGE) PHC NGOs( PNFP) GENERAL HOSPITALS PHC( DEV'T GRANT) 0 Table 17: Government of Uganda health sector budget performance for FY 2010/11 (excluding donor projects) Item Approved Budget (Ushs bns) Outturn (Ushs bns) Wage Non-Wage Development Budget performance (%) Remarks The difference was on account of a supplementary budget passed to cover wage shortfalls The performance can be attributed to general cuts across Government during the financial year 28
51 As illustrated in Table 17, the amount released to cover wages was higher than the approved budget. This is because the sector experienced wage shortfalls which resulted in a supplementary budget allocation of Ushs bn. The non-wage and development budgets performed at an average of 92%. LGs performed at an average of 106% as illustrated in table 18. Table 18: Local Government Grant Performance for FY 2010/11 Item Budget( 000') Actual Release (000') % PHC Wages 124,823, ,340, PHC Non-wages 14,355,550 14,229, PHC NGOs 16,848,318 16,352, General Hospitals 6,107,088 5,997, PHC Development 44,564,550 40,192, NGO Wage Subvention 1,159,329 1,157, Total 207,858, ,269, Table 19: Financial Performance for Central Institutions and Referral Hospitals for FY 2010/11 (UGX Billion) INSTITUTION WAGE NON WAGE DEVELOPMENT TOTAL Approved Budget Released Approved Budget Released Approved Budget Released Approved Budget Released Performance (%) MoH UCI UHI NMS HSC UBTS Mulago Butabika RRHs Total Grant Performance (%) Most institutions that had releases over and above the approved budget were on account of Most institutions that had releases over and above the approved budget were on account of the Wage grant that had been under provided in the budget. This necessitated passing a the Wage grant that had been under provided in the budget. This necessitated passing a 29
52 supplementary budget and therefore a greater than 100% performance of the approved budget. Main achievements A study on the efficiency of hospitals and HC IVs was conducted and findings will be used to inform resource allocation and utilization. A new resource allocation formula for the sector was developed and is now awaiting the input of the private not for profit sub-sector. This is expected to further improve equity and efficiency in resource allocation. The sector undertook a PNFP Hospital value for money audit. The sector also continued to lobby for and mobilize resources both locally and internationally. A concept note on the Health Financing Strategy has been developed. Major Challenges Inadequate funding for sector activities for example, the conditional grants to Local Governments and PNFPs have not significantly changed yet population, administrative units and prices have increased significantly Rising costs of goods and services distorted set plans Unplanned and unbudgeted for activities. Unforeseen and unbudgeted for but catastrophic and urgent emergencies such as Ebola and Yellow Fever exerted pressure on operational resources thus constraining other important activities. Off-budget sector funding: A number of health improving activities are funded outside the sector wide mechanism that was established to align funding to sector priorities. This leads to efficiency losses associated with funding activities that may be duplicative or outside the priorities identified to achieve health outcomes. Weaknesses in the LG capacity in areas of financial reporting, leadership and financial management Recommendations Expedite plans with the International Finance Co-operation to finalize a financing agreement to enable private health providers access affordable funds to improve on health service delivery. Lobby for more funds to finance sector activities. Implement the revised resource allocation formula for the sector Conduct the national health accounts and disseminate its findings among policy makers Finalise the new Health Financing Strategy and implement strategies therein Analysis and review of the quarterly budget performance reports (BPR) and following up on recommendations. Enhance periodic supervision, reporting to ensure efficient budget monitoring and performance. 30
53 Reduce off budget funding by ensuring that all projects and donor inflows are aligned to HSSIP and reflected in the budget. Reduce out of-pocket funding for health care by introducing prepayment systems like health insurance. Despite the very modest increment in general government allocation for health, efforts were made to establish mechanisms for securing and allocating available resources e.g. new resource allocation formula for the sector and PNFPs and development of the National Financing Strategy. The last published National Health Accounts (NHA) study for Uganda, covering financial years 1998/1999 to 2010/11; out of pocket expenditure was between 40% and 42% of overall expenditure on health. Government per capita expenditure on health was USD Given that mobilization of prepaid resources health care financing has not progressed, it implies that the financial burden on households between 2000/01 and 2010/11 has increased. The fiscal space study (World Bank 2009), showed a twofold increase in out of pocket expenditure on health between 2002/03 and 2004/05 from US$7 to US$14 per utilization. 31
54 2.8 Summary Assessment of the Health System / Health Sector Support System The central level s main roles are coordination and provide support functions like planning, supervision, resource mobilization and development of the sector. This section analyses progress in performance for the central level institutions which include the MoH headquarters, departments, priority programs, projects, referral hospitals and semi-autonomous institutions. The assessment is based on planned activities in the MPS FY 2010/11 (See section 3.1). Among the central level vote functions the Support to Health Sector Strategic Plan Project (SHSSPP) had the best level of performance (80%), against planned outputs, followed by pharmaceutical and other supplies (75%), then sector monitoring and quality assurance (60%). Achievement of planned key outputs under the various vote functions supporting health care service delivery varied as summarized in the matrix below. Table 20: Summary of performance by Vote Function Vote Function No. of key planned outputs 40% >40% - 80% >80% Comment Health Systems Development 7 3/7 (43%) 2/7 (29%) 2/7 (29%) Poor SHSSPP 5 0/5 (0%) 1/5 (20%) 4/5 (80%) Good Clinical and Public Health 6 3/6 (50%) 3/6 (50%) 0/5 (0%) Moderate Uganda Cancer Institute 2 0/2 (0%) 1/2 (50%) 1/2 (50%) Moderate Uganda Heart Institute 2 0/2 (0%) 1/2 (50%) 1/2 (50%) Moderate Uganda Blood Transfusion Services 6 1/6 (17%) 3/6 (50%) 2/6 (33%) Moderate National Referral Hospitals Mulago and Butabika 4 0/4 (0%) 2/4(50%) 2/4 (50%) Moderate Sector Monitoring and Quality Assurance 5 0/5 (0%) 2/5 (40%) 3/5 (60%) Good Health Research 3 0/3 (0%) 2/3 (67%) 1/3 (33%) Moderate Pharmaceutical and Other Supplies 8 0/8 (0%) 2/8 (25%) 6/8 (75%) Good Policy, Planning & Support Services 15 2/15 (13%) 7/15 (47%) 6/15 (40%) Moderate Human Resources for Health 6 0/6 (0%) 3/6 (50%) 3/6 (50%) Moderate 32
55 2.9 Global Fund (GF) Supported Interventions 2010/11 The GF supported interventions in this financial year contributed towards the attainment of the MDGs 4, 5, and 6 in relation to improving MCH as well as national and international health goals. During the reporting period, the GF disbursed $28,562, which was utilized on procurement of ARVs, cotrimoxazole, HIV test kits, laboratory reagents, trainings for service providers and printing of Information Education Communication (IEC) materials. This facilitated the procurement of 70,443 doses of Cotrimoxazole, 172,000 doses of ARVs, 200,000 HIV tests, 10 CD4 count machines and their laboratory reagents. The balance of is $3,600,000 yet to be spent on procurement of condoms. An additional USD 4M was in turn disbursed to subrecipients to conduct trainings and IEC activities. The disbursement under the malaria grant worth USD 40,885,477 targeted providing Long Lasting Nets for pregnant women and children under-5. It was used for procurement of 7,295,850 LNs through Voluntary Pooled Procurement (VPP). Additionally, USD 6,297,305 was disbursed directly to the country for mostly Civil Society Organisation (CSO) implemented activities of training, IEC/ BCC, registration, M&E, actual distribution and post distribution activities. Phase 1 distribution was successfully completed in Central, Western and Northern and Eastern Regions. Additionally Uganda signed an agreement with the GF under the Affordable Medicines Facility for Malaria (AMFm), where the GF subsidized ACTs by 95%. Under this grant 10 million doses of ACTs have already been delivered into the country. The GOU supported the TB program to purchase 180 microscopes and conduct training of 1,126 health workers in 38 districts. The country developed and submitted a country proposal for R10 HIV, Malaria, TB and HSS, which was approved by the GF board worth a total of USD 190M for five years. The country also submitted Round 7 phase two which has been approved worth USD $ 130 million for three years. Following the 2008 recommendation by the Inspector General of the GF, a Focal Coordination Office (FCO) was created. With GOU and GF, recruitment took place in October 2010 and the team came fully on board in February
56 2.10 Global Alliance for Vaccines and Immunisation (GAVI) Progress 2010/11 During the year under review Uganda received pentavalent vaccines worth USD $ 6,261,080 for the Expanded Program for Immunization. The GAVI secretariat had a mission in country in May 2011 and an MOU has been drafted and has been cleared by the Solicitor General. As soon as the GAVI secretariat signs the MOU then the Immunization Systems strengthening and Health Systems Strengthening funds will become available for the EPI program to implement the planned activities Health Partnerships Performance The Compact for implementation of the HSSIP 2010/ /15 At the beginning of HSSIP 2010/ /15 a Country Compact was signed by MoH, HDPs, CSOs and the private sector. This section assesses progress in implementation of the Compact as well as the decentralized responses (partners technical and financial support for health). The HPAC serves as the overall oversight and steering body for monitoring the implementation of the Compact. The main areas of focus during the year under review are extracted from the list of indicators for monitoring the Compact 2010/ /15 (See section 3.2). Table 21: Summary Matrix for monitoring progress of implementation of the Compact Area of Focus No. of key planned outputs 40% >40% - 80% >80% Comment Planning and Budgeting 5 4/5 (80%) 0/5 (0%) 1/5 (20%) Poor Monitoring programme implementation and performance 6 2/6 (33%) 3/6 (50%) 1/6 (17%) Moderate Policy guidance and monitoring 3 0/3 (0%) 1/3 (33%) 2/3 (67%) Good 34
57 Table 22: HPAC Institutional representatives attendance Jul 2010 Jun 2011 Month MOH (11) HDP (4) CSO (4) NMS (1) District (1) NRH (2) RRH (1) Line Ministries (5) Jul 36% 125% 100% 0% 0% 0% 0% 0% Aug 73% 100% 75% 0% 0% 0% 0% 0% Sep 55% 125% 75% 0% 0% 0% 0% 0% Oct 55% 75% 50% 100% 0% 0% 0% 0% Nov 45% 100% 0% 200% 100% 0% 0% 0% Dec 64% 75% 25% 100% 0% 0% 0% 0% Jan 55% 75% 50% 100% 100% 0% 0% 0% Feb 36% 100% 0% 0% 0% 0% 0% 0% Mar 9% 100% 75% 100% 0% 0% 0% 0% Apr 45% 100% 75% 100% 0% 0% 0% 0% May 0% 0% 0% 0% 0% 0% 0% 0% Jun 64% 75% 50% 0% 0% 0% 0% 0% 2.1 Decentralized Responses Project Support to LGs is mainly towards the HIV/AIDS program activities with the highest number of projects in the central region followed by the eastern and western. The SURE project supporting access to essential medicines has a national level coverage. Future assessments will analyse project support in relation to district performance for supported interventions, however, there is need to note that despite the high level of project support in the area of HIV/AIDS, there is slow progress in the programme indicators e.g. number of exposed infants tested for HIV and number of eligible clients initiated on ART. Only one project STRIDES is focusing on RH in particular FP service provision however there has been tremendous improvement in the CYP from 582,804 in 2009/10 to 787,390 in 2010/11. 35
58 Table 23: Project Support to Local Governments Project Area of Support Central East Central Region Eastern Karamoja Northern South West West Nile Western SURE Medicines X X X X X X X X STAR-SW HIV/AIDS X X SUSTAIN HIV/AIDS X X X X X IRCU HIV/AIDS X X X X X X X X STAR-E HIV/AIDS X NUMAT HIV/AIDS X STAR-EC HIV/AIDS X WORLD BANK Infrastructure Development X X X X X X X X STRIDES RH X X X X SDS Strengthening Decentralization X X X X X MALARIA CONSORTIUM STOP MALARIA Malaria X X X Malaria X X X X UNFPA RH X X X X X X BAYLOR HIV/AIDS X X X X IDI HIV/AIDS X X X MILDMAY HIV/AIDS X X WALTER REED PROJECT Total Projects HIV/AIDS X 12/17 8/17 11/17 4/17 5/17 8/17 7/17 11/17 36
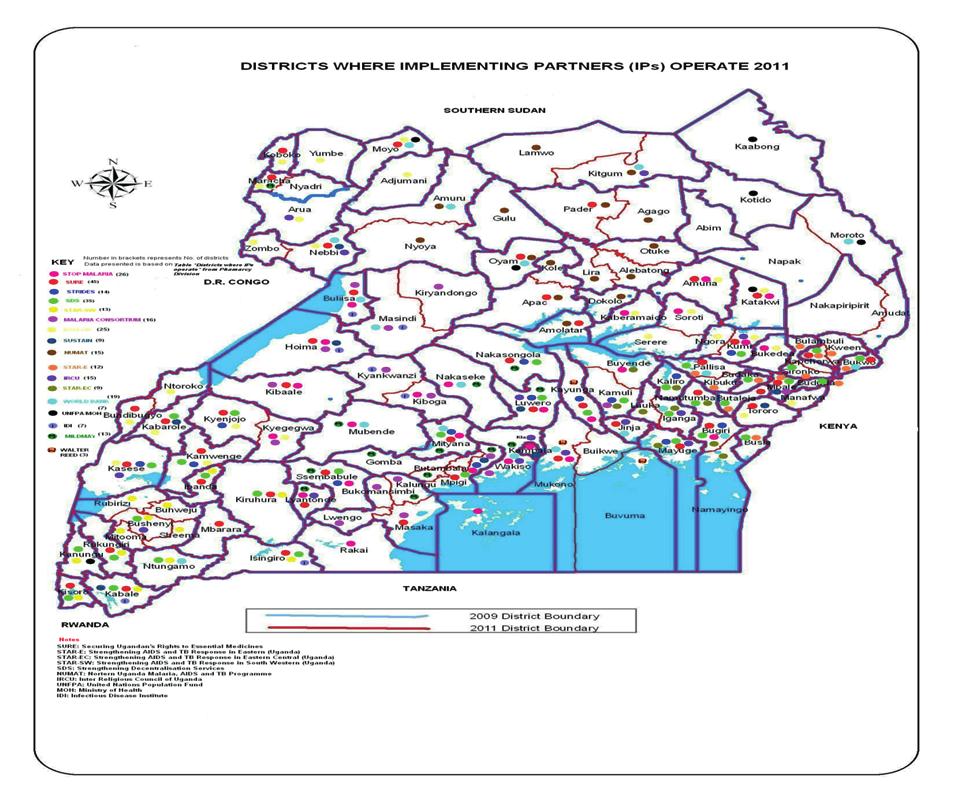
59 37
60 2.1.1 Progress made towards achieving international resolutions and obligations e.g. WHO, ECSA, IHP+ During the period under review, the MoH participated in several Regional and International fora where important decisions and commitments were made. Here below is a summary of the progress of implementation of the resolutions. Progress towards achieving the East African Community (EAC) recommendations of the forum for Ministers responsible for Social development The second meeting of the Forum for Ministers responsible for Social Development was held in Burundi from 2 nd to 7 th October The meetings reviewed the proposed priority areas of regional cooperation and made a number of important recommendations under the health sector. Since then progress has been achieved as indicated in the table below. Recommendation / Action Achievement Remarks Partner states to make collective The East Africa Public Health Laboratories efforts in addressing issues such as project has been operationalized to communicable diseases, address communicable diseases and pharmaceutical products and country consultations have been carried medicines. out for pooled procurement of medicines. Partner states to establish health services charters at national level. EAC partner states to develop and harmonize electronic early warning and rapid response systems for communicable disease outbreaks and fast track the establishment of the proposed EAC Regional Integrated e-health Information system. The EAC Medicines Registration Regulatory Harmonization project was drafted with strong participation of Uganda. MoH together with Health Consumer Organizations developed the Patients Charter which was launched in November 2010 and has been disseminated to all districts of the country. The MOH together with the Ministry responsible for Public Service developed a Clients Charter for the Health Sector which highlights the commitments of the health ministry to its clients. There is a draft e-health policy and strategic plan in place awaiting technical assistance from the Commonwealth Secretariat. The DHIS 2 has been adopted by all stakeholders in the health sector The EAC Secretariat is strengthening the East African Integrated Disease Surveillance Network (EADSNET) in order Project approved and Uganda is a beneficiary The patients Charter spells out patients rights and responsibilities and the responsibility of health workers to the patients. 38
61 EAC partner states to promote multi sectoral collaboration in the implementation of social and reproductive health and rights projects and programmes at both national and regional levels in order to enhance the reduction of maternal, neonatal and infant mortality rates. EAC partner states to integrate the regulation and practice of traditional, herbal, Complementary and alternative medicine under the national ministries responsible for health. EAC Sectoral council of Ministers of Health to fast-track the EAC Regional Study on Harmonization of National Social Health Insurance System and to include the Terms of Reference on recommendations and mechanisms for the establishment of Community Based Social Health Insurance Schemes at national level, where feasible. to enhance timely communication and sharing of information on disease outbreaks. Following the assessment of the status of MDGs, a multi sectoral framework was developed to address bottlenecks in the attainment of MDG 4 & 5 on Child and Maternal Health, respectively. Developed and reviewed the cost of the operational plan on the roadmap to accelerate reduction of maternal and neonatal morbidity and mortality. Government approved the principles for enacting indigenous and complementary medicine practice bill/act. The Public Private Partnership for Health (PPPH) policy was finalized and is in cabinet for approval. The NHIS act is undergoing stakeholder consultations. EAST, CENTRAL AND SOUTHERN AFRICA-HEALTH COMMUNITY (ECSA-HC) The MOH participated in the ECSA-HC 52 nd Health Ministers Conference which was held on 25 th - 29 th October, 2010 in Harare Zimbabwe under the theme Moving from knowledge to Action: Harnessing Evidence to Transform Healthcare. Resolutions were made on Evidence based policy making, Universal Health Coverage, MCH/RH/Family Planning (FP), Gender Based Violence (GBV) and Child Sexual Abuse; HRH Leadership and Management for Quality Health Services, Prioritizing Nutrition interventions, Strengthening Monitoring and Evaluation systems, Strengthening response to MDR and XDR and Strengthening Partnerships for Health. The MOH has responded to the different thematic areas of the resolutions. For instance the health sector follows the use of evidence for policy formulation and decision making; in addition the Uganda National Health Research Organization (UNHRO) has been established to 39
62 coordinate all health related research and facilitate dissemination and use; a National Health Insurance scheme to address the issue of universal Health coverage is undergoing stakeholders consultations. The ECSA regional policy on GBV and child sexual abuse is being adopted by the country, a motivation and retention strategy to address HRH issues was developed and is undergoing costing; Plan to develop a holistic communication strategy to address human nutrition habits and life styles is underway, and a nutrition hand book for the general public and VHTs has been developed. A Non Communicable Diseases (NCDs) survey is underway. A comprehensive Monitoring and Evaluation framework has been finalized. 40
63 2.2 Local Government Performance District League Table Performance The objective of the district league tables is to assess the performance of the district given its available resources. Eleven indicators were selected to evaluate and rank district performance: 8 coverage and quality of care indicators, given a collective weight of 75%; and 4 management indicators, accounting for the remaining 25%. The indicators were selected for consistency with the 26 core HSSIP 2010/ /15 indicators, reliability of the data source, and frequency of data collection. Routine HMIS data from the Resource Centre were the primary data source for a majority of the indicators (Pentavalent Vaccine 3 rd Dose coverage, institutional deliveries, outpatient visits, Sulfadoxine / Pyrimethamine (SP) 2 nd dose for IPT, 4 th ANC visits, HMIS timeliness and completeness of reporting, and District Health Management Team (DHMT) meetings held); some of the indicator data were provided by MoH programmes such as HIV/AIDS, TB, human resources and environmental health. There were a number of issues pertaining to quality of the final data set, such as missing data, outliers, and inconsistencies between monthly reports and end-of-year totals for HMIS data. Despite efforts by the Resource Centre to follow up with districts, there were four districts that failed to submit an annual report to the national level. These districts were given a score of zero for some of the coverage indicators that were computed based on numbers from the annual report. A few districts showed an uncommonly large discrepancy between the monthly reports submitted by the district and the end-of-year total reported in the district annual report. These were flagged and targeted for follow-up. One district, Alebtong, was removed from the league table ranking due to large inconsistencies in the data over multiple indicators. Finally, district population projections for 2011 provided by UBOS may contain inaccuracies as they are based on 2002 census data. These issues are addressed in greater detail in the Data Quality Annex. Due to the different set of indicators used to assess district performance and the addition of 32 new districts, a direct comparison cannot be made with the rankings in district league tables from previous years. The actual rankings have to be interpreted with caution. Not only can the quality of reporting be variable and cause errors in the performance rankings, also the population denominators can be a source of error. First, they are based on a national average growth rate projection of the 2002 census and some districts have had markedly different growth rates. Second, clients do not stick to district boundaries and may seek services in other districts which then get higher coverage and better rankings. However, Kampala remains the top ranking district this year, and Kaabong remains among the bottom 10 districts. Table 22 shows the top and bottom 15 performing districts with their ranks and total scores. The full district league tables can be seen in the Annex. The national average score was
64 districts districts which which then then get higher get higher coverage coverage and better and better rankings. rankings. However, However, Kampala Kampala remains remains the the top ranking top ranking district district this year, this year, and Kaabong and Kaabong remains remains among among the bottom the bottom 10 districts. 10 districts. Table Table shows shows the top the and top bottom and bottom 15 performing 15 performing districts districts with their with their ranks ranks and total and total scores. scores. The full The full district district league league tables tables can be can seen be in seen the in Annex. the Annex. The national The national average average score score was was Table Table 24: Top 24: 15 Top performing 15 performing districts Total districts District Total Rank District KAMPALA 77.5 Rank 1 KAMPALA BUSHENYI BUSHENYI KABAROLE KABAROLE MBARARA MBARARA GULU GULU BUTALEJA BUTALEJA LYANTONDE LYANTONDE BULIISA BULIISA JINJA JINJA KATAKWI KATAKWI ABIM ABIM RUKUNGIRI RUKUNGIRI MUKONO MUKONO KABERAMAIDO KABERAMAIDO SIRONKO SIRONKO Table Table 25: Bottom 25: Bottom 15 performing 15 performing districts Total districts District Total Rank District ADJUMANI 42.7 Rank 97 ADJUMANI LWENGO LWENGO LUUKA LUUKA NAPAK NAPAK GOMBA GOMBA MOYO MOYO KOLE KOLE BUHWEJU BUHWEJU NAMAYINGO NAMAYINGO KAABONG KAABONG SERERE SERERE AMUDAT AMUDAT NTOROKO NTOROKO KWEEN KWEEN BULAMBULI BULAMBULI The The new new districts districts showed showed lower lower performance performance compared compared to existing to existing districts districts (see (see Table Table 24), 24), with with Kyegegwa Kyegegwa being being the the highest highest scoring scoring new new district district ranked ranked at 48 at th 48 (out (out of 111). of 111). All new All new districts scored scored lower lower than than the the national national average. average. New New districts districts tended tended to have to have less reliable less reliable reporting and and lost lost many many points points due due to to incomplete incomplete and and missing missing reports. reports. Four Four of the of bottom the bottom five five performing districts failed failed to to submit submit an an annual annual district district report, report, and and thus thus could could not be not assigned be assigned scores for some of of the the core core coverage indicators such such as as Pentavalent 3 rd dose 3 rd dose coverage coverage and and institutional deliveries. In In addition, new new districts were were much much more more likely likely to have to have missing missing data on data on HIV testing of of infants, DHMT meetings and and timeliness of of medicine orders. orders. Table 26: District ranking for for the new top districts new districts Table Table 27: District 27: District ranking ranking for bottom for new old districts Total National Total National District Rank Rank District Rank Rank KYEGEGWA OTUKE BUTAMBALA MITOOMA NWOYA KIRYANDONGO BUYENDE LWENGO ZOMBO LUUKA AGAGO NAPAK KALUNGU GOMBA RUBIRIZI KOLE SHEEMA BUHWEJU KIBUKU NAMAYINGO NGORA SERERE BUVUMA AMUDAT BUKOMANSIMBI NTOROKO LAMWO KWEEN BUIKWE BULAMBULI KYANKWANZI
65 Districts with RRHs were generally found to have a higher score than those that did not (see Table 26). Large facilities and hospitals can attract clients from neighbouring districts, confounding Districts with district RRHs were coverage generally estimates. found This to have is particularly a higher score true for than more those specialized that did not services (see such Table as 26). HIV testing Large facilities of infants and born hospitals to women can with attract HIV. Of clients the 14 districts from neighbouring with regional/national districts, referral confounding hospitals, district five coverage were ranked estimates. in the This top is 10 particularly highest scoring true for districts: more specialized Kampala, Kabarole, services Mbarara, such as HIV Gulu, testing and of Jinja. infants born to women with HIV. Of the 14 districts with regional/national referral hospitals, five were ranked in the top 10 highest scoring districts: Kampala, Kabarole, Table Mbarara, 28: District Gulu, and ranking Jinja. for districts with regional/national referral hospitals Total Total National National Table District 28: District District ranking Rank for districts Rank with regional/national referral hospitals Rank KAMPALA 77.5 KAMPALA Total National 1 KABAROLE 1 District 73.1 Rank 2 Rank 3 MBARARA KABAROLE KAMPALA GULU KABAROLE MBARARA JINJA MBARARA GULU MBALE GULU 64.4 JINJA LIRA JINJA 64.2 MBALE MASAKA 16 MBALE KABALE LIRA LIRA SOROTI MASAKA MASAKA Below 21 ARUA KABALE KABALE national 33 HOIMA SOROTI SOROTI average Below 62 Below MUBENDE ARUA MOROTO ARUA of national national HOIMA HOIMA average 84 MUBENDE average of 58.4 MOROTO MUBENDE of 58.4 Three-quarters MOROTO of hard-to-reach districts 95 scored below the national average (see Table 27). This indicates that being hard-to-reach could have an impact on district performance. Nonetheless, four Three-quarters hard-to-reach of hard-to-reach districts ranked districts among scored the below top 20 the highest national scoring average districts: (see Table Gulu, 27). Abim, This Mukono, indicates Three-quarters that and being Kisoro. hard-to-reach of Eleven of the could 25 have hard-to-reach districts an impact scored districts on district below are performance. the also national Peace Recovery Nonetheless, average and (see Table 2 Development four hard-to-reach indicates that Plan districts being (PRDP) hard-to-reach districts. ranked among Approximately the top 20 could have half highest of an PRDP scoring impact districts districts: on district score Gulu, above Abim, performance. the None national Mukono, average and Kisoro. (see Table Eleven 28), of indicating the 25 hard-to-reach that the PRDP districts infrastructure are also development Peace Recovery funds may and four hard-to-reach districts ranked among the top 20 highest scoring districts: Gulu be Development aiding in increasing Plan (PRDP) scores districts. for these Approximately districts. half of PRDP districts score above the national Mukono, average and (see Kisoro. Table 28), Eleven indicating of that the the 25 PRDP hard-to-reach infrastructure districts development are funds also may Peace Recov be Development aiding in increasing Plan scores (PRDP) for these districts. Approximately half of PRDP districts score abo national average (see Table 28), indicating that the PRDP infrastructure development fun be aiding in increasing scores for these districts. 43
66 Table 29: District ranking for hard-to-reach districts District Total Rank National Rank GULU ABIM MUKONO KISORO BUKWO KANUNGU AMURU Below KITGUM national MAYUGE average NWOYA of 58.4 AGAGO PADER BUNDIBUGYO KALANGALA BUVUMA KOTIDO NAKAPIRIPIRIT LAMWO MOROTO ADJUMANI NAPAK NAMAYINGO KAABONG AMUDAT NTOROKO Table 30: District ranking for Peace Recovery and Development Plan (PRDP) districts District Total Rank National Rank GULU BULIISA KATAKWI ABIM KABERAMAIDO SIRONKO MBALE LIRA KAPCHORWA NEBBI KUMI PALLISA BUDAKA BUKWO DOKOLO AMURU KITGUM OYAM BUKEDEA APAC MASINDI PADER SOROTI ARUA KOTIDO KOBOKO NAKAPIRIPIRIT YUMBE MOROTO ADJUMANI MOYO KAABONG Below national average of 58.4 The lowest scoring districts tended to have a small population (below 200,000), and the highest scoring district Kampala also had the largest population. Beyond this, however, there did not appear to be a strong relationship between the total score and the population size of the district. Smaller districts may have lower rankings because the people seek services outside of the district. 44
67 Figure 8: District population vs. total score Table 31: District ranking by district population Population under 100,000 District Total Rank National Rank LYANTONDE BULIISA ABIM BUKWO BUTAMBALA NWOYA KALANGALA BUVUMA OTUKE BUHWEJU NTOROKO KWEEN
68 KALANGALA LIRA BUVUMA RAKAI OTUKE NEBBI BUHWEJU PALLISA NTOROKO KAMWENGE Table KWEEN 31: District ranking 17.8 by district 12 population 110 KAMULI TORORO Population Population under from 100, ,000 to 250,000 Population ISINGIRO from 250, to 500, IGANGA Total Total National National Total National KABALE District District Rank Rank Rank District NTUNGAMO 59.4 Rank 17 Rank 35 LYANTONDE BUSHENYI KABAROLE MANAFWA BULIISA BUTALEJA MBARARA MITYANA ABIM KATAKWI GULU KAYUNGA BUKWO KABERAMAIDO JINJA KITGUM SIRONKO BUTAMBALA RUKUNGIRI OYAM KISORO NWOYA MBALE MAYUGE KAPCHORWA KALANGALA MASAKA LIRA APAC BUVUMA BUDUDA RAKAI MASINDI OTUKE MPIGI NEBBI AGAGO BUHWEJU KUMI PALLISA SOROTI NTOROKO BUDAKA KAMWENGE KYENJOJO KWEEN NAMUTUMBA KAMULI BUGIRI KANUNGU TORORO LUWERO Population DOKOLO from 100, to 250, ISINGIRO KIRUHURA AMURU IGANGA HOIMA NAKASONGOLA Total National 45 KABALE YUMBE District NAKASEKE 56.2 Rank 19 Rank 47 NTUNGAMO AMURIA BUSHENYI KYEGEGWA BUIKWE MANAFWA BUTALEJA BUKEDEA BUSIA MITYANA KATAKWI BUYENDE KIRYANDONGO ZOMBO KAYUNGA ADJUMANI KABERAMAIDO IBANDA KITGUM LWENGO SIRONKO PADER OYAM MOYO KISORO KALUNGU MAYUGE KAABONG KAPCHORWA MASAKA 63.6 RUBIRIZI APAC BUDUDA BUNDIBUGYO MASINDI Population 54.4 over 500, MPIGI SHEEMA AGAGO Total National KUMI MARACHA SOROTI District Rank Rank BUDAKA KIBUKU KYENJOJO SEMBABULE KAMPALA NAMUTUMBA BUGIRI KIBOGA MUKONO KANUNGU LUWERO AMOLATAR KASESE DOKOLO KIRUHURA NGORA WAKISO AMURU HOIMA BUKOMANSIMBI ARUA NAKASONGOLA KOTIDO YUMBE KIBAALE NAKASEKE KOBOKO AMURIA MUBENDE KYEGEGWA NAKAPIRIPIRIT BUIKWE BUKEDEA KALIRO BUSIA BUYENDE LAMWO KIRYANDONGO ZOMBO KYANKWANZI ADJUMANI IBANDA MITOOMA LWENGO PADER MOROTO MOYO KALUNGU LUUKA KAABONG RUBIRIZI NAPAK BUNDIBUGYO GOMBA Population over 500,000 KOLE SHEEMA NAMAYINGO Total National MARACHA SERERE District Rank Rank KIBUKU AMUDAT SEMBABULE BULAMBULI KAMPALA KIBOGA MUKONO AMOLATAR There appears 51.3 to be a 34 slightly 74 KASESE positive relationship between district staffing levels (% of NGORA approved There appears 50.8 posts that to be 35 are a filled) slightly 76 WAKISO and positive the overall relationship score. However between this district partly staffing to be expected levels (% as of BUKOMANSIMBI staffing approved levels posts 50.2 are that one of are 36 the filled) 78 ARUA indicators and the included overall in score. the calculation However this of the is partly overall to score. be expected as KOTIDO KIBAALE KOBOKO staffing levels are 49.4 one of 38 the indicators 81 included in the MUBENDE calculation of 47.1 the overall 7 score. 88 NAKAPIRIPIRIT Annual 82 Health Sector Performance Report 2010/ 11 KALIRO LAMWO
69 Table 32: Staffing levels for top ten districts District Staffing level National Rank KAMPALA 123% 1 BUSHENYI 53% 2 KABAROLE 79% 3 MBARARA 35% 4 GULU 73% 5 BUTALEJA 38% 6 LYANTONDE 38% 7 BULIISA 74% 8 JINJA 57% 9 KATAKWI 71% 10 Table 33: Staffing Levels for Bottom ten districts District Staffing level National Rank MOYO 51% 102 KOLE 30% 103 BUHWEJU 25% 104 NAMAYINGO 20% 105 KAABONG 42% 106 SERERE 44% 107 AMUDAT 33% 108 NTOROKO 39% 109 KWEEN 64% 110 BULAMBULI 52%
70 2.3 Service Delivery Hospital Performance Essential Clinical Care is a key component of the UNMHCP. Hospitals are major contributors to the outputs in essential clinical care and the community sees hospital functionality as a sign of a working health system. Many problems of hospitals quickly come in to public knowledge and concern as has been evidenced in recent press reports. According to the health facility inventory of January 2011 there are 143 hospitals; the number of hospitals has been increasing especially those belonging to the private sector. There is a very wide spread of hospital size and out puts, and according to the minimum definition 1 criteria of hospitals according to the hospital policy many Hospital Public PNFP PHP Total Number hospitals especially private health practitioner hospitals do not satisfy the criteria of a hospital but are nonetheless registered as hospitals. For example bed sizes vary from 18 to 355 for general hospitals and from 120 to 482 for regional referral hospitals and large PNFP hospitals. The assessment of hospitals within the annual health sector performance report is now in its seventh year; there has been effort to analyze the functioning of hospitals. This analysis largely looks at outputs of hospitals and relates inputs to outputs and outcomes. In order to have uniform comparison of outputs of hospitals we will continue to use the Standard Unit of Output (SUO). 2 The SUO is a composite measure of outputs that allows for a fair comparison of volumes of output of hospitals that have varying capacities in providing the different types of patient care services. Basic efficiency indicators for resource use are generated and tables comparing hospitals generated. Emphasis is on general and RRHs, however we recognize that a suitable performance assessment for national referral hospitals is lacking and the current assessment is not very appropriate for RRHs as well. There is need to develop a robust hospital performance assessment methodology for all levels of hospitals and an accreditation scheme that ensures basic standards and performance of a health unit that should be classified as a hospital. 1 A hospital is defined as A registered health care facility, public or private organisation, profit or not for profit, devoted to providing curative, preventive, promotive and rehabilitative care, through outpatient, inpatient, and community health services. It should have at least 60 beds, a high level of skilled medical personnel including doctors, and be able to carry out major surgery and advanced investigative procedures including X-ray. It should serve a population of at least 200,000 people. 2 SUO stands for standard unit of output an output measure converting all outputs in to outpatient equivalents. SUO total = (IP*15 + OP*1 + Del.*5 + Imm.*0.2 + ANC/MCH/FP*0.5) based on earlier work of cost comparisons. 48
71 For the year 2010/2011, reports have been received from 85 general hospitals of which; only 78 had information that allows for fair analysis. The eleven RRHs and four large PNFP hospitals (Nsambya, Rubaga, Mengo and Lacor) as previously will be analyzed in their own group. In this group, 15 hospitals submitted data that would allow a fair analysis Regional Referral Hospitals There are 13 RRHs in the country, but for the annual reporting exercise 4 large PNFP hospitals (Nsambya, Rubaga, Mengo, and Lacor) with the scale and scope of RRHs are included in the group. The full set should then be 17 hospitals. Reports were received from 15 out of the 17 hospitals some of them incomplete. a) Inputs Finance The total approved budget for RRHs was 50,152 Billion Shs. and actual release was 52,223 Billion Shs. The additional funding was mainly towards wage subvention. Overall budget performance was 104%. Table 34: Financial Performance for RRHs for FY 2010/11 (UGX Billions) INSTITUTION WAGE (,000,000) NON WAGE (,000,000) DEVELOPMENT (,000,000) TOTAL (,000,000) Performance (%) Approved Budget Released Approved Budget Released Approved Budget Released Approved Budget Released Arua Fort Portal Gulu Hoima Jinja Kabale Masaka Mbale Soroti Lira Mbarara Mubende Moroto Total % The total number of staff in the 13 hospitals that provided the information is 3,859, on average the number of staff per hospital is 297 (243 for RRHs only) but with a wide range from 117 to 49
72 555. Among the RRHs an analysis of positions filled against establishment was made. Table 33 shows variation among different cadres. Clearly, medical doctors and pharmacy staff are in most shortage. Among hospitals the newly elevated hospitals Moroto and Mubende are worst affected with filled positions of 45% and 50% respectively as seen in Figure 9. Table 35: Positions filled in Regional Referral Hospitals Medical Doctors Nursing Clinical Officers Pharmacy Dispensers Laboratory Anaesthesia All Medical staff Average positions filled Minimum positions filled Maximum positions filled 44% 88% 77% 40% 49% 68% 68% 76% 13% 56% 41% 0% 20% 42% 31% 45% 72% 161% 125% 100% 120% 116% 140% 120% Source: Hospital submissions for AHSPR 2010/11 Figure 9: Filled staff positions in RRHs 140% 120% 140% 100% 120% 80% 100% 80% 60% 60% 40% 40% 20% 20% 0% 88% 88% RRH All Medical Staff Filled Positions 120% % RRH All Medical Staff Filled Positions % 120 % 45% 45% 80% 86% 83% 120% 83% 80% 86% 83% 71% 76% 77% 71% 83% 76% 77% 70% 70% 50% 50% 57% 57% b) Outputs The outputs of the 11 regional RRHs and 4 large PNFP hospitals have been analyzed here below. The 15 hospitals attended to 313,021 inpatients, 1,633,149 outpatients and 77,158 deliveries among other outputs. On average each hospital attends to 20,868 inpatients, 108,877 outpatients. St. Mary Lacor hospital a large PNFP hospital has the highest SUO among the RRHs and large PNFP hospitals. Masaka and Mbarara RRH data was not available for analysis. The average SUO per staff for all hospitals combined was Soroti RRH and Kabale RRH had the highest (2,280 and 2,112 respectively), while Gulu and Mengo RRH had the lowest (977 and 774 respectively). 50

73 Table 36: Overall performance for Regional Referral and Large PNFP Hospitals Figure 10: Volume of Outputs Regional Referral and Large PNFP hospitals Masaka Mbarara Moroto Mubende Hoima Mengo Gulu Mbale Lira Average Soroti Kabale Fort Portal Nsambya Rubaga Jinja Arua St. Mary Lacor Hospital Name OPD attendances (N = 15) ANC (N = 15) Deliveries (N = 15) Immunizations (N = 15) FP visits (N = 14) Beds (N = 15) Admissions (N = 15) Patient Days (N = 15) Major Operations (N = 15) SUO (N = 15) Total 1,633, ,244 77, ,007 46,406 4, ,021 1,458,422 42,114 6,254,510 Average 108,877 9,283 5,144 29,000 3, ,868 97,228 2, ,967 Min 36,748 1, , ,110 42, ,630 Max 206,090 23,064 7,885 93,771 9, , ,493 10, ,841 NB: Catholic-faith based institutions do not provide conventional FP methods. A comparison of volume of outputs based on the SUO has been made and is shown in figure 10. SUO a) Quality assessment There was not sufficient information to make a more elaborate assessment of quality of care. Hospital based deaths especially maternal deaths are an indicator of quality of care. The total maternal deaths reported in 14 RRHs and large PNFP hospitals was 479 giving a mean death of 34 mothers per hospital per year with a minimum of zero (Moroto) and maximum of 183 (Hoima). Hoima certainly looks an outlier an audit to verify the truth of the data and/or the causes of such a high number of maternal deaths are necessary. If correct, this would mean an 51
74 unlikely high MMR. The maternal mortality reporting system needs to be improved urgently. Overall, hospital case fatality rate was 4.1% (deaths over admissions), with one outlier: Rubaga hospital has 17.9% case fatality. b) Efficiency of use of services Regarding the scale of operation the mean hospital in this group is 316 beds, admits 20,868 patients and has a staff of 297. Generally the RRHs and the PNFP hospitals analyzed have a high rate of utilization Average bed occupancy is 86% compared to last year (2009/10) when it was 93%. Staff productivity is 1,534 SUO/Staff less than that for GHs (1,577). This is due to a more complex case mix and higher skill mix of staff in RRHs compared to the GHs. The average length of stay of 5.0 is the same as in GHs. 52
75 Table 37: Key Hospital Outputs in RRHs and Large PNFP Hospitals Arua Fort Portal Gulu Hoima Jinja Lira Mbale Moroto Mubende Kabale Nsambya St. Mary Lacor Mengo Rubaga Soroti Total OPD 206,090 92,974 77,128 77, , , ,250 48,325 59, , , ,966 36, ,765 99,666 1,633,149 ANC 23,064 6,413 6,429 6,478 7,547 7,804 5,876 1,806 7,081 10,206 15,642 6,933 15,144 14,300 4, ,544 Deliveries 5,335 6,705 4,383 3,687 6,009 4,548 7, ,755 5,754 7,621 3,564 6,130 7,669 4,651 77,158 Immunization 43,413 9,405 44,939 93,771 10,009 16,783 13,249 6,129 9,873 14,376 48,074 23,240 41,976 44,799 14, ,007 FP Visits 6,736 2,178 2,196 2,270 5,803 2,863 6, ,382 9, , ,446 46,406 Beds ,738 Admissions 20,814 23,028 15,896 14,415 25,456 14,941 60,145 9,338 9,110 18,504 17,567 26,396 16,844 18,839 21, ,021 Patient Days 109, ,513 80,433 78, , , ,128 42,185 57,777 97,881 80, ,493 69,966 62,959 97,761 1,458,422 Major Operations 1,738 2,486 1,067 1,976 2,405 10,572 3, ,150 3,275 3,101 3,455 2,943 2,279 2,081 42,114 SUO 568, , , , , , , , , , , , , , ,969 6,254,510 Source: Hospital submissions for AHSPR 2010/11 53
76 Table 38: Selected Efficiency Parameters RRHs and Large PNFP hospitals 2010/11 Arua Fort Portal Gulu Hoima Jinja Lira Mbale Moroto Mubende Kabale Nsambya St. Mary Lacor Mengo Rubaga Soroti Total Staffing Positions by Hospital ,859 Beds ,738 Admissions 20,814 23,028 15,896 14,415 25,456 14,941 60,145 9,338 9,110 18,504 17,567 26,396 16,844 18,839 21, ,021 Deaths , , , , ,701 Patient Days 109, ,513 80,433 78, , , ,128 42,185 57,777 97,881 80, ,493 69,966 62,959 97,761 1,458,422 Average Length of Stay Bed Occupancy Rate 83% 102% 61% 88% 76% 91% 89% 77% 132% 96% 69% 96% 64% 64% 100% 86% Major Operations 1,738 2,486 1,067 1,976 2,405 10,572 3, ,150 3,275 3,101 3,455 2,943 2,279 2,081 42,114 SUO 568, , , , , ,638 1,057, , , , , , , , ,969 6,957,080 SUO / Staff 1, ,820 1,392 1,423 1,400 1,852 2,112 1,790 1, ,320 2,280 1,534 Source: Hospital submissions for AHSPR 2010/11 54
77 Table 39: Summary of Efficiency Parameters RRHs and Large PNFP hospitals 2010/11 Staffing Positions by Hospital (n= 13) Beds (N = 15) Admissions(N = 15) Deaths (N = 15) Patient Days Average Length Of Stay (N = 15) Bed Occupancy Rate (N = 15) Major Operations (N = 15) SUO (N = 15) SUO/Staff (N = 13) Average , , % 2, ,240 1,534 Min , , % , Max ,145 3, , % 10,572 1,057,804 2,280 55
78 2.3.3 General Hospitals a) Inputs Finance Government release to GHs during 2010/11 FY was 5,997,141,000 Ug. Sh. vs a budget of 6,107,088,000. This total to 98% of the budget estimate. Human Resource There is a very wide range of staff numbers in hospitals. According to the new staffing norms a standard public GH should have 190 staff. PNFP and private hospitals with varying bed capacities and workloads reported varying staff sizes and compositions. The staff numbers in GHs ranged from 7 to 318 with an average of 116 staff per hospital. Human resource shortage in hospitals remains a major challenge to service delivery.. In a sample of 26 public general hospitals, the proportion of positions filled ranged/varied from 14-79% with a mean of 55%. Outputs As in the previous years, 5 main outputs have been used as indicators for volume of activity by the hospitals, these are: Admissions, Outpatient visits, Deliveries, ANC and immunization. Table 40: Outputs from the General Hospitals FY 2010/11 Total Number reporting Minimum Maximum Average 2010/11 Average 2009/10 Average 2008/09 Average 2007/08 Beds 9, In patients 546, ,201 7,386 8,472 7,271 3,194 Inpatient days 2,453, , ,846 33,607 38,722 Out patients 3,495, , ,154 45,998 42,455 32,197 33,185 Deliveries 108, ,808 1,544 1,419 1,389 1,465 Major operations 44, , ANC 245, ,542 3,144 3,568 12,197 14,329 Cesarean Section 24, , , Immunization 636, ,043 35,771 8,481 8,730 13,009 13,323 SUO 12,526, , , , , , ,348 Source: Hospital submissions for AHSPR 2010/11. Note that figures for previous years are from Resource Centre 56
79 Hospital output indicators have been summed up in composite units the SUO. With this measure we can compare the volume of output or activity basing derived from the 5 main indicators. The top ten hospitals with the highest outputs are: Iganga, Mityana, Bududa, Busolwe, Tororo, Bwera, Kitgum St. Joseph, St. Kizito Matany, Kamuli Mission and Ishaka. From the information the average for three outputs are down compared to last year (2009/10), these are: inpatient, antenatal and immunization. While the outpatients, deliveries and major operations, including cesarean sections have gone up. Decrease in admissions may be attributable to stock outs and shortage of staff. Some hospitals notably Amudat and Gulu Military Hospital were not able to do cesarean sections. By the time of writing this report however, Amudat hospital started to do cesarean sections following efforts of Doctors with Africa CUAMM and Italian Cooperation to train staff, rehabilitate the theatre and support the hospital to recruit a Medical Officer. Notable is that 24% of all deliveries in the general hospitals were done by Cesarean Section. b) Efficiency of use of services There isn t a significant difference in efficiency indicators in the year 2010/11 compared to the year before. There was a reduction in bed occupancy rate from 74% to 69%, on the contrary there was an increase in SUO per staff in 2010, indicating activities other than the inpatient have had a sizable increase. Again, it has not been possible to analyze efficiency for use of funds because of lack of complete or reliable financial reports. In FY 2010/11, an average hospital had the following indicators compared to the year before (in brackets): Average length of stay 5 (4.6) days; bed occupancy rate 69% (74%); one staff on average was producing 1,577. Although some core activities like inpatient, ANC and immunization decreased, these were compensated the increase in outpatient and deliveries, leading to a net increase in staff productivity overall 1,577 SUO/staff compared to 1,487 the year in 2009/10. Table 41: Selected efficiency parameters for General Hospitals Total Min Max Average 2010/11 Average 2009/10 Staffing Positions by Hospital (N = 71) 8, Total Number of Beds (N = 74) 9, Total Admissions (N = 74) 546, ,201 7,386 8,472 Average Length of Stay (N = 73) Total Min Max Average 2010/11 Average 2009/10 Bed Occupancy Rate (N = 73) 50% 16% 148% 69% 74% SUO / Staff (N = 71) 111, ,876 1,577 1,487 Source: Hospital Submissions for AHSPR 2010/11 57
80 c) Quality of care The information available could not allow an elaborate measurement and comparison of quality of care among hospitals. Hospital based deaths especially maternal deaths are an indicator of quality of care. The total maternal deaths reported in 70 general hospitals were 1,015 giving a mean death of 14.5 mothers per hospital per year with a minimum of zero and maximum of 288. The top outliers need to be audited to verify the truth of the data and the causes of such a high number of maternal deaths. These hospitals and the maternal deaths involved are: Amai 288, Kambuga 190, Nyapea 90, Iganga 43, Naggalama 30 and Mityana Functionality of HC IVs A central feature of a health sub-district in Uganda is a health centre level IV, where there is no hospital to serve a supervisor role. The key feature of the HSD Strategy was that each HSD of approximately 100,000 people would have a Hospital or a Health Centre IV with the capacity to provide basic promotive, preventive and curative services, including Emergency Surgical and Obstetric Services and to supervise and support planning and implementation of services by the lower health units in the zone. Extensive access to such services has been demonstrated to lead to a big improvement in health status indicators even in poorer countries compared to the much wealthier ones. Being a key strategy of the sector, the functionality of Health Centre IVs has been reviewed every year in the last 5 AHSPRs. a) Methodology The District Annual Reports included information on HC IVs with input, management, output and even outcome information. 88 HC IVs from 112 districts provided information of varying degrees of completeness. Functionality was determined by outputs from selected components of the minimum service standards i.e. Maternity (deliveries), Inpatient Blood Transfusion, Theatre (caesarean section, Major and Minor surgery), HCT, PMTCT, ART, Long Term Contraception and Outpatient services. This is similar to the analysis done in the previous financial years. 58
81 b) Level of HC IV Functionality Data for 11 of the 12 functionality indicators was available. There was no data for long term FP methods. Based on the 11 indicators 18 HC IVs scored 100%. Table 42: HC IVs with 11 of the 11 functionality indicators Number HC IV DISTRICT 1. NAMAYUMBA WAKISO 2. BUKASA KALANGALA 3. KALANGALA KALANGALA 4. BUFUMBO MBALE 5. MWERA MITYANA 6. KYABUGIMBI BUSHENYI 7. SSEKANYONYI MITYANA 8. MUKONO.CO.U MUKONO 9. KIGOROBYA HOIMA 10. NABILATUK NAKAPIRIPIRIT 11. BUKWO BUKWO 12. MANJIYA BUDUDA 13. MPIGI MPIGI 14. KOTIDO KOTIDO 15. MIDIGO YUMBE 16. RUGAZI RUBIRIZI 17. KATAKWI KATAKWI 18. KIWANGALA LWENGO Outpatient, HIV Counseling and testing were available in all the HC IVs that submitted information on the services available. Key primary reasons for establishing HC IV were to provide cesarean section and blood transfusion; despite these being cardinal services in the definition of a functional HC IV they are available in only 24% and 26% of the HC IVs respectively. The trend in the last 3 years however is upward for each of these cardinal services as shown in the figure
82 Figure 11: Trends in Caesarean Section and Blood transfusion % providing 30% 25% 20% 15% 10% 5% 0% Trend in Caesarean Section and Blood Transfusion in HC IV 28% 19% 17% 14% 26% 23% 24% 24% 19% 15% Caesarea 2006/ / / / /11 For outpatient, inpatient, deliveries and ART services, the average outputs from each HC IV were 21,028; 1,864; 1,996 and 292 respectively. Note that the number of units reporting for 2010/11 was considerably smaller than in previous years. Compared to 2009/10 many service utilization indicators went down in 2010/11 except, deliveries, HIV counseling and testing, PMTCT and Dental service utilization. Table 42 shows these comparisons. Table 43: Provision of selected key health services by HC IVS 2010/ / / /08 # offering services Average Outputs 10/11 % of reports # offering services Average Outputs 09/10 % of reports # offering services Average Outputs 08/09 % of reports # offering services % of reports OPD 52 21, % ,833 98% , % % Deliveries 80 1,996 92% % % 86 92% HCT 45 4, % 110 3,434 92% 116 2,746 87% 81 87% PMTCT 77 1, % % 116 1,068 87% 85 91% Dental 41 1,007 82% % % 66 71% IPD 76 2,077 99% 80 2,894 67% 90 3,194 67% 65 70% ART % % % 70 75% Minor Operations % % % 58 62% 60
83 2010/ / / /08 # offering services Average Outputs 10/11 % of reports # offering services Average Outputs 09/10 % of reports # offering services Average Outputs 08/09 % of reports # offering services % of reports LTFP % % 38 41% Major Surgery % % % 28 30% C/S % % % 26 28% Blood Transfusion % % % 16 17% Laboratory % % 93 92% Since the main objective of setting up HC IVs was to provide Comprehensive Emergency Obstetric Care (CEmoC) that is being able to provide intervention in case of complications during delivery, which includes the ability to provide a Caesarean Section and Blood Transfusion, HC IVs have been judged functional if they have been able to carry out at least one Caesarean Section. Using these criteria, 24% of the HC IVs were functional in 2010/11 an increase from 23% found in 2009/10. c) Factors affecting HC IV Functionality Just like the previous 3 FYs, there are a number of key issues that are associated with HC IV functionality. These include: presence of appropriate infrastructure and equipment; presence of qualified health workers especially medical officers; and LG management capacity and interest in HC IV functionality. Infrastructure and Equipment There was no sufficient information to analyze infrastructure and equipment components of functionality of HC IVs. Service performance and outcomes 61
84 Service performance and outcomes The bed occupancy rate in 2010/11 declined compared to the year before down from 43% to 38%, in addition there was a reduction in average length of stay form 3 days in 2009/10 to 2.3 days. There was an average of 1,864 admissions in 2010/11. The death rate remained the same as the year before, 0.7%. d) Recommendations The HC IVs are a key mechanism for increasing access to referral facility services and ensuring that the lower units in the health sub-district do perform to their expectation as such HC IVs greatly contribute to universal access to the UNMHCP elements that will directly impact health outcomes. In the year 24% of the HC IVs can be considered functional. The sector needs to devise mechanisms for ensuring that adequate resources and improvements in management capacity are directed towards HC IVs if we are to achieve the maternal & child health MDGs. i) Efforts must be put in place to enable comprehensive assessment of HC IV functionality. The year 2010/11 has had many gaps in information making it impossible to assess all aspects of HC IV. All HC IVs should regularly submit their monthly and quarterly reports to the districts and then to the Ministry of Health to ease the writing up of the annual report. ii) There is need to increase resources for health centre IV particularly, drugs and supplies and human resource since these are the key determinants of effective utilization of services. Differential budgets based on the utilization volumes have to be adopted. The budget for a HC IV fast becomes insufficient once the centre is fully functional. iii) Shortage of critical staff like medical officers, anesthetists, midwives continue to hinder functionality of HC IVs, there is need to address motivational factors like staff housing and other incentives to encourage staff to go and work in the HC IVs. iv) Health care quality indicators in line with those of hospitals need to be developed for HC IVs. 2.4 Assessment of Village Health Team (VHT) Functionality The VHT Strategy represents the commitment of Government of Uganda to promote Primary Health Care in the communities in line with the 1978 WHO Alma Ata Declaration. VHTs are local people who volunteer to serve their communities by carrying out a range of disease prevention and health promotion activities. As of June 2010, the number of districts that had fully implemented (to 100%) the VHT Strategy stood at 51/93 (55%) districts. Additional thirty-nine districts were at different levels of implementation of the VHT Strategy and 3 districts (Kibaale, Mubende and Sheema) had not 62
85 started the implementation at all. During the year under review (2010/11), VHT Strategy was established in 18 additional districts of: Lyantonde, Bullisa, Budaka, Namutumba, Moroto, Kotido, Kaabong, Amudat, Nakapiripirit, Napak, Wakiso, Butambala, Gomba, Mpigi, Kalungu, Masaka, Bukomansimbi and Lwengo. The country now has a total of 69/112 (62%) districts that have fully implemented the VHT Strategy. Functionality of the VHTs Only districts with a proper register of trained VHTs, good coordination and monitoring mechanism are able to state the number of active VHTs as well as those that had abandoned the job. According to information available (2009/10 FY), only 30 districts had registers of functional VHTs as defined by the numbers of VHTs who actively carry-out all, or part of their roles and are regularly report on them to the nearest health facility. Estimates of VHT attrition rates range from 0-50% with the lowest rates reported in districts that have regular refreshers, supportive supervision, and provide incentives. Current information on functionality of VHTs is expected to be routinely obtained through HMIS 2020 due to be rolled out in 2011/12 FY. Challenges in VHT Strategy Implementation Implementation of the VHT Strategy is costly and many districts may not be able to afford given the present level of funding from government. Some districts have many partners supporting VHTs while others have almost none, making it nearly impossible for them to start/expand VHT implementation. There is therefore need to increase funding for VHT implementation. Not all the districts have an up-to-date register of the VHTs trained and therefore cannot precisely assess the proportion of the VHTs who are actively working or those who have fallen out. Printing of the different tools that the VHTs need to use requires huge sums of money which has not been forthcoming. This particular challenge has direct implication to the functionality of VHTs. Experience gained from the implementation of the VHT strategy affirms that there are many ways of motivating VHTs; monetary and non-monetary packages. However a unified approach to motivation of VHTs has remained elusive and the investment in the same is minimal. 63
86 Recommendations The impact of VHTs could be more pronounced if activities were better planned and focused on evidence-based interventions and epidemiological situation of each district. Effective implementation of the VHT strategy requires a strong linkage with mentoring by the health workers from the nearest health facilities. Different partners need to support the VHT Strategy and not to set up parallel and conflicting structures for short term interest. They should also support districts to motivate VHTs, using appropriate methods. 2.5 Conclusion Measured against the monitoring indicators, the health sector has performed considerably well in view of the shortfalls in the required health system inputs which have remained static. Most of the indicators showed an upward trend. This is particularly noted with proportion of health facility deliveries, children under one year receiving 3 rd dose pentavalent vaccine, percentage of households with latrines, per capita OPD utilization and medicines availability. The most notable shortcomings in health system inputs are chronic low under-funding to the sector which affects the procurement of essential health commodities, timely implementation of planned activities and maintenance of an effective work force. 64
87 3 ANNEX This section gives details of progress in implementation of priority activities under the; 1. Planned key outputs by vote function in the MPS 2010/11 2. Uganda National Minimum Health Care Package (UNMHCP) 3. Integrated Health Sector Support Systems 4. Monitoring and Evaluation of the HSSIP 2010/ / Assessment of Performance against Planned Key Outputs in the MPS 2010/11 The planned key outputs and key achievements for FY 2010/11 are outlined under respective vote functions in the tables below. Ranking achievement 40% Red >40% - 80% Yellow >80% Green 1. Infrastructure Development Planned Outputs Key Achievements Rating Comments Health Systems Development i. Theatre equipment installed in 10 HC IVs. Equipment installed in 4/10 Preinstall works done and equipment shipped for 6/10 Late payment of GOU contribution ii. iii. Office extension completed at MoH headquarters. Solar packages installed in Adjumani, Moroto, Mubende, Mityana, Kabale and Kibaale. 95% completed save for ground floor burglar proofing & fixing shelf shutters Equipment installed in 4/6 while contract for 2/6 signed in March % completed in Rukungiri, Kanungu, Luwero & Nakaseke. Procurement delays stalled progress. Procurement delays stalled progress. iv. General rehabilitation carried out in Yumbe hospital. v. Medical wards constructed in Rushere hospital Work completed in 4 (Kabale, Mubende, Mityana & Kibaale)out of 6 districts. Commenced evaluation for Units in Moyo, Buliisa, Gulu, Pader, Soroti & Amolatar. No work done No work done Procurement initiated but not progressed. Procurement initiated but not progressed. 65
88 Planned Outputs Key Achievements Rating Comments Health Systems Development vi. vii. Construction and equipping of HC IVs in Kisozi and Buyiga. Under the Health Systems Strengthening Project supported by the World Bank, 2 RRHs, 17 GHs and 27 HC IVs rehabilitated. These include: RRHs:- Mubende and Moroto. General Hospitals:- Nakaseke, Mityana, Itojo, Apac, Kiryandongo, Masindi, Kitgum, Anaka, Moyo, Nebbi, Kitgum, Kawolo, Entebbe, Buwenge, Bugiri, Iganga, Moyo, Nebbo, Pallisa and Bukwo. HC IVs: - Kasanda, Kiganda, Ngoma, Mwera, Kyantingo, Kikamulo, Kabuyanda and Mwizi. Regional Referral Hospitals No work done 80% revision of standard designs for HC II RRH progressing; Site surveys by Consultants at beneficiary facilities completed; Tenders for procurement of medical equipment submitted to IDA as scheduled; Evaluation of bids for procurement of vehicles completed Procurement delays. Contracts signed on 2 nd June Construction works planned for second half 2011/12 i. Finalise development plans for RRHs ii. Functionalise Mubende and Moroto hospitals as RRHs Gulu 80% Information not available Mubende and Moroto hospitals functionalized as RRH iii. Construction of residential houses in 6 hospitals iv. Construction of roads and walk ways in 9 hospitals v. Construction of incinerators and VIP latrines in 6 hospitals vi. Completion of on-going construction and rehabilitation in 11 hospitals vii. Procurement of machinery, equipment, furniture and fixtures undertaken in 12 Gulu stalled on ground floor Fort Portal at 60% progress Lira hospital on schedule Ultrasound units, Mobile X-ray, Floroscopy unit, protective screen, CR system supplied and Partial information Information not available Information not available Information not available Partial information 66
89 Planned Outputs Key Achievements Rating Comments Health Systems Development hospitals viii. Vehicles procured in 12 hospitals installed in Fort Portal, Lira, Mubende and Hoima RRHs Staff shuttle for Lira Information not available Activities under the Support to the Health Sector Strategic Project (SHSSP) SHSSP is a five year project, worth 33million dollars commenced in FY 2007/08 and during the Financial Year under review, the project was in its 4 th year of implementation. i. Finalization of redevelopment of Mbarara Referral Hospital (phase 1) ii. Construction and rehabilitation of 39 HCs in the 9 districts of South Western Uganda (Mbarara, Isingiro, Ibanda, Kiruhura, Bushenyi, Rukungiri, Kanungu, Ntungamo and Kabale) iii. Completion of construction of 7 Mental Health Units at Regional Referral Hospitals By end of FY, Mbarara hospital re-development which is scheduled to be completed by 1 Nov was about 78% complete. Completion status for rehabilitation of the 39 HC by the end of the FY was as follows: o 20 HC completed and handed over (51%); o 11 HC were over 80% complete (28%) and, o 8 HC were between 60 80% complete (21%). The 19 HC are therefore behind schedule for reasons given in the comments column. The contract completion date for the HCs is 1 October Construction of the 7 mental health units was completed and commissioned during the FY and Work is progressing on schedule. The causes of delay included: Delay in clearing payment of VAT for contractors had a negative effect on the progress of work. Contractors weak financial capacity Bad sand from local quarries leading to re-doing cracked floors in 8 facilities; Long haulage distances of materials under difficult and mountainous terrains and bad road network especially in Kabale, Kanungu and Rukungiri. 67
90 Planned Outputs Key Achievements Rating Comments Health Systems Development all the units are in use (100%). iv. Equipment of all newly constructed and rehabilitated HCs v. Train staff in RH and Mental Health skills to improve their capacities to manage common conditions Medical equipment and furniture for constructed / rehabilitated facilities was procured on schedule, delivered and commissioned. All planned and on-going programs training programs funded by the Project (Inservices, Basic and Post Graduate) were carried out as planned Where the HC rehabilitation was not yet complete, the HCs however, were advised to use the new equipment in the old / existing HCs as they await completion of the rehabilitation works. This was mainly possible because of regular releases of funds from GOU / MOFPED (counterpart funding) and from the ADB. There was varied performance in the various health infrastructure development projects. Notably projects directly funded by GoU registered much slower progress than development projects funded under SHSSPP and Uganda Health Systems Strengthening Project (UHSSP). If better performance is to be registered in this and other areas in future, procurement planning and delays experienced during the procurement processes need to be anticipated and measures put in place to address them. 2. Health Care Service Delivery Clinical and Public Health Planned Outputs Achievements Rating Comments i. Indoor residual spraying carried out in 53 districts IRS was done in 10 / 53 districts in Northern Uganda (Apac, Oyam, Kole, Pader, Agago, Kitgum, Lamwo, Gulu, Amuru and Nwoya) with good results. A total of 869,861 / 899,716 (96.7%) houses were sprayed with a total population of 2,673,427 / 2,756,339 (97.0%) being protected. 68
91 Planned Outputs Achievements Rating Comments ii. Distribution of million LLINs Over 7.25 million LLINs were procured through the Voluntary Pooled Procurement (VPP) mechanism of the Global Fund and distributed to sub-county level Delayed reporting on the phase 1 distribution and irregular/prolonged procurement procedures. iii. The child survival strategy and road map for reproductive and maternal health rolled out to 40 districts. Roadmap was rolled out to 20/40 districts. Note that all districts are implementing activities that contribute to the targets specified in the roadmap. iv. VHTs established in 40 additional districts. VHTs established in 18 additional districts. Districts with 100% coverage are 55 (49%). Inadequate funding has restricted establishing new VHTs. Inadequate funds to scale up training of VHTs v. The Kampala Declaration on Sanitation scaled up in 40 districts. Scaled up in 7/40 districts Inadequate funds vi. The results of the NCD survey disseminated at national and district level. Not done No funds allocated Performance against the key outputs under the for the Clinical and Public Health vote function was overall below 80% with worst performance for IRS, scaling up of the KDS and NCD where the survey has planned but not been conducted for 2 consecutive years now. 69
92 Cancer Services Uganda Cancer Institute Planned Outputs Achievements Rating Comments i. 15,000 cancer patients treated Effecting diagnosis of 31,566 Successful outreach and supported patients Effecting investigation of 31,566 patients and providing support to 31,566 patients by year end Cancer awareness programs boosted patient numbers. ii. Completion of re-modeling cancer administrative block and medical ward On-going remodeling of Cancer Administrative Block and Medical Ward and New 6-level Ward. Completion of Cancer ward in current FY. UCI was able to attend to more clients than planned however, was not able to complete remodeling of the administrative block and medical ward as planned. Heart Services Uganda Heart Institute Planned Outputs Achievements Rating Comments i. 80 open heart, 100 closed heart and thoracic surgeries, 10,000 echocardiograms, 10,000 ECGs, 50 stress tests and 80 endoscopy exams performed. 30 (37.5%) open heart surgery, 163 (163%) closed heart surgery, 5,800 (58%) ECHO, 5,075 (50%) ECGs, 25 (50%) stress tests, 28 (35%) endoscopies performed. Higher utilization by pediatric patients was responsible for high performance of the closed heart surgery and on the other hand limited funding and equipment breakdown was responsible for underperformance. ii. 180 ICU/CCU patients admitted. ICU 146, CCU 236 Need increase in specialized staffs and funding to cater for high costs of consumables. Uganda Heart Institute performed fairly but limited by frequent breakdown of equipment and lack of specialized staff compounded by inadequate funding for the high cost of consumables. 70
93 Uganda Blood Transfusion Services Planned Outputs Achievements Rating Comments i. Collection, testing and distributing 200,000 units of blood 187,828 units of blood collected; ii. 6,000 blood collecting sessions 4,511 blood collection sessions iii. 250,000 blood bags procured 150,000 procured Stock outs experienced due to inadequate funding iv. Construction of blood banks in Gulu and Fort Portal Not done Inadequate funding v. Quarterly support supervision visits to Regional Blood Banks 4 supervision visits conducted to the 7 Regional Blood Banks There was no support supervision due to lack of funding. vi. Mobilization and recruitment of new blood donor groups Mobilization in schools and community High fuel costs leading to scaling down of activities; the prevailing food crisis; the negative publicity by the media of the walk to donate exercise. National Referral Hospitals Mulago and Butabika Planned Outputs Achievements Rating Comments i. Conduct 46 general outreaches and attend to 2,400 patients ii. Conduct 51 forensic outreach clinics 46 outreach clinics conducted, 2,396 patients attended to by Butabika Hospital Forensic outreaches conducted 629 patients were resettled to their homes Inadequate funding iii. Construction of 4 staff units ¾ staff units were constructed iv. Finalisation of the strategic and development plan Strategic and Development plan for Mulago finalized 71
94 3. Monitoring and Evaluation Planned Outputs Achievements Rating Comments Sector Monitoring and Quality Assurance i. Quarterly sector performance reviews 3 Quarterly Performance reviews were held. Quarter 1 and 2 reviews held jointly (Mid-year review) due to delayed release of funds ii. Coordinate Senior Management (SMC) Committee meetings 9/12 SMC meetings held Among the policy issues discussed and forwarded to HPAC and Top management for approval included; the JAF 4 targets and action points, restructuring the basic package TWG into separate 4 separate TWGs to improve their effectiveness, the revised HMIS tools and the UNEPI annual performance report that was endorsed and forwarded to GAVI secretariat. Observed improved attendance of SMC meetings iii. Quality assurance activities standards and guidelines developed and disseminated iv. Support supervision visits to Local Governments Launched the Uganda Clinical Guidelines (UCG) 2010; disseminated 9,000 copies to all 112 districts. Draft HSSIP 2010/11-14/15 M&E Plan developed Draft Quality Improvement Framework and Strategic Plan developed. 4 Area Team visits conducted in all 13 RRHs and the 112 Local Governments. Feedback to the district leadership, MoH SMC, HPAC and STM. 4 th quarter visit funded by the ICB project v. Inspection of health facilities Conducted in 59 districts as planned. Noted improvement in duty attendance by qualified staff 72
95 4. Health Research Planned Outputs Achievements Rating Comments i. Uganda Demographic Health Survey 5 coordination Coordination meetings conducted UDHS -5 data collection started June 2011 ii. Research in the areas of HIV, malaria, plague, measles and polio. National HIV Sero Survey in progress. Data collection completed. Malaria program review Report to be completed 2011/12. No research agenda for MoH EPI Program review iii. UNHRO activities Three priority issues were addressed: Access to skilled delivery services by for pregnant women. Rational treatment of malaria. Task shifting to address staffing challenges in the sector. 5. Pharmaceutical and Other Supplies Planned Outputs Achievements Rating Comments i. Introduction of essential medicines kit for HC IIs and IIIs. Done New Essential Medicines List of Uganda, Laboratory List and Supplies lists were developed using a consultative process Kit reviewed every six months as agreed initially. Lists to be printed 1 st quarter of the FY 2011/2012 ii. Implementation of the MOU for planning and monitoring of medicines procured and supplied MOU signed in April 2011 There was delay in MoH signing MoU. Monitoring to begin in Quarter 2 of 2011/12 73
96 Planned Outputs Achievements Rating Comments FY. iii. iv. Monitoring of medicines and health supplies Mentoring of hospitals and health facilities country wide on quantification and ordering of EMHS. Bi monthly stock status reports made at national level. Annual survey on the tracer items conducted. Vendors for system development have been evaluated 442 facilities mentored and supervised in the FY 2010/2011 Securing NMS concurrence had to be completed. There was delay in MoH signing MoU with the supporting partners. Support received from other Implementing Partners e.g. over and above GoU budget v. Periodic review of the Push Policy on distribution of EMHS. Review conducted for the period Nov 2010 April Review report (May 2011) available and shared. Kit review includes a detailed look at the strengths and challenges of the policy which is implemented through the kit distribution mechanism See (i) above. vi. Preparation of the Uganda Food and Drug Administration Bill and submission to Parliament. Memo submitted to Cabinet in the FY 2010/2011 which referred it to the National Planning Authority to coordinate the various sector consultations NPA report due to be submitted to cabinet 1 st quarter of FY 2011/2012 vii. Medicines and health supplies worth UGX bn procured and distributed to the national regional and district facilities. Medicines and Health Supplies worth (89.8% of projection) billion shillings procured and distributed A total of UGX billion was not disbursed/ released by MoFPED. viii. Improve supply chain management for essential medicines, vaccines and other health supplies. NMS introduced the last mile distribution to all health facilities through third party logistics distribution agencies. Supplies getting to health facilities faster than before. 74
97 6. Policy, Planning and Support Services Planned Outputs Achievements Rating Comments i. Finalization of the Second National Health Policy ii. Finalization of the HSSIP 2010/ /15 Completed and launched Completed and operationalised The HSSIP M&E plan has been finalized and is due for launching at the JRM Oct iii. iv. Produce Budget framework paper 2010/11 Produce the Ministerial Policy Statement 2011/12 Completed Completed v. Produce the audit and accountability report Audit reports submitted to PS Delayed accountability by implementers vi. Produce the health sector performance report 2009/10 Completed vii. Conduct efficiency studies Data collection finalized viii. Review resource allocation criteria Done ix. Review Social Health Insurance Scheme. Technical analyses of the following were done; Benefit package, Accreditation criteria, Capacity needs, Status and obstacles and prospects of community health insurance, x. Policy consultation 2 quarterly Reviewed 3 policy documents (Malaria strategic plan, Mental health policy & EPI program review Inadequate facilitation Lengthy development and review processes xi. Training in leadership and management (UHSSP) Curricula developed and Health workers to train identified Training to start 2011/12 xii. Training in leadership and Not done Delays in project 75
98 Planned Outputs Achievements Rating Comments management (ICBP) implementation. xiii. Enhancing Public- Private Partnership PPPH Policy was endorsed by TMC is lined up for endorsement by Cabinet. Process stalled now for 2 years xiv. Enhancing budget monitoring in the sector Done but not as planned Inadequate funding xv. Inter-ministerial collaboration with related sectors such as water and sanitation Cabinet memo has been drafted to be submitted to the cabinet secretariat. Process required wide consultation. 7. Human Resources for Health During the HSSIP 2010/ /15 the health sector is committed to attaining and maintaining an adequately sized, equitably distributed, appropriately skilled, motivated and productive workforce in partnership with the private sector, matched to the changing population needs and demands, health care technology and financing. Planned Outputs Achievements Rating Comments i. Recruit 800 health workers Recruited 1,006 health workers 13 Hospital Directors appointed for RRHs Inducted Hospital Directors and Hospital Administrators in all RRHs ii. Carry out validation of health workers in the newly upgraded RRHs of Mubende and Moroto and newly upgraded structures of UCI and UHI. Done Some staff promoted. iii. Launching of the HSC regulations for health workers. Regulations made Not launched due to lack of functional HSC iv. Performance and career enhancement training for members and staff. Had 3 day training. A number of staff sponsored. v. Supervision of 50 districts and 6 RRHs. 25 districts and 4 RRHs supervised Monitoring visits conducted to all PNFP training institutions (Nyakibale, Mutolere, Kisiizi, Kagando, Ngora, Kamuli, Nsambya, Rubaga, Ishaka, Matanyi and Kuluva) vi. Support District Service Commissions. Conducted 6 technical visits Number determined by demand from districts 76
99 3.2 The Compact for implementation of the HSSIP 2010/ /15 Table 44: Progress in implementation of the Country Compact 2010/ /15 during 2010/11 FY No Indicator Measurement Achievement Ranking 1. Planning and Budgeting i. MoH Annual Workplan reflecting stakeholder contribution (all resources on plan) Annual Workplan Analyzed and Report submitted to 1 st HPAC of FY Although this report was not produced for the 1 st HPAC of FY 2010/11, analyses of record of HPAC discussions show no record of discussion of the MoH annual work plan. ii. All new sector investments are appraised by SBWG Reports from SWBG on appraised Projects submitted to HPAC biannually Updating the MoH/DP Project Database The following projects were discussed and reports submitted to HPAC for endorsement; Global fund for sanitation Italian support for HSSIP TB laboratory strengthening GAVI ISS and HSS All were endorsed by HPAC. iii. iv. All planned procurements reflected in the Comprehensive Procurement Plan Response to the Auditor General s Report v. Implementation of Harmonized TA Plan Quarterly assessment of implementation of procurement plan to HPAC Response to AG s report presented to HPAC Progress towards implementation of agreed TA Plan 4 reports from FY 2010/11 due Analysis of Planned vs Actual procurements was not available due to lack of a comprehensive procurement plan. Although MoH PDU produces monthly reports to PPDA, the quarterly reports were not submitted to HPAC. It is proposed that since the AG s report is presented at JRM on October, MoH holds internal discussions on the recommendations and presents the action plan to the HPAC of Jan/Feb No follow up 2. Monitoring Programme Implementation and Performance i. Area Team Visits Quarterly Reports Presentation of reports to HPAC within 30 days after completion of Area Team visits An assessment of compliance due for FY 2010/11 Reports were presented to HPAC 77
100 No Indicator Measurement Achievement Ranking Visits were made as planned Propose to include in the future, a report on how the recommendations from the visits have been dealt with ii. MoH Quarterly Performance Assessment 3 quarterly performance reviews took place The 4 th could not take place due the JRM. The plan is to do 3 next FY due the same reason. iii. Technical Review Meeting Present Report from TRM to HPAC by 30 April TRM for FY 2010/11 not held iv. Technical Working Group meetings Target 80% of TWG meetings held The performance of TWGS was below average TWG reports were received in 4 out of 11 (36%) SMC meetings v. Annual Health Sector Performance Report vi. Submission of Annual Report to OPM Submission of Final Report by 30 th September Submission to OPM by 30 th September In progress Process not budgeted for Report submitted on time 3. Policy Guidance and monitoring i. Senior Management Committee Proportion of planned meetings held 75% of the scheduled 12 meetings took place ii. iii. Health Policy Advisory Committee meetings Country Coordinating Mechanism (CCM) 92% (11/12) of the scheduled meetings took place 5/12 of the meetings occurred on the scheduled dates. 200% performance for CCM meetings Attendance of at least ¾ of meetings by all members Minutes available for verification. Attendance of at least ¾ of meetings by all members HPAC was postponed a couple of times for lack of quorum. There were 8 meetings instead of the originally scheduled 4 meetings but none occurring on the scheduled dates. All extra CCM meetings were related to resource mobilization activities for proposal development. 78
101 Although MoH PDU produces monthly status reports on procurement, the quarterly review reports under finance and administration only captures procurement challenges. There was no published meeting schedule for TWG meetings and therefore there is no benchmark to compare with the TWGs that met. Some TWGs met more frequently than others. 75% of the scheduled 12 SMC meetings took place with 4 (33.3%) of the 12 meetings taking place on the scheduled dates. Attendance for SMC meetings ranged between 30% and 75% with an average of 55%. 25% of the meetings did not take place due to dates coinciding with Area team visits. Supervision Monitoring Evaluation and Research (SMER), Sector Budget, Maternal and Child Health (MCH), Human Resources for Health (HRH), Medicines and Pharmaceutical supplies and to some extent Private Public Partnership for Health (PPPH) TWGs were more consistent in reporting. There was no report received from Hospitals, Infrastructure TWGs. In May 2011 Basic Package TWG was dissolved into five TWGs: MCH, Environmental Health and Health Promotion, Nutrition, Non Communicable Diseases (NCD) and National Disease Control (NDC). Of these NCD, NDC and MCH submitted once (1 out of 11) 9 % after transforming into individual TWGs. The MOH attendance in HPAC meetings ranged between 9% to 73% with an average of 48%, while development partner s attendance ranged between 75% and 100% with an average of 75%. the DHO representative was consistent throughout the period under review. Mulago and Butabika hospitals did not attend any meeting despite regular reminders. The regional referral hospitals and general hospitals did not nominate representatives to HPAC and therefore no attendance was registered. The participation of development partners and civil society can be characterized as high. However when it came to other line ministries, departments and agencies, while the MoFPED showed consistency, the representatives from other line ministries did not attend HPAC and the CCM despite several reminders. The poor attendance is attributed to lack of clear understanding of the mandate and role of these committees. This partly demonstrates the weak intersectoral collaboration. 79
102 3.3 Delivery of the Uganda National Minimum Health Care Package (UNMHCP) Because of the limited resource envelope available for the health sector, the NHP II recommends that a minimum health care package be delivered to all people of Uganda. This package consists of the most cost-effective priority health care interventions and services addressing the high disease burden that is acceptable and affordable within the total resource envelope of the sector. The UNMHCP consists of the following cluster; (i) Health Promotion, Disease Prevention and Community Health Initiatives, including epidemic and disaster preparedness and response; (ii) Maternal and Child Health (iii) Prevention, Management and Control of Communicable Diseases and; (iv) Prevention, Management and Control of Non-communicable Diseases. This section analyses progress in implementation of the UNMHCP under the various clusters in relation to the relevant HSSIP 2010/ /15 core indicators, lead programme indicators of focus during 2010/11 FY, annual workplan indicators (process implementation), main achievements, challenges and recommendations Cluster 1: Health promotion, disease prevention, and community health initiatives Health promotion and education The key priority for health promotion and education is promoting individual and community responsibility for better health. Lead programme indicators Standards and guidelines (including criteria for gender sensitivity) for the production and delivery of IEC messages developed and disseminated among institutions by 2011/2012. The proportion of districts with trained VHTs increased from 31%to 100% by 2014/2015. The proportion of health facilities with IEC materials maintained at 100%. Annual workplan 2010/11 indicators Establishment and training of VHTs in 40 additional districts Motivation of VHTs i.e. Training; Recognition of VHTs; Provision of protective wear; Activity related incentive; transport for VHTs in 40 districts 80
103 Recruitment of full time Public and Media Relations Officer Inventory of VHTs Main achievements VHTs trained in 18 districts of Lyantonde, Bullisa, Budaka, Namutamba, Moroto, Kotido, Kaabong, Amudat, Nakapiripirit and Napak, Wakiso, Butambala, Gomba, Mpigi, Kanungu, Masaka, Bukomansimbi, Lwengo. Support supervision and monitoring of VHTs conducted in 40 districts Distributed 110,000 bicycles to VHTs Social mobilization to control emergencies and epidemics carried out in 75% of the districts (Cholera, H1N1, Influenza, Yellow Fever outbreak and vaccination, Hepatitis E, Ebola, Nutrition promotion and Child Days). Developed and disseminated the reviewed VHT training materials, strategy, operational and supervision guidelines. Implemented MoH media relations programmes (press releases, media coverage, press conferences) Main challenges Inadequate funding to train VHTs countrywide Limited public education through the media Lack of adequate IEC and VHT training materials Restricted human resource structure for health education staff in the districts Recommendations Intensify training, supervision and monitoring of VHTs Develop a mechanism to motivate and make VHTs functional Secure funding for public awareness and education through the media Support districts and lower lever social mobilization and advocacy activities. Intensify technical support supervision and monitoring Revitalize MoH/HP&E printing unit There has been dismal progress in functionalization of VHTs, though supervision of VHTs was carried out as planned. Social mobilization during outbreaks was adequately covered, this could have been a result of the successful recruitment of a full time Communication Specialist. Other social mobilization activities are hampered by inadequate funding and restricted staffing for health education staff in the districts. 81
104 Environmental Health The environmental health component aims at contributing to the attainment of a significant reduction of morbidity and mortality due to environmental health and unhygienic practices and other environmental health related conditions. Core HSSIP Indicator Latrine coverage (71% 2010/11) Lead programme indicators Percentage of households with access to safe water. The proportion of districts implementing water quality surveillance and promotion of safe water chain/consumption increased from 30% to 50% by the year The proportion of households with hand washing facilities with soap increased from 22% to 50% by Annual plan 2010/11 top indicators Enforcement of Public Health Act Enacting sanitation ordinances and by-laws Promotion of hand washing with soap and observance of safe water chain in 10 districts Implementation Community Led Total Sanitation (CLTS), Kampala Declaration on Sanitation (KDS) scaled up in 40 districts. Main Achievements National latrine and hand washing coverage to increased from 69.7% to 71% and 22% to 25% respectively. Advocacy meetings on Kampala Declaration on Sanitation & the use of PHAST tools held for participants from 7 districts of Budaka, Bududa, Bulambuli, Sironko, Butaleja, and Kayunga & Pallisa. One hundred fifty six (156) district staffs from 13 districts were trained in processes of enactment of ordinances and bye-laws. The staffs were drawn from the districts of Kiboga, Nebbi, Namutumba, Mbale, Kibaale, Kiruhura, Lwengo, Sembabule, Kalungu, Masindi Nakasongola, Luwero and Buikwe. However, only 39 districts are at various stages of passing ordinances and bye-laws. Support supervision and monitoring carried out in 13 districts focusing on hand washing with soap, sanitation and hygiene new initiatives, Open defecation free villages (ODF), new latrines construction in the districts of Kamuli, Mayuge, Namayingo, Busia, Bugiri and Namutumba Buyende, Kaliro, Iganga, Jinja, Masaka, Rakai and Lyantonde. The division has had a series of meetings with the Sanitation and Hygiene sub-sector Working Group. This has yielded good results with the creation of a Sanitation and Hygiene budget line in the Ministry of Finance Planning and Economic Development. 82
105 Main Challenges Some planned activities like purchase of Public Health Legislation books, water quality testing kits for districts, motor cycles, lactometers, uniforms and protective wear and climate change/health awareness campaigns were not fulfilled due to limited funding. There are many gaps in environmental health staffing at all levels causing inefficiencies in the areas of environmental health service delivery. Only 10% of the ADHOs in charge of Environmental Health positions have been filled in the districts. Failure of Local Governments to formulate ordinances and by-laws on environmental health and ensure that they are enforced. Recommendations for 2012/13 Increase funding to enable implementation of planned activities through the budget line created in the MoFPED. Procure transport means and other equipment and accessories for the various levels of service delivery Fast track the process of making and implementation of sanitation ordinances in Local Governments Overall there is minimal improvement in the implementation of environmental health and sanitation interventions at district and community level e.g. rolling out of the Kampala declaration on Sanitation which is long overdue. Local Governments are not effectively playing their role in formulation of ordinances and bye-laws on environmental health. The current inertia will not contribute to the component aim of significant reduction of morbidity and mortality due to environmental health and unhygienic practices and other environmental health related conditions Control of Diarrheal Diseases Diarrheal diseases including acute watery diarrhea that is not cholera, dysentery and persistent diarrhea are mainly due to poor sanitation, low safe water coverage, poor domestic and personal hygiene practices and mass movement of populations. The main objective of the CDD component is to strengthen initiatives for control and prevention of diarrhea at all levels. Lead programme indicators of CDD The incidence of annual cases of cholera reduced from 3/100,000 to 1.5/100,000 by 2014/
106 The incidence of annual cases of dysentery reduced from 254/100,000 to 150/100,000 by 2014/2015. The cholera specific case fatality rate reduced from 2.1% to <1.0% by 2014/2015. The dysentery specific case fatality rate reduced from 0.08% to 0.01% by The acute watery diarrhoea specific case fatality rate reduced from 0.9% to 0.4% by Annual plan 2010/11 top indicators for CDD Training and capacity building for service providers; 15 District workshops (one per district). Policies, laws, guidelines and strategies; updating CDD guidelines. Technical Support, monitoring and evaluation of service providers and facilities; CDD supervisory visits to all districts at least twice a year. Coordination; inclusion of zinc and oral rehydration salts (ORS) on the essential medicines list. Main CDD achievements 2010/11 Training and capacity building for service providers. - Workshops on diarrhoea prevention and treatment were conducted for facility based health workers in two districts (i.e. Mubende and Mityana). - A workshop on quality of care in diarrhoea case management was conducted for facility based health workers in Fort Portal (participants were from the districts of Bundibugyo, Kabarole, Kamwenge, Kasese, Kyegegwa and Kyenjojo) - Workshops on diarrhoea prevention and treatment were conducted for drug shop attendants in five districts (i.e. Jinja, Mukono, Masaka, Kyenjojo and Koboko). Policies, laws, guidelines and strategies - Draft guidelines on management of diarrhoeal diseases were developed as a guide for health workers; and Guidelines on quality improvement in diarrhoea case management with emphasis on enhancing use of low Osmolar ORS & zinc supplementation were developed. Technical Support, monitoring and evaluation of service providers and facilities: - Control of Diarrhoeal Diseases (CDD) technical support supervision visits were carried out in 54 out of the 112 districts. Other districts will be prioritised during FY 2011/2012 Coordination; inclusion of zinc on the national essential medicines list. Low osmolar oral rehydration salts (ORS) and zinc are now on the National Essential Drugs List. They are stocked by the National Medical Stores and Joint Medical Stores and are available for health facilities to requisition and use in the management of diarrhoeal diseases in accordance with the national diarrhoea treatment policy and guidelines. 84
107 Main challenges 2010/11 Inadequate knowledge and practices of health workers regarding the current diarrhoea treatment policy and guidelines Inadequate funding for required supplies and operations Inadequate access to safe water and low latrine coverage and use Recommendations for annual plan 2012/13 Capacity building for facility based health workers and VHTs covering all districts. Technical support supervision covering all districts Funding for supplies and operations enough for the needs of all districts Most of the planned activities for control of diarrhoeal diseases were carried out. There is need to ensure integration of CDD activities with health promotion and environmental health divisions to sustain the gains School Health The School Health Programme aims at improving the health status of the school children, their families and teachers and to include appropriate health seeking behavior among this population. It is expected that the school health programme will improve the health of school children, reduce dropout rates and increase school performance. Lead programme indicators The % of schools in Uganda providing basic health and nutrition services increased to 25 % by The % of primary and secondary schools with safe water source within 0.5 km radius of the school increased from 61% and 75% resp. to 80% by The % of schools with pupil per latrine stance ratio of 40:1 or better increased from 57% to - 70% by Annual plan 2010/11 top indicators (implementation) Trainers of Trainers workshops on school health component held in 30 districts Hold a workshop to discuss Draft School Health Policy Conduct School Health support supervision in 8 districts Main achievements 2010/11 In order to revitalize and strengthen the organization and management of the school health program, a Medical Officer was assigned the responsibility to head the unit 85
108 TOT conducted on School Health component conducted in 6 districts in Lango sub region. (Aleptong, Otuke, Kole, Amolatar, Dokolo and Oyam districts) In conjunction with Ministry of Education and Sports (MOES), and with support from United Nations Fund for Population Activities (UNFPA) terms of reference for a consultant to review the draft school health policy and align with NDP, HSSIP and MOES were drafted, shared with MCH cluster and plans to recruit a consultant are underway. Conducted support supervision in 7 Districts of Kiryandongo, Nakasongola, Luwero Pallisa, Bugiri, Budaka & Mbale supervised Main challenges 2010/11 Understaffing in the school health unit makes it difficult to roll out the program and coordinate implementation Lack of standards for school health program to guide implementation by districts, development partners and schools Inadequate reliable local health data on school health makes it difficult to design appropriate interventions. Recommendations for annual plan 2012/13 Accelerate the recruitment of staff for the school health unit District capacity for reporting, management and use of school health data for planning and implementation at should be strengthened. Advocacy for school health programme needs to be stepped up to ensure leadership support and commitment mostly at district level. Strengthen collaboration between the Ministry of Health and Ministry of Education. Capacity for implementation of the School Health Programme was strengthened through assignment of a Desk Officer. The development of the School Health Policy and guidelines should be expedited to ensure that all stakeholders are equipped with the guidelines and tools for programme implementation. There were dismal activities geared at expanding the school health and nutrition programme and expansion of the provision of clean water and improved sanitation to schools Epidemic Disaster Prevention, Preparedness and Response The MoH is mandated to play a central role in the control, coordination and management of disease outbreaks. The EDPPR unit is responsible for prevention, early detection and prompt response to health emergencies and other diseases of public health importance. 86
109 Lead programme indicators The proportion of suspected disease outbreaks responded to within 48 hours of notification increased from 52% to 80%. The proportion of districts with functional epidemic preparedness and response committees increased from 76% to 100%. The proportion of districts with epidemic preparedness plans increased to 100%. The timeliness and completeness of weekly and monthly surveillance reports maintained at greater than 80%. Annual plan 2010/11 top indicators (implementation) All districts under surveillance 30 districts oriented to prevent and control epidemics and other public health emergencies Number of technical supervision visits conducted Number of guidelines on prevention and control of epidemic and public health emergencies disseminated Timeliness and completeness of weekly surveillance reports Main achievements 2010/11 During the period, July 2010 to June 2011, the MoH supported LGs to timely and effectively respond to 100% of the 12 major outbreaks. Most commendable was the response to the Ebola epidemic. Revised Standard Case Definition Built Epidemic Preparedness and Response capacity in 30 districts IDSR was carried out and the timeliness of weekly reporting is 82% and completeness is 86% Main challenges 2010/11 Weak laboratory network Inadequate human resource and lack of substantive district surveillance officers Weak communication channels intra-district and district to centre Recommendations for annual plan 2012/13 Merge surveillance and response for better coordination Focus on gaps for IHR compliance by working with partners Provide feedback on surveillance data to districts through print media Set up a revolving fund for immediate access in case of a reported outbreak for prompt response and avoid spread of the disease During the period, the majority of the reported outbreaks were due to Yellow Fever 41.7% (5/12) displacing cholera which accounted for 50% (20/40) of the outbreaks reported in 2008/ Yellow Fever re-emerged after four (4) decades without cases being reported in the country. The other outbreaks reported during the period included: cholera 25% (3/12); Ebola 87
110 8.3% (1/12); Polio 8.3% (1/12); Nodding disease 25% (3/12), rabies, hepatitis E virus, and protein energy malnutrition (See details in Annex 3.9) Of the 12 outbreaks reported during July 2010/ June 2011, 41.7% (5/12) of the outbreaks are currently ongoing and these include: (a) Rabies in Bundibugyo, (b) Nodding disease in Kitgum, Pader and Lamwo, and (c) Hepatitis E Virus in Kaabong. Yellow Fever Yellow Fever was the most frequent outbreak reported during July 2010/ June It accounted for 41.7% (5/12) of the outbreaks reported during the period. A total of 273 suspect Yellow Fever cases including 58 deaths (Case Fatality Rate 21.3%) were reported from 14 districts in Northern Uganda. A total of 13 cases were confirmed to have Yellow Fever from the five the districts of Abim, Agago, Pader, Kitgum and Lamwo. A vaccination campaign was conducted during the last week of January 2011 targeting all persons aged 6 months and above in the districts of Abim, Agago, Kitgum, Lamwo and Pader. The overall Yellow Fever immunization coverage in the five districts was 80%. A countrywide Yellow Fever risk assessment is underway to inform the Yellow Fever vaccination policy in Uganda. Yellow Fever case based laboratory backed surveillance is also being revitalized in the country. Polio This outbreak started on September 20, 2011 with a total of four (4) cases being confirmed from Bugiri district. Before the outbreak, Uganda had been polio free since May 20, 2009 and had been removed from the active polio outbreak list in December The cases originated from Nawansonga village in Kithodha Parish of Bulesa Sub County. Wild Polio Virus (WPV) Type 1 genetically linked (97.46%) to the WPV isolated in Turkana region, North West Kenya on 3 rd February 2009 was isolated. Supplemental Immunization was implemented in 48 high risk districts in North East, East and Northern Uganda using Monovalent OPV (type1). In the long term, control of polio will rely heavily on improved routine coverage. Ebola During the period, suspect viral hemorrhagic fever cases were reported from 11 districts but only one district (Luwero) had an Ebola case confirmed on May 13, The outbreak started on May 1, 2011 with the index case being confirmed to have Ebola. A total of 25 contacts were identified, followed up and investigated but just one contact (the brother of the deceased) tested positive for Ebola Ig G. The outbreak was declared over on June 17, Cholera Though three (03) outbreaks were reported during the period only two (2) were confirmed to be cholera. Two small outbreaks of suspected cholera were reported from Hoima in June
111 with 10 cases and no deaths; while the other outbreak was reported from Bundibugyo with 29 cases and 5 deaths. The outbreak in Nakapiripirit was relatively big with 217 case and 10 deaths (CFR 4.6%) CFR is 1% expected in well managed outbreaks. The outbreak spread from the neighboring district of Amudat with the initial cases being reported on October 18, The affected sub-counties included: Kakomongole, Nakapiripirit Town Council, Namalu, Lorege, and Lolachat. Latrine coverage was estimated at 3% and safe water coverage at 40-60% in the district. Protein Energy Malnutrition (PEM) The cases were reported from Namutumba district starting June 2011 among children less than five years. It was established the hailstones destroyed crops during March 2011 hence there was food scarcity in the district in the subsequent months forcing homes to feed children on alternate days on cassava bread and vegetables. A team from the MoH supported the district to set up therapeutic treatment centres where assessments and treatment is being undertaken. Head Nodding Disease This is an emerging epileptic disorder that causes atonic seizures of the neck and upper limb muscles following the sight of food. A survey undertaken during August 2010 by the MoH in 26 sub-counties in Kitgum, Pader, and Lamwo identified 1,876 cases. The etiology is still being investigated but a response plan has been developed to manage the associated conditions including: seizures, malnutrition, and onchocerciasis. Funds however need to be mobilized to implement the plan. Hepatitis E Virus The outbreak started on August 18, The initial cases were linked to the consumption of contaminated kwete (local brew) in Kaabong Town Council. Cases have been reported from Sidok, Karenga and Kaabong sub-counties. Latrine coverage is low (1%) and a factor in the spread of the disease. There was an upsurge in cases following the onset of rains in March 2011 that is currently being responded to by GoU and partners. However in the long term, control of the outbreak will require investments in improving access to safe water and sanitation facilities (latrines) in the district. Despite the unusually high incidence of epidemic, disease outbreaks and disasters in 2010/11, the response by health sector EDPPR teams was timely notably for the Ebola epidemic whereby only one case was confirmed. Other responses were mainly hampered by inadequate logistics and lack of epidemic preparedness plans and funds at all levels. The OPM should support strengthening of intersectoral coordination mechanisms within the country and inter-country level on management of epidemics. 89
112 Occupational Health and Safety Programme Due to the current increased industrial, agricultural (especially horticulture) development in Uganda, threats from emerging and re-emerging diseases, there is need to scale up interventions in Occupational Health. There is a need to promote Occupational Health services and practices in workplaces with special emphasis on the high risk sectors. Lead Programme Indicators Number of districts with functional Occupational health and safety committees. Main achievements Occupational health and safety committees established and trained in 8 districts (Kamuli, Busia, Namutumba, Mityana, Oyam, Kabarole, Mubende and Amolatar). Occupational Health and Safety Programme in the sector is not well stipulated in the HSSIP 2010/ /15 and not reflected in the MPS 2010/11. There is urgent need to strengthen the coordination mechanism, planning and implementation of Occupational Health and Safety in the MoH. 90
113 3.3.2 Cluster 2: Maternal and Child Health MCH cluster is composed of five elements; Sexual and Reproductive Health (SRH), Newborn care, Common childhood illnesses, Immunization and Nutrition. This emphasizes the link between maternal and child health and the cumulative nature of health problems through the entire lifecycle Sexual and Reproductive Health and Rights The aim of the sexual and reproductive health and rights element is to reduce mortality and morbidity relating to sexual and reproductive health, and rights. The right to sexual and reproductive health rights programme is important as it aims at reducing maternal mortality ratio, under five mortality, and total fertility rate, and improve sexual and reproductive health of the people which are all key elements for achieving the MDGs 4, 5 and 6. Core Indicators Maternal Mortality Ratio (maternal deaths per 100,000 live birth) % pregnant women attending 4 ANC sessions % deliveries in health facilities % pregnant women who have completed IPT 2 Contraceptive Prevalence Rate Number of stillbirths Lead Programme Indicators The proportion of health facilities with no stock-outs of essential RH medicines and health supplies increased from 35% to 70% by The proportion of health facilities that are adolescent-friendly increased from 10% to 75% by The % of health facilities with Basic and those with Comprehensive emergency obstetric care increased from 10% to 50% by The proportion of pregnant women accessing comprehensive PMTCT package increased from 25% to 80%. The unmet need for family planning reduced from 41% to 20% by The rate of adolescent pregnancy reduced from 24% to 15% by Annual plan 2010/11 top indicators Implementation of the road map for accelerating reduction of maternal and newborn mortality and morbidity in 40 districts Number of health workers trained in EMOC, MPDR, MIP, ASRH, RH/HIV integration and focused ANC in 60 districts Number of maternal and perinatal death audits conducted Policies, laws, guidelines, plans and strategies developed and disseminated 91
114 Number of technical supervision, monitoring and evaluation activities Number of coordination meetings held Main achievements 12 monthly MCH Technical Working Group meetings were conducted. Examples of issues that were handled through this forum included Addendum for Community-Based provision of Injectable Contraceptives; creation of alternative distribution mechanisms for contraceptives to avoid piling up and expiry. Other coordination meetings held included 1 National Coordination meetings for Malaria in Pregnancy; 4 Quarterly National Maternal and Perinatal Death Review (MPDR) committee meetings, 4 Quarterly Reproductive Health Commodity Security (RHCS) meetings held. Reviewed the Adolescent Health policy, the strategy, job aides and Adolescent Health training curriculum for peer and health workers. Developed the Adolescent-friendly service standards and the Step by Step guide for Health workers. Maternal nutrition guideline was finalized. Reviewed the Life Saving Skills training manuals and EmONC management Care protocols Printing and distribution of guidelines and tools o o 1,000 Registers on Integrated ANC, Maternity and Postnatal Care were printed. Printed 100 Maternal death notification booklets, 200 maternal death audit booklets, 200 perinatal death audit booklets and 50 Maternal and Perinatal Death Review (MPDR) guidelines that were distributed in 8 UNFPA focus districts. o Five hundred (500) copies of MPDR strategy were printed and distributed. o Twelve thousand (12, 000) mothers passports were also printed and distribution is ongoing. o 1,000 copies of VHT data collection tool, covering maternal health variables were printed. o 10,000 checklists for the WHO Medical Eligibility Criteria for family Planning(IUD, Implants, DMPA, Oral contraceptives) o 20,000family Planning cards o 20,000 FP brochures in 6 different languages( (English, Luo, Ateso, Karamojong, Lugbara and Luganda) o 2000 posters on responsible fatherhood o 200 copies of the Reproductive Health Choices for people living with HIV o Public awareness building: Commemoration of Safe Motherhood day took place in Mityana District. Training was carried out in various areas of Reproductive Health including; 30 health workers (on Adolescent Health in Masaka district), 30 HWs (on RH Logistics management in Tororo district), 18 HWs (on EmOC in Kamuli district), 30 HWs (on Malaria in pregnancy in Lira district), 180 HWs and 30 TOTs (on SGBV in the districts of Kiboga, Mpigi, Kotido, Moroto, Katakwi, Kaabong, Hoima, Kapchorwa, Serere, Kaberamaido, Soroti, Mubende, Kanungu, Abim, Oyam). Teams from 4 Regional Referral Hospitals provided hands-on skills 92
115 building on goal oriented ANC, Post Abortal Care (PAC), EmONC, MPDR, Family Planning Long Term and Permanent Methods (LTPM), HIV/SRH Integration & SGBV, to 118 health care workers in 10 health facilities in 4 districts of Mubende, Oyam, Kanungu and Katakwi. Under the Fistula Care Project, Kitovu Mission hospital and Kagando Mission hospital conducted 294 fistula repairs, trained 4 surgeons on fistula repair surgery, trained 3 health care providers on Caesarean section, trained 679 health care workers on infection prevention, trained 89 health care providers on quality improvement. Technical support supervision on EmONC, HIV, PMTCT and FP was done in 21 districts. Twenty (20) districts were assessed and guided on implementation of the Roadmap (Kibaale, Hoima, Bulisa, Masindi, Kiryandongo, Nakasongaola,Luwero, Wakiso, Nakaseke, Kiboga, Jinja, Kamuli, Kaliro, Mayuge, Luuka Masaka, Rakai, Lyantonde, Sembabule and Lwengo). Confidential inquiries in MPDR were carried out in Arua, Mityana, Buhinga in Fort Portal and Apac hospitals. Family Planning Quality of Care Assessment was done in order to identify gaps and therefore guide prioritization. Family Planning service provision outreaches were carried out through partnerships with NGOs and professional Associations, and integration of service provision was also encouraged in the health facilities. More funding was mobilized for procurement of RH medicines, equipment and health supplies including contraceptives. Main challenges Insufficient skills in-service on the use of RH medicines and equipment recently introduced in service delivery, e.g. MVA kits, Misoprostol, Magnesium sulphate, Emergency Contraceptives and the Newborn resuscitation equipment. Insufficient suture materials in all hospitals leading to poor wound healing, gaping wounds and burst abdomen Very low use of the Partogram to monitor labour progress at all levels of care leading to late response and poor outcomes even for mothers who are coming early to health facilities Failure of the HC IVs and many General hospitals in participating in Emergency Obstetrical Care instead of continuously referring obstetrical emergencies to the Regional referral Hospitals, thereby over-loading them and increasing the delay for women in labour in reaching health facilities for Emergency Obstetrical Care. This has partially contributed to some of the maternal deaths owing to the third delay. Insufficient numbers of doctors, midwives and anaesthetists to cover EmOC at HC IV, General Hospitals and Regional Referral Hospitals. Piling up of RH supplies including contraceptives and Emergency contraceptives at NMS and in some health facilities. No clear source of equipment for long term and permanent methods of Family planning 93
116 Recommendations for annual plan 2012/13 Should sensitize Members of Parliament of the need for in-service Continued Medical Education, and Continued Professional Development. There is a need to step up in-service capacity building efforts, including hands-on skills building and technical supervision. There is a need to engage the health training institutions so that they update their tutors in the key RH skills that are being addressed in the in-service training to ensure sustainability Should support the recruitment of core staff for RH, namely, doctors, midwives and anaesthetists to cover EmOC at HC IV, GHs and RRHs. Should strengthen the Public Private Partnerships in improving RH supplies distribution and improving the utilization of services in the health facilities especially provision of the Long Term and Permanent (LTPM) methods of FP. Most of the planned activities at programme level were implemented as planned and output demonstrated by increase in CYP (from 582,804 in 2009/10 to 787,390 in 2010/11), CPR and deliveries in health facilities together with improvement of the Public Private Partnerships. Whereas there is a remarkable increase in the number of deliveries in health facilities, there is a reduction in the proportion of pregnant women attending 4 ANC sessions and the proportion of pregnant women who have completed IPT 2 is static at 47%. There is need for continued sensitization on goal oriented ANC and promotion of early ANC attendance. Stock out levels of essential RH medicines and health supplies as evidenced by the 47% stock out levels of EMHS could be contributing to the low IPT 2 coverage. As seen from the Figure 14, number of stillbirths in health facilities is high and is a reflection of obstetrical complications during pregnancy and childbirth. Therefore, ANC and skilled care at birth especially EmOC, need to be strengthened; Perinatal Death auditing should also be carried out in order to identify the risk factors so that they are addressed to reduce stillbirths. Figure 12: Reported number of Stillbirths by month 1,800 1,600 1,400 1,200 1, / /2011 Source: MoH HMIS 94
117 Human Rights and Gender Mainstreaming This element of the MCH cluster aims at preventing morbidity and mortality linked to human rights violations and gender inequalities. Lead Programme Indicators An integrated strategy to address SGBV in the health sector developed and disseminated. Health service provision for survivors of rape scaled up in all district hospitals and 50% of HC IIIs. PEP Kits available in all district hospitals and 50% of HC IIIs. Health workers trained in clinical management of survivors of rape increased to 25% by Annual plan 2010/11 top indicators The Human Rights and Gender Team did not have an action plan for 2010/2011 as it was only established in early Main Achievements An officer from MoH was assigned responsibility of Gender Desk Officer Developed an action plan for mainstreaming Human rights and gender Held stakeholders meeting to harmonise activities Developed trainers manual for mainstreaming human rights and gender concerns in health programmes Several trainings were undertaken on SGBV. MoH has attended several intersectoral meetings with stakeholders from Ministries of Gender, Internal Affairs and Justice to streamline issues related to the filling in of the police form 3 in case of rape with major positive achievements: in that the clinical officers and the midwives will now be recognised as eligible health workers to fill the form and can testify in court. The Police Form has now been separated into PFA for General assault and PF3B for Victims of sexual violence. Pictograms have been introduced and mandatory testing of HIV for offenders of sexual violence Recommendations for annual plan 2012/2013 For the Human Rights and Gender Team to continue the work of cross sectoral cooperation Capacity building and technical assistance with the aim of promoting and protecting human rights within the health sector. To include structural indicators in upcoming health sector assessments. 95
118 The MoH has made deliberate efforts to streamline health and gender by establishing a Gender Desk and assigned officers (from the Planning Division and Reproductive Health Division). Implementation of some activities has commenced. Further implementation of the action plan will continue in FY 2011/ Newborn and Integrated Child Survival The newborn and integrated child survival elements of the MCH cluster aim at improving newborn and child health and survival by increasing coverage of high impact evidence based interventions, in order to accelerate the attainment of MDG 4; and scale-up and sustain high, effective coverage of a priority package of cost-effective child survival interventions in order to reduce under five mortality. Core HSSIP indicators Neonatal Mortality rate (per 1000 live births) Infant Mortality Rate (per 1000 live births) Under 5 mortality rate (per 1000 live births) % U5 children with height /age below lower line (stunting) (m/f) % U5 children with weight /age below lower line (wasting) (m/f) U5s with malaria treated correctly within 24 hrs increased from 26% to 60% Lead programme indicators The proportion of neonates seen in health facilities with septicaemia/pneumonia disease reduced by 30% Proportion of mothers of newborns 1-2 weeks practising clean cord and skin care, keeping babies warm, exclusively breast feeding and recognize danger signs, increased by at least 30% from baseline figures U5 pneumonia managed with correct antibiotic increased from 17% to 50% Index of U5s managed in an integrated manner at the facility using IMNCI increased from 30% - 60% Health workers who are competent in newborn resuscitation upon completing of training Annual plan 2010/11 top indicators Roll out child survival strategy in 40 districts Number of health workers trained in micro-planning in Child Days in 32 new districts Number of district trainers trained on child survival interventions in 40 districts Number of guidelines in Child Survival Interventions reviewed and printed 96
119 Main achievements 2010/11 Child Survival (CS) Strategy was revised and aligned with the HSSIP 2010/ /15 and 200 copies printed. Two national level trainings of Mid-Level Managers on managing child health programs were conducted All districts implemented two rounds of Child Health Days but with varying degrees of performance. Received a donation of de-worming drugs from CWW, World Vision and World Food Programme and Vitamin A from UNICEF. Performance in Child Health Days however deteriorated and actions to strengthen CDP were initiated Developed a standard operations manual for implementing Child Days Plus activities, including revision of the supervision and monitoring tools and targeted technical support was provided to poorly performing districts in form of planning and supervision from the national level An integrated in-service training package Helping Babies Breathe (HBB) guidelines incorporating newborn resuscitation, examination of normal newborn care, preterm and sick newborn care were adopted and adapted for Uganda and the first national training for 14 trainers conducted in Masaka. The national multi-disciplinary advisory committee continued to advocate for and coordinate different efforts to improve newborn health including introduction of standards based facility assessment/audit in 8 districts, review and dissemination of newborn/perinatal death audit tools in 32 districts to strengthen the reduction of avoidable deaths at the facility Post-natal home visits by VHT during the first week were introduced in 23 districts through VHT iccm trainings supported by UNICEF, Malaria consortium and International Rescue Committee etc. Agreement was reached to ensure IMCI standards implemented at facility before introducing iccm at VHT level. According to the supervision report of the last quarter, districts are beginning to revitalize IMCI. Plans have been initiated to review the pilot of a shorter abridged course for IMCI. The referral/hospital package of IMCI was reviewed based on new evidence from WHO and the pocket book for health-workers is under revision. A training on Emergency Triage and Treatment was conducted in collaboration with the department of paediatrics to improve severe illness case management Main challenges 2010/11 Challenges for CDP implementation have been mostly in the area of logistics management, monitoring performance and coverage, district ownership of the program, coordination of key players and inadequate long term planning plus political support. Partners support most activities for newborn health and newborn activities are not well integrated in district plans and other quality improvement activities. In addition whereas audit has been adopted as a key strategy to build capacity and inculcate a culture of continuous quality improvement, peri-natal death audit activities are not implemented widely only 15 districts have initiated this and national death review teams are not 97
120 functional, and even then there are very few national/ regional mentors and supervisors to support districts. Most health facilities still lack needed basic equipment, supplies and skills for newborn health care especially equipment for new borne resuscitation and emergency care. High turnover of staff affects the attainment of a critical mass of trained staff. Irregular technical supervision and monitoring activities affecting institutionalization of IMCI and continued improvement of management of common childhood conditions. Shortages or irregular supply of drugs especially 1 st line anti-malarial, de-worming drugs and antibiotics for pneumonia. Implementation of iccm is highly dependent on existence of VHT in villages; many districts are yet to roll out the VHT strategy. Data on performance of iccm in early use districts are still limited and affect planning and improvement of implementation. Recommendations for annual plan 2012/13 Expand the pool of national and regional newborn clinical audit teams consisting of hospital clinical specialists, district health teams, financial administrators and NGOs to champion and support lower level health facilities and communities in the catchment area to assess newborn health service standard, introduce and maintain quality improvement approaches in these units including regular perinatal death audits and reviews.. Mobilize existing resources, including a number of "hidden resources" (local organizations, traditional structures, groups) to integrate or build on newborn activities. Review the IMCI implementation framework to reflect new development and build district management capacity for child health programming in general and implementing IMCI in particular. Districts planning to implement iccm should also plan to train health facility staff to manage referred patients and supervise VHTs. There is a 10% reduction in the number of children seen in health facilities with pneumonia and 30% reduction in the number of children seen with septicaemia. Diagnosis 2008/ / /11 No. of cases % No. of cases % No. of cases % Pneumonia 887,917 3% 912,263 2% 819,180 2% Perinatal conditions (in New borns 0 to 28 days) 12, % 16, % 11, % There is need to scale up peri-natal death audits, provide the necessary equipment and adequate medical supplies. Staff attrition and low staffing levels also affect service delivery. These gaps are likely to be contributing to the slow progress in improvement of the programme indicators. 98
121 Expanded Programme for Immunisation The mission of UNEPI is to contribute to the reduction of morbidity and mortality due to childhood diseases to levels where they are no longer of public health importance. The programme objective therefore is to ensure that all children are fully immunized against the vaccine preventable diseases before their first birthday and all babies are born protected against neonatal tetanus. Core HSSIP indicator % children under one year immunized with 3 rd dose Pentavalent vaccine (m/f) (90%) % one year old children immunized against measles (m/f) (85%) Lead programme indicators Neonatal tetanus rates reduced and maintained at zero DPT-3/Pentavalent coverage for under 1 s increased from 74% - 80% in 2010/11 Measles vaccination coverage by 12 months increased from 75% to 85% in 2010/11 Annual plan 2010/11 top indicators Delivery of vaccines, injection materials and other immunization supplies EPI cold chain supervision in all districts Technical support supervision to districts Health workers trained on post certification interventions Main achievements Received 1,422 fridges (287 solar fridges and 1,135 Electric and /or gas refrigerators), 1 refrigerated truck and 1 open caged truck with support from JICA for rehabilitation of the cold chain systems and support vaccine delivery to districts. The fridges have been distributed to the districts and used for setting District Vaccine Stores for new districts. Capacity building; Refresher training of 726 Operational Level (OPL) Health Workers in 26 districts, 181 Mid Level Managers (MLM) from 34 districts, 30 Cold Chain Assistants for new districts and tutors from 27 medical training institutions Maintained certification level surveillance for polio eradication and measles control. Application to GAVI for support to introduce Pneumococcal Vaccine into the routine immunization programme was approved. Interrupted transmission of the wild polio virus in eastern Uganda by implementing 4 rounds of house-to house polio campaigns in 48 high risk districts with coverage above 95% in all rounds. In the 48 districts where House - to - House SIAs were done, emphasis was 99
122 made on need to improve routine immunization and districts prompted to do specific district assessment and come up with innovative ways to improve routine immunization. Due to the polio response activities carried out supervision in the 3rd and 4th quarters of the FY to 26 poorly performing districts instead of all districts. Improvement in the supply of vaccines, injection materials from the centre to the districts Support supervision towards improving routine immunization (RED STRATEGY). The regional IDSR support supervisors provide regular on job support supervision to the districts Monthly feedback is given to districts indicating performance of all the 112 districts, which stimulates districts to work towards better performance There has been regular support to districts through national and international Stop Transmission of Polio (STOP) teams that contribute to enhancement and and strengthening of surveillance activities The UNEPI with support from WHO supports districts to conduct continuous active search for polio and measles Main challenges Inadequate and irregular release of funds particularly PHC funds that has resulted in irregularity of outreaches in almost all districts causing dropouts, irregular supply of logistics to health facilities and lack of support supervision. Inadequate transport at district level for delivery of supplies to the lower levels, for going to outreaches and carrying out support supervision. The threat of importation of the wild poliovirus from neighbouring countries where it is still circulating. Advocacy/communication/mobilization activities primarily promote immunization by periodic events, such as CHDs and NIDS, not use of routine health services Recommendations for annual plan 2012/13 Advocacy for increased funding for national, districts and health facilities to facilitate better implementation of immunization activities at these levels. The threat for wild polio virus importation from neighbouring countries still exists (section on EDPPR suggests the threat is real) and there is need to strengthen routine immunization and surveillance activities at all levels. Mass polio vaccination may have to be carried out in districts that are high risk whenever recommended. Introduce new vaccines that will reduce infant morbidity and mortality from targeted diseases. The EPI programme was strengthened through acquisition of cold chain equipment including 2 trucks. District Vaccine Stores were set up in the districts, refresher training of OPL health workers and technical support supervision conducted at all levels. Intensified capacity remarkable improvement in coverage for Pentavalent 3 rd dose coverage from 76% in 2009/10 100
123 to 90% in 2010, above the 80% HSSIP target for the year under review. Under one year old immunization coverage for measles improved slightly from 72% to 85%, achieving the 85% HSSIP target for the year. A total of 1,628 Measles cases were investigated and 326 were confirmed in FY 2010/2011. During 2011 UNICEF has given some additional funding to 26 districts to reduce large numbers of un-immunized children. The additional funds were given for 2 quarters ranging from million per quarter. Some districts like Mukono, Maracha, Mayuge, Kamuli, Buvuma - has shown remarkable improvement. A total of 125 suspected cases of neonatal tetanus were reported (HMIS 2010/11) and of these 101 were confirmed. There is need for increased for increased community mobilization to utilize the available services and strengthening capacity of districts to conduct supervision and diseases surveillance Nutrition Implementation of nutrition interventions to scale up delivery of nutrition services involves the MoH and other stakeholders. Core HSSIP indicator % U5 children with height /age below lower line (stunting) (m/f) % U5 children with weight /age below lower line (wasting) (m/f) Lead programme indicators Maternal Infant and Young Child Feeding practices improved (Exclusive breastfeeding, Timely introduction of complementary feeds) Accessibility to appropriate and gender sensitive nutrition information and knowledge increased Vitamin A Supplementation coverage among children 6-59 months Households consuming fortified foods(salt, cooking oil, wheat flour) increased Nutrition services to health units and the community scaled up Annual plan 2010/11 top indicators Baby Friendly Initiative Assessment (BFHI) conducted in 4 districts Develop service standards for what is expected in nutrition at all levels on health care including VHT. Integrate and harmonise strategies and guidelines on micronutrients Design nutrition interventions using data for advocacy purposes 101
124 Main achievements Health facilities supported to support, protect and promote breastfeeding through the Baby Friendly Health Facility Initiative (BFHI) with support from partners (IBFAN) A nutrition training package for VHTs developed; Community Nutrition strategy concept developed; Population nutrition handbook finalized; Maternal Nutrition and the Integrated Management of Acute Malnutrition (IMAN) guidelines finalised; Consensus on the development of an integrated micronutrient strategy and policy framework developed and Concept and draft 0 developed. Support supervision for the implementation of Bi-annual supervision of Child days plus done Training of health care providers in positive deviance hearth (best practices) with support from World Vision and Strides for Family Health Training of health care providers in Emergency Nutrition Assessment for Standard Methodologies for Relief and Transition (ENA for SMART) Main challenges Lack of adequate funds for support supervision funding, government funds not enough to support BFHI scaling- up. Blockage of financial support by UNICEF limited implementation (Child Days Plus, Launching of IMAM guidelines, Nutrition Information systems) Not able to incorporate improved methods of assessing micronutrient bio-markers in UDHS- 5 Recommendations for annual plan 2012/13 Improving Maternal Infant and Young Child Feeding Practices (Exclusive breastfeeding at 6 months increased from 60% to 80%., Timely complementary feeding increased from 73% to 80%) Scaling up the implementation of child days Plus nutrition related activities Improving consumption and access to micronutrient fortified foods The nutrition program implemented planned activities which were mainly geared at strengthening the national program policy and strategies and capacity building at district level. Information on the impact of these interventions will be availed by the UDHS 5 conducted in
125 There was a decrease in the number of children 6 59 months receiving 1 st and 2 nd doses of Vitamin A supplementation from 1,415,155 first dose and 1,238,683 in 2009/10 to 1,370,353 1 st dose and 1,064,899 second dose in 2010/11 FY. Figure 13: Vitamin A Supplementation among under fives 1,600,000 1,400,000 1,200,000 1,000, , , , , st Dose 2nd Dose The number of reported cases of malnutrition among the under five OPD new attendances is at 0.24% of all OPD diagnoses and the proportion has remained constant over the last 3 years. Diagnosis 2008/ / /11 No. of cases % No. of cases % No. of cases % Severe Malnutrition (Marasmus, Kwashiorkor, Marasmic-kwash) 37, % 43, % 41, % Low Weight For Age 38, % 44, % 40, % Total 76, % 88, % 82, % Source: MoH HMIS Malnutrition is still a major problem in Uganda. During the year under review an upsurge of malnutrition cases was reported in Namutumba district. Presently the biggest gap is to empower and support mothers to improve child feeding, hygiene and care seeking. The ministry should review the adequacy and reach of child feeding messages, capacity of providers in counselling mothers to improve community IMCI family care practices and design approached to mitigate this situation. 103
126 3.3.3 Prevention and Control of Communicable Diseases The priority health care interventions in the cluster of prevention and control of communicable diseases include; prevention and control of STI/HIV/AIDS; prevention and control of malaria; prevention and control of tuberculosis and elimination and or eradication of some particular diseases such as Leprosy, guinea worm, onchocerciasis, trachoma, lymphatic filariasis, trypanosomiasis, soil transmitted helminthes and schistosomiasis. The overall objective for the communicable cluster is to reduce the prevalence and incidence of communicable diseases by at least 50% and thus contribute towards achieving the health related MDGs Prevention and Control of STI/HIV/AIDS The aim of the STI/HIV/AIDS component of the HSSIP 2010/ /15 is to prevent STI/HIV/TB transmission and mitigate the medical and personal effects of the epidemic. Core HSSIP indicators % of children exposed to HIV from their mothers access HIV testing within 12 months increased from 29% to 75% (m/f) % eligible persons receiving ARV therapy (m/f) Lead programme indicators The proportion of people who know their HIV status increased from 38% to 70%. The proportion of people who are on ARVs increased from 53% in 2009 to 75% by 2015 among adults and from 10% to 50% in children less that 15 years of age. HCT services available in all health facilities including HC IIs, and at community level (Proportion of health facilities with HCT services; Proportion of community structures with HCT services) PMTCT services available in all health facilities up to HC III s and 20% of HC IIs (Proportion of health facilities with PMTCT services; Proportion of HC IIs with PMTCT services). ART services available in all health facilities up to HC IV and 20% of HC III by (Proportion of health facilities with ART services; Proportion of HC IIs with ART services). Reduce the HIV prevalence from 6.7% to 5.5% in the general adult population (15-49 years). Annual plan 2010/11 top indicators Increase ART accredited facilities from 340 to 400 Initiate 48,000 people on ART Initiate PMTCT services in 30% of HC IIs Review and launch Safe Medical Circumcision (SMC), HCT, PMTCT policies and start circumcision for about 1 million young people aged yrs 104
127 Main achievements 2010/11 Health Sector HIV strategic Plan launched AIDS Indicator Survey (AIS) conducted and near completion 68,000 HIV patients initiated on ART, ~ 10,000 children & ART sites increased by 100 MTCT of HIV reduced to 5% from 7% in over 1,200 health facilities; New state of the art EID lab established at CPHL and > 15,000 exposed babies accessed EID services Over 5 million accessed HIV counselling and Testing Main challenges 2010/11 Low human resources for health both in quality and quantity and weak leadership at district level Inadequate resources and weak community health systems Poor data management Recommendations for annual plan 2012/13 Train in Leadership for health services especially DHOs Change re-training of existing HRH to mentoring Scale up all HIV prevention services despite challenges A new HIV/AIDS strategic plan was launched and the AIDS indicator survey is near completion. This will provide information on the current HIV/AIDS situation in the community. Over the years, significant gains were made in the control of HIV/AIDS and in the mid 2000s there was a reversal of trends from 6% antenatal HIV prevalence in 2005 to 9.7% in However, of recent, antenatal clinic prevalence from sentinel sites have indicated a decreasing trend from 9.7% in 2006 to 7% in (The HIV/AIDS Epidemiological Surveillance Report 2010) Tuberculosis Tuberculosis remains a major public health problem in Uganda. This is compounded by the emerging multi drug resistant Tuberculosis (MDR TB) problem. The high prevalence of HIV (6.4% in the general population and over 50% among TB patients) is contributory to fuelling the epidemic and TB still remains a leading cause of mortality amongst people living with HIV/AIDS. The aim of the TB program is to reduce the morbidity, mortality and transmission of tuberculosis. 105
128 Core HSSIP indicators % new smear positive cases notified compared to expected - target 60% in 2010/11 and 70% by 2015 Lead programme indicators Case Detection Rate (CDR) % - target 60% in 2010/11 and 70% by 2014/15 Treatment Success Rate (TSR) % - target 75% in 2010/11 and 85% by 2014/15 Cure Rate in % % TB patients tested for HIV target 80% in 2010/11 and 100% by 2014/15 % HIV + TB patients started on CPT target 90% in 2010/11 and 100% in 2014/15 Annual plan 2010/11 top indicators (implementation) Programmatic Management of Drug Resistant TB (PMDT) initiated; in line with this: o PMDT guidelines and tools developed, printed and disseminated o 52 HWs (4/regional hospital) trained on MDRTB management (see bullet 3 for SLDs) o Routine surveillance of drug resistant TB strengthened: 61 HWs trained on TB Sputum Specimen o Referral System (TSRS); samples from high risk TB patients routinely referred to NTRL for drug susceptibility testing for routinely identifying drug resistant TB o MDR TB Ward modelled and renovated Standard NTLP R&R tools printed and distributed to districts Anti TB Drugs procured: for drug susceptible TB (first line drugs) with donor (GF) funds and for drug resistant TB (second line drugs) with government and donor (GF) funds Anti-TB drugs and reagents distributed to TB zones and from TB zones to districts once every 2 months Coordination and planning o Quarterly program management, planning and review meetings held at national and zonal levels. Zonal meetings in 3 zones (North West, Eastern and Kampala) supported with government funds and the rest of zones with donor (GF, GLRA, WHO and USAID) funds o Quarterly National TB/HIV Coordination meetings held o Annual program review and planning meetings held Technical Support supervision: o Supportive supervisions carried out from National to each Zone once every six months o Quarterly supportive supervision from Zonal level held to 25% of the districts in the zone per quarter o DTLS and SCHWs supported to hold monthly SS (planned under donors mainly GF funding) National TB Reference Laboratory renovated and refurbished with CDC support National Commemoration of World TB and Leprosy Days held 106
129 Main achievements 2010/11 Programmatic Management of Multi-Drug Resistant TB (PMDT) - PMDT guidelines were developed and printed - 24 out of 52 HWs were trained on MDRTB management - 56 HWs were trained on TSRS and 1,623 out of expected 2,764 samples referred for routine drug susceptibility (MDRTB) testing. Of these, 93 were identified to have MDRTB in addition to those already on the national MDR-TB register Procured 25,463 blisters of first line anti-tb drugs; and distributed to districts through zones every 2 months as planned Coordination and planning meetings held o Held 3 out of 4 planned quarterly program planning & review meetings at national level; however zonal level meetings held ranged from 50% in some zones to 100% in others o Held 75% of the quarterly Performance in Technical Support Supervision: - 50% (i.e. one round) of planned Central level support supervision was held to each zone - Monthly District SS by DTLS conducted NTRL was renovated and refurbished with support from Centers for Disease Control (CDC) and is now executing all its role In respect of the lead program indicators, the following achievements were realised in the year: 81% of the TB patients were tested for HIV compared to 72% the previous year, 90% of the HIV positive TB patients were on Co-trimoxazole Prophylaxis (CPT) compared to 81 % the previous year However, there was under performance in CDR, TSR and ART coverage with CDR declining from 57% to 54%, TSR from 70% to 67% while ART coverage stagnated at around a quarter (24%) Main challenges 2010/11 Lack of funds for procurement of Second Line Drugs (SLDs) has constrained the initiation of PMDT in the country. Other preparatory steps such as an MDRTB Focal Person, a Green Light Committee approval to procure SLDs, HWs training on MDRTB, admission facilities etc are already in place. Moreover, a backlog of 172 MDRTB patients is on the national register awaiting SLDs! Underperformance in key program indicators: decline in case detection and treatment success rates to 53.9% and 67.3% respectively due to a number of factors including: uncertainty on the actual magnitude of TB problem in the country, unfavourable treatment outcomes as a result of deaths, poor recording and reporting leading to unknown outcomes and high defaulter rates in some districts 107
130 Inadequate GoU funding plus heavy reliance on Donor support and the complexities including irregular flows associated with some of the donor funds such as GF resulted in limited technical support supervision. This support is necessary to guide peripheral health workers to implement quality TB/HIV care. Lack of a dedicated GoU budget line for anti-tb especially second line drugs Recommendations for annual plan 2012/13 Government (MOH/MOFPED) should establish a dedicated budget line for TB drugs and procure SLDs in order to enable the NTLP enrol the backlog of MDRTB patients on treatment. This would minimise amplification of MDRTB and decrease mortality among MDRTB cases as well as decrease spread of drug resistant TB within the communities Government (MOH/MOFPED) should set aside a complementary budget line to facilitate the conduct of a population based national TB Disease prevalence survey aimed at establishing the magnitude of TB disease and to act as a baseline for monitoring progress towards MDG targets GoU should provide adequate and regular funding to enable NTLP and District Health Teams to intensify support supervision, to mentor Health Workers with a view to improving the quality of TB/HIV services including the R&R provided. The NTBLP focused on the emerging problem of MDT, developed the PMDT guidelines and established structures for management of MDT, however a backlog of 178 MDRTB registered patients await SLDs to be enrolled on treatment. Coordination and supervision activities were not fully implemented at all levels due to inadequate funding. In respect of the NTLP lead program indicators, there was increase in TSR from 67% to 70%, the number of TB patients tested for HIV from 72% in 2009/10 to 81% in 2010/11; and 90% of the HIV positive TB patients were on Cotrimoxazole Prophylaxis (CPT) compared to 81% the previous year. However, the performance on CDR and ARTs was not as impressive: CDR declined from 56% to 54%, while ART coverage stagnated at around a quarter (24%). Some of the factors for the apparent decline in CDR could be: uncertainty on the true magnitude of TB burden in the country (estimated cases are only but an estimate hence the need to carry out a TB Disease Prevalence Survey to establish the exact magnitude); an altered picture with a tendency for HIV positive TB cases to be smear negative rather than smear positive (the proportion of EP also tends to increase in high HIV prevalence and high TB and HIV coinfection settings like Uganda); repeated stock outs and/or NMS supplying poor quality laboratory reagents reported by some districts also negatively impacts on CDR. Low cure rate (40%) could be due to unfavourable treatment outcomes as a result of deaths, poor recording and reporting leading to unknown outcomes and high defaulter rates in high TB burden Urban setting Kampala, Masaka, Mbarara and Jinja. 108
131 Malaria Malaria contributes to a significant cause of morbidity and mortality in Uganda especially in the under fives and pregnant women. The aim of the National Malaria Control Program (NMCP) is to reduce the morbidity and mortality rate due to malaria in all age groups. The mainstay of intervention strategies are; prompt case management using artemisinin combination therapy (ACT), Long Lasting Insecticide Treated Mosquito Nets (LLINs), Indoor Residual Spraying (IRS) using efficacious insecticides and IPT in pregnant women. Epidemic preparedness and response IEC/BCC and monitoring and evaluation and research and health systems strengthening are part and parcel of the strategy. Core Indicators The proportion of pregnant women who have completed IPT 2 uptake increased from 47% to 50% by June The proportion of under-fives with fever who receive malaria treatment within 24 hours from a VHT increased from 13.7% to 20% by June Programme Indicators 2010/11 FY Reduce the prevalence of malaria among under fives Proportion of households with at least one ITN increased Proportion of households sprayed with insecticide in the last 12 months increased The case fatality rate among malaria in-patients under five reduced The percentage of public and PNFP health facilities without any stock outs of first line antimalarial medicines increased Malaria studies conducted Main achievements A total of 7,289,921 LLINs were distributed to beneficiaries The proportion of registered U5 who received GFATM LLINs was 92% (6,302,890 LLINS out of 6,913,872); 91% (825,449 out of 909,607 registered PWA received LLINs; and 161,582 out of 176,517 village officials involved in the registration and distribution exercises countrywide A total of 869,861 out of 899,716 (or 96.7%) houses in the 10 districts of Amuru, Nwoya, Gulu, Oyam, Kole, Apac, Lamwo, Kitgum, Agago and Pader were sprayed during the year under review. In addition to houses sprayed in the previous FY a total of 2,673,427 out of 2,756,339 (97.0%) were protected with IRS during the period under review. 109
132 20 million ACT treatments provided through GoU, PMI, DFID and Global Fund leading to reduction in ACT stock outs from over 50% to 20% 21 districts trained and effectively using RDTs for malaria diagnosis. 2.4million RDT tests provided under Global Fund and PMI Last FY year the NMCP held 50% (2 out of 4) of the planned RBM partnership coordination meetings Malaria program review conducted A draft Larviciding protocol, work plan and the budget for the four Larvicides (Aquatain AMF, Bti, SAFE and Abate) submitted to NDA and other regulatory bodies, for approval Main Challenges Lack of ACTs for rolling out HBMF to the community level Delayed disbursements by GF led to serious consequences at all levels of the distribution system. Insecticide resistance to Pyrethroids coupled with some communities and environmentalists resisting use of DDT left the program with a more expensive chemical, Bendiocarp, which could not be sprayed to all the 53 targeted districts due to budgetary constraints. Recommendations for annual plan 2012/13 The NMCP should ensure that macro-planning is strengthened through earlier engagement of stakeholders and preparation of relevant plans and materials way ahead of anticipated net arrival. MoH should set clear timelines for tracking LLIN movement from the manufacturers to central warehouses to facilitate timely communication to NDA and UNBS. Because of the increasing and spreading resistance of malaria vectors to pyrethroids, IRS using non-pyrethroid insecticides should be fully supported if the effectiveness of LLINs is to be maintained because all nets are currently being treated with pyrethroids. GoU should increase funding for IRS in order to drastically reduce malaria transmission in the country and maintaining the low transmission rates using LLINs. All funds for IRS should be released at ago to enable IRS to be implemented, not piecemeal on a quarterly basis as the case is now! There was progress in implementation of the mainstay interventions for control and prevention of malaria during the year under review through increased access to ACTs, distribution of LITNs, and IRS. IEC/BCC activities were not emphasized in the planned activities and not reported if carried out. A malaria program review was carried out and this will provide information for strategic program planning. There was a decline in the proportion of women who completed two doses of IPT from 47% in 2009/10 to 43% in 2010/11. It was not possible to establish the proportion of under fives with 110
133 fever who receive malaria treatment within 24 hours from VHT because of lack of a reporting mechanism. The use of IRS, distribution of ITNs and availability of antimalarials are expected to reduce the prevalence of malaria among under fives and case fatality among malaria in patients Diseases Targeted for Elimination The diseases targeted for elimination and/or eradication include: poliomyelitis, guinea worm, onchocerciasis, measles, leprosy, trachoma lymphatic filariasis, trypanosomiasis and schistosomiasis. The overall objective for this cluster is to achieve national and global targets for elimination or eradication of targeted diseases Onchocerciasis The aim of the onchocerciasis program is to eradicate onchocerciasis and its vector in all endemic districts in Uganda Lead Program indicators Simulium nivae eliminated in all endemic districts in Uganda. At least 75% therapeutic coverage in all affected communities and 100% geographic coverage achieved in endemic districts CDTI activities integrated within their district health plans in all endemic districts to sustain integration. Annual plan 2010/11 top indicators Number of supervisory visits Number of health workers and community distributors trained. Number of advocacy on onchocerciasis conducted. Number of adult Simulium flies caught in a monitoring site per month/yr Coverage for mass treatment Main achievements 2010/11 Transmission of onchocerciasis has been interrupted in Wadelai, Itwara and Elgon foci covering seven districts (Nebbi Mbale, Manafwa, Bududa, Sironko, Kabarole, Kyenjojo). 2,239,900 people from 4,775 communities were treated for onchocerciasis with geographical of 95.7% and therapeutic coverage of 78% in Onchocerciasis vector eliminated in three foci (Itwara, Mpamba-Nkusi, Elgon). The development of draft Guidelines for Certification of onchocerciasis elimination in Uganda. 111
134 Initiation of mass treatment with ivermectin in the control of onchocerciasis involving community participation in post-conflict district of Kitgum, Pader and Lamwo. Main challenges 2010/11 Maintaining the high geographic and therapeutic coverage in endemic districts. Demand for incentives by Community Medicine Distributors. Delay in release of operation funds at district level. Recommendations for annual plan 2012/13 The District Onchocerciasis Coordinators should ensure the attainment of high geographical and therapeutic coverage in the affected communities. The Ministry should extend the training of VHTs to cover all the districts so as to minimize the demand for incentives among the CMDs. The district Chief Administrative officers should ensure timely release of operational funds. The onchocerciasis program has successfully eliminated the simulium vector in three foci and interrupted transmission in seven districts. A total of 8,410 cases of onchocerciasis were reported in the OPD attendances in 2010/11, 8,404 reported in 2009/10 and 10,132 in 2008/10. There is need for sustained efforts to attain high geographical and therapeutic coverage in affected communities as the sector works towards certification of onchocerciasis elimination in Uganda Lymphatic Filariasis The aim of the lymphatic Filariasis program is to reduce and ultimately interrupt transmission of the disease in all endemic communities through the use of chemotherapy with Ivermectin and albendazole. Lead Program indicators for Lymphatic Filariasis Therapeutic coverage for the affected people with single annual dose of Invermectin and Albendazole maintained. Geographical coverage for the affected communities with single annual dose of Invermectin and Albendazole. Mapping of areas with lymphatic filariasis in all endemic districts completed by 2011/12. Morbidity and disability associated with lymphatic filariasis reduced Annual plan 2010/11 indicators Number of tablets for each drug supplied and consumed during Mass Drug distribution (MDA). 112
135 Proportion of eligible population taking antifilarial medicines annually (>65%) and targeted communities (100%). Microfilariae prevalence in sentinel and spot check sites Districts with antigenaemia rate above 1% Hydrocelectomies done at district and national levels,and Districts reporting lymphoedema management Main achievements 2010/11 20,553,500 and 12,561,500 tablets of Invermectin and Albendazole respectively procured and distributed. All target districts received antifilarial medicines ( Awaiting districts reports to establish the eligible population which received treatment) Sites in districts which have undergone 4-5 MDA rounds surveyed for microfilariae prevalence Lymphatic filariasis map refined in 14 districts in central, Western and south western Uganda 25 districts support supervised specifically for lymphatic filariasis with focus on morbidity management (hydrocelectomy and lymphoedema management). Main challenges 2010/11 Delay in submission of reports from the districts Failure to include hydrocelectomy as a routine surgical activity Reports on non-filarial elephantiasis. Recommendations for annual plan 2012/13 The Neglected Tropical Disease Control program Secretariat should ensure that planning is strengthened through engagement of stakeholders and preparation of relevant plans and materials made prior to implementation. Government of Uganda should increase funding to address morbidity management (hydrocelectomy at health centres and lymphoedema management at community level). Ministry of Health should provide transport to ease program supervision especially monitoring and evaluation of program sentinel and spot check sites. The Lymphatic Filariasis program has sustained efforts in maintaining the therapeutic coverage with single annual dose of ivermectin and biannual dose of albendazole. Delay in submission of district and prevalence survey reports prevents effective program monitoring. Vector elimination activities not prioritised Veterinary Public Health The mandate of VPH unit is to prevent and mitigate the impact of zoonotic diseases thereby improving the health of the population of Uganda. The most notable are; Highly Pathogenic 113
136 Avian influenza (H5N1), pandemic influenza H1N1, Severe Acute Respiratory Syndrome (SARS), Bovine Spongiform Encephalopathy / variant-creutzfeld-jakob Disease (Mad Cow Disease). In Uganda, outbreaks of Ebola Heamorrhagic fever (HF) and Marburg HF have occurred with increasing frequency in the last five years. There has also been a re-emergency of anthrax, mange and plague which occur sporadically in wildlife and domestic animals and they occasionally spill over and spread into the human populations. At the same time long established zoonotic diseases such as rabies, bovine TB, brucellosis, cysticercosis and hydatidosis have remained endemic among the population in most developing countries including Uganda. Lead programme indicators Zoonotic diseases technical guidelines, developed and disseminated by 2011/2013. The proportion of General Hospitals and RRH conducting proper laboratory diagnosis of brucellosis increased by 20% and 50% by 2015 respectively Annual plan 2010/11 top indicators Train health staff on emerging, re-emerging and endemic zoonotic diseases investigations, prevention & control Develop, print & disseminate IEC materials on rabies Conduct technical support supervision to districts Main achievements 2010/11 Technical support supervision undertaken in 15 Districts of Apac, Soroti, Oyam, Dokolo, Lira, Nakasongola, Luwero, Hoima, Masindi, Zombo, Nebbi, Arua, Bundibugyo, Mubende and Mityana Developed, & translated rabies health education (IEC) materials in Ateso in the districts of Kaberamaido, Soroti, Bukedea, Ngora and Kumi. Undertook an assessment on availability, quality, type and location of IEC materials on zoonotic diseases in districts and health units in districts of Mityana, Kyegegwa, Kyenjojo, Kabarole and Ntoroko Conducted training on rabies post exposure treatment and case management for health workers in 5 regional referral hospitals of Jinja, Mbale, Soroti, Lira and Gulu Sensitized teachers and school children in 4 districts of Alebtong, Otuke, Kaberamaido and Dokolo on prevention and response to influenza and other zoonotic diseases of public health importance Main challenges 2010/11 Insufficient funds allocated for planned activities Under staffing of the division (one established post for one technical officer and two technical assistants on short term contracts) Stock out of anti-rabies vaccine 114
137 Recommendations for annual plan 2012/13 Streamline the availability of human rabies vaccine and treatment regimen for rabies post exposure prophylaxis. Zoonotic diseases technical guidelines developed and disseminated The proportion of General hospitals and RRH conducting proper laboratory diagnosis of brucellosis increased by 20% and 50% by 2015 respectively. The VPH unit built capacity for collaboration, investigation and management of zoonotic diseases in a few districts. According to the MoH HMIS report, the number of reported cases of animal/snake bites increased from 41,802 in 2009/10 to 42, 529 in 2010/11; and the number of suspected rabies reduced from 200 IN 2009/10 to 145 in 2010/11. Diagnosis 2008/ / /11 Animal/ Snake Bite 37,184 41,802 42,529 Suspected Rabies There is increased reporting and demand for post-exposure vaccination for rabies, which was not readily available to districts for most of the year under review. 115
138 3.3.5 Prevention and Control of Non-communicable Conditions Uganda is currently experiencing dual epidemics of communicable and non communicable diseases. The changing life styles have resulted in an increase in the prevalence of non communicable diseases like Diabetes mellitus, cardiovascular diseases, chronic respiratory diseases and cancer. It is an opportune moment for the ministry to give relevant attention to non communicable diseases. The diseases/conditions addressed by the cluster on Prevention and Control of Non- Communicable Diseases/Conditions include; Cardiovascular Diseases, cancers, Diabetes, Chronic Obstructive Pulmonary Diseases and sickle cell disease Prevention and Control of NCD The non communicable disease programme was established in 2006/07 Financial year to plan, implement and coordinate actions aimed at preventing and controlling NCDs in Uganda. The increasing urbanization and changing lifestyles is exposing most of the population to unhealthy life styles and this is immensely contributing to the rising incidence of NCDs. The aim of the NCD programme is to reduce morbidity and mortality attributable to NCDs through appropriate interventions. Lead programme indicators NCD survey carried out to determine; o Prevalence of diabetes among >25 yr olds o Prevalence of raised BP among >25 yr olds o Prevalence of current daily tobacco smoking among >15 year olds o Percentage of Health facilities with the capacity to provide adequate NCD prevention and management services Coverage of cervical cancer screening Annual plan 2010/11 top indicators (implementation) Report of the Uganda NCD Survey Coverage of cervical cancer screening Main achievements 2010/11 Uganda NCD Survey planning completed Draft 0 Uganda NCD policy developed Draft 0 of the Uganda cancer strategy developed MOU for establishing specialized services for management of Type 1 diabetes signed The Cervical cancer screening was costed although not yet funded. 116
139 Main challenges 2010/11 Lack of reliable baseline data on the prevalence of NCDs and their risk factors. This is delaying formulation of evidence based NCD policies as well as developing comprehensive and integrated interventions against NCDs Insufficient community awareness on NCDs, leading to high prevalence of NCD risk factors, late presentation of patients to health facilities for proper treatment and poor treatment outcomes Inadequate capacity of the existing health system to provide quality NCD services, specifically there is an insufficient number of adequately trained health workers and lack of appropriate NCD screening, diagnostic and monitoring equipment at appropriate levels of health care. Unavailability/High cost of medicines and supplies for effective management of NCDs, particularly at lower level health facilities. Understaffing of the NCD Programme Lack of funds to scale up screening for cervical cancer Lack of funds to support operational activities for mass vaccination of HPV, yet free vaccines were donated by MERCK. Recommendations for annual plan 2012/13 Implement the Action plan of the Global Strategy for the prevention and control of Non communicable diseases. Empower the NCD programme with more staff and required resources to enable it to fulfil its mandate. Promote partnerships with Development Partners, the Academia, Civil Society Organisations and others to strengthen the Ministry s financial and technical capacity to implement NCD prevention and control interventions Commence implementation of the cervical cancer strategy, beginning with scaling up of cervical cancer screening and mass HPV vaccination. Available data from the HMIS shows that the number of new patients attending OPD with hypertension and diabetes is increasing annually. Diagnosis Number 2008/ / /11 % of total % of total % of total OPD OPD OPD attendance Number attendance Number attendance Hypertension 185, % 190, % 200, % Diabetes Mellitus 81, % 75, % 86, % Source: MoH, HMIS 117
140 The continued lack of community based data has delayed the formulation of evidence based national NCD policies and strategies as well as the development of a comprehensive and integrated action plan against NCDs in our population. There were limited public awareness activities for prevention and control of NCDs Injuries, Disabilities and Rehabilitative Health The element of injuries, disabilities and rehabilitative health aims at decreasing the morbidity and mortality due to injuries, common emergencies and disabilities from visual, hearing and age-related impairments. This can be due to damage or harm done to or suffered by a person before or after birth. Such deprivation or loss of competency includes conditions like: deafness, blindness, physical disability and learning disability. Lead Programme Indicators Visual impairment reduced from an estimated level at 0.8% to 0.7% Hearing impairment reduced from 8% to 0.6% Provision of assistive devices to PWDs who need Reach 80% of the population with messages on disability prevention and rehabilitation. All Trachoma endemic districts reached with mass distribution of Azithromycin and Tetracycline during Child Days Plus activities. Trachoma prevalence studies conducted in all suspected trachoma endemic districts. Increase provision of eye lid rotation surgical services to patients with Trachoma trichiasis from 10% to 30%. Annual Workplan Indicators Advocacy plan on disability prevention in place No and type of IEC materials produced No. of International Days commemorated No. of H/workers trained No. of Policies, Standard Guidelines and Strategic plans developed. Main Achievements during 2010/201 Low Vision guidelines produced and disseminated NTDs five year integrated strategic plan developed. 362 wheelchairs donated by the Church of the Later Day Saints distributed to PWDs. In collaboration with partners involved in Road Safety Campaign launched A Decade of Action on Road Safety at Malaba. 32 health workers trained in wheelchair assessment and fitting. Twelve (12) OCOs trained in Low Vision assessment and refraction. In collaboration with ICRC Mbale orthopedic workshop re-activated for production of assistive devices. 118
141 Main Challenges Understaffing Inadequate support to orthopedic workshops Low priority accorded to disability programmes at all levels. Coordination of many stakeholders with varying interests. Injuries and disabilities are an increasing problem as a result of road traffic accidents. Many of the road traffic accident victims end up with permanent disabilities. Trauma due to other causes is among the top ten causes of morbidity in Uganda. Diagnosis 2008/ / /11 % of total % of total OPD OPD attendance Number attendance Number % of total OPD attendance Number Injuries = (Trauma due to Other Causes) 627,412 2% 641,987 2% 657,542 2% Injuries - Road Traffic Accidents 122, % 124, % 131, % Source: MoH HMIS CSOs have been actively involved in rehabilitation and provision of assistive devices. The proportion of the population reached with messages on disability prevention and rehabilitation has increased in trachoma endemic areas with support from Sight Saver International Mental Health The mandate of the mental health program is policy formulation, planning, resource mobilization, setting standards, capacity building, coordination of interventions that address the high burden of mental health problems in Uganda, which stands at about 13% of the burden of diseases. The program aims at ensuring increased access to primary and referral services for mental health, prevention and management of substance abuse problems, psychosocial disorders and common neurological disorders such as epilepsy. Programme indicators Mental Health Law enacted by 2011/12 Mental Health Policy finalized and operationalized by 2010/11 Operationalise mental health units in all RRHs by 2010/11 Community access to mental health services increased from 60% to 80% A community strategy for prevention of mental health problems developed by 2013/14 119
142 Planned output 2010/11 Commemoration of World Mental Health Day, World No Tobacco Day and the International Day against Alcohol and Drug Abuse. Develop IEC materials for mental health, tobacco control and alcohol abuse control Orientation of Health Workers in use of the WHO ASSIST Tool for assessment of substance abuse; and training of Regional Trainers in mental health service delivery Finalize drafting of the Mental Health Bill for presentation to Cabinet Development of a Communication Strategy for Mental Health community education Supervision of mental health services at 8 Regional Mental Health Units Main achievements Mental Health Bill Drafted and ready for presentation to Cabinet Training of Regional Trainers in mental health with support of SHSSP Project Draft Communication Strategy for mental health education to the community developed Mental Health Policy Drafted and ready for presentation to Top Management Main challenges Gross underfunding of the programme in relation to the mandates Lack of progress due to multi sectoral nature of activities e.g. Mental Health Bill drafting Programme is understaffed. Recommendations for annual plan 2012/13 Increase funding to the programme in order to complete consultation process for Mental Health Policy, Tobacco Control Policy, Alcohol Control Policy and Drug Control Master Plan Strengthen inter sectoral collaboration through consultative meetings to hasten process of policy development and implementation Implement the proposed restructuring to increase staff in the Mental Health Programme A number of interventions were implemented to address the high burden of mental health problems in Uganda. According to the MoH HMIS, reported new mental health problems accounted for almost 1% of all new cases with epilepsy as the most common mental health problem. Diagnosis 2008/ / /11 % of total OPD % of total OPD Number attendance Number Number attendance Epilepsy 176, % 185, % 194, % 120
143 Other Forms of Mental Illness 24, % 29, % 32, % Anxiety Disorders 20, % 21, % 23, % Depression 18, % 20, % 22, % Mania 13, % 12, % 17, % Schizophrenia 10, % 9, % 13, % Alcohol and Drug Abuse 9, % 8, % 12, % Total 273, % 287, % 315, % Source: MoH HMIS Community access to mental health services has been increased by the construction of mental health units at Regional level and provision of essential mental health and anti-epilepsy drugs. There is need for strengthening the program through increased community awareness and strengthening the legal and policy environment for mental health service provision Oral Health The aim of the oral health program is to improve the oral health of the people of Uganda by promoting oral health and preventing, appropriately treating, monitoring and evaluating oral diseases. Lead programme indicators Oral health policy implementation guidelines developed and disseminated. The proportion of HC IVs with well equipped and functional dental units increased The proportion of the population with access to primary oral health care increased Annual plan 2010/11 top indicators (implementation) Oral health care guidelines developed Sensitisation materials prepared Oral health education and screening for oral diseases Main achievements Health workers have been trained on oral health care School teachers guide on oral health care developed School oral health education conducted. 121
144 Main challenges Inadequate equipment in most hospitals and HC IVs. Lack of dental supplies infrastructure in the most districts. No recruitment of dentists in districts and dental oral health education coverage is still very low due to low funding and under staffing. Recommendations for annual plan 2012/13 Integration of oral health into maternal and child health, nutrition, HIV/AIDS and school health programmes. Procurement of dental materials and equipment for RRHs and GHs Equitable deployment of oral health workers in the districts. The oral health policy implementation guidelines were not developed due to inadequate resources. The number of new OPD attendances due to oral diseases and conditions was 535,650 in 2010/11, 551,810 reported in 2009/10 and 518,861 in 2008/09. The quality of services offered to this high number of patients is affected by the lack of functional dental units and inadequate oral health professionals at lower levels. There is need to prioritize procurement of dental equipment and deployment of oral health workers in the districts Palliative Care The aim of palliative care is to improve the quality of life of patients and their families facing the problem associated with disease not responsive to cure, through the prevention and relief of suffering by means of early identification, assessment and treatment of pain and other symptoms, physical, psychological and spiritual. Lead programme indicators Guidelines and standards for palliative care developed. All hospitals and HC IVs providing palliative care. Adequate stocks of appropriate medication and supplies at palliative care centers are available. Annual plan 2010/11 top indicators Roll out palliative care to Hospitals and lower level health facilities in central region Train village health teams in palliative care Ensure adequate stocks of oral morphine in NMS for use by palliative care centres in Uganda Integrate palliative care in to health training school syllabus 122
145 Main achievements 2010/11 Palliative care centres functionalised in Namutumba and Mayuge districts VHTs trained and successfully integrated into palliative care activities in Namutumba and Mayuge districts Oral morphine is available at National Medical Stores for order by accredited centres Palliative care has been successfully introduced in syllabus of health training institutions. Main challenges 2010/11 There is still limited appreciation of Palliative Care among most health facility managers, the public and policy makers. Inadequate funding to meet the training needs for the health workers. There has been slow scale up of Palliative Care services to districts. Recommendations for annual plan 2012/13 Intensify on awareness creation amongst health workers, facility managers and policy makers on palliative care Strengthen partnerships with development partners for further action and resource mobilisation Increase the number of health workers with skills in palliative care The Palliative care pilot model implemented in Namutumba and Mayuge district has demonstrated the capacity of lower levels units in providing quality palliative care services thus increasing access to palliative care. Lessons learnt should be used to scale up palliative care services in other districts Nursing The nursing profession provides the largest workforce in the health sector in a diverse environment thus participating in a wide spectrum of service delivery. The department of Nursing is responsible for promoting collaboration and coordination of nursing and midwifery activities amongst stakeholders nationally and internationally while ensuring adherence to ethics and standards. Annual plan 2010/11 top indicators (implementation) Proportion of planned technical support supervision visits to identified health facilities conducted Proportion of planned capacity building workshops (leadership, management and skills building in clinical area) for nurses and midwives conducted Draft policy guidelines for nurses and midwives in place Collaboration and coordination meetings attended/conducted 123
146 Main achievements Conducted 8 Technical Support supervision visits and mentored nurses and midwives in 2NRHs, 6 RRHs, 8GHs and 6 HC 1Vs; and carried out integrated interdepartmental support supervision between the nursing departments, Reproductive Health Division to the 7 UNFPA supported districts (Masindi, Kanungu, Kabong, Katakwi, Yumbe, Moroto and Amuria) Conducted Capacity building workshop for 25 nurse leaders in leadership and management skills Drafted the Nurses and Midwives policy guidelines, started on the development (Nurses and midwives strategic plan) of the implementation framework for HSSIP 2010/ /15 for nurses and midwives, finalized the scheme of service for nurses and midwives to incorporate new cadres e.g. comprehensive nurses, degree nurses; and developed a proposal on the Development and implementation for scope of practice for Nurses and Midwives. Conducted 3 coordination meetings to streamline and harmonize of nursing activities both nationally and internationally; attended ECSACON scientific conference in Zambia. Main challenges Inadequate resources for the implementation of planned activities Lack of orientation of newly posted nurse leaders at various levels in management and taking up their tasks Lack of routine coordination meetings to harmonize nursing activities at various levels Unreliable transport for coordination and supervision Recommendations for annual plan 2012/13 Scale up technical support supervision visits and mentorship to enhance the provision of quality nursing care Strengthen leadership and management skills for nurse leaders through capacity building Strengthen coordination and collaboration of nursing activities with key stakeholders nationally and internationally. Nurses and midwives cadre are among the critical cadre on demand in the health sector. High attrition rate coupled with low staffing has made the few available overworked and less motivated. There is need to review the staffing norms and implementation of the motivation strategy in order to uplift the quality of services and reduce on absenteeism. 124
147 Integrated Essential Clinical Care The intervention of providing integrated essential clinical care aims at improving access to equitable and quality clinical services at all levels in both the public and private health institutions through:- Strengthening the capacity of hospitals to provide integrated care Increasing the range of health services provided by hospitals Lead programme indicators The functionality of the HC IVs increased from 5% to 50% by 2014/15. Standards for best practice in hospitals established by Blood Transfusion Centres set up in all RRHs (2 each year) ICU/CCU established in 40% of the RRHs (1 ICU in RRH each year) by 2014/15 Annual plan 2010/11 top indicators (implementation) Professional mentorship from National and Regional Referral hospitals to general hospitals and HC IVs Number of policies, laws, guidelines, plans and strategies developed (Internship policy developed; national fistula strategy finalized; guidelines for Community Health Department Developed; guidelines for infection control committees, human organ transplant bill) Number of integrated and technical support supervision visits to all RRHs and 126 general hospitals Supervision of 5S-CQI-TQM in Tororo, Mbale, Busolwe, Kapchorwa, Entebbe and Masafu hospitals. Quarterly supervision visits to Community Health Departments in hospitals Number of health workers trained (universal precautions and infection control; hospital management) Number of meetings held (hospital managers, Medical Board, National Internship Committee) Main achievements The National Obstetric fistula strategy was finalized and is in print Guidelines for infection control committees is in final phases of development Guidelines for Health facility management committees/boards were revised All the 13 RRHS were supervised at least once during the year Some general hospitals received emergency supervision to Kitgum, Bududa, Apac, Kisiizi, Mutolere, Nyakibale, Atutur, Gombe, Yumbe, Nebbi and Kamuli. 5S-CQI-TQM sites in Tororo, Mbale, Busolwe, Kapchorwa, Masafu, Gombe and Entebbe hospitals were supervised in all the quarters. Health workers in health facilities in Masaka RRH were trained in universal precaution and infection prevention and control 125
148 Hospital managers meeting was held in Lira RRH, 4 National Internship Committee meetings were held, 16 medical board meetings were held, 49 people were referred for treatment abroad and 42 were retired on medical grounds. Main challenges Lack of funding for the Professional mentorship from National and Regional Referral hospitals to general hospitals and HC IVs program hampered implementation. Delayed and inadequate funding Lack of fund for referring retired and local citizen for treatment abroad Understaffing in the integrated curative division Recommendations for annual plan 2012/13 Solicit funding for the specialist outreach program from National to Regional, District and HC IVs Networking with relevant departments Better staffing for the division More funding for the Medical Board activities National Referral Hospitals There are two national referral hospitals, Mulago and Butabika offering a range of specialized care services. Mulago Hospital Mulago Hospital is the National Referral Hospital for those who require specialized and superspecialized care. Its official bed capacity is 1,643 beds. The average bed occupancy for FY 10/11 was 95%. Annual plan 2010/11 top indicators Target Number of outpatient services to 700,000 Number of inpatients (New Admissions) 140,000 Number of patients requiring emergency services attended to 60,000 Number of patients who received specialized services 180,000 Number of Laboratory tests carried out 1,800,000 Number of radiological imaging carried out 60,
149 Main achievements 2010/11 Number of specialized outpatients attended to 120,201 Number of general outpatients attended to 730,012 Number of inpatients attended to 145,241 Number of emergency cases attended to 52,103 Number of Laboratory tests 1,202,259 Number of patients Imaged 63,552 Main challenges 2010/11 Understaffing Under funding especially for recurrent expenditure like on food for patients High patient turn up Poor infrastructure especially for staff accommodation. Recommendations for annual plan 2012/13 Continue to work with MOH and KCCA to fast tract the decongestion of Mulago Hospital. Rehabilitate and construct staff houses. Advocate for increase of the budget. Butabika Hospital Butabika Hospital is the National referral hospital for Mental Health. It has 550 beds capacity and bed occupancy was 126% in 2010/11 Lead Programme Indicators Number of inpatients Number of outpatients Number of outreach visits conducted. Number of support supervision visits registered. Number of staff houses constructed. Annual Plan 2010/2011 Top Indicators (Implementation) 28,000 mental patients and 50,000 medical outpatients attended to. 127
150 46 outreach clinics conducted, 2600 patients attended to. 4 staff houses constructed. 6,000 patients admitted, investigated and treated. Main Achievements 2010/11 Provided inpatient mental health services to 2,248 and 3,874 patients on first visit and readmission respectively Mental health outreach clinics where 2,396 patients were treated. Provided Mental Health Training to 471 students from various institutions of higher learning 629 patients were resettled to their homes. Provided general outpatient and PHC services to 28,131 in the specialized mental health clinic and to 50,390 patients with general medical conditions Three staff houses constructed Main Challenges 2010/11 Inadequate funding High patient numbers vis a - vis the available facilities. Understaffing Recommendations for Annual Plan 2012/13 Increase budget by 50% Operationalise the referral system for Mental Health Care. Approve proposed staffing structure and accordingly fill the vacant positions Diagnostic and Blood Transfusion Services 1. Uganda Blood Transfusion Services The main goal of Uganda Blood Transfusion Services is to collect, process, provide safe and adequate blood and blood products and promote safe blood transfusion practice. This is through seven regional blood banks located in Mbarara, Mbale, Gulu, Fortportal, Kitovu, Arua and Nakasero and six blood collection centers in Jinja, Soroti, Lira, Hoima, Rukungiri and Kabale. In addition, it oversees a national blood donor education and recruitment programme as well as handling education and training in blood safety. In playing these roles, Uganda Blood Transfusion Services plays a central role in prevention of HIV/AIDS transmission and other blood borne diseases e.g. Hepatis B, syphilis. 128
151 Lead programme indicators Total number of blood units collected form voluntary non-remunerated donors % of donated blood screened in a quality controlled manner No. Of blood units discarded after screening Proportion of health units receiving 100% of blood units used for transfusion from UBTS Number of blood donors counselled for any TTI. Annual plan 2010/11 top indicators (implementation) Number of blood donor mobilisation sessions Total number of units of blood collected and processed Number of regional blood banks constructed No of supervision visits carried out Main achievements 2010/11 4,511 blood collection sessions held 187,828 out of 200,000 planned blood units collected from VNRBD Expansion of Nakasero Regional Blood Bank completed 227 health care facilities received blood 4 supervision visits undertaken Main challenges 2010/11 Inadequate funding Inadequate infrastructure Inadequate outreach to potential donors Recommendations for annual plan 2012/13 Increase funding for Blood transfusion activities GOU/ Donors Construct RBBs for each regional Referral hospital Improve clinical interface for appropriate blood use The UBTS is facing increasing demand for safe blood provision in respect to the growing population and increasing access to services by functionalizing the HC IVs. Construction of the Regional Blood Banks and procurement of consumables needs to be prioritized to enable the UBTS provide adequate supplies of safe blood. 2. LABORATORY SERVICES Lead programme indicators Percentage of health facilities with laboratory services fully supporting UNMHCP Percentage of laboratories that are successfully participating in EQA schemes 129
152 Percentage of outbreaks with laboratory confirmation Percentage laboratories certified and accredited by international and national agencies Annual plan 2010/11 top indicators Number of guidelines/policies developed and implemented Laboratories accreditation Percentage of laboratories successfully participating in external quality assessment Main achievements 2010/11 Developed and started implementing a 5-year-strategic plan for laboratory services Developed a laboratory testing menu, VEN classified list of laboratory supplies, standard list of laboratory equipment and laboratory physical infrastructure standards for different levels of care Initiated the preparation of 22 laboratories (including 2 national reference, 2 national referral hospital, 6 regional hospital and 14 general hospital) for accreditation Administered proficiency panels to 250 laboratories with about 60% registering satisfactory performance Confirmed 12 out of 19 (64%) of outbreaks investigated Main challenges 2010/11 Inappropriate management structure of laboratory services in the country Lack of regional role in the coordination of laboratory quality assurance at lower level facilities Inadequate national laboratory information management systems Recommendations for annual plan 2012/13 Expedite the restructuring process so as to improve on the laboratory services management Strengthen the role of regional hospital laboratories in coordination of laboratory quality assurance in lower level laboratories The process of strengthening laboratory services in Uganda was started by developing a 5 year strategic plan for laboratory services. there is need to operationalise this strategy by putting in place the relevant management structures, carry out accreditation and ensure provision of adequate laboratory supplies. 3. RADIOLOGY SERVICES Lead programme indicators To provide a wide range of quality diagnostic and imaging services To conduct a research To provide support supervision to regional and district hospitals. 130
153 Annual plan 2010/11 top indicators (implementation) Number of modern radiological equipment procured in all hospitals Percentage of the equipment properly maintenance throughout the year Number of support supervision carried out to the upcountry hospitals to ascertain the service delivery Main achievements 2010/11 Supplied imaging equipment to HC IV and Hospitals Operational research was conducted and publications made Continuing professional development through workshops and conferences by the various associations that bring together Radiation Workers were carried out Main challenges 2010/11 Rapid Technology advances require that we keep updating our equipments listless we fail to get spare parts on the market Frequent break downs and delayed repairs due to lack of service contracts. The service contracts cannot be financed by the current budgetary allocations Lack of consumable for the radiological services Recommendations for annual plan 2012/13 Ensure that there are service contracts to enable repair the available equipment in all hospitals Procure modern radiological equipments as recommended by NACME for hospitals country wide Streamline the supply of consumables for the radiology services in hospitals A limited range of radiology and imaging services are mainly provided by referral and general hospitals and specialized diagnostic centres in the country. Imaging equipment was installed in some HC IVs and hospitals and users trained. Most of the x-rays in hospitals are very old requiring replacement. There is need to revamp the entire radiology and imaging services by ensuring availability of functional equipment, trained personnel and provision of adequate supplies. The new guidelines should be disseminated and operationalized. 131
154 3.4 Integrated Health Sector Support Systems During HSSIP 2010/ /15 the sector will focus on putting in place the necessary inputs that are needed, to ensure there is improved access to health services. These inputs relate to the human resources, infrastructure (including equipment, ICT and transport), and medical products Human Resources for Health The health sector is committed to attainment and maintenance of an adequately sized, equitably distributed, appropriately skilled, motivated and productive workforce in partnership with the private sector, matched to the changing population needs and demands, health care technology and financing. Core HSSIP indicator % of posts filled by skilled Health workers % Annual reduction in absenteeism rate Lead programme indicators Number of districts with functional Human Resource Information System (HRIS) Number of Human Resource for Health managers trained in Leadership and Management Number of RRH trained in Results Oriented Management. Percentage of health managers in RRH with signed Performance Agreements. Plan 2010/11 top indicators (implementation) Human resource audit report in districts and RRHs. Number of newly recruited staff appointed, deployed and inducted Training in leadership and management Regional Referral Payroll Monitoring report Number of PNFP health training institutions monitored Scale up the HRHIS to districts Main achievements HRIS training was conducted in an additional 19 districts and software installed. Audit conducted in all districts (Biannual Reports produced) supported by Uganda Capacity Programme. Training for 16 trainers was done by external trainers from Capacity plus in Washington during November December The 16 HRH leaders received a TOT training in leadership and management. These will champion the training of other HR leaders at both central and district levels in the subsequent years. 132
155 The first training course of 32 HR leaders from 7 LGs was conducted at HMDC Mbale for Eastern Region. The districts trained included Mbale, Butalejja, Busia, Amolatar, Namutumba, Dokolo and Kamuli. A total of 57 health workers were trained in mentoring. Out of these, 27 were from National, Regional, General and Military Hospitals and 30 were from Kabale School of ECN, Kabale Regional Hospital and Health Centres. The 57 mentors will mentor students during practicum training. Progress has been made on institutionalization of HR leaders at hospital level. A position of hospital director for regional referral hospitals was created and the first batch of 10 hospital directors was provided with appointment letters. Work to refine the performance management strategy was initiated with broad consultation with stakeholders including the Results Oriented Management (ROM) unit of the MOPS. The draft strategy was presented to HRH stakeholders in the Human Resource Technical Working group for their input. The strategy is being finalized by the key stakeholders. Main challenges Inadequate resources to induct all new staff High attrition of health workers especially in districts Low wage bill Low morale and high absenteeism Recommendations for annual plan 2012/13 Improve funding to the sector especially wage bill provisions to enhance both the numbers and pay levels. Improve working conditions (Equipment and accommodation) Strengthen Management and supervision of health workers at all levels. A range of planned activities were implemented towards improving the health workforce however, significant improvements may not be achieved without addressing the issue of numbers. The MoH should advocate for recruitment, remuneration and motivation of the health workforce Health Infrastructure Development and Management The health sector continues ensuring access to quality services through provision and maintenance of functional, efficient, safe, environmentally friendly and sustainable health infrastructure including laboratories and waste management facilities for the effective delivery of the UNMHCP, with priority being given to consolidation of existing facilities. 133
156 At the beginning of HSSIP 2010/ /15, the proportion of households living within walking distance to health facilities is estimated at 72%. Most facilities are in a state of disrepair, do not have the required facilities for them to function effectively (e.g. staff housing, water and energy, theatres, equipment, stores etc) and required ICT and related infrastructure. These tend to compromise the efficiency, quality and access of these services. Lead programme indicators The proportion of the population of Uganda living within 5 km of a health facility increased from 72% to 90% by The number of health facilities increased by 30% by The proportion of HC IIIs and HC IVs with complete basic equipment and supplies for addressing EmoNC increased to 100%. The proportion of HCIVs and hospitals with functional ambulances for referral increased to 100%. Sixty percent of medical equipment are in good condition and maintained. Annual plan 2010/11 top indicators Hospitals and health centres constructed and rehabilitated Hospitals and health centres equipped Motor vehicles and other transport equipment procured Capital works monitored, supervised and appraised Main achievements On schedule rehabilitation of hospitals and supply of medical equipment in the Central Region (Masaka and Mubende RRHs) Health Facilities Inventory list prepared and ready for printing. Routine servicing and repair of solar energy packages and imaging equipment and theatre equipment in Health facilities under the Energy for Rural Transformation (ERT) and the Country Wide Imaging Supply and Installation (ORET) Projects across the country Procurement of Consultants and contractors for construction of clinical laboratories at Gulu, Kabale, Jinja and Fort Portal RRHs and Blood Banks at Gulu and Fort Portal Support to referral hospitals, externally funded projects, districts and the entire Health Sector in Health Infrastructure development Main challenges Inefficiencies in the procurement process both within and outside the Ministry (process of getting Contracts Committee awards and approvals from Solicitor General) Inadequate funding for the quantum of requirements Late release by MoFPED as well as late payment to Service providers leading to delayed completion and payment of interest 134
157 Recommendations for annual plan 2012/13 The entire procurement process within and without the ministry to be made more efficient for timely execution of works Sufficient funds to be voted towards improvement of infrastructure throughout the country including ring fenced funds for medical equipment maintenance Prompt payment of service providers to ensure timely completion and avoidance of interest on delayed payments Progress in consolidating and renovating existing facilities as well as equipping facilities was rather slow and therefore there was minimal increase in access to quality services. Facility and inventory records were not updated and therefore difficult to monitor status. Local Governments and central institutions should submit regular inventory reports so that the sector can keep track of availability and functionality of the infrastructure and equipments Management of Essential Medicines and Supplies Over the period of the HSSIP 2010/ /15 priority will be given to increasing access to essential, efficacious, safe, good quality and affordable medicines and other health supplies at all times. Core Indicators The percentage of health units without monthly stock outs of any indicator medicines (43 % of health facilities did not have stock out of any of the six tracer medicines in the FY 2010/2011 first line antimalarials, Depoprovera, SP, measles vaccine, ORS, Cotrimoxazole). Lead programme indicators The funds in the MOH budget for procurement of EMHS increased The service level of NMS for all EMHS increased The % of NDA budget directly financed by GoU (consolidated funds) increased Guidelines for donated medicines developed by 2012 Annual plan 2010/11 top indicators Hold 12 TWG and 8 UMTAC meetings to update EMHS and Laboratory supplies lists and two regional workshops with the regional pharmaceutical persons Develop integrated training materials in medicine and health supply logistic management. Establish a quantification, procurement and planning unit (QPPU) Conduct support supervision in 400 units and provide on job training on Medicine Logistics Management in lower level health facilities Procure 135 motor cycles to support strengthening of supply chain of EMHS in 45 districts Procure Two servers for MoH Headquarters 135
158 Main achievements Conducted eight TWG meetings, three UMTAC meetings and three workshops to update Health supplies lists. The EMHS and Laboratory supplies lists are ready for printing. One regional meeting was held for the regional pharmaceutical personnel. Developed integrated training materials for medicine and health supply logistic management. Established a quantification, procurement and planning unit (QPPU) Conducted support supervision in 442 health units with additional support from Implementing Partners, SURE, STAR EC and SUSTAIN. 59 motor cycles procured with support from SURE for Central and Eastern regions to support the supervision of the supply chain for Essential Medicines and Health Supplies Two servers procured with support from SURE to facilitate coordination of the Supply Chain Management System between NMS, MoH and districts and the establishment of the National Pharmaceutical Information Portal A new stores and dispensing soft ware programme was piloted in three hospitals (Masaka, Butabika and Kayunga) with a plan to roll out during the FY 2011/2012. Main challenges Late processing of funds leading to late execution of activities Persistent Inadequate Human Resources that affect the planning and management of Medicines and Health Supplies at all levels of care. Direct budget support to NDA from Government was not achieved Recommendations for annual plan 2012/13 Continued capacity building of the supply chain for essential medicines and health supplies Monitoring and support supervision of the medicines and health supplies management in the sector. Strengthening hospital planning and management of EMHS There is a positive trend in improving access to essential medicines and health supplies as shown by the reduced level of stock outs from 41% in 2009/10 to 47% in 2010/11. Systems strengthening interventions by the SURE project and increased funding for medicines from government with last mile delivery need to be acknowledged and scaled up for even better achievements. 136
159 3.4.4 National Drug Authority National Drug Authority (NDA) was established by the National Drug Policy and Authority (NDP/A) Act, Cap. 206 (Laws of Uganda 2000 Revised edition) to promote use of safe, efficacious and good quality medicines. Annual plan 2010/11 top indicators (implementation) Inspection and licensing of drug outlets pharmacies 7,000 drug shops Inspection and licensing of local manufacturers - 1 cgmp audit and 3 follow-up inspections per factory Post Market Surveillance - Support Supervision conducted in 87 districts Destruction of drugs - 2 tonnes per region per year Testing of samples (drugs, condoms, medical gloves and LLINs) drug samples, 500 condom samples, 110 gloves Vetting of promotional materials applications Pharmacovigilance activities Main achievements 2010/11 Licensed: 529 pharmacies and 5,453 drug shops (106% and 78% of planned respectively) All the 13 local pharmaceutical facilities were inspected for renewal of annual license. Seven of them have so far been licensed while others are awaiting follow up inspections to review their corrective actions prior to consideration for licensing. Support supervision was conducted in 89 districts at regional level and 57 districts for the Veterinary unit. A total of 1,241 samples of products from ports of entry and the market were picked for analysis out of which 610 passed, 42 failed and 589 are pending outcome of analysis. Out of the failed samples 13 product recalls were carried out, 3 were pre-market samples from Rene Industries Ltd and these were eventually destroyed while the rest were counterfeit medicines unearthed during operational Mamba III that took place in July trips were made to Luwero industries in Nakasongola in which 853 tonnes of expired drugs were destroyed. These included: tonnes of expired pharmaceuticals from Government of Uganda (NMS) and 32 tonnes of expired pharmaceuticals from NDA head quarters and some of those abandoned at the ports of entry A total of 196 medicine samples were tested, out of which 176 (89.8%) passed the tests and 20 samples (10.2%) failed the tests. A total of 32 batches of male latex condoms, 45 batches of medical gloves and samples from 47 overseas shipment containers (recorded as 47 batches) of Long Lasting Insecticide treated mosquito nets (LLINS) were tested. While nine (9) batches (7.26%) of medical gloves failed the tests done, all samples of male latex condoms and samples from the 47 containers of LLINs passed the tests done Received 128 applications for vetting promotional materials: a) 123 Applications were approved b) 5 were rejected Wrote show cause letters to herbalists who put inappropriate adverts in the media but they refused to receive them claiming that they are not regulated by NDA. 137
160 Support supervision was conducted in 12 Pharmacovigilance Regional Centres in which technical assistance in Vigiflow was given and review meetings held on the progress of Pharmacovigilance activities. Two Regional Pharmacovigilance Centres were established in Karamoja and Mubende Regional Referral Hospitals. 322 health facilities and 20 health training institutions were visited. 1,127 health workers and 2,166 students were sensitized. 143 ADRs were received at the National Pharmacovigilance Centre and first assessment of the reports was done. 300 District Veterinary Professionals both private and public were sensitized on monitoring and reporting Adverse Drug events (ADEs) in the districts of Katakwi, Soroti, Mbale, Rukungiri, Ntungamo, Ibanda, Kiruhura, Kasese and Mbarara. Main challenges in FY 2010/2011 Inadequate funding has affected NDA s activities Gaps in the NDP&A Act: a) The Act does not explicitly provide for regulation of cosmetics, medical and veterinary devices, health care products, public health products, chemicals for public health use, vaccines, blood and biological products. b) The Act does not provide for effective enforcement and deterrent penalties. NDA does not have sufficient powers to effectively control illegal practices and counterfeits. The penalties are not sufficiently deterrent and this has partly encouraged recurrent breach of the law. Infiltration into the country of unauthorized medicinal products through the numerous unregulated border points. NDA is unable to designate Inspectors of Drugs at all border points into Uganda due to inadequate staffing. Liberalization of the media industry and abuse by herbalists is rampant. Conflicting and overlapping mandates of health professional bodies have been exploited by some players in the pharmaceutical sector to violate the NDP&A Act e.g. drug outlets being licensed by other health professional bodies Information for Decision Making The health sector requires reliable and accurate information to enable evidence-based decision making, sector learning and improvement. Monitoring and evaluation aims at informing policy makers about progress towards achieving targets as set in the annual health sector plans and the HSSP and to help provide managers with a basis in making decisions. Core HSSIP indicators (relevant to program) Timeliness of district HMIS reporting to the Resource Centre Division Completeness of district HMIS reporting to the Resource Centre Division 138
161 Lead programme indicators The proportion of implementing partners (NGOs, CSOs, Private sector) contributing to periodic reports Community based HIS established and linked to HMIS by The proportion of quarterly HMIS reports submitted Proportion of planned validation studies that are carried out The proportion of sub national entities (districts, health facilities) that have reported on the key indicators as planned Annual plan 2010/11 top indicators (implementation) 4 National HMIS Stakeholder coordination meetings held Training of all district Biostatisticians and HMIS focal persons in the revised Integrated HMIS tools Improvement of the MOH internet bandwidth from 1MB to 4MB Redesigning of the MOH website to allow for faster navigation and updated information (access address: Finalisation of the e-health policy and National HIS Proportion of technical support supervisions carried out to encourage mentoring and skill transfer to districts and health facility staff in data management Main achievements 2010/11 Held an International Data Use workshop for all data producers and users and 3 National HMIS Stakeholder coordination meetings Trained all (112) district Biostatisticians and HMIS focal persons from lower level health facilities in 50 districts (200 health workers) in the revised Integrated HMIS tools Acquired a server for DHIS 2 and HMIS data management. Improved the MoH internet bandwidth from 1MB to 4MB with extension of Internet connectivity to remote sites of the MoH (Chemotherapy and TB/Leprosy programmes) Redesigned of the MoH website to allow for faster navigation and updated information (access address: Main challenges 2010/11 Under staffing both in number and skills mix given the increasing demand on the Resource Centre ( DHIS 2, PIP, LMIS, HRIS, Data warehouse, Enterprise Architecture, Standards & Codes, etc) Under funding to implement all activities related to the mandate Inadequate provision of Health data capture tools for HMIS Inability to capture health data in the HMIS from private practitioners Lack of a Corporate Anti Virus to safe guard all Ministry IT equipment 139
162 Recommendations for annual plan 2012/13 Increased funding to address the challenges towards a successful implementation as outlined above (the carrying out data quality assessments, continuous mentoring and skill improvement in data handling and management, etc) Faster restructuring process to review the numbers of staff and skills mix required given the increased workload and expectations of the Resource Centre as it is a cross cutting division supporting the entire sector. Provision of a Corporate Anti Virus to safe guard all Ministry IT equipment Quality and timely data is essential for knowledge management. The sector revised the HMIS and trained Health Information Assistants. There is need to increase access to IT services to all districts so that timely data is submitted and feedback given. Use of data is still a problem and therefore health workers at all levels need to be trained in use of information for decision making Quality of Care The HSSIP 2010/ /15 emphasizes the provision of high quality health services by all. This is ensured through regular supervision, inspection, mentoring, quality improvement interventions; and establishment of dynamic interactions between health care providers and consumers of health care with the view to improving the quality and responsiveness (including gender responsiveness) of health services provided. Core HSSIP indicator % clients expressing satisfaction with health services (waiting time) Lead programme indicators Appropriate standards, guidelines and tools developed and disseminated. Proportion of planned support supervision visits that are carried out National Quality Improvement Framework and Strategic Plan operational Mechanism for client/right holders redress established and operational. Annual plan 2010/11 top indicators Standards and guidelines developed Standards and guidelines disseminated Support supervision provided to Local Governments and referral hospitals 140
163 Achievements Launched the Uganda Clinical Guidelines (UCG) 2010 and Patient Charter 2009 and disseminated 9,000 and 5,000 copies respectively to all 112 districts. In process of finalising the Infection Control and Prevention guidelines; and the Radiation and Imaging guidelines. 4 Area Team visits conducted covering all 13 Regional Referral Hospitals and the 112 Local Governments focusing on the DHOs, public and private general hospitals and HC IVs Finalized draft for the National quality improvement framework and Strategic Plan Developed concept notes for development a national hospital accreditation system and development of a comprehensive supervision, monitoring and inspection system and submitted for procurement of consultancy services Developed terms of reference for client satisfaction survey and procurement of consultant initiated under the UHSSP. Study on Quality Improvement in; Palliative Care in Mayuge and Namutumba districts; New Born Care in Masaka and Luwero districts; Patient Involvement in Kyenjojo, Kasese, Kibale, Hoima, Kyankwanzi, Masindi, Kyegegwa and Kabarole districts; Pilot study conducted on Chronic Care Model in Buikwe ongoing with support from USAID Health Care Improvement Project. 5S Kaizen-TQM strengthening supported by JICA implemented in 15 districts with focus on improvement of the work place environment. Main challenges Inadequate, late release of funds at all levels of health service. Lack of logistics, e.g. sound means of transport, fuel etc. and adequate number of personnel in local government to conduct effective support supervision and monitoring. Under staffing in the health sector. Recommendations for annual plan 2012/13 MoFPED to increase funding for the health services. MoH to provide logistical support for support supervision. Improve staffing at all levels. A national client satisfaction survey was not carried out to determine the level of satisfaction with health care service. The revised Uganda Clinical Guidelines were distributed in both soft and hard copies to ensure provision of expected essential clinical care services especially at primary health care level patient charter disseminated in all districts. Quarterly support supervision visits were carried out to all LGs focusing on the DHOs, hospitals and HC IVs. Observed improvement in areas of focus during follow up visits and impromptu inspection visits. Staff attendance of duty is noted to have improved. Due to inadequate funding, lack of supervision guidelines and skills, LGs are not carrying out regular supervision of lower level health facilities. The MoH should build capacity of LGs to carry out effective supervision. 141
164 Development Partners are supporting implementation of quality improvement initiatives in most of the districts and QAD developed the National Quality Improvement Framework and Strategic Plan aiming at harmonization and institutionalisation of quality improvement Health Policy, Planning and Support Services Review and develop relevant Policies, Acts and regulations governing health which are gender responsive and human rights compliant and to ensure their enforcement. Currently there are several obsolete laws and regulations in the sector that require revision in order to better ensure the enjoyment of the rights they are supposed to support. Examples include the Public Health Act, the Food Safety Act, and the Mental Health Act. The Policy Analysis Unit in the MoH and Health Professional Councils are responsible for strengthening the legal and policy environment conducive for the delivery of the minimum health care Policy Analysis Lead programme indicators Number of policies reviewed and developed Annual plan 2010/11 top indicators (implementation) Policy review meetings held Health related policies and regulations reviewed Emerging health issues, conditions and therapeutic interventions that require new legislation and policies identified Main achievements 2010/11 1 RIA report completed (NHIS) 1 policy document (PPPH) ready for submission to Cabinet Reviewed the Mental Health Bill Reviewed the Malaria strategic plan Main challenges Understaffing Lack of official communication equipment/ mechanisms (Transport, telephone) Slow/ No feedback on presented papers. Recommendations for annual workplan 2012/13 Review of obsolete policies/ health laws Capacity for activity costing built. 142
165 The degree of contribution of the Policy Analysis unit to the health sector policy review and development was minimal. The plan was to review at least 2 policies quarterly but only 3 out of 8 were reviewed. The Policy Analysis Unit needs to identify the obsolete laws and regulations in the sector and develop a plan for review. The Policy Analysis unit needs to facilitate coordination of policy development in MoH and other related sectors to ensure harmonization and mainstreaming of health issues Planning The aim of planning is to ensure efficiency in resource allocation, management and utilization. Core Indicators General Government allocation for health as % of total government budget Lead Programme Indicators Development of a health financing strategy by June 2011 Government per capita expenditure on health increased to 12$ by 2014/2015. Annual plan 2010/11 top indicators (implementation) Annual workplan 2010/11 developed Annual performance report 2009/10 Joint review report PPPHC report Operationalise the NHIS Capacity building for all districts in health services planning and management Finalization of the National Health Insurance operationalization frame work/bill Technical review report Efficiency studies conducted Main achievements 2010/11 Conducted and launched the NHP II and HSSIP 2010/ /15 Annual report produced Conducted the Joint Review Mission Built the Capacity of the secretariat and Task Force in health insurance in South Korea, Germany and Brazil. 143
166 Technical analysis and review of the design of the scheme by the Task Force, stakeholders and other collaborating partners (P4H: World Bank, WHO, ILO, Governments of Germany, Switzerland and France). Regional sensitization on the NHIS was carried out in the East with District representatives of the districts in Teso Region, Tororo Region and Bugisu Region Efficiency study conducted Main challenges 2010/11 The sectoral coordination role by the planning division is not matched with the resources including the time available. Expansion on the number of districts not matching the resources and technical support for planning. Sectoral policies and strategies which are not evidence based and researched especially in the context of determinants of health. Limited capacity of local institutions to handle the demand and supply sides of NHIS Abolition of user-fees in publicly owned health centres and general wings of hospitals, poor quality of care pose both policy and operational dilemmas. Recommendations for annual plan 2012/13 Establish a regional tier of administration and management for health services as a strategy to strengthen oversight planning and management functions. Roll out of the Health Economics and Systems Institute policy. Carry out further technical studies especially in the area of human resources and NHIS All planned workplans and reports were produced by all levels. Regional planning meetings were conducted as planned. Other planned activities like the Technical Review Mission and operationalisation of the NHIS were not achieved due to inadequate resources including time. The increasing number of districts neutralizes all efforts in increasing funding to local governments because of the increasing administrative costs and also stretched the central level in their oversight role. Establishment of a regional tier of administration and management for health services should be prioritized Finance and Administration Services The department of finance and administration is composed of; (a) Minister s Offices (b) Senior Top Management (PS, DGHS, Directors offices) (c) Administration Division (d) Accounts Division (e) Personnel Division (f) Procurement and Disposal Unit (g) Internal Audit (h) ICT Unit 144
167 Responsible for providing political direction, giving policy guidance and rendering support services to enable the Ministry fulfil its mandate of providing quality and equitable preventive and curative health services to public Ministerial and Top Management Annual plan 2010/11 indicators Issue weekly press statements to disseminate the ministry s strategies to improve Health Care Management. Inspect the delivery of health services in 13 RRHs and 15 General Hospitals. Hold monthly press conferences to update the public on the efforts of the ministry to improve health service delivery. Monitor medicines distribution, storage, allocation, records and dispensation system in districts. Supervision of PHC activities in 20 districts quarterly. Monitor the functionality of HC IVs and HC IIIs in 15 districts quarterly. Support supervision of DHTs in 15 districts quarterly. Main achievements 2010/11 Issued press statements on the outbreak of Ebola, Hepatitis outbreak in Kasese and the crackdown on illegal Private Health institutions. Inspected service delivery in 13 RRHs and 15 General Hospitals. Held press conferences to update the public on the Ebola outbreak, World Midwifery day, World Malaria Day and Reproductive Health. Inspected the management of medical supplies in several districts. Supervised PHC activities in several districts. Monitored the functionality of HC IVs and IIIs in the districts. Did support supervision of DHT activities in all the regions. Managed to re-furbish the Hon Minister s office Ministerial and Top Management was actively involved in providing political direction, giving policy guidance and monitoring service delivery. 145
168 Administration and support services Annual plan 2010/11 indicators Prepare and submit activity and financial reports for all the quarters (1 st, 2 nd, 3 rd and 4 th 2010/11) to MOFPED. Prepare and submit to PAC, responses to all queries raised on the accounts of the ministry for financial year 2008/09, and FY 2009/2010. Inspect the utilization and accountability for PHC Grants in the Districts. Inspect the utilization of the Development Budget in 13 RRHs. Ensure all the outstanding financial advances are accounted for. Inspect and assess the standards of financial book keeping, maintenance of accounting records and adherence to financial regulations and procedures in the districts. Inspect the utilization of salaries for interns in 13 RRH s. Pay all staff emoluments in time. Enter Frame Work Contracts with providers for procurement of vehicle repair services, tyres as well as clearing and forwarding services. Coordinate the organization of public events / observances that fall within the quarter for example World Health Day, World Red Cross Day, International Nurses Day and World Children s Day. Payroll monitoring in 13 RRHs Complete and submit 5 Cabinet Memoranda Main achievements 2010/11 Activity and financial reports for the 1 st, 2 nd, 3 rd and 4 th quarter prepared and submitted to MOFPED Responses to queries raised in Audit Reports for FY2008/9 and the Management letter of the Auditor General prepared and submitted to PAC and Auditor General respectively. Inspected utilization of and accountability for PHC Grants in all the regions. Inspected utilization of the Development budget in 13 RRHs. All staff salaries for the 12 months fully paid in time. Frame work contracts for procurement of stationery, tonner and news papers approved (MCC) while those for motor repairs will be ready in the first quarter of 2011/12. World Health Day, World Red Cross Day, International Nurses Day and World Children s Day, World Environment Day, World No Tobacco Day were observed. Managed to install the CCTV cameras for security Teamwork greatly improved in the PDU The PDE is up to date with most of the PPDA reports Initiation of the health sector procurement forum Completed a number of framework contracts e.g. stationery, toners, hotels, advertising Piloted a mini procurement tracking system Registered good rating in the Procurement Performance Measurement System by PPDA 146
169 The PDE has not lost a single Administrative review Replaced the vandalized computers on the 4 th floor Major challenges Unforeseen / unbudgeted but important and urgent expenditures Lack of access to the IFMS by staff who are key in the processing of payments Incomplete and irregular financial requisitions from staff Poor and delayed accountability from staff Irresponsible handling of queries raised by oversight and accountability agencies of Government Delays in submission of procurement plans and performance reports by user departments Frequent interruptions and breakdown of the IFMS User departments do not adhere to Procurement Plans and PPDA Regulations Late initiation of procurements Delayed procurement evaluation processes Inadequate office space The Administration and Support Services units rendered services to enable the Ministry fulfil its mandate however delays in some areas like procurement affected implementation of planned activities especially in capital development projects. The lack of space led to delay in settling in of new officers and affects coordination within departments. There is urgent need to reorganise and reallocate office space to improve efficiency in service delivery Legal and Regulatory Framework Appropriate legislation and its enforcement provide an enabling environment for operationalization of the policy and the HSSIP and are essential for an effective health service delivery system. The Health Professionals Councils are responsible for; Strengthening the legal and policy environment conducive for the delivery of the minimum health care package Promoting enforcement, observance and adherence to professional standards, codes of conduct and ethics Lead Program Indicators Number of relevant international legal instruments on health that have been domesticated Number of law enforcers trained in new legislation and policies to ensure implementation of legislation and policies. An effective regulatory environment and mechanism developed. An adequate and functional staffing structure of Professional councils established over the next five years. A Joint Professional Council with decentralized supervisory authorities established and operationalized over the next five years. 147
170 Uganda Medical and Dental Practitioners Council Annual Plan for 2010/2011 To register and license qualified practitioners and all private health units that meet the requirements of the Council To conduct regular inspection of private clinics in Kampala area and up country. To develop guidelines for CPD for practitioners with a view to making CPD more accessible To conduct quarterly district supervision. To investigate all reported cases of alleged professional misconduct and take appropriate disciplinary measures Major Achievements Inspected 265 Health units in Kampala area. Inspected 145 Health units upcountry. This was done in collaboration with other Professional Health Councils Formed and Sensitized the District Supervisory Authorities in 20 Districts in Northern and Eastern Regions. This was done in collaboration with other Professional Health Councils The Council has established a functional Medical Licensure and Examinations Board which has conducted two rounds of examination for Foreign trained Doctors. The Council has an established web site and published the Register of Practitioners with Annual Licenses in Newspapers. Completed joint inspection and accreditation of all East African Medical and Dental Schools together with other East African Medical and Dental Councils. Completed the Draft proposal on establishment of National Health Professions Authority and the report submitted to the Permanent Secretary Formed and Oriented the Interim CPD Accreditation Committee Major Challenges Inadequate staffing at the Council especially the Inspectorate Inadequate transport. Council has very old vehicles Loophole in the law to enforce Council decisions. Recommendations for annual plan 2012/13 Council must review the Act so as to enable it implement its mandate effectively. Ministry of Health should assist the Council acquire seed money to build its Headquarters. Ministry of Health should second key staff to Council to enable it operate fully. 148
171 Uganda Nurses and Midwives Council Annual plan 2010 top indicators (Implementation) Registration and enrolment of nurses and midwives Technical support supervision of health facilities and health training institutions Inspection and approval of the new schools for nursing and midwifery Conducting continuous professional development (CPD) programmes Sensitization of the Nursing/Midwifery on ethical code of conduct Main achievements Developed a Five year Strategic Plan ( ) Strengthened the registration & enrolment of Nurses and Midwives who successfully complete their courses of study Inspected Health Facilities (HFs) and Health Training Institutions (HTIs) Main challenges Inadequate resources (finance, staff, equipments and transport) Many mushrooming illegal Nursing/Midwifery schools Forgery of academic and professional certificates Limited office space Recommendations for annual plan 2012 Inspect Schools/Universities intending to open up Nursing and Midwifery training programmes. Inspect practicum areas for the training of nurses & midwives to assess suitability Strengthen the Enroll and Register Nurses/Midwives trained within and outside the country. Conduct a nationwide inspection of health facilities to assess their legality and capacity Strengthen collaboration with various stake holders both within and outside the country Establish District Supervisory Authorities (DSA) in selected Districts Decentralize some of the council services through the establishment of regional centres Complete the review of the UNMC Act (1996) Organize a stakeholders meeting to streamline issues related to regulation Strengthen communication and information sharing through the establishment of a web Uganda Allied Health Professionals Council Lead programme Indicators All legible Allied Health Professionals registered All reported cases of Malpractice investigated and disciplinary action taken All Allied Health Professionals issued with annual practicing licenses. 149
172 Annual plan 2010/11 top indicators Number of Allied Health professionals registered Number of Allied Health units licensed Number of Annual practicing licenses issued Number of health facilities and training schools inspected to access quality service Number of cases of unprofessional conduct investigated Minutes of Council and Committee meetings conducted Reports of monthly, quarterly and annual performance submitted Number of CPD meetings conducted Number of Support supervision visits conducted Number of regional offices established Number of district and regional supervisors appointed Main Achievements 2010/11 Registered 1873 professionals, renewed 2065 Annual Practicing licenses and licensed 624 clinics Inspected 15 new Allied Health Training Institutions Inspected private health facilities in central and western regions Established 20 district supervisory Authorities in Eastern and Northern regions Sensitized Chief Administrative Officers (CAOs), District Health Officers (DHOs) and Medical Superintendents on renewal of Annual practicing licenses in central and Eastern regions. Main challenges 2010/11 Understaffing Lack of sound vehicles to carry out inspection in all health units. Inadequate office space. Recommendations for annual plan 20112/13 Establishment of Allied Health Professionals Regional Offices Expanding the Secretariat by appointing Regional Supervisors, Accountant, Administrative officer Renting an office outside Ministry of health Headquarters to accommodate the new officers Pharmacy Council Lead Program Indicators Number of pharmacy standards enforcement visits and joint HPCs activities/ inspections carried out 150
173 Numbers of newly qualified pharmacists Registered Return of the Pharmacy Profession and Pharmacy Practice Bill to Parliament Gazette registered Pharmacists Coordination of internship training for pharmacists Annual Plan 2010/11 implementation Indicators Number of practice units visited and supported technically Number of pharmacists registered, gazetted or de-gazetted Number of internship meetings and activities participated in or coordinated Number of meetings held to fine-tune the Pharmacy Profession and Practice Bill Achievements One University training pharmacy students visited Pharmacy Board members appointed Together with other Health professional Councils established the District Health supervisory authorities in Mbale, Gulu, Lira, Amolatar, Dokolo, Kamuli, Tororo, and Iganga districts and jointly developed a proposal for the Establishment of the NHPRA Registered 57 newly qualified pharmacists during the period Carried out Joint Health professional Councils inspection of private health facilities and reflexology units in Kampala Main Challenges Fragmented and weak regulatory frame work Delays in Enacting the Pharmacy Profession and Pharmacy Practice Bill Difficulty in implementing the provisions of the Pharmacy and Drugs Act 1970 Inadequate Resources Finances, Transport and other logistics Human Resource shortages Limited numbers of internship training centers and supervisors hindering the intake and the training of intern pharmacists, yet the numbers of interns are increasing yearly as the private/public schools release them into the market. Recommendations Ministry of Health to expedite the return of the pharmacy bill to parliament More funds be allocated for Pharmacy Council activities for improved quality of pharmaceutical care There is need for affirmative action in the training and deployment of Pharmacists and Interns. MoH should expedite the process of establishing the proposed NHPRA which will offer additional funding opportunities. During the year under review all Professional Councils were vibrant and worked towards 151
174 During the year under review all Professional Councils were vibrant and worked towards streamlining enforcement and providing an enabling environment for effective health service delivery. The Councils were able to jointly form and sensitize the District Supervisory Authorities in 20 Districts in Northern and Eastern Regions; and submitted a proposal for establishment of a National Professions Authority. The Councils need to be strengthened in terms of human resource to cater for the big workforce Research Uganda National Health Research Organisation The health sector aims at creating a culture in which health research plays a significant role in guiding policy formulation and action to improve the health and development of the people of Uganda. The UNHRO is responsible for coordinating all the health related research in Uganda. Lead programme indicators A policy and legal framework for effective coordination, alignment and harmonization of research activities developed by A prioritized national research agenda developed by Institutions involved in conducting research identified by Annual plan 2010/11 top indicators (implementation) National research priorities coordinated and developed Research aligned and harmonised Consultative meetings carried out in 8 selected districts. Inventory of research, researchers and research institutions developed Develop the strategic plan and standard operating manuals. Main achievements 2010/11 Inventory of Research Institutions being collated, together with individual researchers inventories ongoing. Draft report on research priorities for health available for further discussion. Workshop with Parliamentarians discussed policy options for increasing access to skilled attendance for child delivery held in June Three options were discussed: a) expanding delivery services to HC II, b) use of nursing assistants and c) promoting waiting homes near hospitals. 152
175 56 research articles cleared and permission given for their publication. Inception report for strategic plan only developed Main challenges 2010/11 Discussions are continuing with the stakeholders on funding to operationalize the Act. No funding yet has been allocated to Act. During 2010/11 FY UNHRO started the process of developing an inventory of research, researchers and research institutions. An inception report for the UNHRO strategic plan and standard operating manuals are under development and is expected to guide the alignment and harmonisation of research activities in future. Funds should be allocated for operationalizing the UNHRO Act Natural Chemotherapeutics Research Institute (NCRI) The NCRI formerly Natural Chemotherapeutics Research Laboratory is a research and development centre under the UNHRO created by an act of parliament, the 2009 UNHRO Act. The institution is mandated to carry out research on natural products (plants, animal parts and minerals) and the use of traditional methods in the management of human disease. The institute undertakes the research and development of quality natural products and services for improved health care delivery by applying both indigenous and modern scientific technologies. Annual plan 2010/11 top indicators (implementation) Ethno botanical and ethno pharmacological data collection Development of standards for Good agricultural Practices (GAP) and Good Manufacturing Practices (GMP) for medicinal plants and herbal medicines Training Laboratory and field evaluation of selected herbal formulae Hold 8 th African Traditional Medicine day Main achievements in FY 2010/2011 Ethno botanical and ethno pharmacological data on 5 selected medicinal plants collected and authenticated from Kabale and Dokolo districts. The selected plants were added to the established medicinal plants gardens in the respective districts. Studies to optimize the use of Natural products in the management of priority diseases initiated. Standardization of herbal formulae: baseline studies on the effects of a formula developed for elimination of jiggers carried out in selected areas in Iganga district; 19 families participated in the semifield trials. Partnerships with tertiary institutions established: preliminary plans to determine requirements for establishing a medicinal plants garden for Barham University carried out. Development of standards for Good Agricultural Practices (GAP) and Good Manufacturing Practices (GMP) for medicinal plants and herbal medicines was done through support to 153
176 Traditional Health Practitioners (THP s) who undertook the initiative after undergoing training by the institute. Training: staff underwent training in professional development; 3 staff members trained in project management, 2 staff trained in customer care, 3 staff trained in records management, 2 staff trained in report and minutes writing, 3 staff trained in bioinformatics, 2 staff in pharmaceutical and rational drug use, 3 staff trained in Traditional Chinese medicine techniques and applications, 50 students from tertiary institutions including Makerere University, Mbarara University of Science and Technology and Kyambogo University, trained in laboratory investigative techniques. Laboratory and field evaluation of selected herbal formulae: phytochemical analyses of 50 formulae/ medicinal plants carried out, pharmacological and toxicological evaluation of 8 herbal formulations carried out, standardization of Herbal antidote for poisons is ongoing, and authentication of data on 40 medicinal plants collected is ongoing. The 8 th African Traditional Medicine (ATM) day was held in Dokolo district: 3 preparatory meetings, 1 symposium, publicity on 1 local FM station and publication of a news supplement in the Monitor News paper were done as part of marking the day. Main challenges in FY 2010/2011 The very lengthy procurement process has rendered most of the planned research work difficult to complete on time. Procurement of specialized research requirements like reagents and bio-specimens has also hindered work because of the rules for prequalification and the volumes of supplies being sometimes small for suppliers to honour. Delayed release of funds to implement the planned outputs has resulted in late work and sometimes not in the defined quarters; resource flow needs to be streamlined to enable timely implementation of planned out puts. The available space at the institute is inadequate for all the research activities the institution undertakes. There is need for expansion of the facilities. Recommendations for annual plan 2012/2013 Formalize partnerships/collaborations with stakeholders (Biomedical workers, THPs, patients, students, traders in herbal medicines and other stakeholders. Develop a Traditional Medicines programme: To operationalize existing traditional medicine centers, upgrading of NCRI infrastructure, support network building in the process chain development of herbal medicines and Natural products. Strengthen collaboration with international stakeholders in Natural products research (NAPRECCA, ALNAP and E-SALAMA). Optimize use of Natural products and traditional health systems in management of priority diseases. The NCRI implemented most of the planned activities despite challenges of lengthy procurement processes and delayed release of funds resulting in late implementation. There is need to develop an IEC program for promotion of the use of natural products and traditional health systems as complementary to the conventional health systems. 154
177 Uganda Virus Research Institute (UVRI) UVRI is a semi-autonomous under UNHRO. The Institute s broad mission is to carry out scientific investigations concerning communicable diseases especially viral diseases of public health importance and to advise government on strategies for their control and prevention. Lead programme indicators Number of diseases monitored Number of outbreaks investigated Number of interventions developed Annual plan 2010/11 top indicators (implementation) Laboratory surveillance of measles, AFP, influenza illnesses, HIV and syphilis carried out HCs and homes monitored and surveillance carried out for plague and vectors Number of interventions under study Number trained to build capacity in vector biology. Main achievements 2010/11 Laboratory surveillance of measles, AFP, HIV and syphilis carried out HCs and homes monitored and surveillance carried out for plague and vectors 3 health facilities in West Nile monitored for influenza illnesses Data analysis is ongoing to determine prevalence of HIV and syphilis in ANC samples Provector device placed indoors to kill Anopheles mosquitoes in 50 randomly selected houses in Gombe and Mwaalo villages 4 Msc students trained to build capacity in vector biology. Identification of larvicides to control malaria - Over 100 isolations made Grant application submitted for baseline entomological surveys on the islands of Lake Victoria in preparation of release of GMM in Uganda 2 grant applications developed and submitted; Characterization of larval pathogens; and Developing molecular tools for studying the population biology of mosquitoes of genus Mansonia, a vector of arboviruses Main challenges 2010/11 Lack of funds to carry out field activities. No funds were provided for office supplies with outstanding bills for utilities. Relying heavily on grants and cooperate agreements. To motivate all staff to embrace the culture of research. 155
178 Disease monitoring, surveillance, investigation of outbreaks and interventions are carried out periodically despite the inadequate government funding to UVRI. Research is heavily reliant on grants and cooperative agreements and this is unsustainable. Government should motivate all staff to embrace the culture of research by first adequately supporting existing research institutions to carry out their mandate Public Private Partnership for Health The MoH encourages and institutionalized the involvement of the private sector in the provision of preventive, promotive and curative health care to all Ugandans through the public private partnership approach. The PPPH effectively builds and utilizes the full potential of the public and private partnerships in the health sector Lead programme indicators The National Policy on PPPH is approved by the Cabinet by 2011 Number of districts which have developed a joint public-private District Health Plan Number of districts in which PHP sub-sector contributes to the HMIS. Annual plan 2010/11 top indicators (implementation) Number of PPPH TWG Decisions implemented Number of Districts producing integrated health workplans with private sector stakeholders Proportion of budgeted GOU subsidy to private sector that is advanced to PNFPs Main achievements 2010/11 The draft policy document has been finalised one year ago, but with the failure of approval of the national Policy on PPPH, the Partnership stagnated. Five Regional Workshops 3 to disseminate the National Policy at district level has been conducted. An orientation workshop was organized for the twenty Pilot Districts. It was attended by DHOs, District Desk Officers for PPPH, Diocesan Health Coordinators and relevant representatives of the public and private sector, at central and district level. Twenty pilot districts received furniture and computer equipment by the Italian Cooperation and the Health Initiative for Private Sector (USAID), which provided to strengthen the PPPH District Desk Officers. A number of planning sessions were conducted in five pilot districts. 4 The sessions consisted in the formation and orientation of the PNFP and PHP Coordination Committee for the 3 Jinja, Moroto, Mbarara, Fort Portal, Gulu, Mbale, Wakiso, Rakai, Hoima, Arua. 4 Mpigi, Mityana, Kyenjojo, Kasese, Nakasongola 156
179 district, and a Public-Private district planning exercise to formulate a joint integrated district plan involving private sector stakeholders. The TWG on PPPH has improved its efficiency and the number of meetings conducted during the year (10). The TWG is now chaired by the Director of Health Services (P&D), who has provided his additional competences and technical input to the Working Group. The TWG on PPPH has discussed important aspects of the Partnership with the objective to finalize the submission of the draft National Policy on PPPH to the Cabinet and develop a MoU governing the Partnership between the public and private sectors, two major actions listed among the 16 th JRM resolutions. The TWG has finalized a new list of beneficiaries for the PNFP facilities which will access a credit line for drugs, made available by DANIDA. Criteria for updating the list every year were discussed and agreed, while the discussion is still ongoing on the criteria for inclusion of PHP facilities and NFB-PNFP. The TWG started working on the allocation formula for the government subsidies. Main challenges 2010/11 Securing a certificate of financial implications for the national Policy on PPPH took an abnormally long time, affecting timely approval of the policy Lack of an explicit formal contractual arrangement between PNFPs and GOU poses continued allegations on misuse of public subsidies by PNFPs Continued with-holding of GOU subsidy to PNFPs by District officials (an estimated 3-5 billion shillings was not passed on to PNFPs by Districts) Limited progress on securing the 30 million dollar private sector financing facility from the International finance Corporation due to absence of an approved PPPH policy framework. Recommendations for annual plan 2012/13 Cabinet should expedite approval of the National Policy on PPPH, to boost resource mobilization for PPPH Finalize the draft Implementation Guidelines for the National Policy on PPPH and roll out the policy framework countrywide Draft and sign an explicit formal contractual agreement between the GOU and recipients of public subsidies for health care. The prolonged process (over two years now) of approving the PPPH policy has derailed the momentum the sector had gained towards institutionalization of the PPPH. Nevertheless the MoH has established good collaboration arrangements with the PNFP providers and needs to extend to the PHP sub-sector especially in providing information through the HMIS. 157
180 Health Services and Health Status in Recovery Areas Northern Uganda Action Fund (NUSAF2) support to Health Sector Main achievements 2010/11 The NUSAF 2 for Community Infrastructure Rehabilitation (CIR) approved and funded projects under the Health Sector in 6 of the 55 districts in the region. The total approved project amount is 670M and out of this 348M has been released to the districts. The major beneficiary districts are Bukwo and Nebbi with 5 and 3 subprojects respectively. The projects cover construction of staff houses and VIP latrines. Bukwo is constructing 5 staff houses, Nebbi 3 staff houses, Katakwi and Oyam, 1 staff house each, and Apac and Yumbe 1 VIP latrine each. Table 45: NUSAF2 support to Health Sector District No. of Subprojects Total Budget UGX Amount 1st Trance UGX Apac 1 11,302,948 11,302,948 Bukwo 5 298,393, ,196,500 Katakwi 1 65,155,115 32,577,558 Nebbi 3 219,691, ,845,575 Oyam 1 60,600,000 30,300,000 Yumbe 1 15,512,200 15,512,200 TOTAL ,654, ,734,781 Note: Table summarised from NUSAF2 (CIR) approved and funded projects under the Health Sector, 2010/11 Main challenges 2010/11 The uptake of NUSAF2 investment in the Health sector has been very minimal compared to other sectors as exhibited by only 6 districts benefiting out of 55 districts entitled. NUSAF2 and PRDP resources are community-demand-driven. It has been reported that the Health sector has not created adequate demand. 158
181 Recommendations for annual plan 2012/13 Under NUSAF2 the health sector still has opportunities to access health financing for most of the needed infrastructure development especially staff housing construction. To achieve this there is need to immediately revitalise the linkages between the NUSAF2 and Health Sector at the national and Local Government levels. A rapid infrastructure gap analysis with a view of identifying the most critical areas of support should be conducted to feed into proposals for NUSAF2 support Karamoja Region Background to Karamoja Region Karamoja region is located in the North Eastern part of Uganda and is home to the following major ethnic groups; the Jie, Bokora, Dodoth, Matheniko and the Thur. The region s population of just over 1,220,000 people mainly practices agro-pastoralism. The region is composed of seven districts namely Moroto, Napak, Amudat, Nakapiripirit, Kotido, Kaabong and Abim. For decades, Karamoja region suffered generalized, inter communal violence/insecurity fueled by cattle raiding, proliferation of small arms, lack of water for animals, and recurrent food insecurity. Because of these background characteristics, the region remains the remotest and least developed in the country with high levels of household poverty, illiteracy, low access to quality social services and high levels of morbidity and mortality. Under five mortality in Karamoja is 27% higher than the national average of 137/1,000 live births while maternal mortality ratio is 72.4% higher than the national average of 435/100,000 live births (UBOS, 2006). The Health System in Karamoja Region The health system in Karamoja is comprised of 101 formal health facilities, about 2,987 VHTs of which 99% have been trained, 10 Health Sub Districts, 7 District Health Offices and a host of development partners. There is 1 Regional Referral Hospital, 4 General hospitals, 4 Health Center IV s, 33 Health Centre III s and 59 Health Centre II s. The recent past has seen increased interest by the central government and development partners to revamp the region s development. Districts have benefited in the following key areas; human resources for health, infrastructure, health information systems, equipments and service delivery. Sectoral governance and stewardship is also being strengthened to enhance planning, implementation, supervision, monitoring and evaluation of services. Some of the key development partners involved in strengthening the health sector in Karamoja are but not limited to; WHO, UNICEF, Italian Cooperation, Doctors with Africa CUAMM, International Rescue Committee, Faith Based Organizations, Action Contre La Faim, MSF and CESVI. In 2010, regional partners working under the auspices of the ALIVE partnership of UNICEF commissioned a study titled Comprehensive health facility functionality assessment for Karamoja. This assessment was carried out by CUAMM with contributions from all the key 159
182 stakeholders at all stages. It covered key input, process and result areas of all the six, WHO proposed, health systems building blocks. The study results show that; 94% of the units had management committees of which 99% had expired, 66% of the facilities had not done any single staff meeting in a quarter and 50% of them had no copies of their own annual work plans, only 14% and 29% of midwifery positions at HCII, and HCIII levels were filled. All-type cadre absenteeism rate was 22.5% although this rate was as high as 45% among HCII s in Abim. Stock out rate for the 6 tracer medicines was registered at 77%. Close to half of all vaccine containing facilities never updated temperature control charts for the week prior to the survey. About 40% of the facilities failed to submit monthly HMIS reports timely to the HSD. Majority of the in charges could not readily estimate or identify the facility s total income and expenditure for the previous financial year-no clear records. The referral system is impeded in decreasing order by lack of transport and communication capabilities (90.8%), financial constraints (5%), difficulties in making definitive diagnosis (2%) and insecurity (2%). 10% of the HCIIs were able to provide between 4 to 6 of the basic EMOC signals functions while only 15% of the HCIIIs could provide all the 7. A number of HCIIs registered more than 3 deliveries per month. 2 of the 4 HCIVs do not provide the complete package of comprehensive EMOC signal functions. Health sector interventions in Karamoja region Health sector partners in Karamoja are increasingly making deliberate attempts to improve health systems performance through investing in infrastructure, human resources, health information systems, governance and service delivery. Such investments and expected results thereof are being followed up through regular regional and district level review meetings. These quarterly meetings (besides the monthly districts level health sector working group meetings) are meant to help partners compare notes, share lessons and collectively identify areas of continued need. Apart from providing technical support to District Health Teams in all the 7 districts, CUAMM is passionate about making these fora ever meaningful. Some of the key systems strengthening interventions in the region include; 1. Strengthening health systems governance through meaningful and regular planning and review meetings among stakeholders and collaborative supervision of service delivery. 2. Building of a reliable health information system with demonstrable improvement in information collection, reliability, storage, retrieval, analysis, reporting and use. 3. Development of human resources for health; training and recruitment of staff. For example, CUAMM recruited 24 health workers for hard to reach facilities including 3 medical doctors and 21 nurses most of whom demonstrated good skills in midwifery. Most of these personnel have since been absorbed into the district pay rolls. CUAMM is currently supporting Matany nurse training school in various areas and implementing a UNICEF supported scholarship program that is meant to generate 90 personnel annually. 160
183 4. Infrastructure development; building and rehabilitation of staff houses, theatres, drug stores, maternity rooms, and water systems. 1 district drug store built in Kotido and a 2 in 1 staff house constructed in Kaabong in the Ik land of Morungole. 5. Research; operational research was carried out on the functionality of health facilities, nutrition assessment and disease surveillance. 6. Service delivery; planning, implementation and supervision of both static and outreach services. Hard to reach areas were served through integrated outreaches whose package included Immunization, ANC plus (includes PMTCT) and general clinical care. 7. Establishment, training and tooling of VHTs-UNICEF, WHO, IRC and CUAMM are taking the lead in this process. 100% coverage of villages with trained VHTs already attained. Results of interventions Districts in Karamoja registered an overall 15% improvement in district league positions over the period 2006/7 to (annual health sector performance reports). Figure 14 shows that the region registered a steeper increase in total district league scores than the national average while figure 15 shows that Abim, Kotido and Moroto contributed greatest to this regional trend. Figure 14: Total average district league scores districts for Uganda and Karamoja region 161
184 Figure 15: District league scores Karamoja Positive changes were registered in the following district league indicators; DPT3 coverage rose by an average of 3% per annum, OPD utilization increased by about 6% per annum, the trend in institutional deliveries has been increasing more steeply than the national rate, timeliness in submission of OPD reports rose from 49% in 2005/06 to 82% in 2009/10. Utilization of PHC funds also increased from 56% to 100% during the same period of time. In the year 2010/2011, the region continued to register positive changes in some of these areas. Figure 3 below shows trends in selected interventions over the past 3 years. OPD utilization in 2010/11 dropped by a 12 percentage points from that of 2009/10 while DPT3 coverage, first ANC visits, 4 th ANC visits, dropped by 1%, 3% and 3% respectively. On the other hand the proportion of pregnant women tested for HIV remained at 89% and institutional deliveries increased from 12% to 14%. The results demonstrate that, although progress is seen and is possible it remains fragile owing to extra-systemic constraints beyond the control of local governments and their partners. 162
185 3.5 Monitoring and Evaluation of Implementation of the HSSIP 2010/ /15 Monitoring and evaluation (M&E) of implementation of the HSSIP 2010/ /15 is based on periodic reporting and periodic reviews of information generated by the HMIS and other official data sources like surveys. M&E aims at informing policy makers about progress towards achieving targets as set in the annual health sector plans and the HSSP and to help provide managers with a basis in making decisions. Lead programme indicators The proportion of implementing partners (NGOs, CSOs, Private sector) contributing to periodic reports Community based HIS established and linked to HMIS The proportion of planned periodic review that are carried Timeliness of reporting Completeness of reporting Proportion of planned validation studies that are carried out The proportion of sub national entities (districts, health facilities) that have reported as planned Selected data disaggregated by age & sex with concomitant gender analysis Annual plan 2010/11 top indicators Number of sector performance review meetings held HSSIP 2010/ /15 M&E plan finalised Proportion of data validation exercises carried out The proportion of sub national entities (districts, health facilities) that have reported as planned Timeliness of reporting Completeness of reporting Monitoring and evaluation studies carried out Achievements Three health sector quarterly performance reviews were held with participation from all departments and autonomous institutions. Finalized the HSSIP 2010/ /15 M&E Plan. Period progress reports submitted to OPM and MoFPED Participated in the UDHS -5 coordination committee meetings. Data collection carried out by UBOS. SMER TWG supported the School of Public Health in protocol, progress and draft report review for the Health System Assessment Survey. HIV Epidemiological surveillance report 2010 produced and disseminated by UACP HIV/AIDS indicator survey conducted. Data compilation ongoing by UACP PMTCT Data validation study conducted and disseminated by PMTCT program Tracer medicines availability study 2010, conducted and disseminated by Pharmacy Division 163
186 Evaluation Studies Malaria Programme Review 2011 conducted by UMCP. A binding MoU stipulating the way forward was reviewed, adopted and signed by all in-country RBM partners on May 27, 2011 and disseminated. The finding to be used for developing a new malaria program strategic plan. EPI Programme Review conducted by UNEPI and disseminated findings to key stakeholders. The findings are being used to develop costed Multi-year plan for EPI that will be used for resource mobilization. Main challenges Structure for implementation of new roles and responsibilities for sector M&E not defined. Performance review not conducted at sub national levels Annual Joint Review Mission activities not budgeted for under the GoU budget Recommendations for annual plan 2012/13 Formalise M&E implementation structure with clear roles and responsibilities. Clear budget allocations for operationalization of the HSSIP 2010/ /15 M&E plan including funding for the Joint Review Mission Support sub national levels to conduct regular performance review meetings M&E activities were implemented though in an uncoordinated manner due to lack of an established institutional structure for overall sector M&E. The HMIS component (Resource Centre) implemented planned activities as planned focusing on data management. The QAD also implemented activities related to sector performance review (quarterly); development of performance indicators for the HSSIP and JAF; reporting to the OPM and MoFPED (OBT); and coordination of the SME&R TWG activities. The QAD also took the central role in the development of the HSSIP 2010/ /15 M&E plan which when operationalized will guide the Country-led M&E system. 164
187 3.6 Data Quality report Figure 16: National health facility data quality assessment: summary of results Area Indicator National (%) Districts with low score (%) Completeness of district reporting 2 Completeness of facility % of expected monthly facility reports reporting received 3 Accuracy of event % of monthly district reports that are reporting (zero/missing zero/missing values (average for 4 values) indicators) 4 Accuracy of event % of district values that are extreme reporting (extreme outliers (+/-3 SD) (average for 4 outliers) indicators) 5 Accuracy of event % of district values that are moderate reporting (moderate outliers (+/- 2SD) (average for 4 outliers) indicators) 6 Accuracy of event % difference between monthly reports reporting (discrepancy and end-of-year report (average for 5 between monthly reports indicators) and end-of-year report) 7 External data verification % of agreement between data in sampled facility records and national records for the same facilities for 3 core indicators 8 Accuracy of population projection 9 Accuracy of population projection 10 External comparison: DTP3 11 External comparison: Institutional deliveries % of monthly district reports received 98% 94% 3% [1] 9% [1] Estimated number of live births from country projections divided by number derived from UN population projections Projected population divided by the 92% 85% 9% [2] 33% [2] 3% 12% 4% [3] 18% [3] 0.3% 0.2% 8% [4] 7% [4] 4% 3% 35% [5] 19% [5] NA 25% NA 9% [6] Assessment not NA done (last one 2008) 104 NA [7] % [8] Coverage from facility reports divided by survey for the most recent comparable year (2007) Coverage from facility reports divided by survey for the most recent comparable year (2005) 22% [8] NA NA [1] % of districts with less than 80% completeness of monthly reporting [2] % of districts with monthly facility reporting rates below 80% [3] % of districts with more than 20% zero values [4] Number (%) of districts in which at least one of the monthly district values are extreme outliers in any of the four indicators (+/-3 standard deviations from the district mean) [5] Number (%) of districts in which more than 5% of the values are moderate or worse outliers (+/-2 standard deviations); [6] % of districts which are more than 33% difference between district monthly reported values and end-of-year totals [7] The expected population is computed based on the first visit antenatal coverage rate; [8] Percent of districts which are more than 33% off the expected population; 165
188 Introduction Almost no health data can be considered perfect. Data quality assessment is needed to understand how much confidence can be put in the health data presented. Population-based surveys employ standard well-accepted methods to assess and make adjustments for data quality, with documentation of changes made and rigorous quality control mechanisms. Administrative and health facility data are the basis for annual monitoring and also need to be assessed in a systematic manner. Quality data on health sector performance should be available on a regular, preferably annual basis. Population-based surveys are conducted only periodically, usually once every 3-5 years, and as such do not always reflect current health realities. Health facility data are collected and aggregated on a continuing basis and thus could present a timelier picture. Such data have a number of limitations related to quality, such as missing values, bias, and computation errors. Furthermore, to obtain population coverage rates, assumptions need to be made about the denominators, the target population, which is prone to errors. This annex aims to describe the data quality assessment and adjustment procedures for health facility data to meet the demand for annual reporting on key indicators. Reporting completeness rate 1. The Uganda Ministry of Health Resource Centre receives monthly outpatient and inpatient reports from all districts. In addition, the districts report the totals once a year to the Resource Centre. There is an element of timeliness in the completeness rate: all reports need to be received before the 28th of the following month. Table 45 shows the monthly reporting completeness for 2008/09 and 2010/11, as well as the districts with poor reporting. District reporting completeness is slightly higher in 2009 (98%) compared to 2011 (94%). The reporting completeness for 2011 may increase slightly as late submissions are sent from districts and processed. All districts with poor reporting completeness in 2011 were new districts, with the exception of Busia. In addition, while 108 of 112 districts submitted an annual report (96%), the 4 districts that failed to submit one were new districts. The district reporting completeness rate is computed as the total number of monthly district reports received divided by the total expected number of reports. New districts from 2011 are shown in bold. Table 46: District monthly reporting completeness rate and districts with poor completeness rate National district monthly reporting completeness rate Number (%) of districts with completeness rate below 80% (80 districts) (112 districts) 98% 94% 2 (3%) 10 (9%) 166
189 Districts with completeness rate below 80% Buliisa, Kabarole Alebtong; Busia, Kole, Luuka, Lwengo, Mitooma, Ngora, Ntoroko, Nwoya, Sheema 2. All public and private-not-for-profit facilities are expected to report to the district every month. The facility reporting completeness is defined as the total number of monthly facility OPD reports received over the total expected number of monthly facility reports received x 100%. Table 46 shows the facility reporting completeness for 2008/09 and 2010/11, as well as the districts with low completeness rates. Facility reporting completeness is higher for 2009 (92%) compared to 2011 (85%), although the latter may not fully account for late submissions. As for district reporting completeness, many of the districts with poor reporting are new districts. New districts from 2011 are shown in bold. Table 47: Facility reporting completeness rate and districts with poor completeness rate National facility reporting completeness rate Number (%) of districts with completeness rate below 80% Districts with completeness rate below 80% Missing data and outliers (80 districts) (112 districts) 92% 85% 7 (9%) 37 (33%) Amuria, Arua, Bugiri, Iganga, Kabarole, Kamuli, Mayuge Alebtong, Amuria, Budaka, Buhweju, Bulambuli, Buliisa, Busia, Butambala, Buvuma, Buyende, Isingiro, Kaliro, Kalungu, Kanungu, Kasese, Kibuku, Kiryandongo, Kitgum, Kole, Luuka, Lwengo, Masaka Mbarara, Mitooma, Moroto, Namayingo, Nebbi, Ngora, Ntoroko, Ntungamo, Nwoya, Rubirizi, Sembabule, Serere, Sheema, Sironko, Soroti 3. Missing data should be clearly differentiated from zero values in facility reports. However, missing entries are often assigned a value of 0, making it impossible to distinguish between a true zero value (zero events occurred that month) from a missing one (events occurred but were not reported). The monthly HMIS data had blank entries for missing monthly reports, whereas the data filled missing entries with 0. There were 22 districts in 2009 (28%) that had at least one missing/zero value in their monthly reports, compared to 68 districts (61%) in Four percent of districts in 2009 were missing 20% or more of their values, compared to 18% in & 5. The number of services provided may vary from month to month. Large fluctuations in the numbers are however less probable. It is important to identify missing data and outliers, as these can severely distort coverage rates, particularly at the district level. A large number of 167
190 outliers is indicative of poorer data quality. Table 47 shows the number of extreme and moderate outliers for 4 indicators. The percent of data points that were outliers showed little variation between 2008/09 and 2010/11. Table 48: Extreme and moderate outliers among data points for 2008/09 and 2010/11 for 4 indicators Number of extreme outliers outside 3SD of mean 1 Moderate/extreme outliers outside (% of data 2SD of mean 1 (% of data points) points) ANC1 2 (0.2%) 3 (0.2%) 44 (5%) 38 (3%) DTP3 1 (0.1%) 2 (0.1%) 32 (3%) 40 (3%) Institutional deliveries 3 (0.3%) 2 (0.1%) 41 (4%) 40 (3%) OPD 4 (0.4%) 4 (0.3%) 45 (5%) 46 (3%) Total 10 (0.3%) 11 (0.2%) 162 (4%) 164 (3%) 1 Zero values and missing data were excluded from the calculation of the means and standard deviations. They were not included in the counts in the table. Accuracy of reporting 6. Inaccurate reporting is harder to detect than incomplete reporting. This includes unintentional and intentional errors. The Resource Centre conducts annual comparisons between the data compiled from the district monthly reports and the totals reported by the districts at the end of every year. The latter report may include more late reports than the monthly reports, and may also be more prone to data entry errors. Table X compares monthly data with end-ofyear totals for 2010/11 for 5 indicators. There were a number of districts that showed a large discrepancy between the two. Districts with a percentage difference greater than 33% between these two values are shown in the table below. Table 49: Percentage difference between monthly data and end-of-year data at the national level, and districts with a large discrepancy % Difference between monthly and end-of-year data 1 Number of districts with discrepancy > 33% ANC1 74% 18 (16%) DTP3 10% 9 (8%) Districts Bukwo; Busia; Kiryandongo; Lyantonde; Manafwa; Masaka; Masindi; Mayuge; Mbale; Mbarara; Mityana; Moroto; Moyo; Mpigi; Mubende; Mukono; Namayingo; Sembabule Alebtong; Kapchorwa; Kiryandongo; Lyantonde; Mitooma; Otuke; Sheema; Sironko; Soroti Institutional 12% 7 (6%) Alebtong; Buhweju; Kiryandongo; 168
191 deliveries Mbale; Sembabule; Sheema; Soroti OPD 16% 9 (8%) Alebtong; Amolatar; Busia; Kiboga; Kiryandongo; Masaka; Mitooma; Ntungamo; Sembabule IPT2 12% 8 (7%) Alebtong; Buhweju; Busia; Kiryandongo; Mitooma; Mubende; Sembabule; Soroti Total 25% 51 (9%) 1 Between the mean of the non-zero monthly reports and the end-of-year total divided by No data verification exercise was conducted for 2010/11. The most recent data verification exercise was conducted in 2008 by the Resource Centre5. A comparison was conducted between the national level and facility data in all 80 districts for 3 monthly reports during the preceding year. The data validation exercise established that the national level coverage rates were too high for both IPT2 (ratio facility / national data was.95) and DPT3 (.92) and too low for deliveries in health units (1.04). Overall, however, these errors are relatively small and indicate good reporting. Population denominator accuracy There are quite a few districts with coverage rates over 100% for indicators such as DTP3, which is indicative of an inaccurate denominator. District populations in Uganda are based on projections from the 2002 census, and may not sufficiently account for migration between districts. Also district health services may attract clients from other districts and serve a catchment population which is larger than the one living within the district boundaries. The accuracy of the national population projection can be checked by comparing denominators from the UBOS population projection with denominators derived from alternative sources. The higher the level of consistency between denominators from different (reliable) sources, the more confidence can be had in the accuracy of the population projections. 8. Alternative source for number of live births: An alternative estimate for the number of live births can be computed using the most recent CBR estimate from the UN Population Division. UBOS estimates live births to be 4.85% of the total population; CBR from the UNPD for is 46.3 per Consistency ratio = (Estimated number of live births from UBOS)/(Estimated number of live births using UNPD CBR)= Alternative population estimates (national and district) can be computed if the following data are available: (1) accurate data on a numerator of an indicator (2) reliable population estimates of coverage from surveys. Uganda has had a high rate of first visit antenatal care (ANC1) coverage (over 90%) over many years (same rate in DHS2001 and DHS2006), with little 5 Ministry of Health. Report of the data validation exercise. Kampala. October
192 variation across all nine regions (90-99%). Assuming that the ANC1 numerator from the facility reports is correct (after data validation) and assuming a constant ANC1 coverage of 94% for all districts, it is possible to assess the accuracy of the population projection at national and subnational levels. An alternative estimate of the population is obtained by multiplying the official population by the consistency ratio, the population coverage of the intervention based on the facility reports divided by the assumed true population coverage based on the survey data. The consistency ratio gives an idea of how close the intervention coverage from facility reports is to the coverage obtained from survey data: the closer this ratio is to 1(=100%), the higher the consistency. ANC1 coverage computed from facility reports is 95% for both 2008/09 and 2010/11, which yields a consistency ratio of 101% for the national population projection. This suggests that the national population is approximately correct. The number of districts that have a consistency ratio less than.67 (i.e. official population figure is too high, resulting in ANC1 coverage that is too low) is 14 in 2011 (13% of districts). This is approximately the same percentage as in 2009 (10%). In addition, the number of districts that have a consistency ratio above 1.33 (i.e. the official population figure is too low, resulting in ANC1 coverage that is too high) is 11 in 2011 (10% of districts), compared to 11% in There was considerable overlap in the districts with under/over-estimated populations between 2009 and Table 50: Consistency ratio for ANC1 at national level, and districts with very low and very high consistency ratios Consistency of national population projection Districts with consistency ratio under 67% (official population is too high) Districts with consistency ratio over 133% (official population is too low) External comparison (80 districts) (112 districts) 8 (10%) Adjumani; Amuria; Buliisa; Kaabong; Luwero; Moyo; Nakapiripirit; Yumbe 9 (11%) Abim; Budaka; Butaleja; Gulu; Iganga; Kaliro; Kampala; Lyantonde; Pallisa 101% 101% 14 (13%) Adjumani; Amudat; Amuria; Kaabong; Kalungu; Kitgum; Kween; Luuka; Lwengo; Moyo; Napak; Ntoroko; Soroti; Yumbe 11 (10%) Abim; Budaka; Buyende; Gulu; Jinja; Kisoro; Kyegegwa; Lyantonde; Nwoya; Serere; Sheema 10 & 11. A comparison with population based data obtained from surveys and community research studies is also an important way to assess the quality of estimates generated by health facility data. Table 50 shows a comparison of coverage rates for DTP3 and institutional deliveries from population-based surveys and from facility reports. Table 51: Comparison of coverage rates from surveys and from facility reports Ratio (Coverage from facility Most recent Facility reports (HMIS) data/coverage from survey x 100%) survey DTP3 79% 1 84% 91% 107% 114% Deliveries 41% 2 34% 39% 83% 95% 1 National Service Delivery Survey UDHS
.")
, Uganda 2000-2010 The comparison of the results for the indicator on four or more antenatal care visits (ANC4+) and delivery care between the")

193 Figure 17 shows the DPT3 coverage trend generated from the HMIS reported data for children under 1 year, as well as the results from the UDHS in and of the National Service Delivery Survey 2008 for children months (referring to under 1 immunization the year before the survey). There is a large gap between the DHS results and the HMIS in 2005 which suggested over-reporting in the HMIS. In 2007, however, there was no such gap, suggesting good completeness of reporting. Figure 17: Trend in DTP3 coverage under 1 year of age (%), Uganda The comparison of the results for the indicator on four or more antenatal care visits (ANC4+) and delivery care between the annual estimates generated by the HMIS and the DHS results for three years preceding the 2005/06 shows good consistency. The correspondence of the ANC 4+ coverage rates for the period is very good. The institutional delivery rates in the DHS report are higher than those reported by the HMIS. In the UDHS 2006, however, 29.1% of deliveries were in public sector facilities and an additional 12% in private sector facilities. The latter includes notfor-profit and for-profit facilities. The HMIS includes not-for-profit facilities, but not for-profit facilities. Figure 18: Comparison of HMIS and DHS coverage rates for institutional deliveries and ANC four or more visits. 171
194 Adjusted coverage rates The district league tables can recomputed with the adjusted district populations. Table 51 shows the district league table scores and ranks (adjusted and unadjusted) of the top and bottom 15 scoring districts for 2010/11, based on the ranking using the adjusted district populations. Districts that increased/decreased more than 40 places in the ranking are shown in bold. Table 52: Top 15 and bottom 15 scoring districts based on ranking using adjusted district populations. District Adj. score Adj. rank Unadj. score Unadj. rank District Adj. score Adj. rank Unadj. score Unadj. rank Kampala Kibaale Kitgum Busia Katakwi Kibuku Kapchorwa Kyegegwa Masaka Kiryandongo Bushenyi Kole Moyo Alebtong Kabarole Moroto Kumi Sheema Mukono Buyende Amuria Namayingo Yumbe Mubende Bududa Amudat Soroti Buhweju Mbarara Mitooma
195 3.7 Progress on Implementation of the Priority Actions of the 16 th Joint Review Mission Action Means of Verification I. Health Financing 1. Review resource allocation formula for the sector. 2. Institutionalisation of National Health Accounts. Resource Allocation Formula guide National Accounts Health Progress RAF has been reviewed and approved by SBWG and SMC. The consultant is yet to have discussions /consultations with the CSO and PNFP Health providers to develop the formula for NGO subsidies Other grant resource allocation formulas have been widely discussed and ready for stakeholder consultation. The technical team and steering committee have been formed and the technical team trained on NHA study. Road map, work plan and proposal for NHA institutionalization and implementation has been developed and approved in SBWG and SMC The MOH with support from ECSA and other partners have set aside a Budget for carrying out NHA exercise this financial year 2011/12. TORs for procurement of a consultancy to offer technical assistance has been developed and procurement process is ongoing. Comments The draft report will be discussed in HPAC/TMC this financial year. The plan is to complete the process by January 2012 and carry out dissemination by April 2012 and use the formula for resource allocation in FY 2012/13. The NHA for financial year 2009/10 is scheduled to start by November
196 Action Means of Verification 3. Develop a health financing Health Financing strategy. Strategy 4. Output based budgeting and transparency. Budget estimates, BFP and MPS for FY 2011/12 Progress Consultations on going with TMC and all other stakeholders on the contents of the strategy Budget estimates, BFP and MPS developed with input from all stakeholders using the OBT. Comments The strategy is expected to be discussed in the JRM The TMC reviewed all the work plans and Budgets to ensure compliancy, value for money and transparency. 5. Improve quarterly financial reporting and accountability. All Health institutions and policy makers consulted during the preparation process. The social services committee of parliament played a major role in the agreed outputs. Quarterly reports There is been timely preparation of OBT quarterly financial and progress reports to stakeholders. Timely accountability is still a challenge 6. Increase funding for hospital along the high way. Approved 2011/12 Budget There has been increased funding to the Hospitals along the highways. 17 General Hospitals and 2 RRHs along the high ways will be rehabilitated this financial year under the JICA, GOU and World Bank funding, 2 hospitals under PHC development grant and 13 RRHs under the GOU development grant. Feasibility studies have been carried and procurement processes are ongoing. The hospitals will be equipped and ambulances provided. II. Human Resources for Health More drugs will be procured and distributed to the Hospitals, 174
197 Action Means of Verification 1. Implement the staff Quarterly and Annual motivation strategy to Progress Report FY enhance attraction, 2010/11 retention and productivity (submit health system strengthening proposal including HRH to GF). Progress All 24 districts covered through payment of 30% increments as wage component. Sponsorship of students by MoH for health training at basic, postbasic and postgraduate levels has targeted inservice health workers and particularly those hailing from hard to reach and work districts Comments Implemented by MOPS Due to inadequate funding not all components have been implemented 2. Expedite recruitment, appointment, and deployment of health professionals starting with the enrolled nurses and midwives. HRH Report Occupational Safety Strategy for Health (OSH) Hard to reach Recruitment ban in LGs did not allow Need to lift recruitment ban in order to attain appropriate staffing levels 3. Develop and implement pre-service training strategy. HRD and Training Policy and Strategy A Consultancy firm has been engaged to develop a Health Sector Human Resources Development and Training Policy Draft HRD and Training Policy is expected by end of 1 st quarter 2011/12 with the support of Baylor Uganda. 4. Strengthen Leadership and management skills at all levels. Training Reports A 24 week curriculum for HRH Leadership and Management (HRH LM) course developed. A pool of 16 National HRH LM course Facilitators were trained. The 1 st group of 26 district, hospital and health sub-district health managers from 7 districts of eastern and northern regions has completed the first HRH L&M course and With the technical support of the MUK SPH and Uganda Capacity Programme Funding the HRH LM plan implementation and follow up supervision remains a 175
198 Action Means of Verification Progress commissioned with district L&M improvement plans. Comments big challenge. III. Health Infrastructure 1. Consolidate existing facilities to make them functional. 2. Develop ambulance management strategy and guidelines Reports HSSIP focus is on consolidation of existing facilities specifically staff housing, maternity units and outpatient departments Rehabilitation and equipment of RRHs Ambulance Strategy and guidelines Being developed under the UHSS project 3. Districts and referral facilities should continue securing land titles in a phased manner. Land Titles Progressing slowly due to inadequate finds 4. Develop a wholesome strategy for managing medical waste starting from segregation at source to disposal materials. Medical Management Strategy Waste Developing draft IV. Essential Medicines and Health Supplies 1. Increase (double) resource envelop for HC II 2m/ 2 month & HC III 3.8m/2 month Allocation on Vote 116 It may not have doubled but it increased substantially 2. Review and update the standard list of essential medicines, laboratory and health supplies. EMLH List The medicine and health supplies list were finalized and ready for printing while the laboratory list we still need to have approval of the different laboratory kits from stakeholders We may not be able to print them before JRM 176
199 Action Means of Progress Comments Verification 3. Advocate for the PPDA Regulations Work in progress The law has already been amendment of the PPDA amended at the moment regulations to provide for the regulations are being drafted and we are involved procurement of medicines & other health supplies under special procedures 4. Align / coordinate all partners dealing in EMHS management and harmonize their training programmes. 5. All orders for health supplies including ARVs should be endorsed by the DHO / MS. Reports Many have come on board This is a continues process and it takes time for some to appreciate the need to align given the fact that some of them pay more allegiance to their funders than MOH Orders submitted Not all orders are endorsed by DHOs Most of those that are sent by do not go through DHO V. Public Private Partnership for Health 1. The National Policy on the PPPH should be expeditiously approved. 2. Finalise and operationalise a MOU governing the Partnership between the public and private sectors. Approved National Policy on PPPH by Cabinet Signed MOU between GOU and Private Sector Was on agenda on 31 st August, 2011, but was not presented due to long a Cabinet business list. On agenda for next meeting Draft MOU for PNFPs has been prepared. Draft for PHPs being worked on with IFC support Securing the Certificate of Financial implications from the MOFPED delayed (received on 24 th August, 2011) Lack of an approved PPPH Policy limiting progress VI. 3. Dissemination and implementation of partnership policy at district level. Maternal and Child Health Reports Dissemination has been done in the 20 districts of Nakapipipirit, Pader, Moroto, Gulu, Kitgum, Jinja, Rakai, Bushenyi, Bundibugyo, Kabale, Nebbi, Arua, Mityana, Mpigi, Nakasongola, Kyenjojo, Kasese, Lira, Kabarole and Masindi. This was supported by the Italian Cooperation in Uganda, and the Health Initiatives for the Private Sector, a USAID supported initiative. The assumption was that the PPPH Policy would be passed in due course. 1. Improve Quality of Care in govt. and PNFP facilities Reports Have developed job aides in various areas of RH (including Family These will contribute towards improvement of quality of care in public and 177
200 Action Means of Verification supplies, personnel recruitment & management. 2. Actively engage retired and unemployed skilled attendants in the private sector (monitoring & supervision, training, mentoring, data management ) etc Reports Progress Planning, Maternal Health, Adolescent Sexual and Reproductive Health, Newborn care). Continued to build capacity in maternal and perinatal death auditing as aimed at improving quality of care. Training guidelines have been reviewed on ASRH, SGBV, and Integrated RH/HIV aimed at Continued Medical Education and professional development for service providers in the public and private sectors. Working with CSOs engaged in Reproductive Health to build capacity for Family Planning service provision on Long Term and Permanent methods of FP. Some retired midwives with training skills were utilized for supervision and supervision activities in the training highlighted under section (above) Comments PNFP facilities and the private sector. Major CSOs involved in RH, specifically Family Planning, include Reproductive Health Uganda (RHU), Marie Stopes Uganda, PACE, Family Health international 360, Uganda Private Midwives Association. 3. Give incentives to mothers to deliver in the public health facilities e.g. Maama kits, soap, suka in Karamoja etc NMS reports; HMIS data. More Maama kits were procured and pushed to HC IIIs, and supplied to HC IVs and hospitals that ordered for them. This is reflected in the increase in percentage of pregnant women delivering in health units recorded in FY 2010/ Carry out maternal and child death audits MPD Audit Reports Tools were made available to districts that were trained in MPDR. Districts highlighted under section (above) During the financial year, 915 Some hospitals like Kitgum, Gulu, Apac, Nebbi that were active in auditing deaths in 2009 were doing so under project support. They became less active in
201 Action Means of Verification VII. Communicable Disease Control Progress maternal deaths were reported to MoH from public and PNFP facilities. 91 deaths were audited and reports sent to MoH. The audits were from Nsambya hospital, Jinja RRH, Kayunga GH, Kamuli GH, Naggalama GH, Mubende GH, Moroto RRH, Katakwi HC IV, Kanungu GH, Nakaseke GH, Kiboga GH and Gulu RRH. Comments allegedly because they were did not have funds. Some hospital like Kiwoko, Nakaseke have recorded significant reduction in maternal deaths due to institutionalization of maternal death audit. These hospitals are now concentrating on auditing perinatal deaths. In hospitals where the hospital administrators are actively involved in the MPDR Committee, there is better institutionalization i.e. better facilitation of MPDR committee meetings, availability of tools and implementation of recommendations 1. Strengthen community disease surveillance and early case detection. Reports Built Epidemic Preparedness and Response Capacity in 30 districts Inadequate funding to train and functionalise VHTs country wide 2. Advocate for enhanced political participation and support in delivery of health services. Advocacy reports No activities reported 3. Training in leadership and governance e.g. in information management and utilization o o Health managers Other stakeholders VIII. Non Communicable Diseases Training reports 16 HRH leaders received a TOT training in leadership and management. The first training course of 32 HR leaders from 7 LGs was conducted (Mbale, Butalejja, Busia, Amolatar, Namutumba, Dokolo and Kamuli) 179
202 Action Means of Progress Verification 1. Complete the Uganda NCD NCD Survey report Procurement contract for Survey on NCDs, their risk survey equipment and factors and social furniture signed determinants Comments Insufficient funds allocated to complete planned activities 2. Scale up NCD prevention and management o Promotion of health styles o Promote screening for early detection o Capacity building: human resource, equipment, medicines and supplies IX. Health Promotion and Environmental Health 1. Scale up training and functionality of VHTs country wide. Reports Framework Convention on Tobacco Control (FCTC) partially implemented. Screening for both cervical and breast cancers has been conducted in the Teso sub-region; Costing of nationwide screening for both cancers completed. MOU signed with Novo Nordisk to supply free insulin and diagnostic equipment; improve infrastructure; train health workers to manage type 1 Diabetes as well as educate children and their families. Steering Committee established to implement MOU VHT Strategy Report VHT Strategy implemented in additional 18 districts Procurement delays Implementation of Global strategies : on Diet, Physical Activity and Health; Against harmful use of alcohol to start when funds are available Scaling up to start when funds are available Support from Novo Nordisk and Life for a Child programme Total number of districts which have fully established stands at 69 Trained VHTs in the 14 districts supported with Job Aids, certificates, protective wear and identification badges. VHTs in Wakiso 180
203 Action Means of Verification 2. Intensify public education through the media and public relations. Progress Activity reports Communication/ public relations specialist recruited. Public education announcements and discussions have been conducted on the print and electronic media Comments received bicycles from WHO and Global Fund. Public education through the media is very expensive and requires adequate funding 3. Facilitate districts (logistically, tools), to enable the staff inspect, supervise and monitor environmental health activities. Activity Reports Inventory Not done during the financial year 2010/11 due to inadequate funding. MoH to procure uniforms for Health Inspectors and Health Assistants during the FY 2011/12 if funds are available. 4. Procure and distribute existing Public Health Legislation to all districts for law enforcement in collaboration with all stakeholders. Copies of PH Legislation in districts None procured Inadequate funding, The division to purchase 1000 copies of Public Health Act during the FY 2011/12 5. Strengthen inter-sectoral linkages and leveraging at all levels to promote health. X. Nutrition Minutes Creation of a Sanitation and Hygiene budget line in the Ministry of Finance Planning and Economic Development. Quarterly Water, Sanitation and Hygiene (WASH) cluster meetings for Karamoja region held supported by UNICEF. The division had a series of meetings with the Sanitation and Hygiene sub-sector Working Group. Progress has been registered in the area of sanitation and hygiene with some of the Karamoja districts achieving 10% latrine coverage more from the previous figures. 1. Develop service standards for what is expected in nutrition at all levels on health care including VHT. Service standards Two meetings so far held to develop the nutrition service standards 181
204 Action Means of Verification 2. Integrate and harmonise Strategies and strategies and guidelines on guidelines micronutrients. Progress Two day stakeholder meetings to develop a consensus held Comments 3. Design nutrition interventions using data for advocacy purposes. Concept and draft 0 developed Reports Health care providers used Emergency Nutrition Assessment (ENA) for SMART in the assessment and designing response for the malnutrition crisis in Namutumba district. Data from nutrition surveillance used in strengthening service delivery Nakapripirit district XI. Supervision Monitoring and Evaluation 1. Review and adapt support supervision tools for the sector. 2. Train District Health Teams in supervision and monitoring skills. Progress report TOR developed for developing a comprehensive supervision, monitoring and inspection strategy Report Not done Not funded Procurement of Consultant initiated with support from ICB Project 3. Harmonise and institutionalise Quality Improvement initiatives in the health sector. National QIF and Strategic Plan Final draft of the National QIF and strategic plan ready QIF and strategy to be operationalised 2011/12 4. Operationalise the revised HMIS in public and private health facilities as well as community level (VHTs). 5. Develop a strategic plan for UNHRO and health research Revised HMIS in use Launched the HMIS 2020 Trained all (112) District Biostasticians and HMIS FPs in 50 districts Strategic plan Inception report for the strategic plan and operating manuals are under development Tools not yet printed and therefore not in use. 182
205 3.8 Progress on Implementation of the Recommendations of the 7 th Annual Health Assembly Health Assembly Resolution Means of Verification 1. Human Resources for Health Action Comments i. Implement the hard-to-reach, hard-to-stay, and staff motivation strategy to increase staff retention and reduce attrition. Implementation reports Sponsorship list Hard to reach strategy was implemented by MoPS. Motivation and retention component was costed Not implemented due to lack of funds. There are students from the hard to reach and work districts on preferential sponsorship of government solicited funding. ii. Lobby government to increase wages of health workers. Minutes Negotiations ongoing iii. Districts that have not reached 60% of their wage bill should recruit. HRH Report Recruitment plan made but no recruitment done No additional funds provided under PHC. iv. Accelerate the strategy of task shifting. HRH TWG meeting minutes. MoH Position Paper health work force rationalisation A situational analysis of Task Shifting in Uganda made and a report highlights the types/forms, magnitude and challenges of the processes and implementation. A high level stakeholders consultative workshop held to share and a consensus arrived at on key issues and the way to go. A position paper of the Ministry of Health was further presented to a HRH TWG meeting minutes. MoH Position Paper health work force rationalisation 183
206 Resolution Means of Verification Action consensus meeting and it came out with a policy brief and proposed strategy covering the following items. Skills audit Calculating cost potential Value of different roles Harmonizing roles as necessary Different teaching and learning strategies Analyses/Evaluations of posts and competences profiles The rationalising of utilising HRH report is available and has been forwarded for further discussion at the top management level. Comments v. Recentralize the deployment of key health workers such as Medical Officers. Amended Policy Cabinet decision not taken vi. Review the curriculum of Enrolled Comprehensive Nurses and Registered Comprehensive Nurses. vii. MoH to write circular to districts banning recruitment Reviewed curriculum A joint consultancy of local and international level experts was engaged to evaluate the comprehensive nurse training program. It sought views from key stakeholders in MoH, MoES, MoPS, PNFPs, PHPs, Training institutions, Service providers, the alumni etc and developed a report with recommendations that was presented to the HRH TWG and discussed. The proposal awaits the SMC and TMC s considerations and responses. Circular Not done A workshop for 30 key representative 184
207 Resolution Means of Verification Action Comments viii. of Nursing Assistants, and to work with MoE to phase out training of Nursing Assistants. DHOs should monitor and ensure that schools training nurses and midwives are registered. List of students and schools practicing in district facilities Gazetted health training institutions have been put in the media and forwarded to the DHOs for reference, public notification and further action. s of Nur w NAs with appropriate qualifications are preferentially considered when selecting entrants to enrolled nurse/midwife ry courses. The above issues have been regularly articulated to DHMTs at various fora of interaction. ix. Post of Medical Superintendent should be established and institutionalized in the Ugandan Civil Service. Staffing Norms The professional councils are monitoring the process as they establish District Health Professionals Supervisory Authorities to regularly regulate the vice. Position of Hospital Director was RRH level was formalized and the substantive officers were appointed. The other posts are waiting for finalization of the restructuring process. 2. Essential Medicines and Health Supplies i. Improve procurement and supply chain management of medicines by regularly updating and monitoring the 3-year rolling plan A Quantification Procurement & Planning Unit (QPP) in place and operational 185
208 Resolution Means of Verification Action Comments ii. procurement plan (including all development partners contributions) and monitoring the performance indicators for NMS and JMS to ensure sustainable availability of drugs and health supplies at both public and PNFP units. In light of new policy shift, develop and disseminate guidelines for the supply and distribution of drugs to all stakeholders. The guidelines should include a monitoring mechanism. Guidelines monitoring mechanism place. and in Procurement plan developed and disseminated MSS conducted MOU between MoH, MoLG & NMS signed New list for HC II and III developed and in use NMS manuals to guide the guidelines development sent to MoH Overall guidelines development process to be started and completed in 2nd quarter of FY 2011/2012 iii. Set up a transparent drug pricing system at NMS Price catalogue Price catalogue provided to MoH Price catalogue revised every year Pre- printed order forms distributed to HCIV and Hospitals Pre- printed order forms printed by NMS iv. NMS and MoH to prepare, publish and circulate a medicines and supplies price list. Price catalogue Same as above Same as above v. Build capacity at the user units in medicines and health supplies needs forecasting and rational drug use. 3. Community Involvement Training reports MMS Trained in 45 districts with support from SURE Health workers in 442 health units provided support Soft ware piloted in three hospitals Capacity building is ongoing to cover all the districts and hospitals with support from Implementing Partners i. Mobilize funding to scale up Budget for VHT Government, UNICEF, USAID Projects and World Vision More funding still needed for 186
209 Resolution Means of Verification Action Comments VHTs across the country. scale up provided financial and logistical support for VHT scale up. monitoring and supervision of VHT activities List of partners supporting VHT establishment ii. Put in place and build capacity of Health Unit Management Committees. iii. Strengthen the district partnerships with CSOs/NGOs when rolling out the VHT strategy. HUMC reports HUMC guidelines under review Inadequate funding for training and facilitating HUMC operations VHT reports Government, UNICEF, USAID Projects, World Vision provided financial and logistical support for VHT scale up. iv. Ban the use of professional medical titles for people who practice alternative medicine. Circular 4. Health Financing i. Develop a sustainable strategy for financing the PNFP sector: the PNFP subsidy from GoU has reduced from 22% to 20% and user fees in the PNFP have increased. PNFP strategy financing Not done Awaits approval of the general national Policy on PPPH ii. Develop an evidence based health financing policy and strategy which can be used for advocacy within and outside government. HF policy and strategy The process has started concept note, consultative meeting held to develop policy questions and policy action. A technical committee Meeting has been held, policy questions, roadmap and draft policy outline have been developed, by technical committee A meeting has been planned to obtain Senior Top and Top Management guidance and approve road map 187
210 Resolution Means of Verification Action Comments iii. Lobby to increase PHC nonwage recurrent budget to support operational costs especially at HC IV level. Budget Discussions ongoing with parliament and MOFPED to increase per capita expenditure on health iv. Review funding criteria of districts with peculiar needs e.g. border districts. Fund criteria allocation A comprehensive resource allocation formula is being finalized with technical assistance from WHO. It gives a special treatise to hard-to-reach districts and border areas, in addition to other criteria focused on poverty differentials and other peculiarities of different districts Finalization of the formula awaits a consultant s meeting with the PPH TWG to finalize the PNFP components. v. Accelerate the operationalization of National Social Health Insurance Initiative. Reports Additional principles were approved by Cabinet in September 2011 and now the bill is being re-drafted. The bill shall be tabled in Cabinet before end of this calendar year. 5. Malaria Control i. Intensify efforts to roll-out proven effective malaria control interventions like IRS and ITNs. Reports 7.2m nets distributed to PWAs and <5s to all districts except 7 in Eastern Uganda. Awaiting 10.4m nets to achieve Universal Coverage (1 net to 2 persons) Delays have been experienced in the procurement cycle and disbursement of funds by GF ii. GOU to specifically budget and fund Indoor Residual Spraying. Budget 2.4 and 2.9b provided for IRS in last and current FYs respectively. Plan was to cover 3 districts of Katakwi, Kumi and Bukedea Using Carbamate Bendiocarb, only one district can be covered with the amount provided. There is high resistance to pyrethroids that would have been a cheaper option 188
211 Resolution Means of Verification 6. Maternal and Child Health Action Comments i. Need to address the issue of high maternal deaths by focusing on EmOC and reducing the unmet need for FP. Supervision activity reports; UDHS Planned action was to provide EmOC supplies to needy health facilities using the World bank loan. The procurement process has been initiated. More Family Planning commodities have been and more are being procured. Alternative distribution channel for FP commodities to potential FP users is being worked out to increase access through both the public and private sector, The acute human resource shortages (doctors and midwives and anaesthetists should be addressed as soon as possible. Having EmOC and FP supplies without adequate numbers of relevant skilled service providers is NOT sufficient to achieve this. ii. Roll out and implement the Child Survival Strategy. 7. Health Infrastructure Reports CS Strategy was reviewed and aligned with HSSIP 2010/ /15; Scaled up implementation of the integrated community case management (iccm) and trained and equipped 13,882 VHTs in 24 districts (92%); Reviewed early implementation of iccm in Karamoja and Kyegegwa; Secured TA to design MNCH passport using existing child health, FP, discharge, referral, MF5 and women passport; Started HW on job skills building on Helping Babies Breathe and Managing sick new born in HC III, IV and Hospitals. Assumption that regional teams and districts will be funded. Staffing levels in the division improve i. Improve the release and effective use of the Budgetary allocation and Increased capital development fund for Regional Referral Focus consolidation on of 189
212 Resolution Means of Verification Action Comments development budget to improve functionality of the existing health infrastructure. Planning Guidelines Hospitals Planning guidelines provided on utilization of PHC Development funds existing facilities through rehabilitation and expansion especially at HC III level to provide MCH services and staff accommodation ii. DHOs should regularly provide and update the infrastructure and equipment inventory. Inventory reports Infrastructure and Equipment inventory not submitted Health Unit Physical Inventory Form (101) and Equipment Inventory Form (102) available and should be submitted by 28 th August every year iii. Maintenance of equipment should be prioritized. Reports Budget provision at Regional Hospitals (except Jinja Masaka, Mbarara and Mubende) 8. Health Sub-Districts i. Review the health sub district concept. Report Consultant to conduct HSD strategy evaluation is being sourced under World Bank financed Uganda Health Systems Strengthening Project. Report will provide basis for reform of the strategy to support HSSIP implementation ii. Prioritize HC IV functionality particularly funding HC IVs. Budget allocations An additional Ushs 2bn was given to local governments to help functionalise HC IVs. 9. Neglected Diseases/Emerging diseases i. Pay attention to neglected tropical diseases and emerging diseases. Work plans NTD activities integrated with Child Day Plus Activities. Carried out mass deworming and Emerging problems e.g. jiggers in Busoga region 190
213 Resolution Means of Verification Action Comments azithromycin administration. 10. Environmental Health i. Recommit LGs to the Kampala Declaration on Sanitation (1997) to enact and enforce bye-laws/ordinances to raise pit latrine coverage. Reports 156 district staff were trained in processes of enactment of Ordinances and Bye- laws with support from MoH (7 districts & MWE supported 135 participants) Holding Advocacy meetings with districts that are implementing Development of Ordinances and Bye Laws. ii. Share and promote successful district/hospital experiences. Reports Brochures and Not done Poor documentation iii. Mobilize resources to address climate change issues that impact on Public Health. Workplan budget and No funds were forth coming for Climate change activities. Budget allocation for Climate Change by MoH in the next financial year iv. Health units and health workers should participate in community activities that mitigate the effects of global warming such as tree planting. Reports Not done No funds were allocated for FY10/11 191
214 3.9 Annual Epidemics Update July 2010 to June 2011 Remarks Condition Affected districts No. cases No. deaths Polio Polio (confirmed) Bugiri 4 0 The index case was a partially vaccinated 24 month old female from Nawansonga village in Kithodha Parish of Bulesa Sub County with 20 September 2010 as the date of onset. Wild Polio Virus (WPV) Type 1 was isolated from the laboratories (UVRI & NICD) and was genetically linked (97.46%) to the WPV isolated in Turkana region, North West Kenya on 3rd February Three of her contacts were also confirmed to be infected. There was a decline in the routine immunization coverage of DPT/OPV3 from 83% in FY 2008/09 to 76% in FY 2009/10. Supplemental Immunization in 48 high risk districts in North East, East and Northern Uganda using Monovalent OPV (TYpe1) were implemented using The House to House strategy. Cholera Cholera (confirmed) Nakapiripirit Index case was reported on October 18, 2010, from Achele village, Tokora parish, Kakomongole sub-county. Additional cases were reported from Nakapiripirit Town Council, Kakomongole, Namalu, Lorege, and Lolachat. Outbreak confirmation was undertaken by Mbale regional referral hospital laboratory. Latrine coverage was estimated at 3% and safe water coverage at 40-60% in the district. CTCs were set up at Nakapiripirit HCIII and Tokora HC IV and cholera and sanitation kits were supplied by NMS, WHO & UNICEF. Cholera (suspected) Cholera (suspected) Bundibugyo 29 5 The initial cases were reported on February 9, 2011 from Bunyansiri parish, Ntotoro sub-county. A total 29suspect cases with 5 deaths were reported during the period February 9-22, Laboratory confirmation of Cholera outbreak was not done since we were unable to collect any stool samples. Hoima 10 0 The outbreak started on May 30, 2011 with cases being reported from Nkondo 1&2 villages, Nkondo Parish, Kabwoya sub-county. All cases were treated at Sebigoro HCIII and discharged by June 4, 2011 without any fatalities. Laboratory specimens were not obtained since antibiotics had been administered by the time the district rapid response team went down to investigate the cases. Ebola and other viral hemorrhagic fevers Ebola Luwero The index case was a 12 year old female from Nakisamata village, Ngalonkalu Parish, Zirobwe sub-county, Luwero district who passed away on 6 th May 2011 following a febrile hemorrhagic illness that lasted six days. Laboratory 192
215 Condition Affected districts No. cases No. deaths Remarks (confirmed) (CFR 100%) investigations by way of both real time PCR testing and Antigen detection by ELISA confirmed Sudan Ebola virus (SEBOV). Phylogenetic analysis in CDC-Atlanta showed that the Bombo sequence is 99.3% similar to the Gulu 2000 strain. One contact (the brother to index case) tested positive for Ebola by IgG. The outbreak was declared over 17- June-2011after two incubation periods elapsed following the death of the lone confirmed case on 6 May 2011 without any additional confirmed cases. Ebola (Alert, Suspected) Kampala, Wakiso, Nakaseke, Bugiri, Kasese, Gulu, Kabale, Nakasongola (CFR 25.7%) During the Ebola outbreak that occurred during the period May 6, 2011 to June 17, 2011, a total of 17 cases with 4 among alert cases and 22cases with 6deaths among suspect cases were investigated from Kampala, Wakiso, Luwero, Bugiri, K Nakaseke, Kabale, and Gulu but they all tested negative for Ebola/ Marburg and Yellow Fever. Suspect VHF Kyegegwa 1 0 The case was reported on August 6, 2010, and involved a 2.5 year old male seen in Bugiburi HCIII who presented with 3-days history of a febrile hemorrhagic illness. The blood samples analyzed at UVRI were negative for Marburg and Ebola antigens and antibodies (Ig G and Ig M). Suspect VHF Bundibugyo 17 8 The cases were reported during the period October 16-22, 2011 from Ntandi village, Kasitu sub-county and had febrile hemorrhagic illness. The seven specimens submitted to UVRI tested negative for Ebola and Marburg by ELISA and PCR. VHF (suspected) Kamuli 2 2 The initial case was a 35 year old female from Kamuli Town Council who was reported on June 25, 2011 by Kamuli mission hospital where she presented with a febrile hemorrhagic illness; she died on the same day of admission. Test results from UVRI were negative for Ebola & Marburg by PCR & Serology. The second case was a 15 year old girl 3- days history of a febrile hemorrhagic illness. She passed away the same day she was admitted and test results were negative for Ebola & Marburg. Rabies Rabies Bundibugyo 96 6 Initial cases were reported on June 6, 2011 from Kasitu, Sindula, Ntotoro, Ngamba, Bukonzo, Bundibugyo Town Council, and Nyahuka Town Council. 100 doses of rabies vaccine for humans and another 1,000 doses for animals 193
216 Condition Affected districts No. cases No. deaths Remarks were supplied to the district to facilitate response activities. Yellow Fever Yellow Fever (confirmed) Yellow Fever (suspected) Agago, Pader, Abim, Lamwo, Kitgum Gulu, Arua, Lira, Kaabong, Kotido, Napak, Nebbi, Yumbe, Dokolo A total of 273 suspect Yellow Fever cases including 58 deaths (Case Fatality Rate 21.3%) were reported from 14 districts in Northern Uganda during the period November 2010 to April A total of 13 cases were confirmed to have Yellow Fever from the five the districts of Abim, Agago, Pader, and Kitgum. A vaccination campaign was conducted during the last week of January 2011 targeting all persons aged 6 months and above in the districts of Abim, Agago, Kitgum, Lamwo and Pader. The overall Yellow Fever immunization coverage in the five districts was 80.1% (with Abim having a coverage of 120.5%; Agago at 80.7%; Lamwo at 73.9%; Kitgum at 77.6%; Pader at 75.9%). Yellow Fever (suspected) Arua 10 3 Cases presenting with fever, head ache, joint pains, epigastric pains, rigors, hiccups, mental confusion, and yellowing of palms and eyes were reported from Ayayia village, Ayayia Parish, in Ajia sub-county starting 8 June A total of 10 cases with 3 deaths were reported over a three-week period starting June 8, The cases were admitted in Agiya HC and Kuluva hospital. Laboratory testing was negative for Yellow Fever, Dengue and Hepatitis E Virus by PCR and serology. Dengue Fever Dengue fever (confirmed) Mogadishu (Somalia) 97 0 The initial cases were reported on April 6, 2011from the Uganda sector of AMISOM troops in Somalia. The outbreak was confirmed on July 8, Patients present with fever, general weakness & joint pains with vomiting; some few had petechial hemorrhages in the skin, sub-conjunctival hemorrhage and jaundice. The majority of the cases present with dengue fever but there also a few cases with Dengue Hemorrhagic Fever (DHF) and Dengue Shock Syndrome (DSS). At least 34 cases have been confirmed in the laboratory either by PCR or serology. Several serotypes i.e. DEN-1, DEN-2 and DEN-3 have been identified during the outbreak. Due to the risk of importation of the disease into Uganda the following measures have been put in place: (a) Hold the troops in one central place [Bombo] for at least one week and discharge those who don t manifest with symptoms. (b) Re-activated the isolation ward in Bombo to 194
217 Condition Affected districts No. cases No. deaths Remarks provide supportive care for the sick, and (c) Continue line-listing and surveillance in Mogadishu as well as ensure supportive treatment (rehydration and paracetamol); and vector control measures in Mogadishu. Acute Protein Energy Malnutrition (PEM) Acute Protein Energy Malnutrition (PEM) Namutumba Cases of acute PEM were reported from Magada sub-county during the 3 rd week of June Cases were also reported from Mazuba, Kagulu and Nabiswegi Parishes in Magada sub-county and Kibale sub-county. The clinical history indicates that most of the affected have malnutrition (marasmic kwashiorkor) since April The affected areas experienced famine after crops were damaged by hail stones in March During the famine, families feed on alternate days with just one meal per day; a typical meal being cassava/ maize bread and greens. Magada HCIII and Nsinze HCIV were designated as therapeutic treatment centres. A team of pediatricians from Mwanamugimu unit in Mulago supported the initial health facility-based assessments and management of cases. Cases were also treated from the surrounding districts of Butaleja, Kumi, Pallisa, and Kibuku. Hepatitis B Virus (HBV) Hepatitis B Virus (HBV) Kasese 86 0 Following media reports on June 20, 2011 indicating an outbreak of HBV in Kasese the MoH reviewed health facility data from six HU where HBV testing is done including Bwera, Kagando, St. Paul HCIV, Rukooki HCIII, Bishop Masereka HCIII, & Kasese TC HCIII. A total of 86 cases of HBV were confirmed out of 924 patients tested; putting the positivity rate at 9.3% which is lower than the national average of 10%. And besides the rate of 9.3% is over estimated as this was obtained from sick patients attending HU hence this rate is definitely higher than the actual rate in the general population. There was therefore no evidence of an outbreak of HBV infection in the district. The proportion of children receiving three doses of Hepatitis B vaccine in Kasese district currently stands at 96%. A press release was issued [June 24, 2011] by the Hon. MoH to clarify the erroneous media publication. Hepatitis B Virus (HBV) Moyo The initial cases were reported starting February 2010, samples were sent to UVRI where the infection was confirmed. The cases reported from the sub-counties of Moyo, Dufile, Gimara, Metu, Itula, Moyo TC, and Lefori. The prevalence of HBV infection in West Nile region is one of the highest and stands at 18%, much higher than the national average of 10% and the WHO threshold of 9%. The coverage for DPT3-Hep B+Hib was only 30% in Moyo during the FY 2008/09. Mobilization of communities needs to be enhanced to improve the coverage for this vaccine. A policy for 195
218 Condition Affected districts Head Nodding Disease Head nodding disease Kitgum, Lamwo & Pader Human Influenza Human Influenza Hepatitis E Virus (HEV) Hepatitis E Kaabong (confirmed) Hepatitis E Kotido (confirmed) No. cases No. deaths Remarks vaccinating health care workers against HBV has been developed and vaccines made available to vaccinate all health care workers countrywide. 1, An investigation undertaken by MoH with support from CDC & WHO in August 2010 in 26 sub-counties in the 3 districts of Pader (5 s/c); Kitgum (12 s/c); and Lamwo (9 s/c) identified a total of 1,876 cases with 1,090 cases originating from Pader; 307 cases from Lamwo; and 479 cases from Kitgum. The disease itself appears to be a novel epileptic disorder that is characterized by atonic seizures which without treatment progress to grand mal epilepsy. The etiology for now remains elusive but a response plan is in place to provide nutritional rehabilitation, chronic care clinics to prescribe antiepileptic, bi-annual mass treatment with ivermectin, psychosocial support as well as addressing the special education needs of these children and their families The National Influenza Centre in UVRI maintains sentinel surveillance sites in Mbarara hospital, Arua hospital, Koboko hospital, Kisenyi HC, Kiswa HC, Entebbe hospital, and Kitebi HC where patients presenting with Influenza Like Illness (ILI) are investigated systematically. The data (as of May 27, 2011) indicates that out of 618 specimens analyzed this year [2011], 27 specimens have yielded human influenza virus isolates with 24 being pandemic influenza A (H1N1) 2009; and 3 being seasonal flu B The outbreak started on August 18, The initial cases were linked to the consumption of Kwete in Kaaboong Town Council. Cases have been reported from Sidok, Karenga and Kaabong sub-counties. Latrine coverage is low (1%) and a factor in the spread of the disease. There was an upsurge in cases following the onset of rains in March 2011 that was responded to by GoU and partners Initial cases were reported starting from September 2009 till March 2011 and were reported from Kotido sub-county, Panyangara sub-county, and Kotido Town Council. The affected areas have very low latrine coverage of up to 2%. 196
219 Condition Affected districts No. cases No. deaths Remarks Nine cases have been confirmed by UVRI and response is being spearheaded by the District Task Force. 197
220 3.10 Development Partner Support Areas 1. USA SECTOR Counterpart / Implementing Partner Project name Outturn 2007/08 Outturn 2008/09 Outturn 2009/10 Outturn 2010/11 Health AED (Academy for A2Z Micronutrient / MOST Educational Development) Health Engender Health ACQUIRE Health JHU (John Hopkins AFFORD - Health Marketing University) Initiative Health Multiple Central Contraceptive Procurement Health JSI (John Snow Inc) DELIVER Health Macro International Inc DHS Survey Health Health Health Minnesota International Volunteers for Health SCF (Save the Children Fund) USA JHU (John Hopkins University ) Grant Solicitation & Management (GSM)-MIVH Grant Solicitation & Management (GSM)-SCF Health Communication Partnership (HCP2) -Broad Communication Health UNICEF Immunization Health UNICEF SMMORE Health ABT Associates Indoor Residual Spraying (IRS) Health RTI (Research Triangle Integrated Vector International) Management Health AED (Academy for Netmark Plus Educational Development) Health New FP Initiative Health Health MSH (Management Science for Health) Quality Assurance/Pharmacovigilance RPM Plus
221 SECTOR Counterpart / Implementing Partner Project name Outturn 2007/08 Outturn 2008/09 Outturn 2009/10 Outturn 2010/11 Health MSH (Management Science for Health) Securing Ugandan's Right to Essential drugs (SURE) Health MSH (Management STRIDES Science for Health) Health JHU (John Hopkins Uganda Stop Malaria University ) Health US Pharmacopeia Inc US Pharmacopeia Drug (USP) Quality and Info (USPDQ) Health UN-WHO WHO Umbrella Grant HIV/AIDS Chemonics ACE Boosting Capacity Uganda NGOs HIV/AIDS JHU (John Hopkins Be A Man Campaign /YEAH University ) HIV/AIDS IHI Capacity HIV/AIDS HCD Capacity Project HIV/AIDS Deloitte & Touche Civil Society Fund-FMA HIV/AIDS Chemonics Civil Society Fund-M&E HIV/AIDS Chemonics Civil Society Fund-TMA HIV/AIDS TASO Community Based HIV Response HIV/AIDS RHU (Reproductive Community Based HIV Health Uganda) Response HIV/AIDS Multiple Condom Procurement HIV/AIDS CARE USA Core Initiative HIV/AIDS JSI Research District based HIV/AIDS Program - East Central Region HIV/AIDS MSH District based HIV/AIDS Program - Eastern Region HIV/AIDS District based HIV/AIDS Program - South Western Region HIV/AIDS World Vision Education Sector Work Place Policy (ESWAPI) HIV/AIDS EGPAF EGPAF (Elizabeth Glaser Pediatric Aids Foundation)
222 SECTOR Counterpart / Implementing Partner Project name Outturn 2007/08 Outturn 2008/09 Outturn 2009/10 Outturn 2010/11 HIV/AIDS Hospice Uganda Expand Access to Palliative Care HIV/AIDS Macro International Inc Facility Survey HIV/AIDS IRCU (Inter-Religious Council of Uganda) Faith Based HIV/AIDS Initiative HIV/AIDS IRCU (Inter-Religious Faith Based Network Model Council of Uganda) HIV/AIDS HCI/URC HIV/AIDS Emerging Markets HIPS Private Sector Group (EMG) HIV/AIDS MJAP HIV/AIDS C&T and PC HIV/AIDS HIV/AIDS JHU (John Hopkins University) Social & Scientific Systems Male Circumcision Monitoring & Evaluation of Emergency Plan Progress (MEEPP) HIV/AIDS JSI (John Snow Inc) Northern Uganda Malaria Aids & TB (NUMAT) HIV/AIDS University Research NuLife (Nutrition for PHAs) Corp Int'l HIV/AIDS Emerging Markets PART Work Place HIV/AIDS Activity - MoES HIV/AIDS IHAA PHA Networks HIV/AIDS URC (University Quality Assurance Research Corp Int'l) HIV/AIDS USAID - REDSO Safety T Stop HIV/AIDS WVI (World Vision SPEAR International) HIV/AIDS PSCM Supply Chain Management HIV/AIDS TB/HIV (new) HIV/AIDS TBD HIV/AIDS Projects HIV/AIDS JCRC (Joint Clinical TREAT Research Centre) HIV/AIDS JSI (John Snow Inc) UPHOLD - AIC and TASO SECTOR Counterpart / Implementing Partner Project name Outturn 2007/08 Outturn 2008/09 Outturn 2009/10 Outturn 2010/11 TOTALS
223 2. SIDA / SWIDISH EMBASSY Area of support 2010/11 Expenditure (,000,000 USD) 1. Sector budget Support Health Maternal Health/SRHR Management/Capacity Building 1 4. Adolescent sexual and reproductive Health HIV prevention, care and treatment 1.60 Total expenditure for 2010/ ITALIAN COOPERATION Area of support Total expenditure for 2010/11 1. Policy formulation and health system euro 2. District health system strengthening euro 3. PHC and out reaches euro 4. Drugs and Equipment euro 5. Training and university support euro Total expenditure for 2010/11 (excludes administration expenses for the organization/institution) euro 201
224 Implementing Partners Funded by Italian Cooperation Name of partner UNICEF WHO Total to multilateral implementing agencies Amount received euro euro euro Districts supported by Italian Cooperation Name of district Area of support 20 pilot districts District Planning on PPPH Kaabong, Kotido, Abim, Moroto, Napak, Gulu, Pader, Agago, Nwoya Nakapiripirit, Amudat, Amuru District health system strengthening, PHC District health system strengthening, PHC, infrastructure 7 districts in Acholi District planning community health, operational research on NTDs Kitgum, Lamwo District health system strengthening, infrastructure, Drugs and equipment 1. Challenges Internal: Delay in funds disbursement process and unpredictability compounded by the international financial crisis At district level: Limited capacity in resulted oriented planning and efficient and coordinated use and management of the scanty resources (often not completely absorbed), inadequate problem solving approach, scarce and inconsistent information or data, inadequate supervision, Insufficient accountability and responsibility mechanisms, few qualified staff, lack of capacity in delegation, scarce professional integrity and ethical motivation 202
225 At central level: Limited coordination and communication with districts, difficult in utilizing efficiently the limited resources, limited reliability of data and information, still insufficient result oriented planning and problem solving approach, gaps in inter-departments communication 2. Proposed solutions Increase funds predictability (within the limit of the present financial global crisis) and timeliness Strengthening the supervision process and the reporting system, Clear definition about roles, accountabilities, responsibilities and delegation levels Strengthening communication and coordination within departments and within MoH and Districts and HSDs (minimizing gaps and distance, reducing the feeling of isolation and impotence) Increasing the result oriented approach and problem solving attitude Engineering a performance based rewarding/remuneration (motivation) mechanism oriented towards improving integrity and ethical professional motivation in health Staff (new and realistic HRH policy and strategy) Improve the resources efficient use and absorption Coordinate the various grants and investment sources at central and peripheral level Increase Human resources and funds allocation to the sector 3. UNITED NATIONS POPULATION FUND Area of support Total expenditure 2010/11 (UGX) 1. Reproductive Health Midwifery 2,772,748, Reproductive Health Family Planning 18,849,867, HIV Care 1,674,577, Adolescent Reproductive Health 1,292,546,219 Total expenditure for 2010/11 24,589,740,657 Implementing Partners Funded by UNFPA Area of Support Name of partner Amount received UGX Midwifery services Ministry of Health RH Division 913,405,145 Population Secretariat 56,000,000 CDFU 404,463,
226 UNFPA Equipment to HFs 1,225,900,000 UNFPA TA to MOH 172,980,000 Family Planning Reproductive Health Uganda Consortium(RHU 1,790,290,924 PI, MSU, AIC) Kanungu District 171,907,710 Mubende District 67,451,500 Yumbe District 140,500,200 Oyam District 130,541,100 Katakwi District 182,422,000 Moroto District 93,539,000 Kotido District 148,931,500 Kaabong District 113,990,667 UNFPA Commodities 16,010,263,100 ASRH Ministry of Gender, Labour and Social 84,275,200 Development (HIV/AIDS and ASRH Uganda Red Cross Society 482,002,151 HIV/AIDS Ministry of Health - ACP 163,006,850 MGLSD 97,096,750 Reproductive Health (and AIC) 130,206,881 Uganda Catholic Secretariat 76,945,000 Church of Uganda 234,719,391 Popsec (UMSC, Other FBOs) 246,334,000 PACE 726,268,868 Support to central level MoH: Programme Amount UGX 1. Reproductive Health - Midwifery 2,312,285, Reproductive Health Family Planning 16,010,263, HIV Care 163,006,850 Districts supported Name of district Area of support Amount of funding UGX Kanungu District Family Planning, Midwifery services 171,907, Mubende District Family Planning, Midwifery services 67,451,500 Yumbe District Family Planning, Midwifery services 140,500,200 Oyam District Family Planning, Midwifery services 130,541,100 Katakwi District Family Planning, Midwifery services 182,422,000 Moroto District Family Planning, Midwifery services 93,539,000 Kotido District Family Planning, Midwifery services 148,931,500 Kaabong District Family Planning, Midwifery services 113,990,
227 Challenges Human resources for Health are inadequate with most health facilities having less than 40 percent staffing positions filled Lack of data collection tools at health facilities and service delivery site poses data collection challenges and affects data quality and reliability Infrastructure challenges related to inadequate space, dilapidated structures and poor maintenance of buildings and equipment A mixed policy on supply chain management The Push and pull policies are executed concurrently leading to mixed pictures with regard to contraceptives stocks at different levels Operations research not well factored into program interventions leading to poor generation of strategic information for advocacy on key issues in the system SRH/HIV integration is frustrated by structural, systemic and skills issues and a culture that sanctifies verticalization of interventions A weak support supervision and monitoring system in the health sector Inadequate financing to RH Poor mobilization for demand and utilization of services Proposed solutions More support will have to be given in the bonding and training of particularly midwives Support should be provided towards conducting National Health Accounts to enable the tracking of resources for health More investment should be made in system strengthening with particular focus on infrastructure and medical technologies and supplies The resource center should be support to develop and distribute data collection tools Operations research should be an in-built element in sector and national development planning 205
228 4. UNICEF Partners name Area District(s) Total PCA Amount (Cash + Supply) USD 1. SCiU (Milk Matters) Nutrition Karamoja 28, IBFAN Nutrition National 39, Malaria Consortium Health National 1,515, CUAMM Health Karamoja 370, ACF Nutrition Karamoja & Acholi 788,850 Health, Nutrition, 6. IRC WASH & CAA Karamoja & Acholi 537, CRS H&N, CAA Western 331, CONCERN Worldwide Nutrition Karamoja 157, AVSI PMTCT, H&N Acholi 232,574 Karamoja, Northern 10. UCS** ALS & Western 229, CoU ALS All 129, C&D ALS Karamoja 351,225 Acholi, Karamoja, 13. ASB AS Teso 99, Africare WASH National 271, Warchild Holland Nutrition National 36, CESVI Nutrition Karamoja 108, SNV ALS National 163, BRAC ALS National 85,
229 19. UMCS ALS National 90, HealthNeed Nutrition North-East 33,688 Rwenzori, Acholi and 21. Baylor CAA Karamoja 378, Department for International Development (DFID) Area of support Total expenditure 2010/11 1. HIV Prevention and care 4,000, Yellow Fever Epidemic Response 592, Implementation of the National Population Policy (procurement 1,323,326 of contraceptives) 4. Support to AIDS Indicator Survey 200,000 Total expenditure 6,116,229 Implementing Partners Funded by DFID Name of partner Amount received Civil Society Fund (Deloitte & Touche) HIV 3,000,000 Prevention & care) UN AIDS HIV Prevention 1,000,000 UN Joint Programme on Population: Population 1,422,960 Programme World Health Organisation 633,613 Civil Society Fund (Deloitte & Touche) - AIDS 200,000 indicator survey 207
230 Figure 19: DPT3 Coverage by district FY2010/11 Figure 19: DPT3 Coverage by district FY2010/11 Figure 20: Deliveries Deliveries in in Government Governmentand andpnfp PNFPfacilities facilitiesby bydistrict districtfy2010/11 FY2010/11 [Annual Health Sector Performance A n n u a l H e a l t hreport S e c t o r 2010/11] P2010/11] erformance 208[Annual Health Sector Performance Report R e p o r t / 11 Page XVII Page XVI
231 Figure 21: OPD utilization by district FY 2010/11 Figure 22: HIV testing in infants born of HIV positive women by district FY 2010/11 209

232 Figure 23: Latrine coverage in households by districts FY 2010/11 Figure 23: Latrine coverage in households by districts FY 2010/11 Figure 24:Pregnant Pregnantwomen women receiving of Fansidar forbyipt by district FY 2010/11 Figure 24: receiving 2nd2nd dosedose of Fansidar for IPT district FY 2010/ A n n u a l H e a l t h S e c t o r P e r f o r m a n c e R e p o r t / 11


233 Figure 25: Pregnant women attending ANC 4th visit by district FY 2010/11 Figure 25: Pregnant women attending ANC 4th visit by district FY 2010/11 Figure 25: Pregnant women attending ANC 4th visit by district FY 2010/11 Figure 25: Pregnant women attending ANC 4th visit by district FY 2010/11 Figure 26: Approved posts that are filled by district FY 2010/11 Figure 26: Approved posts that are filled by district FY 2010/11 Figure that areare filled by district FY 2010/11 Figure26: 26:Approved Approvedposts posts that filled by district FY 2010/11 [Annual HealthSector SectorPerformance Performance Report [Annual Health Report2010/11] 2010/11] [Annual Health Sector Performance Report 2010/11] A n n u a l H e a l t h S e c t o r P e r f o r m a n c e R e p o r t / 11 [Annual Health Sector Performance Report 2010/11] 211 Page XP Page XX P
Health and Nutrition Public Investment Programme
 Government of Afghanistan Health and Nutrition Public Investment Programme Submission for the SY 1383-1385 National Development Budget. Ministry of Health Submitted to MoF January 22, 2004 PIP Health and
REPUBLIC OF UGANDA MINISTRY OF HEALTH GUIDELINES FOR GOVERNANCE AND MANAGEMENT STRUCTURES
 REPUBLIC OF UGANDA MINISTRY OF HEALTH GUIDELINES FOR GOVERNANCE AND MANAGEMENT STRUCTURES JANUARY 2013 REPUBLIC OF UGANDA MINISTRY OF HEALTH GUIDELINES FOR GOVERNANCE AND MANAGEMENT STRUCTURES January
Ministry of Health THE SECOND NATIONAL HEALTH POLICY
 Ministry of Health The Republic of Uganda Ministry of Health THE SECOND NATIONAL HEALTH POLICY Promoting People s Health to Enhance Socio-economic Development July 2010 THE SECOND NATIONAL HEALTH POLICY
THE REPUBLIC OF UGANDA. Annual Health Sector Performance Report
 THE REPUBLIC OF UGANDA Annual Health Sector Performance Report Financial Year 2009/2010 ii Foreword The for 2009-10 provides a review of sector performance in the 2009-10 financial year, and an overall
Annual Health Sector Performance Report
 THE REPUBLIC OF UGANDA Annual Health Sector Performance Report Financial Year 2003/2004 October 2004 Foreword Uganda, frequently referred to as the Pearl of Africa, continues to demonstrate a high disease
The Health Sector in Uganda and the Work of CUAMM. Dr. Peter Lochoro Country Representative Doctors with Africa CUAMM Uganda
 The Health Sector in Uganda and the Work of CUAMM Dr. Peter Lochoro Country Representative Doctors with Africa CUAMM Uganda 1 2 General issues Democratic government, stable country and more peaceful Population
Annual Pharmaceutical Sector Performance Report
 Ministry of Health Republic of Uganda Annual Pharmaceutical Sector Performance Report 2014-2015 June 2016 FOREWORD The Annual Pharmaceutical Sector Performance Report provides us with a valuable picture
Annual Health Sector Performance Report
 THE REPUBLIC OF UGANDA Annual Health Sector Performance Report Financial Year 2006/2007 October 2007 Blank Page Foreword The health sector in FY 2006/07 implemented the 2 nd Year of the Health Sector Strategic
OPERATIONAL DEFINITIONS... VII. 1.1 Background The Development Process Situation Analysis... 4
 Table of Contents FOREWORD... IV EXECUTIVE SUMMARY... V ACRONYMS... VI OPERATIONAL DEFINITIONS... VII 1 INTRODUCTION... 1 1.1 Background... 1 1.2 The Development Process... 3 1.3 Situation Analysis...
Minister. Secretaries of State. Department of Planning and Health Information. Department of Human Resources Development
 KINGDOM OF CAMBODIA NATION RELIGION KING 1 Minister Secretaries of State Cabinet Under Secretaries of State Directorate General for Admin. & Finance Directorate General for Health Directorate General for
COUNTRY PROFILE: LIBERIA LIBERIA COMMUNITY HEALTH PROGRAMS JANUARY 2014
 COUNTRY PROFILE: LIBERIA JANUARY 2014 Advancing Partners & Communities Advancing Partners & Communities (APC) is a five-year cooperative agreement funded by the U.S. Agency for International Development
Ministry of Health NATIONAL CHILD SURVIVAL STRATEGY BRIEFING PAPER FOR POLICY MAKERS AND PLANNERS 2009/ /15
 Ministry of Health NATIONAL CHILD SURVIVAL STRATEGY BRIEFING PAPER FOR POLICY MAKERS AND PLANNERS 2009/10 2014/15 DRAFT: SEPTEMBER 2009 DECLARATION MADE BY HEADS OF STATE AND GOVERNMENT We, the Heads of
Biennial Collaborative Agreement
 Biennial Collaborative Agreement between the Ministry of Health of Kazakhstan and the Regional Office for Europe of the World Health Organization 2010/2011 Signed by: For the Ministry of Health Signature
RBF in Zimbabwe Results & Lessons from Mid-term Review. Ronald Mutasa, Task Team Leader, World Bank May 7, 2013
 RBF in Zimbabwe Results & Lessons from Mid-term Review Ronald Mutasa, Task Team Leader, World Bank May 7, 2013 Outline Country Context Technical Design Implementation Timeline Midterm Review Results Evaluation
UHC. Moving toward. Sudan NATIONAL INITIATIVES, KEY CHALLENGES, AND THE ROLE OF COLLABORATIVE ACTIVITIES. Public Disclosure Authorized
 Public Disclosure Authorized Public Disclosure Authorized Moving toward UHC Sudan NATIONAL INITIATIVES, KEY CHALLENGES, AND THE ROLE OF COLLABORATIVE ACTIVITIES re Authorized Public Disclosure Authorized
RWANDA S COMMUNITY HEALTH WORKER PROGRAM r
 RWANDA S COMMUNITY HEALTH WORKER PROGRAM r Summary Background The Rwanda CHW Program was established in 1995, aiming at increasing uptake of essential maternal and child clinical services through education
Grant Aid Projects/Standard Indicator Reference (Health)
") Examples of Setting Indicators for Each Development Strategic Objective Grant Aid Projects/Standard Indicator Reference (Health) Sector Development strategic objectives (*) Mid-term objectives Sub-targets
Examples of Setting Indicators for Each Development Strategic Objective Grant Aid Projects/Standard Indicator Reference (Health) Sector Development strategic objectives (*) Mid-term objectives Sub-targets
The World Breastfeeding Trends Initiative (WBTi)
") The World Breastfeeding Trends Initiative (WBTi) Name of the Country: Swaziland Year: 2009 MINISTRY OF HEALTH KINGDOM OF SWAZILAND 1 Acronyms AIDS ART CBO DHS EGPAF FBO MICS NGO AFASS ANC CHS CSO EPI HIV
The World Breastfeeding Trends Initiative (WBTi) Name of the Country: Swaziland Year: 2009 MINISTRY OF HEALTH KINGDOM OF SWAZILAND 1 Acronyms AIDS ART CBO DHS EGPAF FBO MICS NGO AFASS ANC CHS CSO EPI HIV
Nepal - Health Facility Survey 2015
 Microdata Library Nepal - Health Facility Survey 2015 Ministry of Health (MoH) - Government of Nepal, Health Development Partners (HDPs) - Government of Nepal Report generated on: February 24, 2017 Visit
MEASURE DHS SERVICE PROVISION ASSESSMENT SURVEY HEALTH WORKER INTERVIEW
 06/01/01 MEASURE DHS SERVICE PROVISION ASSESSMENT SURVEY HEALTH WORKER INTERVIEW Facility Number: Interviewer Code: Provider SERIAL Number: [FROM STAFF LISTING FORM] Provider Sex: (1=MALE; =FEMALE) Provider
THE ZIMBABWE HEALTH SECTOR INVESTMENT CASE ( )
") THE ZIMBABWE HEALTH SECTOR INVESTMENT CASE (2010 2012) Accelerating progress towards the Millennium Development Goals Equity And Quality In Health A People's Right March 2010 The Ministry of Health and
THE ZIMBABWE HEALTH SECTOR INVESTMENT CASE (2010 2012) Accelerating progress towards the Millennium Development Goals Equity And Quality In Health A People's Right March 2010 The Ministry of Health and
In , WHO technical cooperation with the Government is expected to focus on the following WHO strategic objectives:
 VANUATU Vanuatu, a Melanesian archipelago of 83 islands and more than 100 languages, has a land mass of 12 189 square kilometres and a population of 234 023 in 2009 (National Census). Vanuatu has a young
National Health Strategy
 State of Palestine Ministry of Health General directorate of Health Policies and Planning National Health Strategy 2017-2022 DRAFT English Summary By Dr. Ola Aker October 2016 National policy agenda Policy
CONSOLIDATED RESULTS REPORT. Country: ANGOLA Programme Cycle: 2009 to
 CONSOLIDATED RESULTS REPORT Country: ANGOLA Programme Cycle: 2009 to 2014 1 1. Key Results modified or added 2. Key Progress Indicators 3. Description of Results Achieved PCR 1: Accelerated Child Survival
Egypt. MDG 4 and Beyond. Emad Ezzat, MD Head of PHC Sector. Ministry of Health & Population
 Egypt Ministry of Health & Population MDG 4 and Beyond Lessons Learnt Emad Ezzat, MD Head of PHC Sector EMRO high-level meeting, Dubai, Jan 2013 Trends of Under 5, Infant and Neonatal Mortality (1990 2008)
Sudan High priority 2b - The principal purpose of the project is to advance gender equality Gemta Birhanu,
 Sudan 2017 Appealing Agency Project Title Project Code Sector/Cluster Refugee project Objectives WORLD RELIEF (WORLD RELIEF) Comprehensive Primary Health Care Services For Vulnerable Communities in West
A Review on Health Systems in Transition in Myanmar
 A Review on Health Systems in Transition in Myanmar Resources and Services Dr. Nilar Tin Physical and human resources Physical Resources Capital stocks and investment no: of Infrastructure (as of 2013)
In , WHO technical cooperation with the Government is expected to focus on the same WHO strategic objectives.
 PAPUA NEW GUINEA Papua New Guinea, one of the most diverse countries in the world and the largest developing country in the Pacific, is classified as a low-income country. PNG s current population is estimated
RE-ENGINEERING PRIMARY HEALTH CARE FOR SOUTH AFRICA Focus on Ward Based Primary Health Care Outreach Teams. 7June 2012
 RE-ENGINEERING PRIMARY HEALTH CARE FOR SOUTH AFRICA Focus on Ward Based Primary Health Care Outreach Teams 7June 2012 CONTEXT PHC RE-ENGINEERING Negotiated Service Delivery Agreement (NSDA) Strategic Outputs
SERVICE STANDARDS AND SERVICE DELIVERY STANDARDS FOR THE HEALTH SECTOR
 THE REPUBLIC OF UGANDA MINISTRY OF HEALTH SERVICE STANDARDS AND SERVICE DELIVERY STANDARDS FOR THE HEALTH SECTOR JULY 2016 TABLE OF CONTENTS TABLE OF CONTENTS ABBREVIATIONS & ACRONYMS OPERATIONAL DEFINITIONS
Integrated Management of Childhood Illness (IMCI) Implementation in the Western Pacific Region. Community IMCI. Community IMCI
 Implementation in the Western Pacific Region. Community IMCI. Community IMCI") Integrated Management of Childhood Illness (IMCI) Implementation in the Western Pacific Region 5 What is community IMCI? is one of three elements of the IMCI strategy. Action at the level of the home and
Integrated Management of Childhood Illness (IMCI) Implementation in the Western Pacific Region 5 What is community IMCI? is one of three elements of the IMCI strategy. Action at the level of the home and
Risks/Assumptions Activities planned to meet results
 Communitybased health services Specific objective : Through promotion of communitybased health care and first aid activities in line with the ARCHI 2010 principles, the general health situation in four
TERMS OF REFERENCE: PRIMARY HEALTH CARE
 TERMS OF REFERENCE: PRIMARY HEALTH CARE A. BACKGROUND Health Status. The health status of the approximately 21 million Citizens of Country Y is among the worst in the world. The infant mortality rate is
The Syrian Arab Republic
 World Health Organization Humanitarian Response Plans in 2015 The Syrian Arab Republic Baseline indicators* Estimate Human development index 1 2013 118/187 Population in urban areas% 2012 56 Population
Mauritania Red Crescent Programme Support Plan
 Mauritania Red Crescent Programme Support Plan 2008-2009 National Society: Mauritania Red Crescent Programme name and duration: Appeal 2008-2009 Contact Person: Mouhamed Ould RABY: Secretary General Email:
Development of Policy Conference Nay Pi Taw 15 th February
 Development of Policy Conference Nay Pi Taw 15 th February To outline some Country Examples of the Role of Community Volunteers in Health from the region To indicate success factors in improvements to
Saving Every Woman, Every Newborn and Every Child
 Saving Every Woman, Every Newborn and Every Child World Vision s role World Vision is a global Christian relief, development and advocacy organization dedicated to improving the health, education and protection
Ethiopia Health MDG Support Program for Results
 Ethiopia Health MDG Support Program for Results Health outcome/output EDHS EDHS Change 2005 2011 Under 5 Mortality Rate 123 88 Decreased by 28% Infant Mortality Rate 77 59 Decreased by 23% Stunting in
1 This report was based on a mission to Uganda (10-18 November 2010) by Ties Boerma and Fiona Gore. The mission was
 by Ties Boerma and Fiona Gore. The mission was") Strengtheniing moniitoriing and evalluatiion practiices iin the context of scalliing-up the IIHP+ compact and Country Heallth Systems Surveiillllance 1 UGANDA 1 This report was based on a mission to Uganda
Strengtheniing moniitoriing and evalluatiion practiices iin the context of scalliing-up the IIHP+ compact and Country Heallth Systems Surveiillllance 1 UGANDA 1 This report was based on a mission to Uganda
Managing Programmes to Improve Child Health Overview. Department of Child and Adolescent Health and Development
 Managing Programmes to Improve Child Health Overview Department of Child and Adolescent Health and Development 1 Outline of this presentation Current global child health situation Effective interventions
GUIDELINES TO THE LOCAL GOVERNMENT PLANNING PROCESS
 THE REPUBLIC OF UGANDA MINISTRY OF HEALTH GUIDELINES TO THE LOCAL GOVERNMENT PLANNING PROCESS HEALTH SECTOR SUPPLEMENT 2016 II GUIDELINES TO THE LOCAL GOVERNMENT PLANNING PROCESS HEALTH SECTOR SUPPLEMENT
Terms of Reference Kazakhstan Health Review of TB Control Program
 1 Terms of Reference Kazakhstan Health Review of TB Control Program Objectives 1. In the context of the ongoing policy dialogue and collaboration between the World Bank and the Government of Kazakhstan
#HealthForAll ichc2017.org
 #HealthForAll ichc2017.org 1 Positioning CHW s within HRH Strategies: Key Issues and Opportunities Liberia Case Study Ochiawunma Ibe, MD, MPH, Msc (MCH), FWACP Background Outline Demographic profile and
IPCHS Global Indicators: Metadata
 Global Indicators: Metadata Indicator name 1. Proportion of countries aligned with WHO global strategy on Proportion of countries whose national health policies strategies and plans are aligned with the
WHO and HMN, March 2009 Ethiopia, CHeSS/IHP+
 Strengtheniing moniitoriing and evalluatiion practiices iin the context of scalliing up the IIHP+ compact and Country Heallth Systems Surveiillllance 1 1 ETHIOPIA 1 This report was based on a mission to
Nurturing children in body and mind
 Nurturing children in body and mind Dr Rachel Devi National Advisor for Family Health Ministry of Health and Medical Services, Fiji 11 th Pacific Health Ministers Meeting 15-17 April 2015 Yanuca Island,
COMMONWEALTH OF THE NORTHERN MARIANA ISLANDS WHO Country Cooperation Strategy
 COMMONWEALTH OF THE NORTHERN MARIA ISLANDS WHO Country Cooperation Strategy 2018 2022 OVERVIEW The Commonwealth of the Northern Mariana Islands is one of five inhabited United States island territories.
Good practice in the field of Health Promotion and Primary Prevention
 Good practice in the field of Promotion and Primary Prevention Dr. Mohamed Bin Hamad Al Thani Med Cairo February 28 th March 1 st, 2017 - Cairo - Egypt 1 Definitions Promotion Optimal Life Style Change
Task shifting to optimise the roles of health workers to improve the delivery of maternal and child healthcare
 An Evidence Brief for Policy Task shifting to optimise the roles of health workers to improve the delivery of maternal and child healthcare Executive Summary This policy brief was prepared by the Uganda
THE STATE OF ERITREA. Ministry of Health Non-Communicable Diseases Policy
 THE STATE OF ERITREA Ministry of Health Non-Communicable Diseases Policy TABLE OF CONTENT Table of Content... 2 List of Acronyms... 3 Forward... 4 Introduction... 5 Background: Issues and Challenges...
REPORT SHORT PROGRAMME REVIEW FOR CHILD HEALTH. Convened by: WORLD HEALTH ORGANIZATION REGIONAL OFFICE FOR THE WESTERN PACIFIC
 (WP)CAH/CAM/CAH/2.2/001-A Report series number: RS/2008/GE/56(CAM) English only REPORT SHORT PROGRAMME REVIEW FOR CHILD HEALTH Convened by: WORLD HEALTH ORGANIZATION REGIONAL OFFICE FOR THE WESTERN PACIFIC
Getting it Done for Maternal and Newborn Health. Innovations in Health Systems Strengthening
 The UN Secretary General s Global Strategy for Women s and Children s Health: Getting it Done for Maternal and Newborn Health Innovations in Health Systems Strengthening Pat Riley, CNM, MPH, FACNM Nagesh
SESSION #6: DESIGNING HEALTH MARKET INTERVENTIONS Part 1
 SESSION #6: DESIGNING HEALTH MARKET INTERVENTIONS Part 1 Stewardship vs. market forces in RMNCAH-N markets Markets organized along continuum of stewardship vs market forces LAPM: Long Acting Permanent
INTRODUCTION. KEY ACHIEVEMENTS Malaria
 Redacted INTRODUCTION Although important achievements have been realized in maternal, newborn, and child health (MNCH) in Rwanda, there is still a need for improvement. The maternal mortality rate decreased
Improved Maternal, Newborn and Women s Health through Increased Access to Evidence-based Interventions. Source:DHS 2003
 KENYA Improved Maternal, Newborn and Women s Health through Increased Access to Evidence-based Interventions INTRODUCTION Although Kenya is seen as an example among African countries of rapid progress
Final: REPORT OF THE IMCI HEALTH FACILITY SURVEY IN BOTSWANA
 REPORT OF THE IMCI HEALTH FACILITY SURVEY IN BOTSWANA 1 TABLE OF CONTENTS ABBREVIATIONS 3 EXECUTIVE SUMMARY 4 Background 4 Methods 4 Results 4 Recommendations 5 1. BACKGROUND 6 1.1 Child Health in Botswana
Government of Uganda National Policy on Public Private Partnership in Health
 Government of Uganda National Policy on Public Private Partnership in Health 1 Government of Uganda National Policy on Public Private Partnership in Health 2 3 4 PREFACE The Government of Uganda promote
Local Fund Agent Manual
 Local Fund Agent Manual 2014 TABLE OF CONTENTS Foreword Introduction Section A: Introduction to the Global Fund Section B: Practical Arrangements Section C: Access to Funding Section D: Ongoing Grant Management
Health Sector Strategic Plan 2012/ /17
 Government of Lesotho LESOTHO Health Sector Strategic Plan 2012/13-2016/17 April 2013 i TABLE OF CONTENTS 1. INTRODUCTION... 6 1.1 POPULATION, GEOGRAPHY AND ADMINISTRATIVE SYSTEM OF LESOTHO... 6 1.2 EDUCATIONAL
UPHOLD S INTERGRATED HEALTH STRATEGY
 UPHOLD S INTERGRATED HEALTH STRATEGY Uganda Programme for Human and Holistic Development Draft Document Date: November 24, 2003 UPHOLD is funded by the United States Agency for International Development
R E S O L U T I O N WESTERN PACIFIC REGIONAL STRATEGY FOR HEALTH SYSTEMS BASED ON THE VALUES OF PRIMARY HEALTH CARE
 Annex 1 WORLD HEALTH ORGANIZATION ORGANISATION MONDIALE DE LA SANTÉ R E S O L U T I O N REGIONAL COMMITTEE FOR THE WESTERN PACIFIC COMITÉ RÉGIONAL DU PACIFIQUE OCCIDENTAL WPR/RC61.R2 13 October 2010 WESTERN
Integrated Management of Childhood Illness (IMCI) Implementation in the Western Pacific Region. IMCI Monitoring and Evaluation
 Implementation in the Western Pacific Region. IMCI Monitoring and Evaluation") Integrated Management of Childhood Illness (IMCI) Implementation in the Western Pacific Region IMCI Monitoring and Evaluation 8 IMCI Monitoring and Evaluation Why is monitoring and evaluation of IMCI important?
Integrated Management of Childhood Illness (IMCI) Implementation in the Western Pacific Region IMCI Monitoring and Evaluation 8 IMCI Monitoring and Evaluation Why is monitoring and evaluation of IMCI important?
INDONESIA S COUNTRY REPORT
 The 4 th ASEAN & Japan High Level Officials Meeting on Caring Societies: Support to Vulnerable People in Welfare and Medical Services Collaboration of Social Welfare and Health Services, and Development
Islamic Republic of Afghanistan. Ministry of Public Health
 Islamic Republic of Afghanistan Ministry of Public Health NATIONAL HEALTH POLICY -2009 AND NATIONAL HEALTH STRATEGY -2006 A policy and strategy to accelerate implementation TABLE OF CONTENTS NATIONAL HEALTH
Q1 BUDGET MONITORING REPORT FY 2016/17 CIVIL SOCIETY BUDGET ADVOCACY GROUP P.O BOX 660 NTINDA PLOT 11 VUBYA CLOSE NTINDA NAKAWA STRETCHER ROAD
 Q1 BUDGET MONITORING REPORT FY 2016/17 CIVIL SOCIETY BUDGET ADVOCACY GROUP P.O BOX 660 NTINDA PLOT 11 VUBYA CLOSE NTINDA NAKAWA STRETCHER ROAD Table of Contents List of Tables... ii List of Figures...
REPORT WHO/UNICEF WORKSHOP TO REVIEW PROGRESS AND ACTIONS TO IMPROVE CHILD SURVIVAL. Convened by:
 WPR/DHP/04/CHD(1)/2009 Report series number: RS/2009/GE/55(CHN) English only REPORT WHO/UNICEF WORKSHOP TO REVIEW PROGRESS AND ACTIONS TO IMPROVE CHILD SURVIVAL Convened by: WORLD HEALTH ORGANIZATION REGIONAL
Successful Practices to Increase Intermittent Preventive Treatment in Ghana
 Successful Practices to Increase Intermittent Preventive Treatment in Ghana Introduction The devastating consequences of Plasmodium falciparum malaria in pregnancy (MIP) are welldocumented, including higher
Dr. AM Abdullah Inspector General, MOH THE HEALTH SITUATION IN IRAQ 2009
 Dr. AM Abdullah Inspector General, MOH THE HEALTH SITUATION IN IRAQ 2009 AIMS AND OBJECTIVES The principle objective of the health system is to ensure that the healthcare needs of all Iraqi citizens are
Economic and Social Council
 United Nations E/CN.3/2015/20 Economic and Social Council Distr.: General 8 December 2014 Original: English Statistical Commission Forty-sixth session 3-6 March 2015 Item 4 (a) of the provisional agenda*
Myanmar Dr. Nilar Tin Deputy Director General (Public Health) Department of Health
 Department of Health") Existing Mechanisms, Gaps and Priorities Areas for development in Health Sector Myanmar Dr. Nilar Tin Deputy Director General (Public Health) Department of Health Ministry of Health Minister for Health
Existing Mechanisms, Gaps and Priorities Areas for development in Health Sector Myanmar Dr. Nilar Tin Deputy Director General (Public Health) Department of Health Ministry of Health Minister for Health
MCH Programme in Vietnam Experiences for post Dinh Anh Tuan, MD, MPh MCH Dept. MOH, Vietnam
 MCH Programme in Vietnam Experiences for post - 2015 Dinh Anh Tuan, MD, MPh MCH Dept. MOH, Vietnam Current status: Under five mortality 70,0 60,0 50,0 40,0 30,0 20,0 10,0 0,0 58,0 45,8 26,8 24,4 24,1 22,5
#HealthForAll ichc2017.org
 #HealthForAll ichc2017.org Rwanda Community Performance Based Financing David Kamanda Planning, Health Financing & Information System Rwanda Ministry of Health Outline Overview of Rwandan Health System
Contracting Out Health Service Delivery in Afghanistan
 Contracting Out Health Service Delivery in Afghanistan Dr M.Nazir Rasuli General director Care of Afghan Families,CAF. Kathmando Nepal 12 Jun,2012 Outline 1. Background 2. BPHS 3. Contracting with NGOs,
South Sudan Country brief and funding request February 2015
 PEOPLE AFFECTED 6 400 000 affected population 3 358 100 of those in affected, targeted for health cluster support 1 500 000 internally displaced 504 539 refugees HEALTH SECTOR 7% of health facilities damaged
IMCI and Health Systems Strengthening
 Integrated Management of Childhood Illness (IMCI) Implementation in the Western Pacific Region IMCI and Health Systems Strengthening 7 IMCI and Health Systems Strengthening What components of the health
CONCEPT NOTE Community Maternal and Child Health Project Relevance of the Action Final direct beneficiaries
 CONCEPT NOTE Project Title: Community Maternal and Child Health Project Location: Koh Kong, Kep and Kampot province, Cambodia Project Period: 24 months 1 Relevance of the Action 1.1 General analysis of
Chapter 6 Planning for Comprehensive RH Services
 Chapter 6 Planning for Comprehensive RH Services This section outlines the steps to take to be ready to expand RH services when all the components of the MISP have been implemented. It is important to
MONITORING AND EVALUATION PLAN
 GHANA HEALTH SERVICE MONITORING AND EVALUATION PLAN National tb control programme Monitoring and evaluation plan for NTP INTRODUCTION The Health System Structure in Ghana The Health Service is organized
Acronyms and Abbreviations
 Redacted Acronyms and Abbreviations CES CIP FP ISDP MCHIP MOH NGO OFDA PHC PHCC PITC PPH USAID WES Central Equatoria State County Implementing Partner Family Planning Integrated Service Delivery Project
CHAPTER 30 HEALTH AND FAMILY WELFARE
 CHAPTER 30 HEALTH AND FAMILY WELFARE The health of the population is a matter of serious national concern. It is highly correlated with the overall development of the country. An efficient Health Information
Health Cluster Coordination Meeting. Friday December 4, 2015, Kiev
 Health Cluster Coordination Meeting Friday December 4, 2015, Kiev Agenda Polio vaccination update Humanitarian Response Plan 2016 Partners updates MHPSS update TB/HIV/AIDs and OST AOB BACKGROUND On 28
AIDE MEMOIRE THEME: ADDRESSING SOCIAL DETERMINANTS OF HEALTH FOR IMPROVED HEALTH OUTCOMES
 THE REPUBLIC OF UGANDA AIDE MEMOIRE 23 RD JOINT REVIEW MISSION FOR THE HEALTH SECTOR 28 th 29 th SEPTEMBER, 2017 THEME: ADDRESSING SOCIAL DETERMINANTS OF HEALTH FOR IMPROVED HEALTH OUTCOMES CONFERENCE
Health: UNDAP Plan. Report Summary Responsible Agency # Key Actions Action Budget UNFPA 8 15,900,000 UNICEF 15 39,110,000 WFP 2 23,250, ,085,000
 Health: UNDAP Plan Report Summary Responsible Agency # Key Actions Action Budget 8 5,900,000 5 9,0,000 WFP,50,000 6 5 50,85,000 9,085,000 Relevant MDAs and LGAs develop, implement and monitor policies,
DELIVERY AGREEMENT. FOR OUTCOME 2: A Long and Healthy Life for All South Africans
 DELIVERY AGREEMENT FOR OUTCOME 2: A Long and Healthy Life for All South Africans TABLE OF CONTENTS 1. INTRODUCTION... 3 2. BROAD STATEMENT OF THE HEALTH SECTOR CHALLENGES... 5 3. CHALLENGES RELATING TO
Islamic Republic of Afghanistan Ministry of Public Health
 21 April 2007 Islamic Republic of Afghanistan Ministry of Public Health National Strategic Plan for the Monitoring and Evaluation Department 1386 1390 National Strategy for Monitoring and Evaluation 1386-1390
MARSHALL ISLANDS WHO Country Cooperation Strategy
 MARSHALL ISLANDS WHO Country Cooperation Strategy 2018 2022 OVERVIEW The Marshall Islands covers 181 square kilometres in the Pacific Ocean and comprises 29 atolls and five major islands. The population
In 2012, the Regional Committee passed a
 Strengthening health systems for universal health coverage In 2012, the Regional Committee passed a resolution endorsing a proposed roadmap on strengthening health systems as a strategic priority, as well
GUIDELINES FOR HEALTH SYSTEM ASSESSMENT
 GUIDELINES FOR HEALTH SYSTEM ASSESSMENT Myanmar June 13 2009 Map: Planned Priority Townships for Health System Strengthening 2008-2011 1 TABLE OF CONTENTS BOOK 1 SURVEYOR GUIDELINES List of Figures...
1 Background. Foundation. WHO, May 2009 China, CHeSS
 Country Heallth Systems Surveiillllance CHINA 1 1 Background The scale-up for better health is unprecedented in both potential resources and the number of initiatives involved. This includes both international
39th SESSION OF THE SUBCOMMITTEE ON PLANNING AND PROGRAMMING OF THE EXECUTIVE COMMITTEE
 PAN AMERICAN HEALTH ORGANIZATION WORLD HEALTH ORGANIZATION 39th SESSION OF THE SUBCOMMITTEE ON PLANNING AND PROGRAMMING OF THE EXECUTIVE COMMITTEE Washington, D.C., USA, 16-18 March 2005 Provisional Agenda
Costs of Publicly Funded Primary Hospitals, Departments, and Exempted Services in Ethiopia
 2016 Costs of Publicly Funded Primary Hospitals, Departments, and Exempted Services Resource Tracking and Management Project B.I.C. B.I.C. Breakthrough International Consultancy PLC Breakthrough International
USAID/Philippines Health Project
 USAID/Philippines Health Project 2017-2021 Redacted Concept Paper As of January 24, 2017 A. Introduction This Concept Paper is a key step in the process for designing a sector-wide USAID/Philippines Project
FRAMEWORK FOR HEALTH SYSTEMS DEVELOPMENT TOWARDS UNIVERSAL HEALTH COVERAGE IN THE CONTEXT OF THE SUSTAINABLE DEVELOPMENT GOALS IN THE AFRICAN REGION
 14 June 2017 REGIONAL COMMITTEE FOR AFRICA ORIGINAL: ENGLISH Sixty-seventh session Victoria Falls, Republic of Zimbabwe, 28 August 1 September 2017 Provisional agenda item 13 FRAMEWORK FOR HEALTH SYSTEMS
Provision of Integrated MNCH and PMTCT in Ayod County of Fangak State and Pibor County of Boma State
 Provision of Integrated MNCH and PMTCT in Ayod County of Fangak State and Pibor County of Boma State Date: Prepared by: February 13, 2017 Dr. Taban Martin Vitale I. Demographic Information 1. City & State
Creating a healthy environment for health care workers and their families. Policy
 Creating a healthy environment for health care workers and their families Policy World Health Organization Swaziland Government 1 Wellness Centre Mission Statement The Swaziland Wellness Centre for Health
Ministry of health. Community Health Extension Workers Strategy in Uganda (2015/ /20)
") Ministry of health Community Health Extension Workers Strategy in Uganda (2015/16-2019/20) April 2016 Table of Contents TABLE OF CONTENTS.. LIST OF TABLES LIST OF FIGURES ACRONYMS FOREWORD ACKNOWLEDGEMENT.
Ministry of health Community Health Extension Workers Strategy in Uganda (2015/16-2019/20) April 2016 Table of Contents TABLE OF CONTENTS.. LIST OF TABLES LIST OF FIGURES ACRONYMS FOREWORD ACKNOWLEDGEMENT.
Provisional agenda (annotated)
") EXECUTIVE BOARD EB140/1 (annotated) 140th session 21 November 2016 Geneva, 23 January 1 February 2017 Provisional agenda (annotated) 1. Opening of the session 2. Adoption of the agenda 3. Report by the
EXECUTIVE BOARD EB140/1 (annotated) 140th session 21 November 2016 Geneva, 23 January 1 February 2017 Provisional agenda (annotated) 1. Opening of the session 2. Adoption of the agenda 3. Report by the
A UNIVERSAL PATHWAY. A WOMAN S RIGHT TO HEALTH
 EXECUTIVE SUMMARY THE STATE OF THE WORLD S MIDWIFERY 2014 A UNIVERSAL PATHWAY. A WOMAN S RIGHT TO HEALTH REPRODUCTIVE HEALTH PREGNANCY CHILDBIRTH POSTNATAL Executive Summary The State of the World s Midwifery
PMI Quarterly Status Report April 2011 June 2011
 PMI Quarterly Status Report April 2011 June 2011 Submitted by: The Johns Hopkins Bloomberg School of Public Health Center for Communication Programs & Uganda Health Marketing Group - UHMG ACRONYMS ACT
In recent years, the Democratic Republic of the Congo
 January 2017 PERFORMANCE-BASED FINANCING IMPROVES HEALTH FACILITY PERFORMANCE AND PATIENT CARE IN THE DEMOCRATIC REPUBLIC OF THE CONGO Photo by Rebecca Weaver/MSH In recent years, the Democratic Republic