NUTRITION SCREENING SURVEY IN THE UK IN 2007
|
|
|
- MargaretMargaret McBride
- 6 years ago
- Views:
Transcription
1 NUTRITION SCREENING SURVEY IN THE UK IN 2007 A Report by BAPEN British Association for Parenteral and Enteral Nutrition Nutrition Screening Survey and Audit of Adults on Admission to Hospitals, Care Homes and Mental Health Units MAIN DATA COLLECTION: SEPTEMBER, 2007 CA Russell and M Elia on behalf of BAPEN and collaborators


2 BAPEN 2008 First published on the web March 2008 by BAPEN. First print edition April 2008 ISBN Enquiries to the BAPEN Secretariat, BAPEN Office, Secure Hold Business Centre, Studley Road, Redditch, Worcs, B98 7LG. bapen@sovereignconference.co.uk BAPEN is Registered Charity No Details of other BAPEN publications can be found on the BAPEN website. All rights reserved. No part of this publication may be reproduced for publication without the prior written permission of the publishers.this publication may not be lent, resold, hired out or otherwise disposed of by way of trade in any form, binding or cover other than that in which it is published, without the prior consent of the publishers. BAPEN s Nutrition Screening Week 2007 was undertaken by BAPEN in collaboration with the British Dietetic Association and Royal College of Nursing, and with support from the Welsh Assembly Government, Scottish Government, the Chief Nursing Officer in Northern Ireland and the Department of Health in England and the National Patient Safety Agency.
3 Table of Contents Key Points 1 Summary 2 Purpose of Survey 4 Methodology and Procedures 5 Hospital Survey 6 Care Home Survey 13 Mental Health Unit Survey 20 References 24 Acknowledgements 25 Appendices 26
4 Key Points Malnutrition in adults on admission to hospitals and care homes affects almost 1 in 3 subjects, who were mostly in the high risk category. Malnutrition is common in all types of care homes and hospitals, all types of wards and diagnostic categories, and all ages. It is also common in mental health units. Nutritional screening policies and practice vary between and within health care settings, whilst malnutrition continues to be under-recognised and under-treated. Much of the malnutrition present on admission to institutions originates in the community. Consistent and integrated strategies to detect, prevent and treat malnutrition should exist within and between all care settings. 1
5 Summary 1.The Nutrition Screening Survey 1.1 This report provides a summary of the largest nutrition screening survey undertaken in the UK. Reporters from 175 hospitals, 173 care homes and 22 mental health units in the UK completed a general questionnaire and an anonymous patient questionnaire as part of a national audit on nutritional screening. Unlike previous studies that used different criteria to identify malnutrition in various care settings, this survey used the same criteria based on the Malnutrition Universal Screening Tool ( MUST ) in all care settings. Data were collected on patients during the first three days of admission to hospitals and acute mental health units, and on residents admitted to care homes and long stay / rehabilitation mental health units in the previous six months. 2. Hospitals 2.1 Of 9336 patients who were screened on admission to hospital, 28% were found to be at risk of malnutrition, (high risk, 22%; medium risk, 6%).The combination of these two risk categories is henceforth referred to as malnutrition for simplicity. 2.2 Since the presence of malnutrition at or shortly after admission to hospitals suggests that it largely originated in the community, strategies to prevent and treat malnutrition in the community setting should be considered. 2.3 Malnutrition varied significantly according to source of admission (25% from home, 31% from another hospital, 32% from another ward, and 43% from a care home), type of admission (32% for emergency admission, 20% for elective admission), and type of ward (e.g. 43% in oncology wards and 15% in orthopaedic/trauma wards). It was also greater in hospitals that had a screening policy than those that did not (28% v 24%), and considerably greater in large hospitals with 1000 beds than in those with <1000 beds (38% v 26%). 2.4 Malnutrition was common in all age groups and diagnostic categories, but it was significantly more common in women, who were older than men (29% v 26%), in subjects aged over 65 years than under 65 years (30% v 24%), and in certain diagnostic categories than others (e.g. gastrointestinal disease (43%) and neurological disease (33%) versus cardiovascular (21%) and musculoskeletal conditions (18%)). A low body mass index (BMI <20 kg/m 2 ) contributed to a MUST score in 4 out of 10 malnourished patients. 2.5 Most hospitals reported that they had a screening policy (89%), but weighing on all wards was carried out in less than half (less than a quarter of patients involved in the survey were in hospitals where weighing was carried out on all wards).this suggests that much malnutrition continues to be under-recognised and under-treated. 3. Care homes 3.1 Of 1610 residents screened 30% were malnourished (20% high risk, 10% medium risk). 3.2 The prevalence of malnutrition was greater in residents admitted from hospitals (35%) and other care homes (30%) than in those admitted from their own homes (24%).The prevalence was also greater in nursing homes (35%) than residential homes (22%). 3.3 Malnutrition was more prevalent in care homes that had a screening policy (31%) (these care homes accounted for 82% of the residents in the survey) than in those that did not (23%). 3.4 A low BMI (<20 kg/m 2 ) contributed to the MUST score in about 9 out of 10 malnourished residents. Underweight was 2- to 3-fold more common than obesity.the subjects in care homes were older than those in hospitals and mental health units, half of them being 85 years and over.the prevalence of malnutrition tended to increase with age (26% in those <70 years, 29% in those years and 32% in those 85 years) and duration of stay (up to 6 months), but neither of these were statistically significant. 3.5 Women were older and had a greater prevalence of malnutrition than men (32% v 27%). 3.6 Half the residents had neurological conditions with an associated malnutrition prevalence that was intermediate (33%) between those found in respiratory (43%) and musculoskeletal conditions (21%), which accounted for only 5% and 9% of all those screened respectively. 2
6 4. Mental Health Units 4.1 Of 332 adults screened, 19% were malnourished (12% high risk, 7% medium risk). 4.2 The prevalence of malnutrition on admission to combined Acute and Long-stay/Rehabilitation units, which provided data on most of the population, was only 17%.This was lower that that found in only Acute (31%) or only Long-stay rehabilitation units (29%). 4.3 Less than half the units had a nutrition screening policy, but more than two thirds of patients were reported from such units.the prevalence of malnutrition on admission (31%) was higher in units that had a screening policy than those that did not (17%), and in those that had access to a nutrition support team (39%) than those that did not (17%) A low BMI (<20kg/m 2 ) was present in 14% of patients (8% with a BMI < 18.5 kg/m 2 ). Subjects aged 65 years and over (24%) had a greater prevalence of malnutrition (24%) than those less than 65 years (14%). 5. A comparison across care settings 5.1 The prevalence of malnutrition on admission to hospitals (28%) was similar to that found in care homes (30%), but higher than in mental health units (19%), although a much smaller number of subjects were reported from mental health units. 5.2 In all care settings most of the malnutrition was high risk malnutrition. 5.3.The prevalence of malnutrition amongst patients admitted to hospitals or care homes varied significantly according to source of admission, being lower in those that came from their own homes than from institutions (other wards, hospitals and care homes).the differences in mental health units were not significant. 5.4 In each setting women outnumbered men (ratio 1.1:1 in care homes and mental health units and 2.1:1 in care homes).women were also older and had a slightly greater prevalence of malnutrition than men. 5.5 BMI contributed to MUST scores in about 4 out of 10 subjects in acute hospitals, 7 out of 10 in community hospitals and mental health units, and 9 out of 10 in care homes. Underweight (BMI <20kg/m 2 ) was most common in care homes, affecting more than a quarter of residents.the mean BMI in care homes (23.4 kg/m 2 ) was significantly lower (p <0.001) than in hospitals (26.2 kg/m 2 ) and mental health units (25.7 kg/m 2 ). In care homes underweight was more common than obesity (BMI >30kg/m 2 ), whilst in hospitals and mental health units the reverse was true. 5.6 In each care setting malnutrition was more common where a nutrition screening policy was in place than where it was not. Paradoxically, screening policies, which were most common in hospitals (89%), were associated with the least amount of weighing on admission (a little under half). In contrast, in mental health units, where screening policies were least common (45%), weighing was apparently undertaken routinely on all patients. In care homes a nutrition screening policy was in place in at least 82% of them, and almost all residents were weighed on admission and regularly throughout their stay.the extent to which results of screening and weighing were linked into appropriate clinical care requires investigation. 6. Recommendations 6.1 Patients or residents admitted to all institutional care settings should be screened, and repeat measurements made at intervals according to care setting, using accurate and reliable instruments (see MUST report). 6.2 The results of nutritional screening should be linked to care plans, which may vary according to local resources and policies. 6.3 Access to nutrition advice and nutrition support teams should be available. 6.4 Consistent strategies to detect, prevent, and treat malnutrition should be in place in all care settings, including the community, where most malnutrition originates. 3
7 Purpose of Survey Whilst malnutrition is considered to be common in hospitals, care homes and mental health units, there is still uncertainty about its overall prevalence in the UK, and its distribution between different types of institutions.this is partly because large scale surveys in different parts of the UK are lacking, and partly because a wide range of different screening tests, with variable validity and reliability, have been used to detect malnutrition [1]. Some of these tests can establish a prevalence of malnutrition that is two or more than two-fold greater than others [2], even when used on the same patients. It is obviously important to use screening procedures that are valid, reliable and user friendly. Even so, confusion can arise when various screening tests are used in the same institution (e.g. different parts of the same hospital) and at different times in the same patients as they journey from one healthcare setting to another.the use of a validated screening test in all healthcare settings has obvious advantages, not only from a clinical perspective but also from a public health and epidemiological perspectives. A series of recent national and international reports have emphasised the importance of nutritional screening to identify those that require treatment and those that do not. Amongst such reports are those from the Council of Europe (Hospitals only) [3], NHS Quality Improvement Scotland (Hospital only), [4] National institute of Health and Clinical Excellence (all care settings) [5], Department of Health (National Action Plan (all care settings) [6], as well as reports from an alliance of organisations (all care settings) [7] and individual organisations, such as BAPEN [2]. However, it is believed that malnutrition continues to be under-recognised and under-treated. Important steps in the fight against malnutrition include documenting the extent of this problem in different settings and diagnostic categories, obtaining insights into the barriers towards screening, and the relationship of these barriers to local policies, procedures and attitudes towards nutritional screening. Such data would complement information obtained during the European Nutrition Study Day held in January 2007, which did not collect information on admission to hospitals or other care settings. Malnutrition has detrimental effects on the individual, the National Health Service and society in general. Nutritional screening can identify those at risk and enable early intervention.when malnutrition is identified on admission to institutions it directs attention to the problems that led to its development before admission, such as disease, poverty, deprivation, geography, and attitudes towards nutrition, which can be influenced by previous education and training. The specific aims of the audit / survey were: 1. To establish and compare the prevalence of malnutrition in different care settings and different types of institutions within these settings using the same screening test. 2. Document current screening practice and identify some of the problems that need to be rectified. 3. Provide feedback to local centres so the results can be benchmarked against those obtained throughout the UK. 4. Provide recommendations to improve nutritional care. 4
8 Methodology and Procedures The survey was coordinated by BAPEN, and involved collaboration from the British Dietetic Association and the Royal College of Nursing. Participants were recruited via organisational networks, adverts in newsletters and websites.the participants were asked to complete two forms: a general form about their institution and another form to record data on individuals who were screened.the information was anonymous and had no specific patient identifiers.the appendix includes the sets of forms for hospitals, care homes and mental health units and the associated instructions. In hospitals and acute mental health units data for nutritional screening were obtained on adult patients admitted during 25-27th September 2007 within 72 hours of admission. In care homes and long stay/rehabilitation mental health units the data were restricted to adults who had been admitted in the previous 6 months. Individuals receiving enteral and parenteral nutrition were excluded. In all cases malnutrition risk was established using MUST. For simplicity, medium + high risk in combination is referred to as malnutrition, except where otherwise stated. Diagnostic categories were system based (e.g. respiratory system, cardiovascular system). Patients with cancer were included within the relevant diagnostic categories. Data were entered into spread sheets, checked at the time of entry and re-checked again later, when an error rate of <0.2% was identified and corrected. Only subjects aged 18 years and over were included in the final analysis, which was undertaken using the Statistical Package for the Social Sciences (SPSS version 14; Chicago, Illinois, USA). Analysis included Chi squared tests, unpaired t tests and binary logistic regression. A p value of <0.05 was considered to be significant. 5
9 Hospital Survey GENERAL FEATURES Total number of subjects (not all questions completed on all subjects) 9722 individual patients 9460 with MUST ( Malnutrition Universal Screening Tool ) scores 9336 with MUST scores in patients 18 y and over Hospitals Number of hospitals 175 Policies, audit and access to nutrition support team Nutrition Nutrition Nutrition Access to policy screening screening nutrition policy audited support team (%) (%) (%) (%) Yes No Don t know Total Number of hospitals Percent of patients screened: 28% of hospitals screened 0-25% of their patients, 38% of hospitals screened 25-50% of patients, 29% of hospitals screened 50-75% of patients, and 6% of hospitals screened % patients (Total base N = 175 hospitals). Measuring weight and height Recording of weight Recording of height (%) (%) Yes, on all wards Yes, on some wards No 6 29 Don t know 2 6 Total 100* 100* Number of hospitals * Results do not add up to 100% due to rounding up of the component values to the nearest 1%. In hospitals with a screening policy: of the patients in the survey 25% were in hospitals that undertook weighing on all wards, 63% in hospitals that weighed patients on some wards and 11% in hospitals that did not weigh patients in any wards. In hospitals without a screening policy: of the patients in the survey only 2% were in hospitals that undertook weighing on all wards and 98% in those that undertook weighing on some wards. In hospitals where the respondents did not know if there was nutrition screening policy in place: of the patients in the survey 61% were in hospitals that undertook weighing on all wards and 39% in those that weighed patients on some wards (Total base N = 7816). 6
 is skewed to the left.")
10 General subject characteristics Gender: There were 5017 women and 4546 men (no gender reported on 4 subjects; total N = 9567) and a ratio of women to men of 1.1:1.0. Age: Of the adult patients (>18 years) 55% were aged 65 years and over (total N = 9563). The age distribution (range years) is skewed to the left. In the figure of age distribution, frequency refers to the number of patients in each age group, which is represented by the individual bars of the histogram. For men the median age was 65.5 years (mean age 63 (sd18) years) and for women 69 years (mean age 65 (sd20)years). Diagnostic categories: The diagnostic categories of adult patients in the survey were as follows: gastrointestinal (GI) disease (18%), cardiovascular disease (12%), respiratory disease (11%), musculoskeletal (including orthopaedic) (17%), genito-urinary disease (7%), neurological (CNS) disease (5%), other (26%) and not known (2.0%) (Total N = 9479). Body mass index (BMI): The mean BMI was 26.2 (sd 6.3) kg/m 2. 13% had a BMI less than 20kg/m 2 (7% less than 18.5 kg/m 2 ), 35% a BMI between 20 and 24.9 kg/m 2 and 52% had a BMI > 25 kg/m 2 (22% >BMI 30kg/m 2 ). PREVALENCE OF MALNUTRITION MALNUTRITION (MEDIUM + HIGH RISK) ACCORDING TO RISK CATEGORY Medium risk 6% High risk 22% Medium + high risk 28% (Total base: N = 9336) 7
,Wales (10%), Northern Ireland (7%), and Scotland (7%).")
11 MALNUTRITION ACCORDING TO COUNTRY England 29% Wales 26% Northern Ireland 25% Scotland 23% Overall 28% (Total base: N = 9336) P = The patients were in England (76%),Wales (10%), Northern Ireland (7%), and Scotland (7%). MALNUTRITION ACCORDING TO TYPE OF HOSPITAL AND OPERATIONAL HOSPITAL CHARACTERISTS Malnutrition according to type of hospital Acute hospital 27% Community hospital 29% Overall 28% (Total base: N = 7433) Not significant (P= 0.463) Patients in acute hospitals accounted for 94% of all the MUST results, and those in community hospitals for 4% (the type of hospital for the remaining 2% of patients (additional to N = 7433) was not reported). Malnutrition according to number of hospital beds <1000 beds 26% >1000 beds 38% Overall 28% (Total base: N = 6781) P <0.001 Hospitals with less than 1000 beds accounted for 87% of patients who were screened. Odds ratio (95% CI) = ( ) Adjusted odds ratio* = ( ) * Adjusted for age, ward type, diagnostic category, and type of admission 8
12 Malnutrition according to type of admission Emergency admission 32% Elective admission 20% Overall 28% (Total base: N = 9137) P < % were emergency admissions and 33% elective. Malnutrition according to source of admission Admitted from: Home 26% Other hospital 31% Other ward 32% Care home 43% Overall 28% (Total base: N = 9298) P < % came from their own homes, 7% from another hospital, 13% from another ward, and 3% from care homes. Malnutrition according to nutrition screening policy Nutrition screening policy: Yes 28% No 24% Don t know 23% Overall 27% (Total base: N =7645) P = % of patients were admitted to hospitals with a nutritional screening policy, 15% to hospitals without a screening policy and 3% to hospitals where the reporters did not know if there was a screening policy. Malnutrition according to audit on nutritional screening Nutrition screening audit: Yes 27% No 31% Don t know 27% (Total base: N = 7645) P = % of patients were admitted to hospitals that did not audit nutritional screening, 10% into hospitals that did, and 4% into hospitals in which the reporters did not know whether auditing took place. Malnutrition according to proportion screened 0-25% screened 31%: 26-50% screened 25% 51-75% screened 26% % screened 27% Overall 27% (Total base: N = 4531) P = % of patients were reported from hospitals in which 0-25% of patients were screened, 17% in which 26-50% were screened, 35% in which 51-75% were screened, and 31% in which % were screened. 9
13 MALNUTRITION RISK ACCORDING TO TYPE OF WARD 5% of patients were in Oncology wards, 10% in Care of the Elderly/Stroke, 35% in Medical wards, 29% in Surgical wards, 8% in other types of wards, and 13% in Orthopaedic/Trauma wards. MALNUTRITION RISK ACCORDING TO SUBJECT CHARACTERISTICS Malnutrition risk according to gender Women 29% Men 26% Overall 28% (Total base: N = 9338) P <0.001 Risk increased with age and women were significantly older than men, but women remained at greater risk even after adjustment for age (binary logistic regression). Women accounted for 53% of all patients and men for 47%. Malnutrition risk according to age A substantial malnutrition risk was present at all ages. 10
 contributed to the MUST score in 43% of malnourished patients.")
14 The risk was 25% in patients <60 years, 27% in those aged 60-79years and 34% in those 80 years. It was 25% greater in patients aged 65years and over than those <65 years ((24% v 30; p = 0.001). Contribution of a low BMI to MUST score Underweight (BMI <20kg/m 2 ) contributed to the MUST score in 43% of malnourished patients. Malnutrition according to diagnostic category Of the patients screened 18% had GI (gastrointestinal) disease, 2% diagnoses not known, 5% neurological (CNS) diseases, 11% respiratory disease, 27% other diagnoses, 7% GU(genitourinary)/renal, disease, 13% cardiovascular (CVS) disease, and 17% musculoskeletal disease. 11
15 Malnutrition according to presence of other conditions No 24% Yes 30% Don t know 22% Overall 28% (total base: N = 9338) P < % of all patients had no other conditions and 61% did.there was uncertainty (don t know) in the remaining 2%. Comments Hospital Survey This survey on nutritional screening in hospitals is the largest of its kind in the UK. Although the sample was not chosen randomly from UK hospitals, the results clearly show that malnutrition is common on admission to acute and community hospitals, all types of wards, and all age groups and diagnostic categories. Overall, malnutrition risk was identified in 28% of patients admitted to hospital, most of whom had high risk of malnutrition (22%) and only a minority medium risk (6%). The admission prevalence of malnutrition is not the same as the ward prevalence of malnutrition.the latter is expected to be greater than the admission prevalence, since malnourished patients stay in hospital longer than non-malnourished patients. With an admission prevalence of 28% and a 30% longer length of hospital stay in malnourished patients, the ward prevalence of malnutrition can be calculated to be 33.6% (assuming that there is no mortality and that no malnutrition develops during hospital stay) [8]. A number of studies have reported length of stay to be 20-75% longer in malnourished than non malnourished patients.ward prevalence can therefore be estimated to be 36.7% when the length of hospital stay is 50% longer in malnourished than non-malnourished patients [8].Thus, hospital malnutrition is not a trivial problem that can be ignored, but a major problem that needs multidisciplinary attention. Unlike the community, where the prevalence of malnutrition is several-fold greater (per 100 subjects) in older than younger adults (>65 years v <65 years), in hospitals it was found to be only 25% greater on admission among older patients (consistent with the results of a national survey in The Netherlands [9]).This is because patients admitted to hospital often have severe disease in association with malnutrition, irrespective of age. In this survey older people accounted for a disproportionately large fraction of the adult patients admitted to hospital (about half, which is a typical contribution), compared to their contribution to the general population in the community. Since nutritional risk was assessed on admission to hospital, its presence indicates that it had largely developed in the community. Strategies to prevent and treat malnutrition before admission to institutions should be considered in more detail. As many as a quarter of the patients admitted to hospitals came from other wards, other hospitals, or care homes, all of which had a greater prevalence of malnutrition than those admitted from their own homes. Variations in the source of admission did not explain differences in malnutrition prevalence between larger and smaller hospitals (>1000 beds (38% malnutrition ), <1000 beds (26% malnutrition ), the presence or absence of a screening policy (28% v 24%), or the proportion of patients screened on admission to hospital. In hospitals with a screening policy; of the patients in the survey 25% were in hospitals that undertook weighing on all wards whereas in hospitals without a screening policy only 2% of patients in the survey were in hospitals that weighed patients on all wards.this would suggest that much malnutrition is unrecognised. The proportion of underweight patients admitted to hospitals (BMI <20 kg/m 2 (13%) (7% below BMI 18.5 kg/m 2 )) is several-fold greater than the proportion in the community.the high prevalence of obesity on admission to hospital (22%) reflects the growing obesity problem in the community as a whole. Implementation of behavioural and life-style strategies requires a community focus, although hospitals should be included in such strategies. Similar joined up thinking is required for malnutrition. 12
16 Care Home Survey GENERAL FEATURES Total number of subjects (not all questions completed on all subjects) 1610 individual residents 1610 with MUST scores (all >18 years) Care Homes Number of Care Homes 173 Nutrition service, screening policy, audit, and measurement of weight and height on admission Nutrition Nutrition Nutrition Weight Height service screening screening on on available policy audited admission admission (%) (%) (%) (%) (%) Yes No Don t know Total 100* 100* Number of care homes * Results do not add up to 100% due to rounding up of the component values to the nearest 1%. Percent of residents screened: 1% of care homes screened 25-50% of residents, another 1% screened 50-75% of residents, and the remaining 98% screened % residents (Total base N = 173 care homes). 13
17 General subject characteristics Gender: There were 1095 women and 515 men (total N = 1610) Ratio of women to men, 2.1:1.0. Age: The mean age was 83.3 (sd 9.5) years (median 85.0 years; inter-quartile range years) (N = 1570). Women (N =1066) were older than men (N = 504) (mean 84.4 (sd 8.7) v 81.0 (sd 10.6) years; median 86 v 83 years; P < 0.001). 96% of the residents were 65 years and over. In the figure of age distribution, frequency refers to the number of residents in each age group, which is represented by the individual bars of the histogram. 14
18 Body mass index (BMI): The mean BMI was 23.4 (sd 5.5) kg/m 2. 28% of residents had a BMI less than 20 kg/m 2 (18% less than 18.5 kg/m 2 ), 40% a BMI between 20 and 24.9 kg/m 2 and 32% had a BMI > 25 kg/m 2 (10% >BMI 30kg/m 2 ) (Total N = 1570). In the figure of BMI distribution, frequency refers to the number of residents in each BMI group, which is represented by the individual bars of the histogram. Diagnostic categories: CNS (stroke, dementia, Parkinson s disease, Alzheimer s disease, multiple sclerosis) 50%; frail elderly (various reasons) 18%; musculoskeletal (including orthopaedic) 9%; cardiovascular disease, 6% respiratory disease 4% genito/renal disease 2%; gastrointestinal disease 2%; other 9%. (N = 1587). CNS disease in subjects from residential homes (41%) and nursing homes (48%) was less common than those from EMI (Elderly Mentally Ill) homes (87%). PREVALENCE OF MALNUTRITION MALNUTRITION (MEDIUM + HIGH RISK) ACCORDING TO RISK CATEGORY Medium risk 10% High risk 20% Medium + high risk 30% (Total base: N = 1610) 15
19 MALNUTRITION ACCORDING TO COUNTRY England 30% Wales 27% Northern Ireland 35% Scotland 29% Overall 30% (Total base: N = 1610) Not significant (P = 0.553) The residents were in England (78%),Wales (3%), Northern Ireland (10%), and Scotland (10%). MALNUTRITION ACCORDING TO TYPE OF CARE HOME AND CARE HOME CHARACTERISTICS Malnutrition according to type of care home Nursing homes only 35% Residential homes only 22% Others 32% Overall 30% (Total base: N = 1610) P < % of residents were in homes that were exclusively nursing homes, 22% in homes that were exclusively residential homes and most of the remainder were in homes that were a combination of two or more different types of care homes (Nursing homes, Residential homes, Elderly Mentally Ill homes and homes for the Disabled). Malnutrition according to number of care home beds The trend for malnutrition risk to increase with number of beds in the care home was not statistically significant (P(linear trend) = 0.075). 16
20 Malnutrition according to source of admission Home 24% Hospital 35% Other care home 31% Overall 30% (Total base: N = 1589) P < % of all residents were admitted from their own homes, 44% from a hospital and 19% from another care home. Malnutrition according to duration in care home 0-1 month 27% 2-3 months 32% 4-6 months 31% Overall 30% (Total base: N = 1609) Not Significant (P = 0.228) 25% of residents were admitted in the previous month, 31% in the previous 2-4 months and 44% in the previous 4-6 months. Malnutrition according to screening policy Nutrition screening policy: Yes 31% No 23% Don t know 18% Overall 29% (Total base: N = 1363) P = % were resident in care homes with a screening policy, 8% in care homes that did not have a policy and 10% in care homes where the respondents did not know whether there was a screening policy in place. Malnutrition according to percent of residents screened 98% of residents were in care homes that screened % of residents ( malnutrition prevalence 31%). 17
21 MALNUTRITION ACCORDING TO SUBJECT CHARACTERISTICS Malnutrition according to gender Women 32% Men 27% Overall 30% (Total base: N = 1610) P = % of the residents were women and 32% men. Malnutrition according to age <70 years 26% years 29% 85 years 32% Overall 30% P(linear trend) = % of residents were less than 70 years, 42% years, and 51% 85 years and over. Malnutrition according to primary problem 4% had respiratory conditions, 2% GU (genito-urinary) renal conditions, 2% GI (gastrointestinal) conditions, 18% had frailty (frail elderly), 50% had neurological (CNS) conditions (including stroke, dementia, Parkinson s disease, Alzheimer s disease), 6% cardiovascular disease, 9% had musculo-skeletal conditions (including orthopaedic), 9% other conditions. 18
22 Malnutrition according to presence of other conditions No 29% Yes 31% Don t know 37% Overall 30% (total base: N = 1610) P = % of all residents had no other conditions and 62% did.there was uncertainty (don t know) in the remaining 3%. Comments Care Home Survey Using the same screening procedure ( MUST ), the prevalence of malnutrition in care homes (30%) was found to be similar to that in hospitals (28%). More than a quarter of the residents in care homes were thin with a BMI of less than 20 kg/m 2.The overall mean BMI in care homes was 23.4 kg/m 2, significantly lower than that in hospitals (mean BMI 26.2 kg/m 2 ).The median age was significantly greater in care home residents (85 v 65 years).the prevalence of malnutrition in nursing homes (35%) was greater than residential homes (22%), perhaps reflecting the presence of more severe disease in nursing homes. Half the residents had neurological conditions, in which the prevalence of malnutrition was intermediate between that found in respiratory conditions (43%) and musculoskeletal conditions (21%), which accounted for 5% and 9% of the residents screened in care homes respectively. There was a tendency for malnutrition to increase with duration of stay in the care home (cross sectional data up to 6 months) and for malnutrition to increase with the number of beds in care homes, but neither of these two results reached statistical significance. 19
23 Mental Health Unit Survey GENERAL FEATURES Total number of subjects (not all questions completed on all subjects) 336 individual patients reported 333 with MUST ( Malnutrition Universal Screening Tool ) scores 332 with MUST scores in patients 18 y and over Mental Health Units Number of Long-term/Rehabilitation units 22 Mental Health Units (12 Acute, 5 Long-term/Rehabilitation units, 5 Acute + Long-term/Rehabilitation Units), of which 21 were in England and one in Scotland. Policies, audit and access to nutrition support team Nutrition Nutrition Nutrition Access to Weight Height policy screening screening nutrition on on policy audited support team admission admission (%) (%) (%) (%) (%) Yes No Don t know Total 100* 100* Number of Mental Health Units * Results do not add up to 100% due to rounding up of the component values to the nearest 1%. Percent of patients screened: 7% of units screened 25-50% of patients, 7% of hospitals screened 50-75% of patients, and 84% of units screened % patients (Total base N = 15 Mental Health Units). General subject characteristics Gender: There were 177 women and 156 men (total N = 333) Ratio of men to women 1.1: 1.0 Age: The mean age was 59.2 (sd 20.0) years (median 63 years; inter quartile range years). In the figure of age distribution, frequency refers to the number of subjects in each age group, which is represented by the individual bars of the histogram. 20
24 Women were older than men (mean 62.4 (sd 18.7) years v 55.6 (sd 20.8) years; p <0.001; median 67 v 57.5 years).the age differed according to the type of Mental Health Unit (mean (sd): Acute Units, 53.8 (21.5) years (12% of all patients); Long stay/rehabilitation Units, 66.3 (18.6) years (18% of all patients); and Acute + Long stay/rehabilitation Units, 58.2 (19.5) years (70% of all patients). Body mass index (BMI): The mean BMI was 25.7 (sd 6.0) kg/m 2. 14% had a BMI less than 20 kg/m 2 (8% less than 18.5 kg/m 2 ), 38% a BMI between 20 and 24.9 kg/m 2 and 48% had a BMI 25 kg/m 2 (21%, BMI 30 kg/m 2 ). PREVALENCE OF MALNUTRITION MALNUTRITION ACORDING TO RISK CATEGORY Medium risk 7% High risk 12% Medium + high risk 19% (Total base: N = 332) MALNUTRITION ACORDING TO COUNTRY England 18% Scotland 33% (but a total of only 12 patients from Scotland) Overall 19% (Total base: N = 332 patients) P = The patients were in England (96%) and Scotland (4%). 21
25 ACCORDING TO TYPE OF MENTAL HEALTH UNIT AND OPERATIONAL CHARACTERISTS Malnutrition according to type of Mental Health Unit Acute 31% Long stay/rehabilitation 21% Acute and Long stay/rehabilitation 17% Overall 19% (Total base: N = 320) P = % of all the MUST results came from Acute units,18% from Long stay/rehabilitation units and 70% from a combination of both types of units. Malnutrition according to number of beds in Mental Health Units <100beds 30% 100 beds 17% Overall 20% (total base: N = 267) P = % of patients were in Mental Health Units with <100 beds and 76% in units with 100 or more beds. 6% of all patients were in Acute Units with >100 beds and 42% in Acute Units with <100 beds. 5% of all patients were in Long stay/rehabilitation Units with >100 beds and 47% in units with <100beds. 89% of all patients were in Acute + Long stay/rehabilitation Units with >100beds and 11% in units with <100 beds. Malnutrition according to source of admission Home 19% Other hospital 24% Other ward 21% Care home 12% Overall 19% (total base: N = 304) P = % of patients were admitted from home, 22% from hospital, 10% from other wards, and 14% from care homes. Malnutrition according to Nutrition Screening Policy Nutrition screening policy: Yes 33% No 16% Don t know 15% Overall 19% (total base: N = 307) P = % of all patients were in units that had no nutrition policy, 67% in units with a policy, and 11% in units where the respondents did not know if there was a nutrition policy in place. Malnutrition according to access to Nutrition and Dietetic Service Of the respondents (N = 307) all had access to a Nutrition and Dietetic Service. Malnutrition according to access to Nutrition Support Team Yes 39% No 17% Overall 20% (total base: N =307) P = Only 13% (N = 39) of all patients were in units that had access to a Nutrition Support Team 22
26 MALNUTRITION ACCORDING TO SUBJECT CHARACTERISTICS Malnutrition according to gender Women 24% Men 14% Overall 19% (total base: N = 332) P = % of all patients were women and 47% men. Malnutrition according to age category < 65 years 14% 65 years 24% Overall 19% (total base: N = 332) P = % of all the patients were aged less than 65 years and 47% 65 years and over. Malnutrition according to presence of other conditions Other conditions: No 16% Yes 22% Overall 19% (total base: N = 330) P = % of all patients had no other conditions and 53% did. Comments Mental Health Unit Survey Although the information obtained in the survey on Mental Health Units using MUST is novel, it is limited by sample size (total N = 336). No data were obtained from Wales and Northern Ireland, and very few patients were reported from Scotland.Therefore the data presented largely reflect results from England. The prevalence of malnutrition was found to be 19%, which is lower than that found in hospitals and care homes. However, patients from acute units exclusively (prevalence of malnutrition, 31%) were underrepresented.they accounted for only 12% of the patient sample used in this analysis, whereas units admitting only patients with acute problems accounted for 55% of all the mental health units involved in the survey. Most of the malnutrition was high risk, a pattern also observed in hospitals and care homes. Malnutrition was greater in older people ( 65 years) than younger patients (<65 years) (24% v 14% malnutrition ) and in women than in men (24% v 14% malnutrition ), who were younger than women. There was more malnutrition in units with access to a nutrition support team.the presence of more malnutrition probably led to the need to seek access to nutrition support teams to provide advice on its management. 23
27 References [1] Stratton RJ, Green CJ, Elia M. Disease-related malnutrition. An evidence-based approach to treatment. Oxford: CABI Publishing (CAB International); [2] Elia M (chairman & editor).the MUST report. Nutritional screening for adults: a multidisciplinary responsibility. Development and use of the Malnutrition Universal Screening Tool ( MUST ) for adults. A report by the Malnutrition Advisory Group of the British Association for Parenteral and Enteral Nutrition [3] Council of Europe - Committee of Ministers. Resolution ReAP (2003)3 on food and nutritional care in hospitals [4] NHS Quality Improvement Scotland. Food, Fluid and Nutritional Care. Edinburgh: [5] National Institute of Health and Clinical Excellence. Nutrition support in adults. Clinical Guideline [6] Department of Health. Improving Nutritional Care: A joint Action Plan from the Department of Health and Nutrition Summit stake holders. Department of Health Publications; [7] The European Nutrition for Health Alliance, British Association for Parenteral and Enteral Nutrition, International Longevity Centre (UK), in collaboration with the Associate Parliamentary Food & Health Forum - (Elia M, chairman). Malnutrition among older people in the community. Policy recommendations for change [8] Elia M. (chairman & editor), Stratton R, Russell C et al.the cost of disease-related malnutrition in the UK and economic considerations for the use of oral nutritional supplements (ONS) in adults. A report by The Health Economic Group of The British Association for Parenteral and Enteral Nutrition (BAPEN). BAPEN; [9] Kruizenga HM, Wierdsma NJ, van Bokhorst MA et al. Screening of nutritional status in The Netherlands. Clin Nutr 2003; 22:
28 Acknowledgements We would like to thank participating centres, other members of the Nutrition Screening Week Advisory Group (Debbie Dzik-Jurasz (RCN), Najia Qureshi (BDA), Rick Wilson, Vera Todorovic), the BAPEN Office for providing administrative support, Rhonda Smith for development support and promotion, and Claire Oldale for acting as assistant project coordinator. 25
29 Appendices BAPEN Nutrition Screening Week 2007 Audit Forms & Guidance Notes for Hospitals, Care Homes and Mental Health Units 26
30 NSW Nutrition Screening Week Appendix 1 - Hospitals Sheet 1(a) for Hospitals Hospital Name. Information about your Hospital Code Number Please complete by putting an X in the appropriate boxes. Please use black ink. 1a. What type of hospital? Teaching Non Teaching 1b. Acute Mental Health Community 2. How many beds? Please state number 3. Do you have access to a Nutrition and Dietetic service? Yes No? 4. Do you have access to a Nutrition Support team? Yes No? 5. Does your hospital / Trust have a Nutrition policy? Yes No? 6. Does your hospital / Trust have a Nutrition Screening policy? Yes No? 7a. Do you know what % patients are screened on admission? Yes No? 7b. If you have answered Yes to 7a please indicate % of patients screened on admission: Up to 25% 26-50% 51-75% % 8. Are patients routinely weighed on admission? Yes on all wards On some wards No? 9. Is the height of patients routinely recorded? Yes on all wards On some wards No? 10. Is the practice of nutrition screening audited? Yes No? Thank you Nutrition Screening Week is an initiative of BAPEN in collaboration with the British Dietetic Association and the Royal College of Nursing, supported by the National Patient Safety Agency. 27
31 28
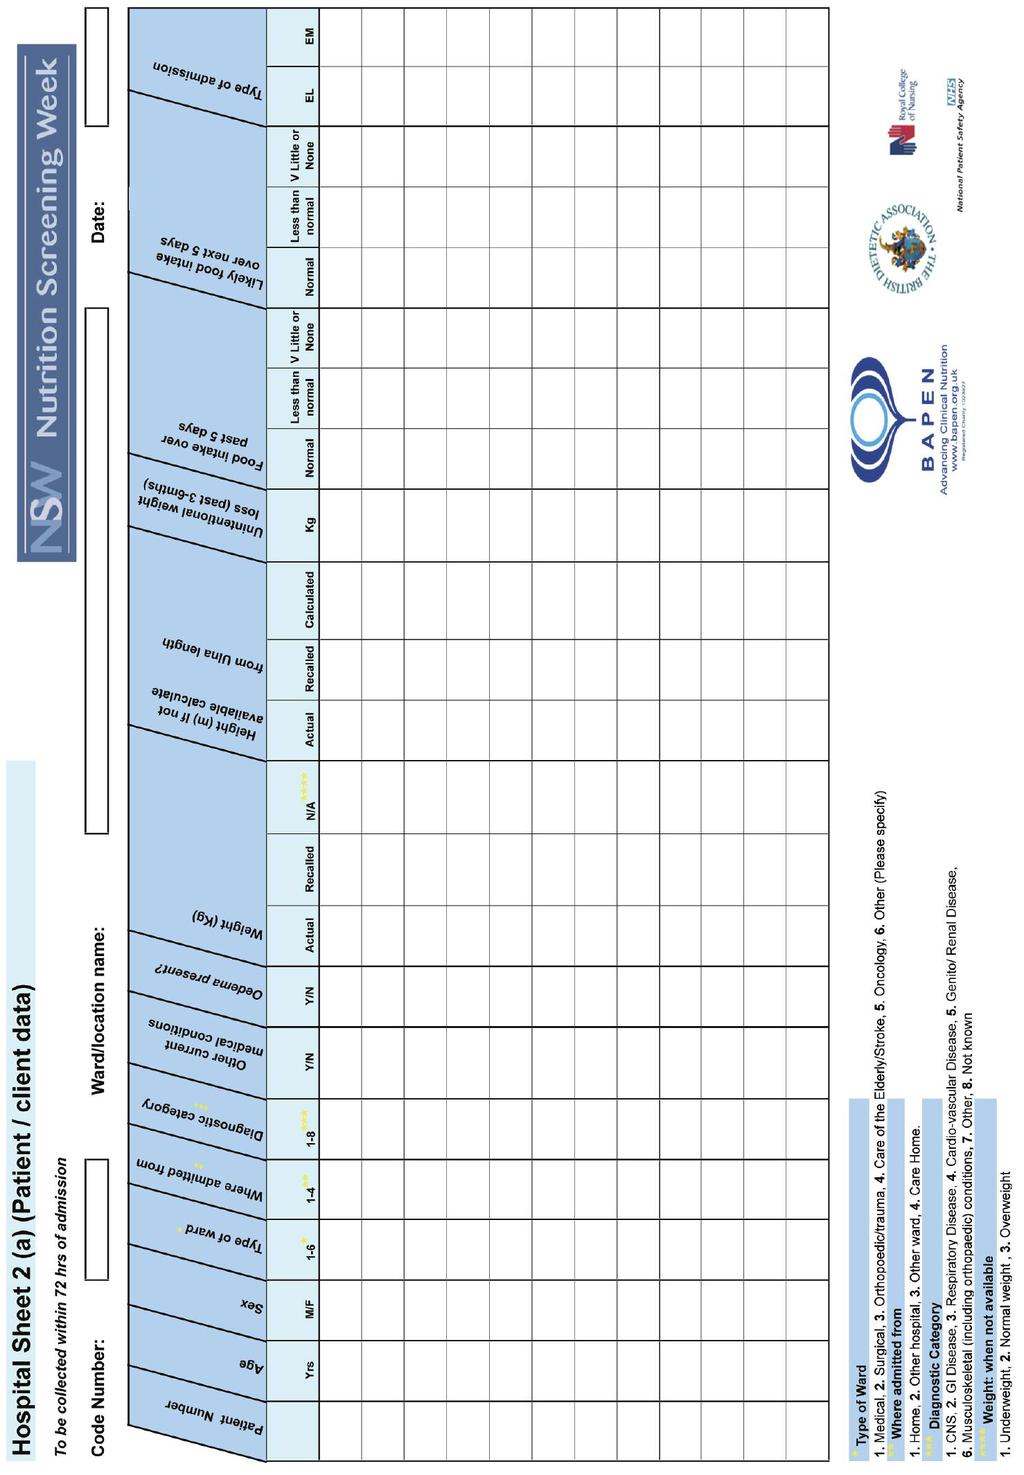
32 Guidance Notes: Hospitals Thank you for participating in the Nutrition Screening Week.The aim of the survey is to establish the prevalence of the risk of malnutrition in patients and clients admitted to hospitals and care homes in the UK. The results will be presented at the BAPEN Conference in Harrogate in November Additionally we will analyse and send you the results of your data to enable you to report the scale of the problem in your locality and to compare your data with the national picture. Participating in the Nutrition Screening Week will help demonstrate how you are striving to achieve nutritional standards and your commitment to meeting the nutritional needs of your patients or clients. The survey is based on 2 questionnaires, a general questionnaire about your hospital and practice of nutritional screening (Sheet 1(a)) and a patient /client data collection sheet (Sheet 2 (a)). Please read the following guidance notes carefully before completing the forms. Sheet 1(a): Please answer on behalf of your hospital within your Trust. Please provide the information for the hospital as a whole not a particular area / unit within it. If you wish to include more than 1 hospital within your Trust, please use a separate set of documentation for each hospital. You will be issued with a code number for each hospital, please write it in the space on the form. If you don t know the answer to any question, please put an x in the box with a question mark beside it. Sheet 2(a) Patient / Client data: Please collect the required information on all patients admitted to medical, surgical, orthopaedic/ trauma, care of the elderly, stroke and oncology wards in your hospital between hrs on 25th September and hrs on 27th September.The data should be collected within 72 hours of the patient s admission. If you would like to collect data on patients admitted to other wards, you may do so, but please specify what type of ward it is in the space at the top of the sheet. If patients were screened on admission and the information required is already available and documented in the patients notes, then this can be directly entered onto the record sheets. If not, please obtain and record the information within 72 hours of the patient s admission. Patients admitted to these wards during the screening period who are under 16 years of age or already established on nutritional support ( enteral tube feeding, PEG feeding or parenteral nutrition) are excluded from the study and therefore should not have data recorded. Please add any such patients to the form, but simply insert across the row next to their number what method of feeding they are on, e.g. 002 = [excluded PEG feeding] Code number: Please write the same code number inserted on Sheet 1(a) onto each copy of Sheet 2(a) that you use. Ward/location: Please write the name or number of the ward in the space at the top of Sheet 2(a) using separate sheets for each ward included in the survey. Patient Number: Please number patients admitted to each ward 1, 2, 3 etc. Age: Please give the age of the patient in years.there is no need to include number of months as well. 29
33 Type of ward: Please insert appropriate number (see key at the bottom of Sheet 2(a). Where admitted from: Again, please insert appropriate number. Diagnostic category: Please insert appropriate number. Use a working diagnosis if diagnosis is unconfirmed. If the primary diagnosis is an infection or cancer, please use the category number relating to the location of the infection/cancer, for example cancer of the colon should be recorded under diagnostic category 2 (GI disease); pneumonia or chest infection under category 3 (respiratory disease), a urinary tract infection (UTI) under category 5 (genito/renal disease). Diagnostic category: Please insert appropriate number. Use a working diagnosis if diagnosis is unconfirmed. If the primary diagnosis is an infection or cancer, please use the category number relating to the location of the infection/cancer, for example cancer of the colon should be recorded under diagnostic category 2 (GI disease); pneumonia or chest infection under category 3 (respiratory disease), a urinary tract infection (UTI) under category 5 (genito/renal disease). Other medical conditions: Please indicate whether the patient has other relevant medical conditions or problems. A yes or no answer only is sufficient no specific category information is required here. Oedema Present?: Please indicate whether the patient was or was not oedematous on admission. A yes or no answer only is sufficient. Weight: Please state weight in Kg in appropriate column indicating if weight was an actual measurement or a weight recalled by the patient or carer. If weight of patient is not available, please assess weight status subjectively, i.e. does the patient look underweight, normal weight or overweight. Height: Please state height in metres in appropriate column indicating if height was an actual measurement, a height recalled by the patient or carer or a value calculated from length of the ulna (see information on measurement of ulna and conversion table). Recent unintentional weight loss: Please give amount of any weight lost unintentionally in the last 3-6mths.Please do not include any weight lost following use of diuretics. Please give value in Kg (1Kg =2.2lbs). If recent weights are not available in the patient s notes please ask the patient / carer if they know how much weight the patient has recently lost. If patient /carer does not know how much weight has been lost, insert DK (Don t know). Food intake, past and future: Please tick the relevant boxes. Please use your professional judgement as to the likely food intake over the next 5 days.there is no need to record food intake. Type of admission to hospital: Please tick if admission was elective (EL) or an emergency (EM). 30
34 NSW Nutrition Screening Week Appendix II Care Homes Sheet 1(b) for Care Homes Care Home Name. Information about your Care Home Code Number Please complete by putting an X in the appropriate boxes. Please use black ink. 1. What type of Care Home? (please tick all that apply) Nursing EMI Disabled Residential 2. How many beds? Please state number 3. Do you have access to a Nutrition and Dietetic service? Yes No? 4. Is it your policy to weigh residents on admission? Yes No? 5a. Are residents weighed regularly during their stay? Yes No? 5b. If you have answered Yes to 5a, please indicate how often: Monthly As required Other, please state 6. Is the height of residents recorded on admission? Yes No? 7. Do you have a Nutrition Screening Policy? Yes No? 8a. Do you know what % of residents are screened on admission? Yes No? 8b. If you have answered Yes to 8a, please indicate that %: Up to 25% 26-50% 51-75% % 9. Is the practice of nutrition screening audited? Yes No? Thank you Nutrition Screening Week is an initiative of BAPEN in collaboration with the British Dietetic Association and the Royal College of Nursing, supported by the National Patient Safety Agency. 31
35 32
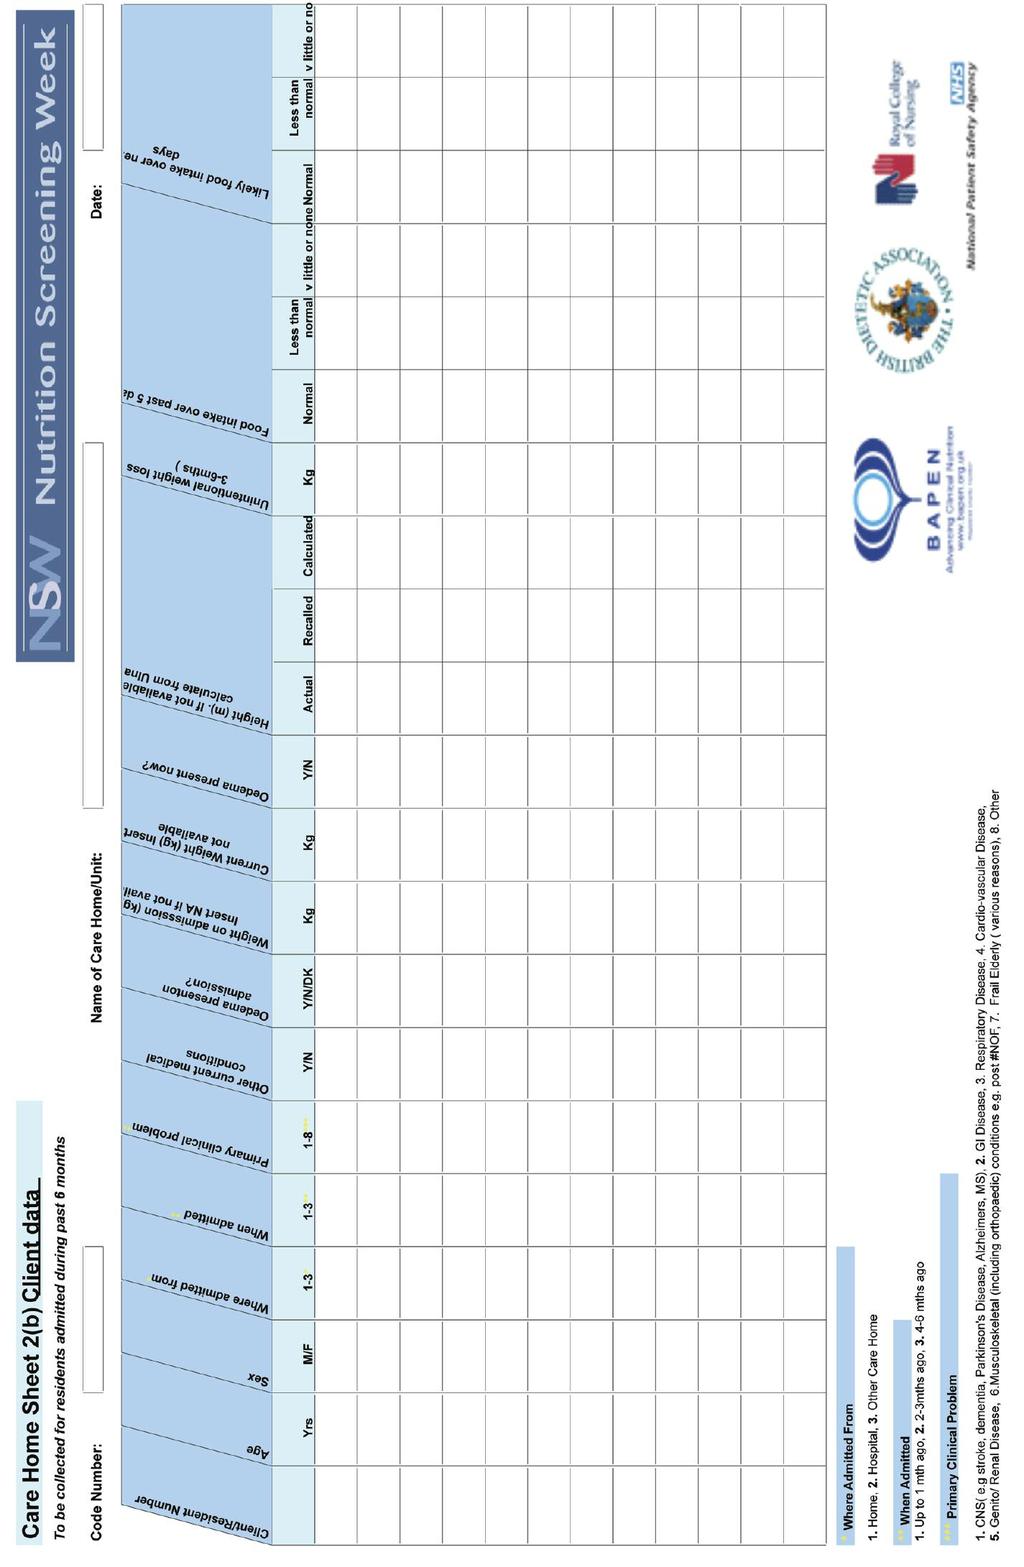
36 Guidance Notes: Care Homes Thank you for participating in the Nutrition Screening Week.The aim of the survey is to establish the prevalence of the risk of malnutrition in patients and clients admitted to hospitals and care homes in the UK.The results will be presented at the BAPEN Conference in Harrogate in November Additionally we will analyse and send you the results of your data to enable you to report the scale of the problem in your locality and to compare your data with the national picture. Participating in the Nutrition Screening Week will help demonstrate how you are striving to achieve nutritional standards and your commitment to meeting the nutritional needs of your residents. The survey is based on 2 questionnaires, a general questionnaire about your Care Home and practice of nutritional screening (Sheet 1(b)) and a client data collection sheet (Sheet 2 (b)). Please read the following guidance notes carefully before completing the forms. Sheet 1(b): You will be issued with a code number for the Home, please write it in the space on the form. If you don t know the answer to any question, please put an X in the box with a question mark beside it. Sheet 2(b) Resident / Client data: Please collect the information requested for all residents / clients who were admitted to your Care Home in the past 6 months. Patients who were already established on nutritional support (enteral tube feeding, PEG feeding or parenteral nutrition) when admitted are excluded from the study and therefore should not have data recorded. Please add any such patients to the form, but simply insert across the row next to their number what method of feeding they are on, e.g. 002 = [excluded PEG feeding] Code number: Please write the same code number inserted on Sheet 1(b) onto each copy of Sheet 2(b) that you use. Name of Care Home: Please write the name of your Care Home and /or unit in the space at the top of each Sheet 2(b) that you use. Resident Number: Please number residents simply as 1, 2, 3 in the order in which their data is recorded. Age: Please give age of the resident in years.there is no need to include number of months as well. Primary Clinical Problem: Please insert appropriate number, only one number is required. If the primary diagnosis is an infection or cancer, please use the category number relating to the location of the infection/cancer, for example cancer of the colon should be recorded under diagnostic category 2 (GI disease); pneumonia or chest infection under category 3 (respiratory disease), a UTI) under category 5 (genito/renal disease) Other Medical Conditions: Please indicate whether the resident has other relevant medical conditions or problems. A yes or no answer only is sufficient no specific category information is required here. 33
37 Oedema Present?: Please indicate whether the patient was oedematous on admission. A yes or no answer is sufficient. If you do not know insert DK (Don t Know). Please also indicate if resident is oedematous now. A yes or no answer is sufficient. Weight: Please state weight (in Kg) of resident on admission using documented value in resident s notes. If weight on admission was not recorded, write NA (Not Available). Please state current weight (in kg) of resident in appropriate column.write NA (Not Available) in box if for any reason it is not possible to weigh the resident. Height: Please state height in metres in appropriate column indicating if height is an actual measurement, a height recalled by the resident or carer or a value calculated from length of the ulna (see information on measurement of ulna and conversion table). Recent unintentional weight loss: Please give amount of any weight lost unintentionally in the last 3-6mths. Do not include any weight lost due to use of diuretics. Please give value in kg (1kg =2.2lbs). If recent weights are not available in the resident s notes please ask the resident / carer if they know how much weight the resident has recently lost. If resident /carer does not know how much weight has been lost, insert DK (Don t know). Food intake, past and future: Please tick the relevant boxes. Please use your professional judgement as to the likely food intake over the next 5 days.there is no need to record food intake. 34

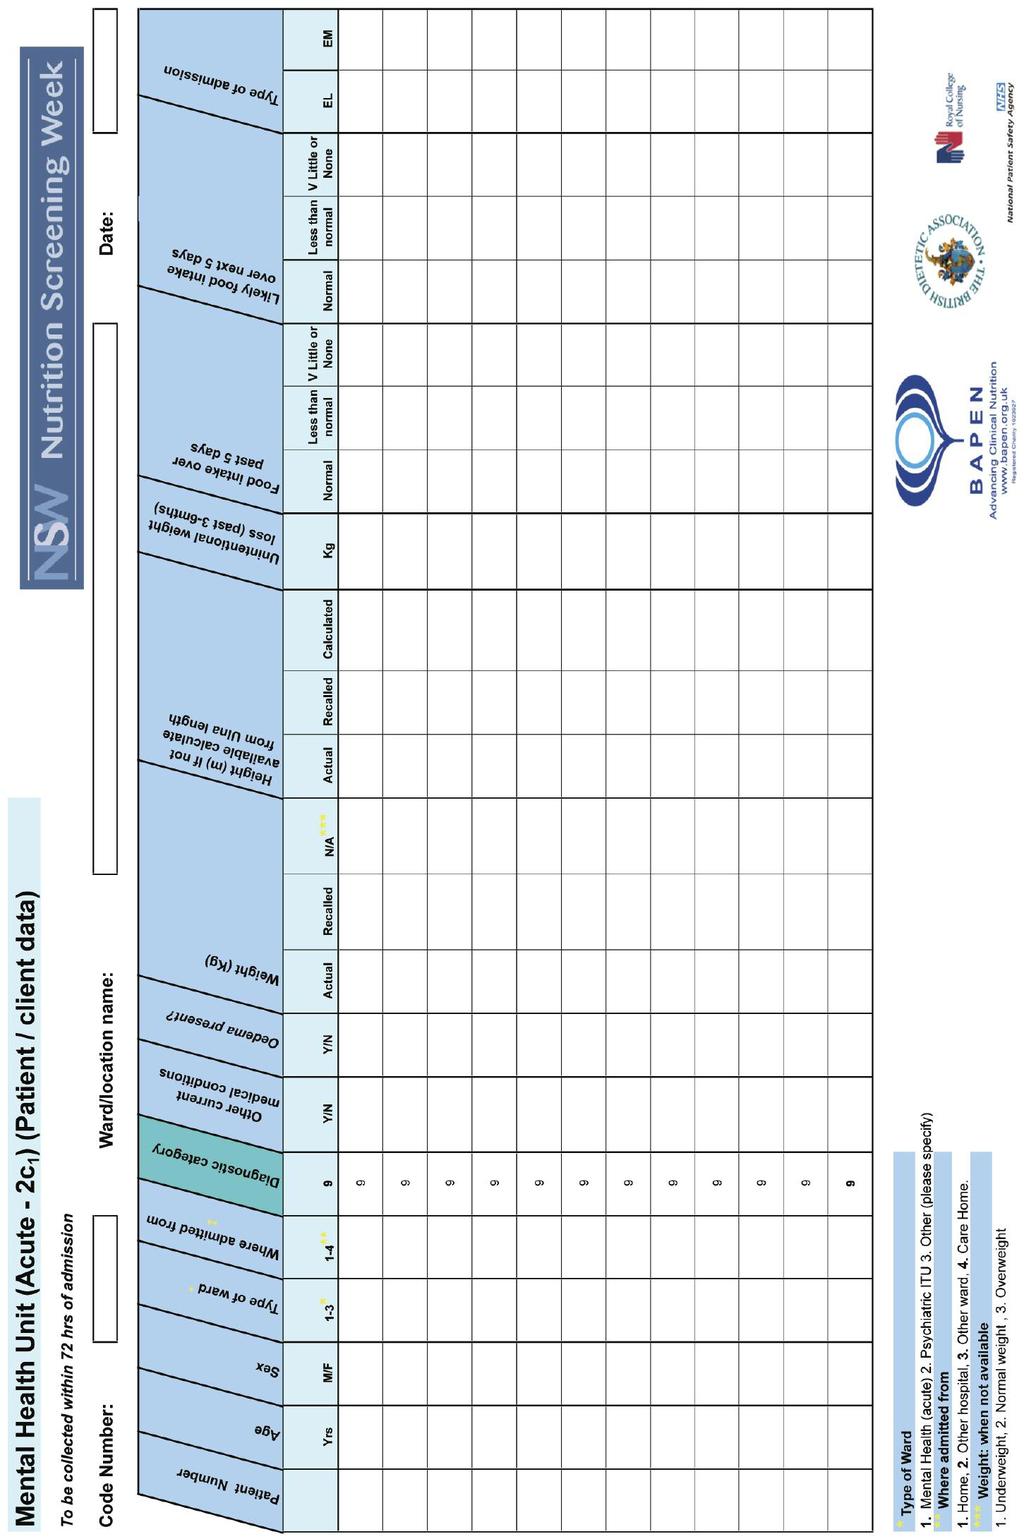
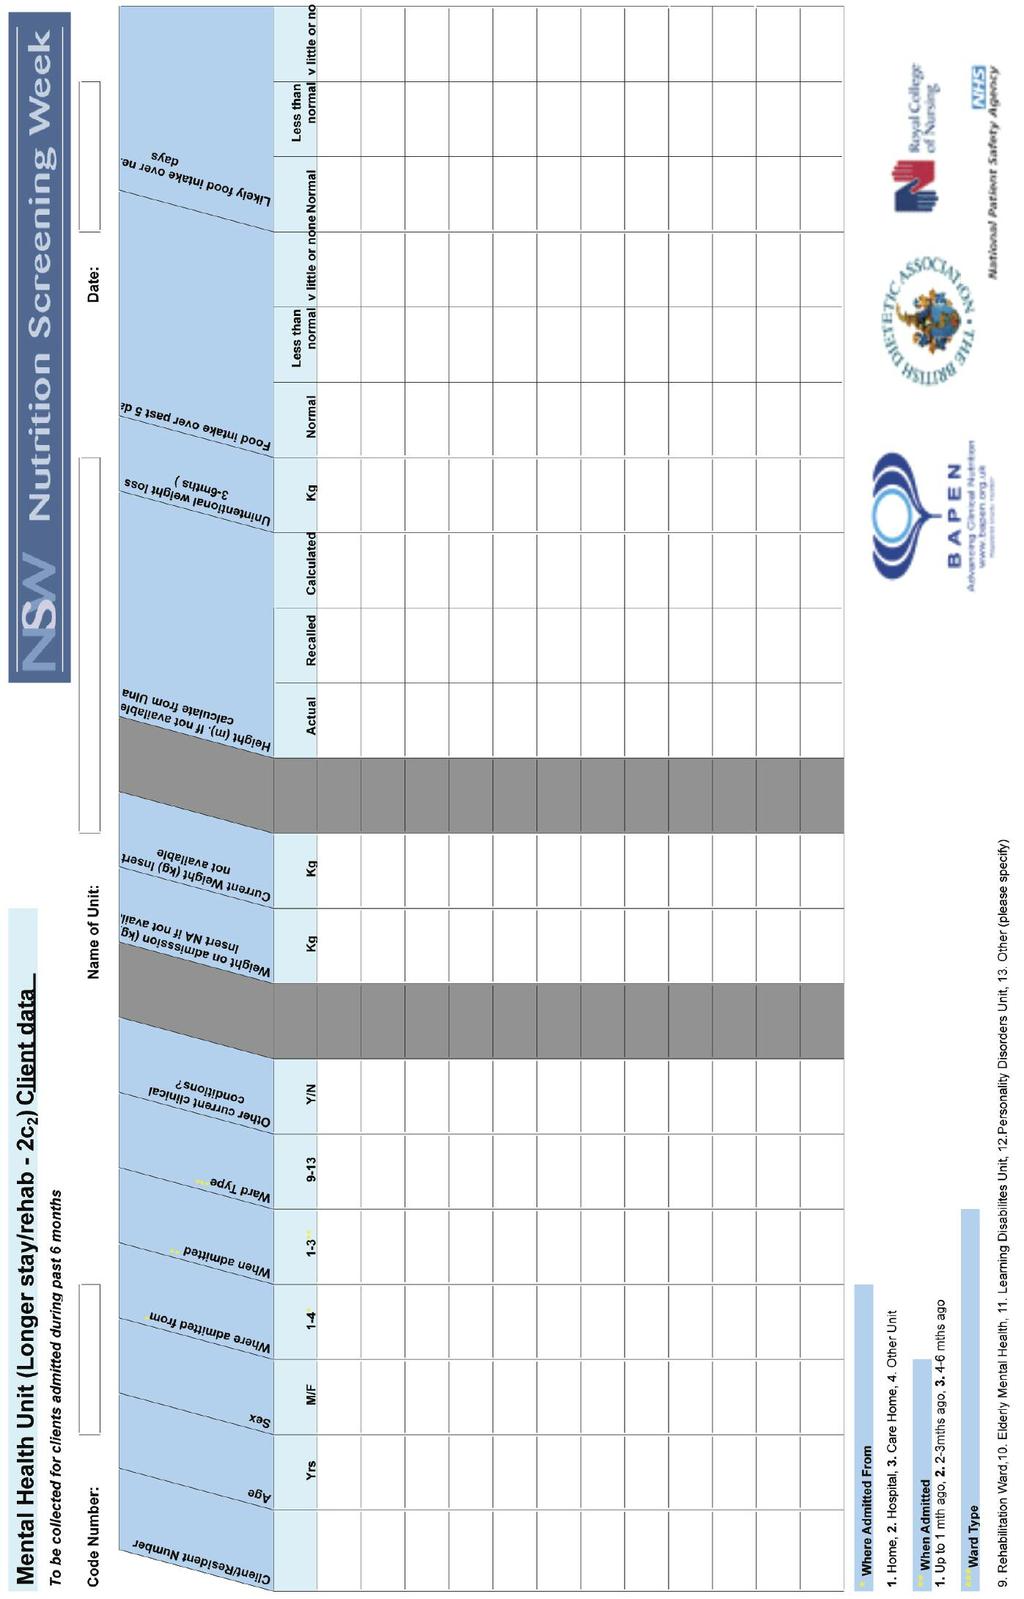
38 NSW Nutrition Screening Week Appendix III Mental Health Units Sheet 1(c) for Mental Health Units Unit Name. Information about your Mental Health Unit Code Number Please complete by putting an X in the appropriate boxes. Please use black ink. 1a. What type of hospital? Teaching Non Teaching 1b. Acute Mental Health Long stay/rehab unit 2. How many beds? Please state number 3. Do you have access to a Nutrition and Dietetic service? Yes No? 4. Do you have access to a Nutrition Support team? Yes No? 5. Does your unit / Trust have a Nutrition policy? Yes No? 6. Does your unit / Trust have a Nutrition Screening policy? Yes No? 7a. Do you know what % patients are screened on admission? Yes No? 7b. If you have answered Yes to 7a please indicate % of patients screened on admission: Up to 25% 26-50% 51-75% % 8. Is it your policy to weigh patients on admission? Yes No? 9a. Is it your policy to weigh patients on admission? Yes No? 9b. If you have answered Yes to 9a, please indicate how often: Monthly As required Other, please state 10. Is the height of patients recorded on admission? Yes No? 11. Is the practice of nutrition screening audited? Yes No? Thank you Nutrition Screening Week is an initiative of BAPEN in collaboration with the British Dietetic Association and the Royal College of Nursing, supported by the National Patient Safety Agency. 35
39 36
40 37
NUTRITION SCREENING SURVEY IN THE UK AND REPUBLIC OF IRELAND IN 2010 A Report by the British Association for Parenteral and Enteral Nutrition (BAPEN)
") NUTRITION SCREENING SURVEY IN THE UK AND REPUBLIC OF IRELAND IN 2010 A Report by the British Association for Parenteral and Enteral Nutrition (BAPEN) HOSPITALS, CARE HOMES AND MENTAL HEALTH UNITS NUTRITION
NUTRITION SCREENING SURVEY IN THE UK AND REPUBLIC OF IRELAND IN 2010 A Report by the British Association for Parenteral and Enteral Nutrition (BAPEN) HOSPITALS, CARE HOMES AND MENTAL HEALTH UNITS NUTRITION
NUTRITION SCREENING SURVEYS IN HOSPITALS IN NORTHERN IRELAND,
 NUTRITION SCREENING SURVEYS IN HOSPITALS IN NORTHERN IRELAND, 2007-2011 A report based on the amalgamated data from the four Nutrition Screening Week surveys undertaken by BAPEN in 2007, 2008, 2010 and
Nutritional Care Tool Report 2017
 Nutritional Care Tool Report 2017 A Report by the BAPEN Quality and Safety Committee Dr Ailsa Brotherton, Kate Cheema, Anne Holdoway, Vera Todorovic and Professor Mike Stroud On behalf of the Quality and
National Update on Malnutrition
 National Update on Malnutrition Dr Trevor Smith Consultant Gastroenterologist University Hospital Southampton BAPEN Executive Officer Chair, British Artificial Nutrition Survey British Association for
Mind the Hunger Gap Case Studies
 Mind the Hunger Gap Case Studies Team Alpha Queen Elizabeth Hospital, London As part of London s Queen Elizabeth Hospital s long-standing battle against malnutrition in the acute setting, they put together
Scottish Hospital Standardised Mortality Ratio (HSMR)
") ` 2016 Scottish Hospital Standardised Mortality Ratio (HSMR) Methodology & Specification Document Page 1 of 14 Document Control Version 0.1 Date Issued July 2016 Author(s) Quality Indicators Team Comments
` 2016 Scottish Hospital Standardised Mortality Ratio (HSMR) Methodology & Specification Document Page 1 of 14 Document Control Version 0.1 Date Issued July 2016 Author(s) Quality Indicators Team Comments
National Health Promotion in Hospitals Audit
 National Health Promotion in Hospitals Audit Acute & Specialist Trusts Final Report 2012 www.nhphaudit.org This report was compiled and written by: Mr Steven Knuckey, NHPHA Lead Ms Katherine Lewis, NHPHA
MALNUTRITION UNIVERSAL SCREEING TOOL (MUST) MUST IS A MUST FOR ALL PATIENTS
 MUST IS A MUST FOR ALL PATIENTS") MALNUTRITION UNIVERSAL SCREEING TOOL (MUST) MUST IS A MUST FOR ALL PATIENTS Eimear Digan Senior Dietitian, Tallaght Hospital Groups at Risk of Pressure Ulcers Critically ill. Neurologically compromised
MALNUTRITION UNIVERSAL SCREEING TOOL (MUST) MUST IS A MUST FOR ALL PATIENTS Eimear Digan Senior Dietitian, Tallaght Hospital Groups at Risk of Pressure Ulcers Critically ill. Neurologically compromised
Malnutrition Matters. Meeting Quality Standards in Nutritional Care
 A Toolkit for Commissioners and Providers in England Malnutrition Matters Meeting Quality Standards in Nutritional Care Ailsa Brotherton, Nicola Simmonds and Mike Stroud on behalf of the BAPEN Quality
Patient survey report Survey of adult inpatients in the NHS 2010 Yeovil District Hospital NHS Foundation Trust
 Patient survey report 2010 Survey of adult inpatients in the NHS 2010 The national survey of adult inpatients in the NHS 2010 was designed, developed and co-ordinated by the Co-ordination Centre for the
Guideline scope Intermediate care - including reablement
 NATIONAL INSTITUTE FOR HEALTH AND CARE EXCELLENCE Guideline scope Intermediate care - including reablement Topic The Department of Health in England has asked NICE to produce a guideline on intermediate
Nursing our future An RCN study into the challenges facing today s nursing students in Wales
 Nursing our future An RCN study into the challenges facing today s nursing students in Wales Royal College of Nursing November 2008 Publication code 003 309 Published by the Royal College of Nursing, 20
Symposium 2: The skeleton in the closet: malnutrition in the community Malnutrition in the UK: policies to address the problem
 (2010), 69, 470 476 doi:10.1017/s0029665110001746 g The Authors 2010 First published online 16 June 2010 The Annual Meeting of the Nutrition Society and BAPEN was held at Cardiff International Arena, Cardiff
The information needs of nurses Summary report of an RCN survey
 The information needs of nurses Summary report of an RCN survey The information needs of nurses: Summary report of an RCN survey Published by the Royal College of Nursing, 20 Cavendish Square, London,W1G
Section 2: Advanced level nursing practice competencies
 Advanced Level Nursing Practice Section 2: Advanced level nursing practice competencies RCN Standards for advanced level nursing practice, advanced nurse practitioners, RCN accreditation and RCN credentialing
Patient survey report Survey of adult inpatients in the NHS 2009 Airedale NHS Trust
 Patient survey report 2009 Survey of adult inpatients in the NHS 2009 The national survey of adult inpatients in the NHS 2009 was designed, developed and co-ordinated by the Acute Surveys Co-ordination
Evidence on the quality of medical note keeping: Guidance for use at appraisal and revalidation
 Health Informatics Unit Evidence on the quality of medical note keeping: Guidance for use at appraisal and revalidation April 2011 Funded by: Acknowledgements This project was funded by the Academy of
UK Renal Registry 20th Annual Report: Appendix A The UK Renal Registry Statement of Purpose
 Nephron 2018;139(suppl1):287 292 DOI: 10.1159/000490970 Published online: July 11, 2018 UK Renal Registry 20th Annual Report: Appendix A The UK Renal Registry Statement of Purpose 1. Executive summary
General practitioner workload with 2,000
 The Ulster Medical Journal, Volume 55, No. 1, pp. 33-40, April 1986. General practitioner workload with 2,000 patients K A Mills, P M Reilly Accepted 11 February 1986. SUMMARY This study was designed to
Fleet and Marine Corps Health Risk Assessment, 02 January December 31, 2015
 Fleet and Marine Corps Health Risk Assessment, 02 January December 31, 2015 Executive Summary The Fleet and Marine Corps Health Risk Appraisal is a 22-question anonymous self-assessment of the most common
NHS DUMFRIES AND GALLOWAY ANNUAL REVIEW 2015/16 SELF ASSESSMENT
 NHS DUMFRIES AND GALLOWAY ANNUAL REVIEW 2015/16 SELF ASSESSMENT Chapter 1 Introduction This self assessment sets out the performance of NHS Dumfries and Galloway for the year April 2015 to March 2016.
Dietician Band 5 - Salary Range 21,388-27,901 per annum Full Time 37.5 hours per week Relocation assistance up to 8000 available
 Dietician Band 5 - Salary Range 21,388-27,901 per annum Full Time 37.5 hours per week Relocation assistance up to 8000 available This new role provides a superb opportunity for a qualified dietitian to
MQii Malnutrition Knowledge and Awareness Test
 MQii Malnutrition Knowledge and Awareness Test This test intends to assess hospital staff members knowledge of the impact of malnutrition and importance of optimal malnutrition care practices, specifically
Practice nurses in 2009
 Practice nurses in 2009 Results from the RCN annual employment surveys 2009 and 2003 Jane Ball Geoff Pike Employment Research Ltd Acknowledgements This report was commissioned by the Royal College of Nursing
Intensive Psychiatric Care Units
 NHS Highland Argyll & Bute Hospital, Lochgilphead Intensive Psychiatric Care Units Service Profile Exercise ~ November 2009 NHS Quality Improvement Scotland (NHS QIS) is committed to equality and diversity.
Patient survey report Survey of adult inpatients 2011 The Royal Bournemouth and Christchurch Hospitals NHS Foundation Trust
 Patient survey report 2011 Survey of adult inpatients 2011 The Royal Bournemouth and Christchurch Hospitals NHS Foundation Trust The national survey of adult inpatients in the NHS 2011 was designed, developed
Patient survey report Outpatient Department Survey 2011 County Durham and Darlington NHS Foundation Trust
 Patient survey report 2011 Outpatient Department Survey 2011 County Durham and Darlington NHS Foundation Trust The national survey of outpatients in the NHS 2011 was designed, developed and co-ordinated
NHS Grampian. Intensive Psychiatric Care Units
 NHS Grampian Intensive Psychiatric Care Units Service Profile Exercise ~ November 2009 NHS Quality Improvement Scotland (NHS QIS) is committed to equality and diversity. We have assessed the performance
Malnutrition Quality Improvement Opportunities for the District Hospital Leadership Forum. May 2015 avalere.com
 Malnutrition Quality Improvement Opportunities for the District Hospital Leadership Forum May 2015 avalere.com Malnutrition Has a Significant Impact on Patient Outcomes MALNUTRITION IS ASSOCIATED WITH
Patient survey report Inpatient survey 2008 Royal Devon and Exeter NHS Foundation Trust
 Patient survey report 2008 Inpatient survey 2008 Royal Devon and Exeter NHS Foundation Trust The national Inpatient survey 2008 was designed, developed and co-ordinated by the Acute Surveys Co-ordination
London CCG Neurology Profile
 CCG Neurology Profile November 214 Summary NHS Hammersmith And Fulham CCG Difference from Details Comments Admissions Neurology admissions per 1, 2,13 1,94 227 p.1 Emergency admissions per 1, 1,661 1,258
Physiotherapy outpatient services survey 2012
 14 Bedford Row, London WC1R 4ED Tel +44 (0)20 7306 6666 Web www.csp.org.uk Physiotherapy outpatient services survey 2012 reference PD103 issuing function Practice and Development date of issue March 2013
Intensive Psychiatric Care Units
 NHS Lothian St John s Hospital, Livingston Intensive Psychiatric Care Units Service Profile Exercise ~ November 2009 NHS Quality Improvement Scotland (NHS QIS) is committed to equality and diversity. We
Supplementary Online Content
 Supplementary Online Content Kaukonen KM, Bailey M, Suzuki S, Pilcher D, Bellomo R. Mortality related to severe sepsis and septic shock among critically ill patients in Australia and New Zealand, 2000-2012.
National Survey of Patient Activity Data for Specialist Palliative Care Services MDS Full Report for the year
 National Survey of Patient Activity Data for Specialist Palliative Care Services MDS Full Report for the year 2010-2011 About the National Council for Palliative Care The National Council for Palliative
Independent Sector Nurses in 2007
 Independent Sector Nurses in 2007 Results by sector from the RCN Annual Employment Survey 2007 Jane Ball Geoff Pike RCN Publication code 003 220 Acknowledgements This report was commissioned by the Royal
Acutely ill patients in hospital
 Issue date: July 2007 Acutely ill patients in hospital Recognition of and response to acute illness in adults in hospital Developed by the Centre for Clinical Practice at NICE Contents Key priorities for
UK Renal Registry 13th Annual Report (December 2010): Appendix A The UK Renal Registry Statement of Purpose
: Appendix A The UK Renal Registry Statement of Purpose") Nephron Clin Pract 2011;119(suppl 2):c275 c279 DOI: 10.1159/000331785 Published online: August 26, 2011 UK Renal Registry 13th Annual Report (December 2010): Appendix A The UK Renal Registry Statement
Nephron Clin Pract 2011;119(suppl 2):c275 c279 DOI: 10.1159/000331785 Published online: August 26, 2011 UK Renal Registry 13th Annual Report (December 2010): Appendix A The UK Renal Registry Statement
Patient survey report Outpatient Department Survey 2009 Airedale NHS Trust
 Patient survey report 2009 Outpatient Department Survey 2009 The national Outpatient Department Survey 2009 was designed, developed and co-ordinated by the Acute Surveys Co-ordination Centre for the NHS
National Audit of Dementia Audit of Casenotes
 National Audit of Dementia Audit of Casenotes Fourth round of audit Background This audit tool asks about assessments, discharge planning and aspects of care received by people with dementia during their
Registrant Survey 2013 initial analysis
 Registrant Survey 2013 initial analysis April 2014 Registrant Survey 2013 initial analysis Background and introduction In autumn 2013 the GPhC commissioned NatCen Social Research to carry out a survey
Patient-Led Assessments of the Care Environment (PLACE): England , Experimental Statistics
: England , Experimental Statistics") Patient-Led Assessments of the Care Environment (PLACE): England - 2013, Experimental Statistics Published September 2013 We are the trusted source of authoritative data and information relating to health
Patient-Led Assessments of the Care Environment (PLACE): England - 2013, Experimental Statistics Published September 2013 We are the trusted source of authoritative data and information relating to health
NHS Ayrshire and Arran. 1. Which of the following performance frameworks has the most influence on your budget decisions:
 A: Budget setting process Performance budgeting 1. Which of the following performance frameworks has the most influence on your budget decisions: National Performance Framework Quality Measurement Framework
Enhancing nutritional care
 Enhancing nutritional care Supported by Enhancing nutritional care The RCN launched Nutrition Now in 2007 to help raise standards of nutrition and hydration in hospitals and the community and raise awareness
National Audit of Dementia Audit of Casenotes
 National Audit of Dementia Audit of Casenotes Third round of audit Background This audit tool asks about assessments, discharge planning and aspects of care received by people with dementia during their
How the GP can support a person with dementia
 alzheimers.org.uk How the GP can support a person with dementia It is important that people with dementia have regular checkups with their GP and see them as soon as possible if they develop any health
Agenda Item: REPORT TO PUBLIC BOARD MEETING 31 May 2012
 Agenda Item: 5.1.1 REPORT TO PUBLIC BOARD MEETING 31 May 2012 Title Lead Director Author(s) Purpose Previously considered by Ratification of the Strategy for the Care of Older People Siobhan Jordan, Director
Clinical Skills Course. Workbook to accompany on line learning programme
 Clinical Skills Course Workbook to accompany on line learning programme The National GSF Centre for End of Life Care Clinical Skills Programme February 2015 www.goldstandardsframework.org.uk Prof Keri
NICE guideline Published: 22 September 2017 nice.org.uk/guidance/ng74
 Intermediate care including reablement NICE guideline Published: 22 September 2017 nice.org.uk/guidance/ng74 NICE 2017. All rights reserved. Subject to Notice of rights (https://www.nice.org.uk/terms-and-conditions#notice-ofrights).
Spotlight on... Caring and nutrition
 Spotlight on... Caring and nutrition Spotlight series Spotlight on... Caring and nutrition Summary Nutrition is an important but often hidden issue for carers and their families, with 60% of carers worrying
NHS Borders. Intensive Psychiatric Care Units
 NHS Borders Intensive Psychiatric Care Units Service Profile Exercise ~ November 2009 NHS Quality Improvement Scotland (NHS QIS) is committed to equality and diversity. We have assessed the performance
MALNUTRITION IN OLDER PEOPLE
 MALNUTRITION IN OLDER PEOPLE Introduction Marinos Elia NICE guidelines Typically for specific diseases e.g. specific drugs for specific diseases (malnutrition broad range of conditions) Clinical perspective
Announced Inspection Report care for older people in acute hospitals
 Announced Inspection Report care for older people in acute hospitals Hairmyres Hospital NHS Lanarkshire Healthcare Improvement Scotland is committed to equality. We have assessed the inspection function
UK GIVING 2012/13. an update. March Registered charity number
 UK GIVING 2012/13 an update March 2014 Registered charity number 268369 Contents UK Giving 2012/13 an update... 3 Key findings 4 Detailed findings 2012/13 5 Conclusion 9 Looking back 11 Moving forward
Wolverhampton CCG Commissioning Intentions
 Wolverhampton CCG Commissioning Intentions 2015-16 * Areas of particular focus and priority CI Ref Contract Provider Brief CI001 CI002 CI003 Child Protection Information Sharing Implement the new Child
Frequently Asked Questions (FAQ) Updated September 2007
 Updated September 2007") Frequently Asked Questions (FAQ) Updated September 2007 This document answers the most frequently asked questions posed by participating organizations since the first HSMR reports were sent. The questions
Frequently Asked Questions (FAQ) Updated September 2007 This document answers the most frequently asked questions posed by participating organizations since the first HSMR reports were sent. The questions
MND Factsheet 44 Advance Directives
 MND Factsheet 44 Advance Directives Last Updated 27/10/11 Introduction Living wills, advance decisions, advance directives and advanced medical directives are all names which are, or have been, applied
Reducing Infection Risk At All Access Points
 SM 3M Health Care Academy Reducing Infection Risk At All Access Points June 22nd 2016 Corinne SM 3M Health Care Cameron-Watson, Academy RN 3M 2015. All Rights Reserved PORT PROTECTORS IN CLINICAL PRACTICE
Exploring the cost of care at the end of life
 1 Chris Newdick and Judith Smith, November 2010 Exploring the cost of care at the end of life Research report Theo Georghiou and Martin Bardsley September 2014 The quality of care received by people at
Healthcare- Associated Infections in North Carolina
 2018 Healthcare- Associated Infections in North Carolina Reference Document Revised June 2018 NC Surveillance for Healthcare-Associated and Resistant Pathogens Patient Safety Program NC Department of Health
EPSRC Care Life Cycle, Social Sciences, University of Southampton, SO17 1BJ, UK b
 Characteristics of and living arrangements amongst informal carers in England and Wales at the 2011 and 2001 Censuses: stability, change and transition James Robards a*, Maria Evandrou abc, Jane Falkingham
Explanatory Memorandum to the Mental Health (Secondary Mental Health Services) (Wales) Order 2012
 (Wales) Order 2012") Explanatory Memorandum to the Mental Health (Secondary Mental Health Services) (Wales) Order 2012 This Explanatory Memorandum has been prepared by the Department for Health, Social Services and Children
Explanatory Memorandum to the Mental Health (Secondary Mental Health Services) (Wales) Order 2012 This Explanatory Memorandum has been prepared by the Department for Health, Social Services and Children
THE USE OF MITTS (HAND CONTROL MITTENS) IN ADULT PATIENTS POLICY
 IN ADULT PATIENTS POLICY") THE USE OF MITTS (HAND CONTROL MITTENS) IN ADULT PATIENTS POLICY Policy Number: 171 Supercedes: Standards For Healthcare Services No/s 7, 10, 11, 14 and 16 Version No: Date Of Review: Reviewer Name: Completed
THE USE OF MITTS (HAND CONTROL MITTENS) IN ADULT PATIENTS POLICY Policy Number: 171 Supercedes: Standards For Healthcare Services No/s 7, 10, 11, 14 and 16 Version No: Date Of Review: Reviewer Name: Completed
Patient survey report Survey of people who use community mental health services 2011 Pennine Care NHS Foundation Trust
 Patient survey report 2011 Survey of people who use community mental health services 2011 The national Survey of people who use community mental health services 2011 was designed, developed and co-ordinated
The Newcastle upon Tyne Hospitals NHS Foundation Trust. Protected Mealtime Policy
 The Newcastle upon Tyne Hospitals NHS Foundation Trust Protected Mealtime Policy Version No 3 Effective From 12 February 2018 Expiry date 12 February 2021 Date Ratified 01 November 2017 Ratified By Nutritional
Evaluation of the Threshold Assessment Grid as a means of improving access from primary care to mental health services
 Evaluation of the Threshold Assessment Grid as a means of improving access from primary care to mental health services Report for the National Co-ordinating Centre for NHS Service Delivery and Organisation
#NeuroDis
 Each and Every Need A review of the quality of care provided to patients aged 0-25 years old with chronic neurodisability, using the cerebral palsies as examples of chronic neurodisabling conditions Recommendations
My Discharge a proactive case management for discharging patients with dementia
 Shine 2013 final report Project title My Discharge a proactive case management for discharging patients with dementia Organisation name Royal Free London NHS foundation rust Project completion: March 2014
APPENDIX 1 An Appetite to Improve
 APPENDIX 1 An Appetite to Improve A Delivery Plan for Food and Fluid 2017 to 2020 Contents Foreword 3 Introduction 4 Strategic Aims/ Objectives 6 Strategic Context 7 Strategic Drivers 8 Primary and Secondary
Consultation on proposals to introduce independent prescribing by paramedics across the United Kingdom
 Patient and public summary for: Consultation on proposals to introduce independent prescribing by paramedics across the United Kingdom The full consultation document is available on the NHS England consultation
Patients Experience of Emergency Admission and Discharge Seven Days a Week
 Patients Experience of Emergency Admission and Discharge Seven Days a Week Abstract Purpose: Data from the 2014 Adult Inpatients Survey of acute trusts in England was analysed to review the consistency
3. Q: What are the care programmes and diagnostic groups used in the new Formula?
 Frequently Asked Questions This document provides background information on the basic principles applied to Resource Allocation in Scotland plus additional detail on the methodology adopted for the new
Agenda for the next Government
 Agenda for the next Government General election 2017 The Richmond Group of Charities We are the Richmond Group of Charities and we help people of all ages who have serious long term physical and mental
Survey of people who use community mental health services Leicestershire Partnership NHS Trust
 Survey of people who use community mental health services 2017 Survey of people who use community mental health services 2017 National NHS patient survey programme Survey of people who use community mental
Patient outcomes of specialist nursing services
 Patient outcomes of specialist nursing services An RCN quality improvement initiative 1 . Contents 1. Introduction 3 2. Method 4 3. Findings 6 4. Next steps 6 Appendix 1: Participant profile 7 Appendix
Higher Education Students and Qualifiers at Scottish Institutions
 Higher Education Students and Qualifiers at Scottish Institutions 2016-17 Issue date: Reference: Summary: FAO: Further information: 20 March 2018 SFC/ST/04/2018 This release contains information on HE
Results of censuses of Independent Hospices & NHS Palliative Care Providers
 Results of censuses of Independent Hospices & NHS Palliative Care Providers 2008 END OF LIFE CARE HELPING THE NATION SPEND WISELY The National Audit Office scrutinises public spending on behalf of Parliament.
Health and Long-Term Care Use Patterns for Ohio s Dual Eligible Population Experiencing Chronic Disability
 Health and Long-Term Care Use Patterns for Ohio s Dual Eligible Population Experiencing Chronic Disability Shahla A. Mehdizadeh, Ph.D. 1 Robert A. Applebaum, Ph.D. 2 Gregg Warshaw, M.D. 3 Jane K. Straker,
Care Quality Commission (CQC) Technical details patient survey information 2011 Inpatient survey March 2012
 Technical details patient survey information 2011 Inpatient survey March 2012") Care Quality Commission (CQC) Technical details patient survey information 2011 Inpatient survey March 2012 Contents 1. Introduction... 1 2. Selecting data for the reporting... 1 3. The CQC organisation
Care Quality Commission (CQC) Technical details patient survey information 2011 Inpatient survey March 2012 Contents 1. Introduction... 1 2. Selecting data for the reporting... 1 3. The CQC organisation
Paediatric Critical Care and Specialised Surgery in Children Review. Paediatric critical care and ECMO: interim update
 Gateway Reference: 06662 Paediatric Critical Care and Specialised Surgery in Children Review Paediatric critical care and ECMO: interim update June 2017 Contents Executive summary 1. Introduction 2. Context
Begin Implementation. Train Your Team and Take Action
 Begin Implementation Train Your Team and Take Action These materials were developed by the Malnutrition Quality Improvement Initiative (MQii), a project of the Academy of Nutrition and Dietetics, Avalere
MEASURING THE CHANGING ROLE OF OCCUPATIONAL THERAPY SERVICES: A DIARY TOOL
 MEASURING THE CHANGING ROLE OF OCCUPATIONAL THERAPY SERVICES: A DIARY TOOL Jane Hughes Mark Wilberforce David Challis BACKGROUND Occupational therapists are a key component of the social care workforce
NHS. The guideline development process: an overview for stakeholders, the public and the NHS. National Institute for Health and Clinical Excellence
 NHS National Institute for Health and Clinical Excellence Issue date: April 2007 The guideline development process: an overview for stakeholders, the public and the NHS Third edition The guideline development
Allied Health Review Background Paper 19 June 2014
 Allied Health Review Background Paper 19 June 2014 Background Mater Health Services (Mater) is experiencing significant change with the move of publicly funded paediatric services from Mater Children s
community links Intermediate Hostels Evaluating the Social Return on Investment community links hostels
 community links Intermediate Hostels Evaluating the Social Return on Investment community links hostels Community Links Intermediate Hostels: Evaluating the Social Return on Investment About the Hostels
NCLEX PROGRAM REPORTS
 for the period of OCT 2014 - MAR 2015 NCLEX-RN REPORTS US48500300 000001 NRN001 04/30/15 TABLE OF CONTENTS Introduction Using and Interpreting the NCLEX Program Reports Glossary Summary Overview NCLEX-RN
Can we monitor the NHS plan?
 Can we monitor the NHS plan? Alison Macfarlane In The NHS plan, published in July 2000, the government set out a programme of investment and change 'to give the people of Britain a service fit for the
Chan Man Yi, NC (Neonatal Care) Dept. of Paed. & A.M., PMH 16 May 2017
 Dept. of Paed. & A.M., PMH 16 May 2017") The implementation of an integrated observation chart with Newborn Early Warning Signs (NEWS) to facilitate observation of infants at risk of clinical deterioration Chan Man Yi, NC (Neonatal Care) Dept.
The implementation of an integrated observation chart with Newborn Early Warning Signs (NEWS) to facilitate observation of infants at risk of clinical deterioration Chan Man Yi, NC (Neonatal Care) Dept.
SUMMARY REPORT TRUST BOARD IN PUBLIC 3 May 2018 Agenda Number: 9
 SUMMARY REPORT TRUST BOARD IN PUBLIC 3 May 2018 Agenda Number: 9 Title of Report Accountable Officer Author(s) Purpose of Report Recommendation Consultation Undertaken to Date Signed off by Executive Owner
The Prevalence and Impact of Malnutrition in Hospitalized Adults: The Nutrition Care Process
 The Prevalence and Impact of Malnutrition in Hospitalized Adults: The Nutrition Care Process Donald R Duerksen Associate Professor of Medicine University of Manitoba Outline Why are hospitalized patients
O U T C O M E. record-based. measures HOSPITAL RE-ADMISSION RATES: APPROACH TO DIAGNOSIS-BASED MEASURES FULL REPORT
 HOSPITAL RE-ADMISSION RATES: APPROACH TO DIAGNOSIS-BASED MEASURES FULL REPORT record-based O U Michael Goldacre, David Yeates, Susan Flynn and Alastair Mason National Centre for Health Outcomes Development
How NICE clinical guidelines are developed
 Issue date: January 2009 How NICE clinical guidelines are developed: an overview for stakeholders, the public and the NHS Fourth edition : an overview for stakeholders, the public and the NHS Fourth edition
The non-executive director s guide to NHS data Part one: Hospital activity, data sets and performance
 Briefing October 2017 The non-executive director s guide to NHS data Part one: Hospital activity, data sets and performance Key points As a non-executive director, it is important to understand how data
Reducing emergency admissions
 A picture of the National Audit Office logo Report by the Comptroller and Auditor General Department of Health & Social Care NHS England Reducing emergency admissions HC 833 SESSION 2017 2019 2 MARCH 2018
Commissioning for quality and innovation (CQUIN): 2014/15 guidance. February 2014
: 2014/15 guidance. February 2014") Commissioning for quality and innovation (CQUIN): 2014/15 guidance February 2014 1 NHS England INFORMATION READER BOX Directorate Medical Operations Patients and Information Nursing Policy Commissioning
Commissioning for quality and innovation (CQUIN): 2014/15 guidance February 2014 1 NHS England INFORMATION READER BOX Directorate Medical Operations Patients and Information Nursing Policy Commissioning
Safe Staffing in Community Services
 Safe Staffing in Community Services Dr Louise Thomson Laura Dunk Laurie Hare Duke Report presented to Lincolnshire Partnership NHS Foundation Trust October 2014 1. Introduction This report describes a
VJ Periyakoil Productions presents
 VJ Periyakoil Productions presents Oscar thecare Cat: Advance Lessons Learned Planning Joan M. Teno, MD, MS Professor of Community Health Warrant Alpert School of Medicine at Brown University VJ Periyakoil,
SCOTTISH BORDERS HEALTH & SOCIAL CARE INTEGRATED JOINT BOARD UPDATE ON THE DRAFT COMMISSIONING & IMPLEMENTATION PLAN
 Appendix-2016-59 Borders NHS Board SCOTTISH BORDERS HEALTH & SOCIAL CARE INTEGRATED JOINT BOARD UPDATE ON THE DRAFT COMMISSIONING & IMPLEMENTATION PLAN Aim To bring to the Board s attention the Scottish
National clinical audit of inpatient care for adults with ulcerative colitis
 National clinical audit of inpatient care for adults with ulcerative colitis UK inflammatory bowel disease (IBD) audit Executive summary report June 2014 Prepared by the Clinical Effectiveness and Evaluation
abcdefgh THE SCOTTISH OFFICE Department of Health NHS MEL(1996)22 6 March 1996
22 6 March 1996") abcdefgh THE SCOTTISH OFFICE Department of Health ** please note that this circular has been superseded by CEL 6 (2008), dated 7 February 2008 Dear Colleague NHS RESPONSIBILITY FOR CONTINUING HEALTH CARE
abcdefgh THE SCOTTISH OFFICE Department of Health ** please note that this circular has been superseded by CEL 6 (2008), dated 7 February 2008 Dear Colleague NHS RESPONSIBILITY FOR CONTINUING HEALTH CARE