Exploring Disparities in Oregon s Medicaid Patient Health Care Experience: 2007 and 2011
|
|
|
- Lynne Gibson
- 5 years ago
- Views:
Transcription

1 Exploring Disparities in Oregon s Medicaid Patient Health Care Experience: 2007 and June, 2012 Prepared by: MASTER OF PUBLIC ADMINISTRATION CAPSTONE TEAM Michelle Bixler Chelsea Clinton Vidusha Devasthali Paul Hicks FACULTY ADVISOR Professor Jessica Greene Prepared for: OREGON HEALTH AUTHORITY APPLIED CAPSTONE PROJECT MASTER OF PUBLIC ADMINISTRATION
2 Table of Contents Report 1: Summary Overview Introduction Methods Overview Findings Recommendations Works Cited Report 2: Disparities in Patient Experience Between Children with and without Special Health Care Needs Introduction Methods Results Works Cited Report 3: Measuring Racial and Ethnic Disparities in Patient Experience among Oregon Health Plan Recipients between 2007 and 2011 Introduction Methods Results Adults Results Children Conclusion Works Cited Tables Table 1: Disparities in Composites Between CSHCN and Non- CSHCN for 2007 & 2011 Table 2: Disparities in Reporting Measures Between CSHCN and Non- CSHCN for 2007 & 2011 Table 3: Disparities in Global Ratings Between CSHCN and Non- CSHCN for 2007 & 2011 Table 4: Change in Disparities for Adults from 2007 to 2011 Table 5: Disparities in Global Ratings Between Races/Ethnicities for Children from 2007 to 2011 Table 6: Change in Disparities for Children from 2007 to 2011 P. 1 P. 1 P. 1 P. 2 P. 3 P. 4 P. 5 P. 5 P. 5 P. 5 P. 8 P. 9 P. 9 P. 9 P. 9 P. 10 P. 11 P. 11 P. 6 P. 6 P. 7 P. 10 P. 10 P. 11 i
3 Appendix A: Disparities in Composites Between CSHCN and Non- CSHCN for 2007 & 2011 B: Disparities Between Reporting Measures for CSHCN and Non- CSHCN for 2007 & 2011 C: Disparities in Global Ratings Between CSHCN and Non- CSHCN for 2007 & 2011 D: Disparities in Composites Between Races/Ethnicities in Adults for 2007 & 2011 E: Disparities in Global Ratings Between Races/Ethnicities in Adults for 2007 & 2011 F: Disparities in Composites Between Races/Ethnicities in Children for 2007 & 2011 G: Disparities in Reporting Measures Between Races/Ethnicities in Children for 2007 & 2011 H: Disparities in Global Ratings Between Races/Ethnicities in Children for 2007 & 2011 I: Disparities Between Races/Ethnicities for 2007 & 2011: Adult Composites J: Disparities Between All Races/Ethnicities for 2007 & 2011: Adult Global Ratings K: Disparities Between Races/Ethnicities for 2007 & 2011: Child Composites L: Disparities Between Races/Ethnicities for 2007 & 2011: Reporting Measures for Children M: Disparities Between All Races/Ethnicities for 2007 & 2011: Child Global Ratings P. 12 P. 13 P. 14 P. 15 P. 16 P. 17 P. 18 P. 19 P. 20 P. 21 P. 22 P. 23 P. 24 ii
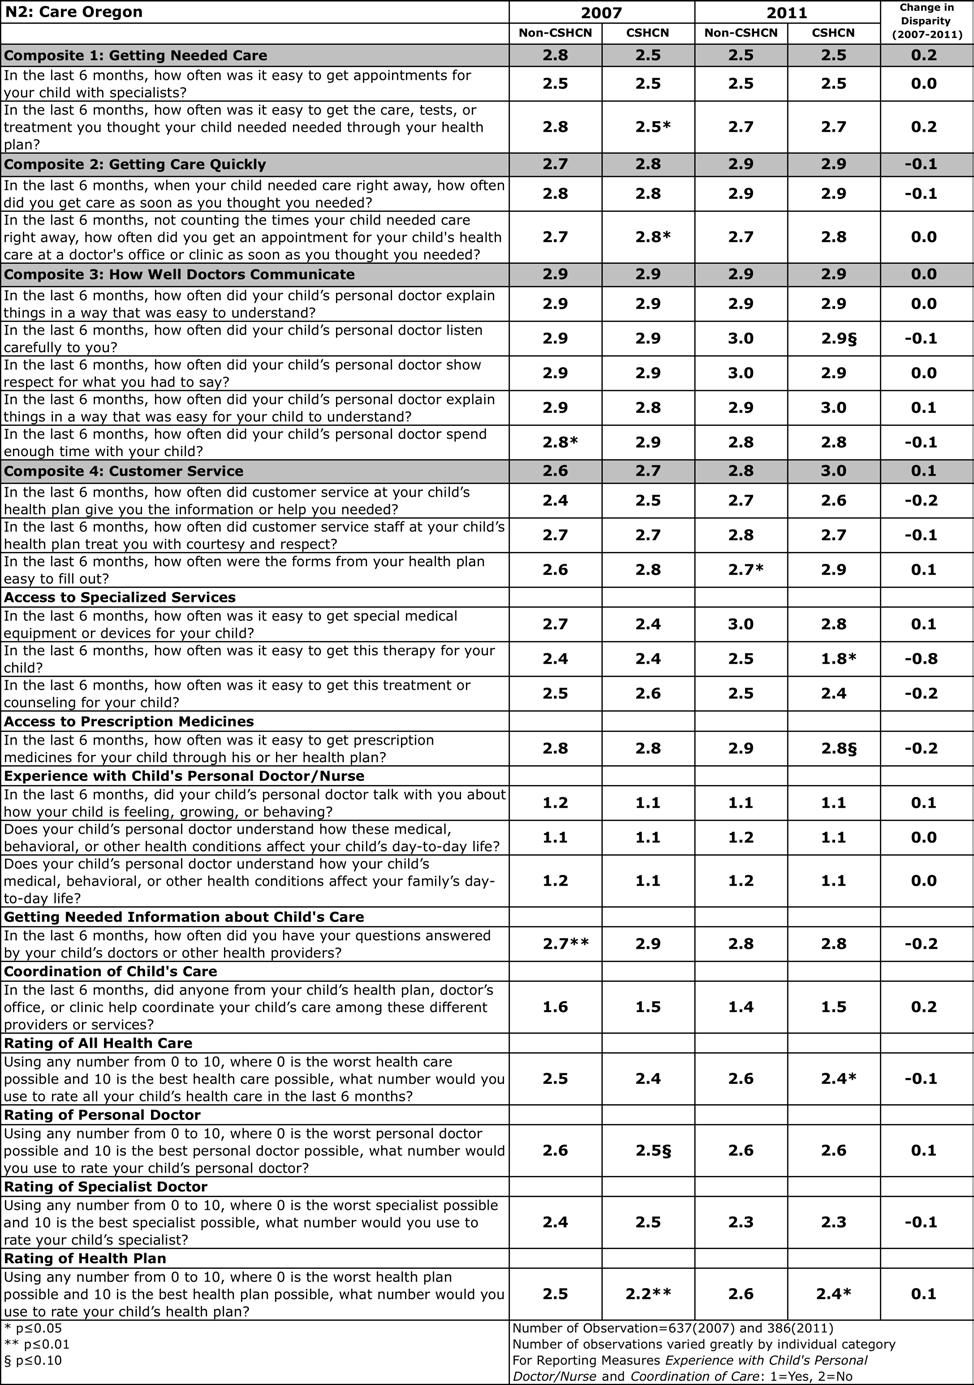
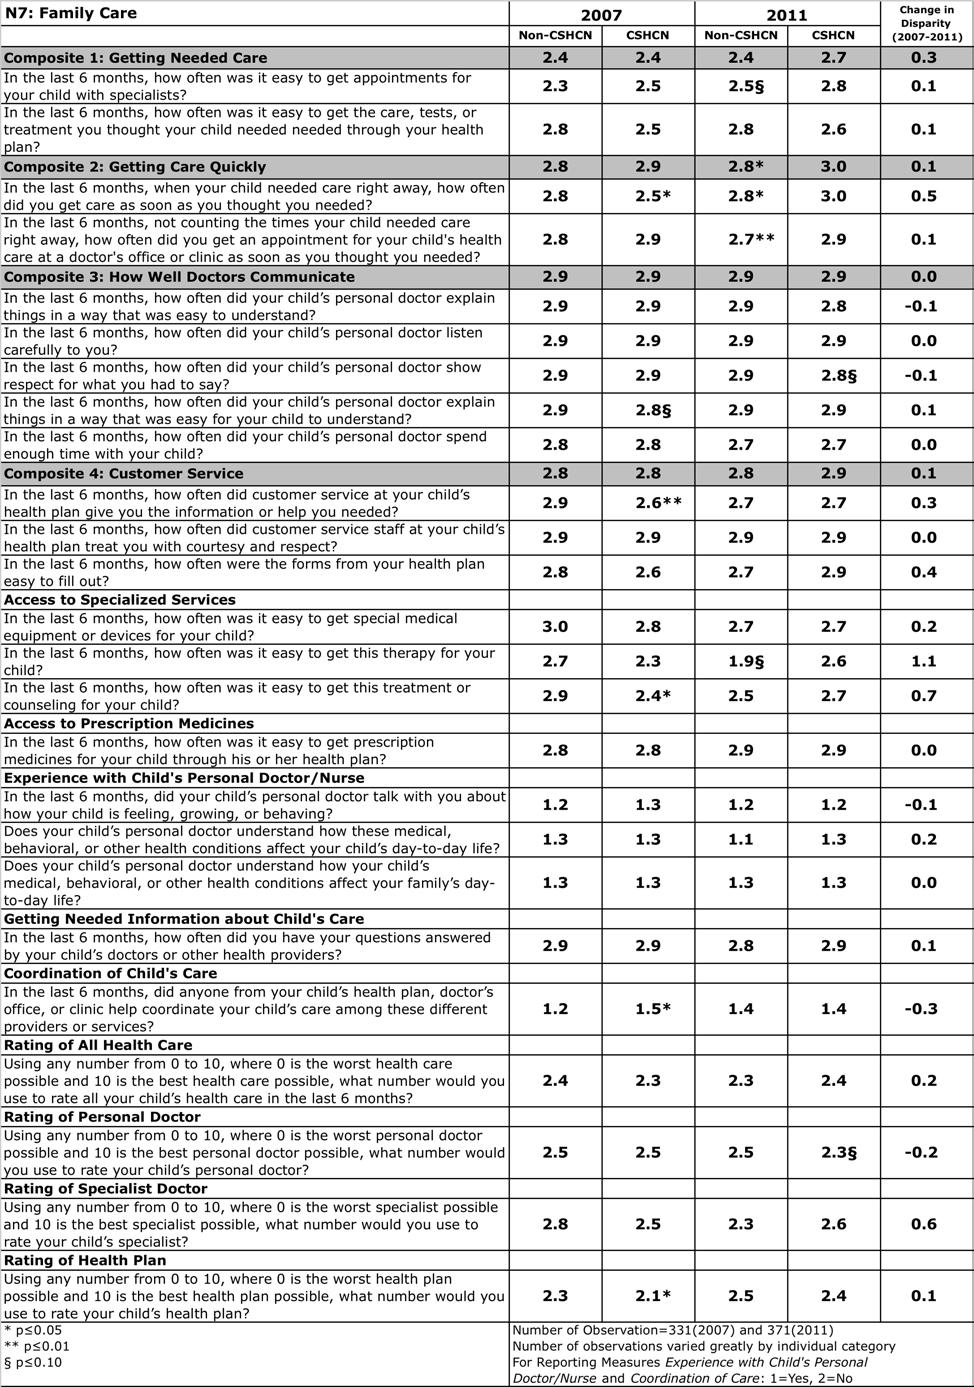
4 Appendix Plan Summaries for CSHCN (N1- N16) N1: Central Oregon Individual Health Solutions N2: Care Oregon N3: Cascade Comprehensive Care N4: Douglas County Individual Practice Association N5: Primary Care Case Management N6: Doctors of the Oregon Coast South N7: Family Care N8: Intercommunity Health Network N9: Kaiser Permanente N10: Lane Individual Practice Association N11: Marion Polk Community Health Plan N12: Mid- Rogue Individual Practice Association N13: Oregon Dental Service N14: Oregon Health Management Services N15: Providence N16: Tuality Health Alliance P. 25 P. 26 P. 27 P. 28 P. 29 P. 30 P. 31 P. 32 P. 33 P. 34 P. 35 P. 36 P. 37 P. 38 P. 39 P. 40 iii
5 Introduction Creating equitable access to health services is a key aim for U.S. health policy. 1 In Oregon, House Bill 3650, which established Coordinated Care Organizations (CCO), seeks to eliminate racial and ethnic disparities in the Oregon Health Plan (OHP). Documented racial and ethnic disparities exist among OHP recipients in areas of health care utilization and patient experience. American Indian and Black children had lower rates of preventive services than Whites, American Indians had higher rates of potentially avoidable hospitalizations, and Latinos reported lower ratings of courteous office staff and quick care than Whites. 2 These findings are concerning because any issues exacerbated by upcoming changes to Medicaid may disproportionately affect these vulnerable populations. Improving patients experience of care is one of the Triple Aims for improving health care systems. 3 Additionally, the Affordable Care Act contains nine provisions requiring performance measures of patient experience. 4 This report examines disparities and recent trends in disparities in patient experience of care across: 1) racial and ethnic groups, and 2) children with special health care needs (CSHCN) and children without special health care needs (non- CSHCN). This report also examines changes in disparities during a period of OHP enrollment expansion. The results provide the Oregon Health Authority (OHA) with benchmarks for comparison as OHP transitions to the innovative CCO model. Methods Overview This study uses the Consumer Assessment of Healthcare Providers and Systems 4.0 (CAHPS) survey to measure health- related disparities in patient experiences of care among OHP recipients. CAHPS is the national standard for measuring patient experience, and its measures are increasingly being used for health care certification procedures, provider compensation, and public reporting. 5 Surveys were administered through a mix of mail and telephone in 2007 and again in To be eligible for the survey, OHP members had to be enrolled for at least six months. Nearly 46 percent (adjusted response rate) of eligible adults and children selected for sampling completed the surveys in both 2007 and The final viable sample size in 2007 for adults was 5,383 and for children it was 5,555. In 2011, the adult sample size was 6,042 and 5, The CAHPS survey allows patients to rate key aspects of their care experience. Sixteen CAHPS questions make up four composite measures (Getting Needed Care, Getting Care Quickly, How well Doctors Communicate, and Customer Service), and four global rating scales address overall perceptions of care in four areas: Health Plan, All Health Care, Personal Doctor and Specialist Doctor. Child surveys include an additional 15 questions on themes including Shared Decision Making, Access to Specialized Services, Access to Prescription Medicines, Experience with Child s Personal Doctor/Nurse, Getting Needed Information about Child s Care, and Coordination of Child s Care. This analysis uses a top box scoring method to group response values. 7 Specific methodological details unique to each study group are available in the CSHCN and Race and Ethnicity reports that follow. Disparities in each year are first analyzed using descriptive statistics. Second, changes in disparities over time are analyzed using multivariate regression models in which interactions between time and the indicator variable for the racial and ethnic or health subgroup are tested. Adult (18 years or older) and child responses are evaluated separately. Sample sizes are not large enough to complete a 1
6 comprehensive comparison of disparities across each individual race and ethnic category. Consequently, race and ethnic data is divided into four categories for analysis: (1) White, (2) Black, (3) Latino, and (4) Other. Findings CSHCN & Non- CSHCN CSHCN report a significantly lower score than non- CSHCN in 2007 in the composite Getting Needed Care. CSHCN report a significantly lower score than non- CSHCN in 2007 for the reporting measure Access to Prescription Medications. CSHCN report lower global ratings for All Health Care, Personal Doctor and Health Plan than non- CSHCN in both 2007 and Race/Ethnicity Adults Both Latinos and Blacks rate their health plans significantly higher than Whites in both 2007 and The mean scores for Whites increase from 2007 to 2011 for the composite How Well Doctors Communicate and decrease for Blacks. The change in disparity over time was statistically significant. Similarly, the mean scores for Whites increase from 2007 to 2011 for the global measure Rating of Specialist Doctor and decrease for Blacks, with the change in disparity being statistically significant. Race/Ethnicity Children Latinos consistently report significantly higher means than Whites across most global measures. Whites report significantly higher scores than Latinos in 2007 and 2011 for the composite Getting Needed Care. In the global measure rating Health Plan both White and Black mean scores increase from 2007 to 2011, with Blacks scores increasing enough to indicate a significant change in disparity. In general, findings indicate few trends in disparities exist in patient experience across racial and ethnic groups for children in the four composite measures. Summary Overall, we find very few disparities among racial and ethnic groups for adults, and several that are observed are counter to expectations. Similarly, we find few disparities in patient experience across race and ethnicity groups for children in the four composite measures. Interestingly, while CSHCN do not consistently report poorer patient experiences on individual measures, they do rate their overall health care, personal doctor and health plans significantly and consistently lower than their counterparts without special health care needs. There are also very few significant changes in disparities from 2007 to While the overall results report generally positive experiences for all groups, there are a few noted disparities that are small in magnitude. 2
7 Recommendations Based on the results from this survey, several recommendations may enhance understanding for future studies of the OHP program: Increase the number of surveys administered to racial/ethnic minority recipients Doing so would allow for further analysis of disparities for the same subgroups between the various plans within OHP. This could be of particular importance as Oregon moves to Coordinated Care Organizations. Consider exploring regional disparities Analyzing racial and ethnic disparities across urban and rural areas may produce different results due to different challenges presented in these geographic environments. For example, some services may only be available in urban areas, but access to services may be limited in urban areas due to the greater demand by Medicaid beneficiaries. Breakout of CSHCN using diagnostic information The CSHCN screener casts a wide net in an effort to capture those children needing increased health services, as well as the segment of the population of children needing preventive services. Grouping all those children together, however, may mask subtle disparities in patient experience. For example, the experience of a child needing psychological services may be vastly different from the experience of a child needing treatment for asthma. Using the information in the CAHPS survey alone does not allow for such analysis however administrative data may contain the necessary information. Track Medicaid beneficiaries over time Responses to the CAHPS survey may be based, in part, on experiences preceding Medicaid enrollment. Due to the change in eligibility requirements and subsequent expansion of enrollment, many survey respondents may have been previously uninsured. Therefore, their perceptions could be based on a comparison between having no health insurance and being an OHP beneficiary. Given the high likelihood of another expansion, it would be valuable to track the current respondents in future surveys to determine if their experiences of care change as their time as OHP beneficiaries increases. 3
8 Works Cited 1 Strategic Plan Fiscal Year U.S. Department of Health and Human Services (HHS), Assistant Secretary of Planning and Evaluation Washington, D.C.: Print. 2 "Coordinated Care Organizations Implementation Proposal." Oregon Health Authority, 24 Jan Web. 5 May < reform/docs/cco- implementation- proposal.pdf>. p.7. 3 Berwick, D. M., T. W. Nolan, and J. Whittington. "The Triple Aim: Care, Health, And Cost." Health Affairs 27.3 (2008): Millenson, Michael L., and Juliana Macri. "Will the Affordable Care Act Move Patient- Centeredness to Center Stage?" Will the Affordable Care Act Move Patient- Centeredness to Center Stage? Urban Institute, Mar Web. 16 May < 5 Aligning Forces for Quality (AF4Q) Measuring Patient Experience. Robert Wood Johnson Foundation and the Shaller Consulting Group CAHPS 4.0 Medicaid Survey: Banner Book Report. Oregon Health Plan, July CAHPS 4.0 Medicaid Survey: Banner Book Report. Oregon Health Plan, July
9 Disparities in Patient Experience Between Children with and without Special Health Care Needs Both federal and state governments have an obligation to ensure that beneficiaries of publicly provided health care programs experience equitable treatment by health care providers and managed care organizations. 1 This becomes especially crucial when dealing with vulnerable populations such as children with special health care needs (CSHCN). CSHCN are defined as those who have or are at increased risk for a chronic physical, developmental, behavioral, or emotional condition and who also require health and related services of a type or amount beyond that required by children generally. 2 As the agency that administers Medicaid in the state of Oregon, Oregon Health Authority (OHA) has a responsibility to identify any significant differences in experience of care by patient subgroups. To accomplish this objective, the agency collected data on patient experience through the nationally recognized Consumer Assessment of Healthcare Providers and Systems 4.0 (CAHPS) survey. Because OHA is particularly interested in identifying differences or disparities that may exist between Medicaid recipient children with and without special health care needs, the agency used a CAHPS survey that included a CSHCN screener in both 2007 and The screener provides analysts with the ability to distinguish between children with and without special health care needs. Focusing this analysis on 2007 and 2011 may uncover changes in disparities that have occurred during the expansion of Medicaid that took place during that period in Oregon. 3 Methods The Agency for Healthcare Research and Quality recommends aggregating CAHPS survey questions reflecting similar dimensions of patient experience into four composite measures. 4 In addition to composites, responses from parents to several other questions measuring child- specific patient experience are grouped into reporting measures. However, in this case, questions were not aggregated for analysis. For each individual question, respondents were asked to choose between Never, Sometimes, Usually and Always. The current analysis of composites and reporting measures assigns the values 1, 2, 3 and 4 to each response respectively. Responses of 3 and 4 ( Usually and Always, ) are combined and assigned a value of 3. Resulting findings are therefore provided on a scale of 1 to 3. Finally, four global rating questions ask respondents to rate different aspects of their patient experience on a scale of 1 to 10. Responses of 1 to 6 are combined and assigned a value of 1. Responses of 7 and 8 are combined and assigned a value of 2 and responses of 9 and 10 are combined and assigned a value of 3. As with composites and reporting measures, global ratings are shown on a scale of 1 to 3. OHA applied an oversampling strategy to accurately represent the appropriate mix of race and ethnicity among Medicaid recipients in Oregon. All data is weighted accordingly. Significance is assigned to findings with p Results Table 1 shows a comparison of composite measures for CSHCN and non- CSHCN for both 2007 and CSHCN report significantly poorer experiences than non- CSHCN in the composite Getting Needed Care in 2007, however no such disparities are found for the other three composites. Further, no significant changes in disparities were observed between 2007 and 2011 (Table 1). 5
10 Table 1: Disparities in Composites Between CSHCN and Non- CSHCN for 2007 and 2011 Non- CSHCN CSHCN Non- CSHCN CSHCN Change in Disparity ( ) Getting Needed Care * Getting Care Quickly How Well Doctors Communicate Customer Service * p 0.05 ** p 0.01 p 0.10 While no larger pattern of disparities emerged and no changes in disparities exist over time in the reporting measures, experiences of CSHCN were significantly worse than non- CSHCN with regard to Access to Prescription Medicines (Table 2). Table 2: Disparities Between Reporting Measures for CSHCN and Non- CSHCN for 2007 & Non- CSHCN CSHCN Non- CSHCN CSHCN Change in Disparity ( ) Access to Specialized Services (In the last 6 months) How often was it easy to get special medical equipment or devices for your child? How often was it easy to get therapy for your child? How often was it easy to get this treatment or counseling for your child? Access to Prescription Medicines (In the last 6 months) How often was it easy to get prescription medicines for your child through his or her health plan? * Experience with Child s Personal Doctor/Nurse (In the last 6 months) Did your child s personal doctor talk with you about how your child is feeling, growing, or behaving? Does your child s personal doctor understand how these medical, behavioral, or other health conditions affect your child s day- to- day life? Does your child s personal doctor understand how these medical, behavioral, or other health conditions affect your family s day- to- day life? Getting Needed Information about Child s Care (In the last 6 months) How often did you have your questions answered by your child s doctors or other health providers? Coordination of Child s Care (In the last 6 months) Did anyone from your child s health plan, doctor s office, or clinic help coordinate your child s care among these different providers or services? * p 0.05 ** p 0.01 p
11 For three out of four global rating measures, CSHCN report worse experiences in patient care than non- CSHCN in both 2007 and Once again, there is no significant change (no worsening nor improvement) in disparities over the study period (Table 3). Table 3: Disparities in Global Ratings Between CSHCN and Non- CSHCN for 2007 & 2011 Non- CSHCN CSHCN Non- CSHCN CSHCN Rating of All Health care Using any number from 0 to 10, where 0 is the worst health care possible and 10 is the best health care possible, what number would you use to rate all your child s health care in the last 6 months? Rating of Personal Doctor Using any number from 0 to 10, where 0 is the worst specialist possible and 10 is the best specialist possible, what number would you use to rate your child s personal doctor? Rating of Specialist Doctor Using any number from 0 to 10, where 0 is the worst health care possible and 10 is the best health care possible, what number would you use to rate your child s specialist? Rating of Health Plan Using any number from 0 to 10, where 0 is the worst health plan possible and 10 is the best health plan possible, what number would you use to rate your child s health plan? * p 0.05 ** p 0.01 p 0.10 Change in Disparity ( ) ** ** ** ** ** ** 0.0 For all indicators, disparities neither improved nor worsened between 2007 and 2011 for CSHCN and non- CSHCN. However, disparities do exist for some individual questions, composites and years. Interestingly, while CSHCN do not consistently report poorer patient experiences on individual measures, they do rate their overall health care, personal doctor and health plans significantly and consistently lower than their counterparts without special health care needs. As OHA prepares for the implementation of the Affordable Care Act and the introduction of Coordinated Care Organizations, ensuring equitable patient experiences across vulnerable populations such as CSHCN should remain a top priority. 7
12 Works Cited 1 Shalala, Donna E. Safeguards for Individuals with Special Health Care Needs Enrolled in Medicaid Managed Care. Congressional, U.S. Department of Health and Human Services, Washington: U.S. Department of Health and Human Services, McPherson, Merle, et al. "A New Definition of Children With Special Health Care Needs." Pediatrics 102 (July 1998): Child and Adolescent Health Measurement Initiative. Data Resource Center for Child and Adolescent Health profiles?rpt=10&geo=39 (accessed May 18, 2012). 4 Agency for Healthcare Research and Quality. Instructions for Analyzing Data from CAHPS Surveys: Using the CAHPS Analysis Program Version 4.0. Instructions, Rockville: Department of Health and Human Services,
13 Measuring Racial and Ethnic Disparities in Patient Experience among Oregon Health Plan Recipients between 2007 and 2011 Oregon is in the process of making major structural changes to the Oregon Health Plan (OHP), the program that administers Medicaid in the state. In particular, OHP is transitioning to Coordinated Care Organizations, beginning in mid Along with changes to the structure of OHP services, providers will be required to report on a variety of new areas including measures of patient experience stratified by race and ethnicity. Documented racial and ethnic disparities exist within the OHP population in areas of health care utilization and patient experience. American Indian and African American children had lower rates of preventive services than Whites, American Indians had higher rates of potentially avoidable hospitalizations, and Latinos report less courteous office staff and quick care than Whites. 1 The goal of this report is to measure disparities in patient experience among racial and ethnic groups using data gathered on OHP recipients. We measure these disparities by examining data from 2007 and 2011 and examining the changes over the four- year period. Methods Using data collected in CAHPS 4.0, we examine whether differences exist in patient experience among OHP recipients in four racial and ethnic groups: White (Non- Hispanic), Latino (Hispanic or Latino), Black (Black or African American), and Other (including Asian, American Indian or Alaska Native). The data are weighted due to oversampling of some race and ethnicity groups. We examine the differences among these groups in 2007 and 2011 using descriptive statistics. We test if differences in disparities change between 2007 and 2011 using multivariate regression models with the combined dataset, testing for interactions between racial and ethnic groups and the year. Separate analyses are conducted for adults (18 years old and older) and children. We examine differences across racial and ethnic groups in eight CAHPS indicators. Four of the indicators are composites of several survey questions (Getting Needed Care, Getting Care Quickly, How Well Doctors Communicate and Customer Service) and four of the indicators are global ratings measures (All Health Care, Personal Doctor, Specialist Doctor and Health Plan). The scores have been top box coded so that, regardless of their original scale, they are scaled to reflect a score of 1 to 3. For the composites, the values 1, 2, and 3 represent Never, Sometimes, and Usually/Always respectively. For the global reporting measures, the values 1, 2, and 3 represent the values 1-6, 7-8, and 9-10 respectively. Results - Adults Overall, we find very few disparities among racial and ethnic groups for adults, and several that are observed are counter to expectations. In 2007 and 2011, both Latinos and Blacks rate their health plans significantly higher than Whites. The only other significant racial and ethnic disparity for adults is that Whites report higher scores than those in the Other category for the composite Getting Care Quickly in In general, Latinos report better patient experience than any other group for all measures, though the trend is usually not significant. 9
14 Disparities neither improved nor worsened between 2007 and Whites do report better care in 2011 compared to 2007, while other groups report poorer care for individual composites and global measures. This causes two significant changes in disparities. First, the average score for Whites improves for the composite Getting Needed Care. This leads to a decrease in the disparity between Whites and Latinos. Second, the average score reported by Whites increases from 2007 to 2011 for the composite How Well Doctors Communicate, but decreases twice as much for Blacks. These changes in scores cause this Table 4: Change in Disparities for Adults from 2007 to 2011 Hispanic or Latino Black or African American Other Composites Getting Needed Care - 0.1* Getting Care Quickly How Well Doctors ** 0.0 Communicate Customer Service Global Ratings All Health Care Personal Doctor Specialist Doctor * Health Plan Significance is relative to scores reported by White. * p 0.05 ** p 0.01 p 0.10 disparity to reverse directions and increase in magnitude. Finally, the disparity between Whites and Blacks changes for the measure Rating of Specialist Doctor. The average score for Whites increases slightly, while the average score reported by African Americans falls by Again, the two movements change the direction and increase the magnitude of this disparity. In general, we do not find any trends in disparities or changes in disparities in the adult data. Results - Children We find few disparities in patient experience across race and ethnicity groups for children in the four composite measures. We do observe, surprisingly, that Latinos consistently report better quality care than Whites in the global measures. Over the four- year period, only one disparity significantly changes. Table 5: Disparities in Global Ratings Between Races/Ethnicities for Children Black or Black or White Hispanic or Latino African American Other White Hispanic or Latino African American Other All Health Care ** ** Personal Doctor ** ** Health Plan ** ** Significance is relative to scores reported by White. Scale is 1(lowest) to 3 (highest). * p 0.05 ** p 0.01 p 0.10 In both 2007 and 2011, Whites report significantly higher scores than Latinos for the composite Getting Care Quickly, reporting a modestly higher score (about0.1 higher). Latinos consistently report higher scores than Whites on the global measures. For the global measure Rating of All Health Care, Rating of Personal Doctor, and Rating of Health Plan, Latinos report average scores higher than Whites. 10
15 The one change in racial and ethnic disparities we observed over time was that Blacks increased their satisfaction with their health plan comparatively more than whites. We do not find any overall trend among children from different racial and ethnic groups. Conclusion In this study, we find few racial and ethnic disparities in patient experience among adult OHP recipients. For children, Latinos tend to report poorer experiences than Whites on the composite measures, which are based Table 6: Change in Disparities for Children from 2007 to 2011 Hispanic or Latino Black or African American Other Composites Getting Needed Care Getting Care Quickly How Well Doctors Communicate Customer Service Global Ratings All Health Care Personal Doctor Specialist Doctor Health Plan ** 0.0 Significance is relative to scores reported by White. * p 0.05 ** p 0.01 p 0.10 upon questions specific to accessing care. However, Latinos report higher than Whites on the global measures of health quality. While we observe slight changes between 2007 and 2011, they are small in magnitude and have small impacts on the observed disparities. In general, it appears that disparities among racial and ethnic groups enrolled in OHP are minimal according to most measures. Works Cited 1 "Coordinated Care Organizations Implementation Proposal." Oregon Health Authority, 24 Jan Web. 5 May < reform/docs/cco- implementation- proposal.pdf>. p.7. 11
16 Appendix A: Disparities in Composites Between CSHCN and Non- CSHCN for 2007 and Non- CSHCN CSHCN Non- CSHCN CSHCN Change in Disparity ( ) Getting Needed Care (In the last 6 months) * How often was it easy to get appointments for your child with specialists? How often was it easy to get the care, tests, or treatment you thought your child needed ** ** 0.1 through your health plan? Getting Care Quickly (In the last 6 months) When your child needed care right away, how often did you get care as soon as you thought you needed? Not counting the times your child needed care right away, how often did you get an appointment for your child's health care at a ** ** doctor's office or clinic as soon as you thought you needed? How Well Doctors Communicate (In the last 6 months) How often did your child s personal doctor explain things in a way that was easy to understand? How often did your child s personal doctor listen carefully to you? ** 0.0 How often did your child s personal doctor show respect for what you had to say? ** 0.0 How often did your child s personal doctor explain things in a way that was easy for your * child to understand? How often did your child s personal doctor spend enough time with your child? * 0.0 Customer Service (In the last 6 months) How often did customer service at your child s health plan give you the information or help you needed? How often did customer service staff at your child s health plan treat you with courtesy and respect? How often were the forms from your health plan easy to fill out? * p 0.05 ** p 0.01 p
17 Appendix B: Disparities Between Reporting Measures for CSHCN and Non- CSHCN for 2007 & 2011 Shared Decision Making (In the last 6 months) Did your child's doctor or other health provider tell you there was more than one choice for your child's treatment or care? Access to Specialized Services (In the last 6 months) How often was it easy to get special medical equipment or devices for your child? How often was it easy to get this therapy for your child? How often was it easy to get this treatment or counseling for your child? Access to Prescription Medicines (In the last 6 months) How often was it easy to get prescription medicines for your child through his or her health plan? Experience with Child's Personal Doctor/Nurse (In the last 6 months) Did your child s personal doctor talk with you about how your child is feeling, growing, or behaving? Does your child s personal doctor understand how these medical, behavioral, or other health conditions affect your child s day- to- day life? Does your child s personal doctor understand how your child s medical, behavioral, or other health conditions affect your family s day- to- day life? Getting Needed Information about Child's Care (In the last 6 months) How often did you have your questions answered by your child s doctors or other health providers? Coordination of Child's Care (In the last 6 months) Did anyone from your child s health plan, doctor s office, or clinic help coordinate your child s care among these different providers or services? * p 0.05 ** p 0.01 p Non- CSHCN CSHCN Non- CSHCN CSHCN Change in Disparity ( ) ** ** * ** *
18 Appendix C: Disparities in Global Ratings Between CSHCN and Non- CSHCN for 2007 & 2011 Rating of All Health care Using any number from 0 to 10, where 0 is the worst health care possible and 10 is the best health care possible, what number would you use to rate all your child s health care in the last 6 months? Rating of Personal Doctor Using any number from 0 to 10, where 0 is the worst specialist possible and 10 is the best specialist possible, what number would you use to rate your child s personal doctor? Rating of Specialist Doctor Using any number from 0 to 10, where 0 is the worst health care possible and 10 is the best health care possible, what number would you use to rate your child s specialist? Rating of Health Plan Using any number from 0 to 10, where 0 is the worst health plan possible and 10 is the best health plan possible, what number would you use to rate your child s health plan? * p 0.05 ** p 0.01 p Non- CSHCN CSHCN Non- CSHCN CSHCN Change in Disparity ( ) ** ** ** ** ** **
19 Appendix D: Disparities in Composites Between Races/Ethnicities in Adults for 2007 & 2011 Change in Disparity ( ) White Latino Black Other White Latino Black Other Latino Black Other Getting Needed Care (In the last 6 months) * How often was it easy to get appointments with specialists? How often was it easy to get the care, tests, or treatment you thought you needed through your health plan? Getting Care Quickly (In the last 6 months) When you needed care right away, how often did you get care as soon as you thought you needed? * Not counting the times you needed care right away, how often did you get an appointment for your health care at a doctor's office or clinic as soon as you thought you needed? How Well Doctors Communicate (In the last 6 months) ** 0.0 How often did your personal doctor explain things in a way that was easy to understand? How often did your personal doctor listen carefully to you? * 0.0 How often did your personal doctor show respect for what you had to say? * 0.0 How often did your personal doctor explain things in a way that was easy for you to understand? ** 0.0 Customer Service (In the last 6 months) How often did customer service at your health plan give you the information or help you needed? How often did customer service staff at your health plan treat you with courtesy and respect? How often were the forms from your health plan easy to fill out? * p 0.05 ** p 0.01 p
20 Appendix E: Disparities in Global Ratings Between Races/Ethnicities in Adults for 2007 & 2011 Rating of All Health care Using any number from 0 to 10, where 0 is the worst health care possible and 10 is the best health care possible, what number would you use to rate all your child s health care in the last 6 months? Rating of Personal Doctor Using any number from 0 to 10, where 0 is the worst personal doctor possible and 10 is the best personal doctor possible, what number would you use to rate your child s personal doctor? Rating of Specialist Doctor Using any number from 0 to 10, where 0 is the worst specialist possible and 10 is the best specialist possible, what number would you use to rate your child s specialist? Rating of Health Plan Using any number from 0 to 10, where 0 is the worst health plan possible and 10 is the best health plan possible, what number would you use to rate your child s health plan? * p 0.05 ** p 0.01 p 0.10 Change in Disparity ( ) White Latino Black Other White Latino Black Other Latino Black Other * ** 2.3* ** 2.4*
21 Appendix F: Disparities in Composites Between Races/Ethnicities in Children for 2007 & 2011 Change in Disparity ( ) White Latino Black Other White Latino Black Other Latino Black Other Getting Needed Care (In the last 6 months) How often was it easy to get appointments for your child with specialists? How often was it easy to get the care, tests, or treatment you thought your child needed through your health plan? Getting Care Quickly (In the last 6 months) ** * * When your child needed care right away, how often did you get care as soon as you thought you needed? ** ** ** ** 0.1 Not counting the times your child needed care right away, how often did you get an appointment for your child s health care at a doctor's office or clinic as soon as you thought you ** ** ** needed? How Well Doctors Communicate (In the last 6 months) * How often did your child s personal doctor explain things in a way that was easy to understand? ** * * How often did your child s personal doctor listen carefully to you? How often did your child s personal doctor show respect for what you had to say? How often did your child s personal doctor explain things in a way that was easy for your child to understand? ** ** How often did your child s personal doctor spend enough time with your child? Customer Service (In the last 6 months) How often did customer service at your child s health plan give you the information or help you needed? How often did customer service staff at your child s health plan treat you with courtesy and respect? How often were the forms from your child s health plan easy to fill out? * ** * * p 0.05 ** p 0.01 p
22 Appendix G: Disparities in Reporting Measures Between Races/Ethnicities in Children for 2007 & 2011 Shared Decision Making (In the last 6 months) In the last 6 months, did your child's doctor or other health provider tell you there was more than one choice for your child's treatment or care? Access to Specialized Services (In the last 6 months) How often was it easy to get special medical equipment or devices for your child? Change in Disparity ( ) White Latino Black Other White Latino Black Other Latino Black Other * How often was it easy to get this therapy for your child? How often was it easy to get this treatment or counseling for your child? Access to Prescription Medicines (In the last 6 months) How often was it easy to get prescription medicines for your child through his or her health plan? Experience with Child's Personal Doctor/Nurse (In the last 6 months) Did your child s personal doctor talk with you about how your child is feeling, growing, or behaving? Does your child s personal doctor understand how these medical, behavioral, or other health conditions affect your child s day- to- day life? Does your child s personal doctor understand how your child s medical, behavioral, or other health conditions affect your family s day- to- day life? Getting Needed Information about Child s Care (In the last 6 months) How often did you have your questions answered by your child s doctors or other health providers? Coordination of Child s Care (In the last 6 months) Did anyone from your child s health plan, doctor s office, or clinic help coordinate your child s care among these different providers or services? * p 0.05 ** p 0.01 p ** ** - 0.1* * * * ** ** **
23 Appendix H: Disparities in Global Ratings Between Races/Ethnicities in Children for 2007 & 2011 Rating of All Health care Using any number from 0 to 10, where 0 is the worst health care possible and 10 is the best health care possible, what number would you use to rate all your child s health care in the last 6 months? Rating of Personal Doctor Using any number from 0 to 10, where 0 is the worst personal doctor possible and 10 is the best personal doctor possible, what number would you use to rate your child s personal doctor? Rating of Specialist Doctor Using any number from 0 to 10, where 0 is the worst specialist possible and 10 is the best specialist possible, what number would you use to rate your child s specialist? Rating of Health Plan Using any number from 0 to 10, where 0 is the worst health plan possible and 10 is the best health plan possible, what number would you use to rate your child s health plan? * p 0.05 ** p 0.01 p 0.10 Change in Disparity ( ) White Latino Black Other White Latino Black Other Latino Black Other ** ** ** ** ** ** **
24 Appendix I: Disparities Between Races/Ethnicities for 2007 & 2011: Adult Composites White Latino Black Asian American Indian or Alaska Native Other White Latino Black Asian American Indian or Alaska Native Change in Disparity ( ) Other Latino Black Asian Getting Needed Care (In the last 6 months) How often was it easy to get appointments with specialists? ** * How often was it easy to get the care, tests, or treatment you thought you needed through your health plan? Getting Care Quickly (In the last 6 months) When you needed care right away, how often did you get care as soon as you thought you needed? Not counting the times you needed care right away, how often did you get an appointment for your health care at a ** ** doctor's office or clinic as soon as you thought you needed? How Well Doctors Communicate (In the last 6 months) * * How often did your personal doctor explain things in a way that was easy to understand? How often did your personal doctor listen carefully to you? * How often did your personal doctor show respect for what you had to say? * * How often did your personal doctor explain things in a way that was easy for * * your child to understand? Customer Service (In the last 6 months) How often did customer service at your health plan give you the information or help you needed? How often did customer service staff at your health plan treat you with courtesy and respect? How often were the forms from your health plan easy to fill out? * p 0.05 ** p 0.01 p 0.10 American Indian or Alaska Native Other 20
25 Appendix J: Disparities Between All Races/Ethnicities for 2007 & 2011: Adult Global Ratings Rating of All Health Care Using any number from 0 to 10, where 0 is the worst health care possible and 10 is the best health care possible, what number would you use to rate all your health care in the last 6 months? Rating of Personal Doctor Using any number from 0 to 10, where 0 is the worst personal doctor possible and 10 is the best personal doctor possible, what number would you use to rate your personal doctor? Rating of Specialist Doctor Using any number from 0 to 10, where 0 is the worst specialist possible and 10 is the best specialist possible, what number would you use to rate your specialist? Rating of Health Plan Using any number from 0 to 10, where 0 is the worst health plan possible and 10 is the best health plan possible, what number would you use to rate your health plan? * p 05 ** p.01 p 0.10 White Latino Black Asian American Indian or Alaska Other White Latino Black Asian Native American Change in Disparity ( ) Indian or Alaska Other Latino Black Asian Native American Indian or Alaska Other Native * * * ** **
26 Appendix K: Disparities Between Races/Ethnicities for 2007 & 2011: Child Composites Change in Disparity ( ) American American American Indian or Indian or Indian or White Latino Black Asian Alaska Other White Latino Black Asian Alaska Other Latino Black Asian Alaska Native Native Native Getting Needed Care (In the last 6 months) How often was it easy to get appointments for your child with specialists? How often was it easy to get the care, tests, or treatment you thought your child needed through your health plan? Getting Care Quickly (In the last 6 months) ** ** * 0.1* When your child needed care right away, how often did you get care as soon as you ** ** ** ** thought you needed? Not counting the times your child needed care right away, how often did you get an appointment for your child's health care at ** ** ** ** a doctor's office or clinic as soon as you thought you needed? How Well Doctors Communicate (In the last 6 months) How often did your child s personal doctor explain things in a way that was easy to ** ** understand? How often did your child s personal doctor listen carefully to you? How often did your child s personal doctor show respect for what you had to say? How often did your child s personal doctor explain things in a way that was easy for ** ** your child to understand? How often did your child s personal doctor spend enough time with your child? Customer Service (In the last 6 months) How often did customer service at your child s health plan give you the information or help you needed? How often did customer service staff at your child s health plan treat you with courtesy and respect? How often were the forms from your health plan easy to fill out? ** ** * * p 0.05 ** p 0.01 p 0.10 Other 22
27 Appendix L: Disparities Between Races/Ethnicities for 2007 & 2011: Reporting Measures for Children Shared Decision Making (In the last 6 months) Did your child's doctor or other health provider tell you there was more than one choice for your child's treatment or care? Access to Specialized Services (In the last 6 months) How often was it easy to get special medical equipment or devices for your child? How often was it easy to get this therapy for your child? How often was it easy to get this treatment or counseling for your child? Access to Prescription Medicines (In the last 6 months) How often was it easy to get prescription medicines for your child through his or her health plan? Experience with Child's Personal Doctor/Nurse (In the last 6 months) Did your child s personal doctor talk with you about how your child is feeling, growing, or behaving? Does your child s personal doctor understand how these medical, behavioral, or other health conditions affect your child s day- to- day life? Does your child s personal doctor understand how your child s medical, behavioral, or other health conditions affect your family s day- to- day life? Getting Needed Information about Child's Care (In the last 6 months) How often did you have your questions answered by your child s doctors or other health providers? Coordination of Child's Care (In the last 6 months) Did anyone from your child s health plan, doctor s office, or clinic help coordinate your child s care among these different providers or services? * p 0.05 ** p 0.01 p 0.10 White Latino Black Asian American Indian or Alaska Native Other White Latino Black Asian American Indian or Alaska Native Change in Disparity ( ) Other Latino Black Asian American Indian or Alaska Native * ** ** * * ** ** * Other 23
28 Appendix M: Disparities Between All Races/Ethnicities for 2007 & 2011: Child Global Ratings Rating of All Health Care Using any number from 0 to 10, where 0 is the worst health care possible and 10 is the best health care possible, what number would you use to rate all your child s health care in the last 6 months? Rating of Personal Doctor Using any number from 0 to 10, where 0 is the worst personal doctor possible and 10 is the best personal doctor possible, what number would you use to rate your child s personal doctor? Rating of Specialist Doctor Using any number from 0 to 10, where 0 is the worst specialist possible and 10 is the best specialist possible, what number would you use to rate your child s specialist? Rating of Health Plan Using any number from 0 to 10, where 0 is the worst health plan possible and 10 is the best health plan possible, what number would you use to rate your child s health plan? * p 0.05 ** p 0.01 p 0.10 White Latino Black Asian Change in Disparity American Indian or Alaska Native Other White Latino Black Asian American Indian or Alaska Native Other Latino Black Asian American Indian or Alaska Native ** * ** ** ** ** ** ** ** Other 24
29 25
30 26
31 27
32 28
33 29
34 30
35 31
Using Quality Improvement to Reduce Racial and Ethnic Disparities in Medicaid Managed Care: Lessons from Oregon
 Using Quality Improvement to Reduce Racial and Ethnic Disparities in Medicaid Managed Care: Lessons from Oregon Matthew Carlson, Ph.D. Assistant Professor of Sociology Portland State University Charles
Oklahoma Health Care Authority. ECHO Adult Behavioral Health Survey For SoonerCare Choice
 Oklahoma Health Care Authority ECHO Adult Behavioral Health Survey For SoonerCare Choice Executive Summary and Technical Specifications Report for Report Submitted June 2009 Submitted by: APS Healthcare
CALIFORNIA HEALTHCARE FOUNDATION. Medi-Cal Versus Employer- Based Coverage: Comparing Access to Care JULY 2015 (REVISED JANUARY 2016)
") CALIFORNIA HEALTHCARE FOUNDATION Medi-Cal Versus Employer- Based Coverage: Comparing Access to Care JULY 2015 (REVISED JANUARY 2016) Contents About the Authors Tara Becker, PhD, is a statistician at the
CALIFORNIA HEALTHCARE FOUNDATION Medi-Cal Versus Employer- Based Coverage: Comparing Access to Care JULY 2015 (REVISED JANUARY 2016) Contents About the Authors Tara Becker, PhD, is a statistician at the
Oregon Health Authority Key Performance Measures Biennium
 Oregon Health Authority Key Performance Measures 2017 2017 Biennium Presented to the Human Services Legislative Subcommittee on Ways and Means April 6, 2015 Leslie Clement, Chief of Policy Lori Coyner,
The Florida KidCare Evaluation: Statistical Analyses
 The Florida KidCare Evaluation: Statistical Analyses Betsy Shenkman, PhD Jana Col, MA Heather Steingraber Christine Bono Purpose To build from the descriptive reports of past three state and federal fiscal
Commonwealth Fund Scorecard on State Health System Performance, Baseline
 1 1 Commonwealth Fund Scorecard on Health System Performance, 017 Florida Florida's Scorecard s (a) Overall Access & Affordability Prevention & Treatment Avoidable Hospital Use & Cost 017 Baseline 39 39
Aligning Forces for Quality in Albuquerque
 Aligning Forces for Quality in Albuquerque A Community Snapshot Albuquerque s diverse culture can be attributed to its long history. The area had been populated and cultivated by Native Americans for thousands
CLOSING THE DIVIDE: HOW MEDICAL HOMES PROMOTE EQUITY IN HEALTH CARE
 CLOSING DIVIDE: HOW MEDICAL HOMES PROMOTE EQUITY IN HEALTH CARE RESULTS FROM 26 HEALTH CARE QUALITY SURVEY Anne C. Beal, Michelle M. Doty, Susan E. Hernandez, Katherine K. Shea, and Karen Davis June 27
Summary Report of Findings and Recommendations
 Patient Experience Survey Study of Equivalency: Comparison of CG- CAHPS Visit Questions Added to the CG-CAHPS PCMH Survey Summary Report of Findings and Recommendations Submitted to: Minnesota Department
Reenlistment Rates Across the Services by Gender and Race/Ethnicity
 Issue Paper #31 Retention Reenlistment Rates Across the Services by Gender and Race/Ethnicity MLDC Research Areas Definition of Diversity Legal Implications Outreach & Recruiting Leadership & Training
Impact of Enrolling in Health Insurance on Low-Income Children that Enrolled for a Medical Reason
 Impact of Enrolling in Health Insurance on Low-Income Children that Enrolled for a Medical Reason Prepared for: Prepared by Moira Inkelas and Patricia Barreto The University of California at Los Angeles
Research Brief IUPUI Staff Survey. June 2000 Indiana University-Purdue University Indianapolis Vol. 7, No. 1
 Research Brief 1999 IUPUI Staff Survey June 2000 Indiana University-Purdue University Indianapolis Vol. 7, No. 1 Introduction This edition of Research Brief summarizes the results of the second IUPUI Staff
Addressing Low Health Literacy to Achieve Racial and Ethnic Health Equity
 Hedge Health Funds 2/28/04 October 2009 Addressing Low Health to Achieve Racial and Ethnic Health Equity Anne Beal, MD, MPH President Aetna Foundation, Inc. Minorities Are More Likely to Have Diabetes
KEY FINDINGS from Caregiving in the U.S. National Alliance for Caregiving and AARP. April Funded by MetLife Foundation
 KEY FINDINGS from Caregiving in the U.S. National Alliance for Caregiving and AARP April 2004 Funded by MetLife Foundation Profile of Caregivers Estimate that there are 44.4 million American caregivers
Dobson DaVanzo & Associates, LLC Vienna, VA
 Analysis of Patient Characteristics among Medicare Recipients of Separately Billable Part B Drugs from 340B DSH Hospitals and Non-340B Hospitals and Physician Offices Dobson DaVanzo & Associates, LLC Vienna,
LegalNotes. Disparities Reduction and Minority Health Improvement under the ACA. Introduction. Highlights. Volume3 Issue1
 Volume3 Issue1 is a regular online Aligning Forces for Quality (AF4Q) publication that provides readers with short, readable summaries of developments in the law that collectively shape the broader legal
Quality of Care for Underserved Populations
 2006 Annual Report Quality of Care for Underserved Populations The goal of The Commonwealth Fund s Program on Quality of Care for Underserved Populations is to improve the quality of health care delivered
FOOD INSECURITY, FOOD BANKS, & HEALTH CARE: A JOURNEY HILARY SELIGMAN MD MAS
 FOOD INSECURITY, FOOD BANKS, & HEALTH CARE: A JOURNEY HILARY SELIGMAN MD MAS Triple Aim of Health Care Lower Costs Triple Aim Better care for the whole population at the lowest cost Improve Patient Care
Community Performance Report
 : Wenatchee Current Year: Q1 217 through Q4 217 Qualis Health Communities for Safer Transitions of Care Performance Report : Wenatchee Includes Data Through: Q4 217 Report Created: May 3, 218 Purpose of
Physician Workforce Fact Sheet 2016
 Introduction It is important to fully understand the characteristics of the physician workforce as they serve as the backbone of the system. Supply data on the physician workforce are routinely collected
Evaluation of Health Care Homes:
 Division of Health Policy PO Box 64882 St. Paul, MN 55164-0882 651-201-3626 www.health.state.mn.us Evaluation of Health Care Homes: 2010-2012 Minnesota Department of Health Minnesota Department of Human
Demographic Profile of the Officer, Enlisted, and Warrant Officer Populations of the National Guard September 2008 Snapshot
 Issue Paper #55 National Guard & Reserve MLDC Research Areas Definition of Diversity Legal Implications Outreach & Recruiting Leadership & Training Branching & Assignments Promotion Retention Implementation
s n a p s h o t Medi-Cal at a Crossroads: What Enrollees Say About the Program
 s n a p s h o t Medi-Cal at a Crossroads: What Enrollees Say About the Program May 2012 Introduction Medi-Cal, which currently provides health and long term care coverage for more than 7.5 million Californians,
Demographic Profile of the Active-Duty Warrant Officer Corps September 2008 Snapshot
 Issue Paper #44 Implementation & Accountability MLDC Research Areas Definition of Diversity Legal Implications Outreach & Recruiting Leadership & Training Branching & Assignments Promotion Retention Implementation
Health Equity Opportunities and Funding Post-ACA: Assessing Progress; Following the Dollars
 Health Equity Opportunities and Funding Post-ACA: Assessing Progress; Following the Dollars Dennis P. Andrulis, PhD, MPH Senior Research Scientist Texas Health Institute & Associate Professor University
September 25, Via Regulations.gov
 September 25, 2017 Via Regulations.gov The Honorable Seema Verma Administrator Centers for Medicare & Medicaid Services 7500 Security Boulevard Baltimore, MD 21244-1850 RE: Medicare and Medicaid Programs;
FY 2017 Peace Corps Early Termination Report GLOBAL
 FY 2017 Peace Corps Early Termination Report GLOBAL February 2018 Overview Since its establishment in 1961, the Peace Corps has been guided by a mission of world peace and friendship, which it promotes
Reported Experiences with Medicaid Managed Care Models Among Parents of Children
 Matern Child Health J (2014) 18:544 553 DOI 10.1007/s10995-013-1270-5 Reported Experiences with Medicaid Managed Care Models Among Parents of Children Allyson G. Hall Amy Yarbrough Landry Christy Harris
Medicare Spending and Rehospitalization for Chronically Ill Medicare Beneficiaries: Home Health Use Compared to Other Post-Acute Care Settings
 Medicare Spending and Rehospitalization for Chronically Ill Medicare Beneficiaries: Home Health Use Compared to Other Post-Acute Care Settings May 11, 2009 Avalere Health LLC Avalere Health LLC The intersection
FINDING ANSWERS: A ROADMAP TO REDUCE RACIAL AND ETHNIC HEALTH DISPARITIES IN HEALTH CARE
 FINDING ANSWERS: A ROADMAP TO REDUCE RACIAL AND ETHNIC HEALTH DISPARITIES IN HEALTH CARE Addressing Health Disparities and Advancing Health Equity February 28, 2017 Angela Dawson, MS, MRC, LPC Executive
School of Public Health University at Albany, State University of New York
 2017 A Profile of New York State Nurse Practitioners, 2017 School of Public Health University at Albany, State University of New York A Profile of New York State Nurse Practitioners, 2017 October 2017
Students Experiencing Homelessness in Washington s K-12 Public Schools Trends, Characteristics and Academic Outcomes.
 Students Experiencing Homelessness in Washington s K-12 Public Schools 2016-17 Trends, Characteristics and Academic Outcomes October 2018 Building Changes thanks the Washington State Office of Superintendent
Geiger Gibson / RCHN Community Health Foundation Research Collaborative. Policy Research Brief # 42
 Geiger Gibson Program in Community Health Policy Geiger Gibson / RCHN Community Health Foundation Research Collaborative Policy Research Brief # 42 How Has the Affordable Care Act Benefitted Medically
Racial and Ethnic Health Disparities in Health and Health Care St. Louis Regional Data
 Racial and Ethnic Health Disparities in Health and Health Care St. Louis Regional Data By Debbie Chase, MPA Consultant, Center for Health Policy University of Missouri -- Columbia 1 Quantitative Data Overview
2012 Ohio Medicaid Assessment Survey Research Conference Data spotlight on key populations and patient-centered medical home status in Ohio
 2012 Ohio Medicaid Assessment Survey Research Conference Data spotlight on key populations and patient-centered medical home status in Ohio June 28, 2013 Hosted by The Ohio Colleges of Medicine Government
2016 Survey of Michigan Nurses
 2016 Survey of Michigan Nurses Survey Summary Report November 15, 2016 Office of Nursing Policy Michigan Department of Health and Human Services Prepared by the Michigan Public Health Institute Table of
Oregon's Health System Transformation
 Oregon's Health System Transformation MEASUREMENT PERIOD Baseline Year 2011 and Calendar Year 2013 JUNE 24, 2014 TABLE OF CONTENTS Executive Summary...iii 2013 CCO Performance and Quality Pool Distribution...1
2015 Health Equity of Care Report
 2015 Health Equity of Care Report Stratification of Health Care Performance Results in Minnesota by Race, Hispanic Ethnicity, Preferred Language and Country of Origin To download the report and find more
Activities to Reduce Health Disparities under Massachusetts Health Care Reform
 Activities to Reduce Health Disparities under Massachusetts Health Care Reform Joel S. Weissman, PhD Assoc Prof of Health Policy, Harvard Medical School Former Senior Health Policy Advisor to the Secretary
Paul Glassman DDS, MA, MBA Professor and Director of Community Oral Health University of the Pacific School of Dentistry San Francisco, CA
 Paul Glassman DDS, MA, MBA Professor and Director of Community Oral Health University of the Pacific School of Dentistry San Francisco, CA What is Quality? Quality is a direct experience independent of
Summary of Findings. Data Memo. John B. Horrigan, Associate Director for Research Aaron Smith, Research Specialist
 Data Memo BY: John B. Horrigan, Associate Director for Research Aaron Smith, Research Specialist RE: HOME BROADBAND ADOPTION 2007 June 2007 Summary of Findings 47% of all adult Americans have a broadband
DoDEA Seniors Postsecondary Plans and Scholarships SY
 DoDEA Seniors Postsecondary Plans and Scholarships SY 2011 12 Department of Defense Education Activity (DoDEA) Research and Evaluation Branch Ashley Griffin, PhD D e p a r t m e n t o f D e f e n s e E
Diversity & Disparities: A Benchmark Study of U.S. Hospitals.
 Diversity & Disparities: A Benchmark Study of U.S. Hospitals http://www.hpoe.org/diversity-disparities Contents Executive Summary...2 Survey Methods...4 Collection and Use of REAL Data...5 Cultural Competency
California Community Clinics
 California Community Clinics A Cohort Analysis Report, 2005 2008 Prepared by Capital Link in collaboration with the California HealthCare Foundation Connecting Health Centers to Capital Resources Copyright
Hospital Consumer Assessment of Healthcare Providers and Systems (HCAHPS) MBQIP Educational Session One Phase Two, January 2013
 MBQIP Educational Session One Phase Two, January 2013") Hospital Consumer Assessment of Healthcare Providers and Systems (HCAHPS) MBQIP Educational Session One Phase Two, January 2013 Overview HCAHPS (Hospital Consumer Assessment of Healthcare Providers and
Hospital Consumer Assessment of Healthcare Providers and Systems (HCAHPS) MBQIP Educational Session One Phase Two, January 2013 Overview HCAHPS (Hospital Consumer Assessment of Healthcare Providers and
Total Cost of Care Technical Appendix April 2015
 Total Cost of Care Technical Appendix April 2015 This technical appendix supplements the Spring 2015 adult and pediatric Clinic Comparison Reports released by the Oregon Health Care Quality Corporation
Why Massachusetts Community Health Centers
 ? Why Massachusetts Community Health Centers A history of excellence The health care safety net Massachusetts Community Health Centers: A History of Firsts In 1965, the nation s first community health
BROWARD COUNTY TRANSIT MAJOR SERVICE CHANGE TO 595 EXPRESS SUNRISE - FORT LAUDERDALE. A Title VI Service Equity Analysis
 BROWARD COUNTY TRANSIT MAJOR SERVICE CHANGE TO 595 EXPRESS SUNRISE - FORT LAUDERDALE A Title VI Service Equity Analysis Prepared September 2015 Submitted for compliance with Title VI of the Civil Rights
CER Module ACCESS TO CARE January 14, AM 12:30 PM
 CER Module ACCESS TO CARE January 14, 2014. 830 AM 12:30 PM Topics 1. Definition, Model & equity of Access Ron Andersen (8:30 10:30) 2. Effectiveness, Efficiency & future of Access Martin Shapiro (10:30
HCAHPS Survey SURVEY INSTRUCTIONS
 HCAHPS Survey SURVEY INSTRUCTIONS You should only fill out this survey if you were the patient during the hospital stay named in the cover letter. Do not fill out this survey if you were not the patient.
Health Care through the Eyes of Coloradans New Data on the Consumer Perspective
 Health Care through the Eyes of Coloradans New Data on the Consumer Perspective November 14, 2013 Joint Safety Net Advisory Committee (SNAC) Learning Lab What We ll Cover Introductions Background on the
2013 Workplace and Equal Opportunity Survey of Active Duty Members. Nonresponse Bias Analysis Report
 2013 Workplace and Equal Opportunity Survey of Active Duty Members Nonresponse Bias Analysis Report Additional copies of this report may be obtained from: Defense Technical Information Center ATTN: DTIC-BRR
Executive Summary...1. Section I Introduction...3
 TABLE OF CONTENTS Executive Summary...1 Section I Introduction...3 Section II Statewide Services Provided to Special Needs Children...5 Introduction... 5 Medicaid Services... 5 Children s Medical Services
HCAHPS Survey SURVEY INSTRUCTIONS
 HCAHPS Survey SURVEY INSTRUCTIONS You should only fill out this survey if you were the patient during the hospital stay named in the cover letter. Do not fill out this survey if you were not the patient.
METHODOLOGY FOR INDICATOR SELECTION AND EVALUATION
 CHAPTER VIII METHODOLOGY FOR INDICATOR SELECTION AND EVALUATION The Report Card is designed to present an accurate, broad assessment of women s health and the challenges that the country must meet to improve
Medicaid Practice Benchmark Report
 Issue Brief Medicaid Practice Benchmark Report Overview In 2015, the Maine Health Management Coalition (MHMC) distributed its first Medicaid Practice Benchmark Report to over 300 pediatric and adult practices,
Provider Service Network
 Evaluating Florida s Medicaid Provider Service Network Demonstration Patient Experience Analysis Final Project Report June, 2004 Acknowledgements This research was commissioned by the Florida Agency for
Selected Measures United States, 2011
 Disparities in Nursing Home Quality Selected Measures United States, 2011 Disparities National Coordinating Center Spring 2014 This material was prepared by the Delmarva Foundation for Medical Care (DFMC)
APPENDIX O: XML DATA FILE LAYOUT FOR DISPROPORTIONATE STRATIFIED RANDOM SAMPLING
 APPENDIX O: XML DATA FILE LAYOUT FOR DISPROPORTIONATE STRATIFIED RANDOM SAMPLING Centers for Medicare & Medicaid Services Appendix O: XML File Layout for Disproportionate Stratified Random Sampling January
Member Satisfaction Survey Evaluation Table 19: Jai Medical Systems Member Satisfaction Survey : Overall Ratings
 Member Satisfaction Survey Evaluation JMSMCO conducted an annual survey of its members to determine member satisfaction and to identify areas that needed improvement. Through survey results JMSMCO was
Officer Retention Rates Across the Services by Gender and Race/Ethnicity
 Issue Paper #24 Retention Officer Retention Rates Across the Services by Gender and Race/Ethnicity MLDC Research Areas Definition of Diversity Legal Implications Outreach & Recruiting Leadership & Training
#123forEQUITY CAMPAIGN
 #123forEQUITY CAMPAIGN Prepared by: Sharon C. Allen, MBA Senior Executive Director of Operations Institute for Diversity and Equity of Care American Hospital Association Date: April 1, 2016 PRESENTATION
Model Community Health Needs Assessment and Implementation Strategy Summaries
 The Catholic Health Association of the United States 1 Model Community Health Needs Assessment and Implementation Strategy Summaries These model summaries of a community health needs assessment and an
MEDICARE ENROLLMENT, HEALTH STATUS, SERVICE USE AND PAYMENT DATA FOR AMERICAN INDIANS & ALASKA NATIVES
 American Indian & Alaska Native Data Project of the Centers for Medicare and Medicaid Services Tribal Technical Advisory Group MEDICARE ENROLLMENT, HEALTH STATUS, SERVICE USE AND PAYMENT DATA FOR AMERICAN
Predicting Transitions in the Nursing Workforce: Professional Transitions from LPN to RN
 Predicting Transitions in the Nursing Workforce: Professional Transitions from LPN to RN Cheryl B. Jones, PhD, RN, FAAN; Mark Toles, PhD, RN; George J. Knafl, PhD; Anna S. Beeber, PhD, RN Research Brief,
FY 2015 Peace Corps Early Termination Report GLOBAL
 FY 2015 Peace Corps Early Termination Report GLOBAL February 2016 Overview Since its establishment in 1961, the Peace Corps has been guided by a mission of world peace and friendship, which it promotes
Patient survey report Survey of people who use community mental health services 2011 Pennine Care NHS Foundation Trust
 Patient survey report 2011 Survey of people who use community mental health services 2011 The national Survey of people who use community mental health services 2011 was designed, developed and co-ordinated
Hospital Discharge Data, 2005 From The University of Memphis Methodist Le Bonheur Center for Healthcare Economics
 Hospital Discharge Data, 2005 From The University of Memphis Methodist Le Bonheur Center for Healthcare Economics August 22, 2008 Potentially Avoidable Pediatric Hospitalizations in Tennessee, 2005 Cyril
Transforming Maternity Care Blueprint for Action Disparities in Access and Outcomes of Maternity Care
 ! Transforming Maternity Care Blueprint for Action Disparities in Access and Outcomes of Maternity Care This document presents the content of the Transforming Maternity Care Blueprint for Action that addresses
Physician Participation in Medi-Cal,
 Physician Participation in Medi-Cal, 1996 1998 February 2002 Andrew B. Bindman, M.D. William Huen Karen Vranizan, M.A. Jean Yoon, M.H.S. Kevin Grumbach, M.D. Center for California Health Workforce Studies
Evaluating Florida s Medicaid Minority Physician Network Pilot Project
 N Evaluating Florida s Medicaid Minority Physician Network Pilot Project Preliminary Results, February 2004 Christy Harris Lemak Allyson G. Hall Christopher E. Johnson Department of Health Services Administration
Wisconsin State Plan to Serve More Children and Youth within Medical Homes
 Wisconsin State Plan to Serve More Children and Youth within Medical Homes Including those with special health care needs Acknowledgments The Wisconsin Children and Youth with Special Health Care Needs
TC911 SERVICE COORDINATION PROGRAM
 TC911 SERVICE COORDINATION PROGRAM ANALYSIS OF PROGRAM IMPACTS & SUSTAINABILITY CONDUCTED BY: Bill Wright, PhD Sarah Tran, MPH Jennifer Matson, MPH The Center for Outcomes Research & Education Providence
Identifying and Describing Nursing Faculty Workload Issues: A Looming Faculty Shortage
 Identifying and Describing Nursing Faculty Workload Issues: A Looming Faculty Shortage Nancy Phoenix Bittner, PhD, CNS, RN Cynthia F. Bechtel, Ph.D., RN, CNE, CEN, CHSE Conflicts of Interest and Disclosures:
Licensed Nurses in Florida: Trends and Longitudinal Analysis
 Licensed Nurses in Florida: 2007-2009 Trends and Longitudinal Analysis March 2009 Addressing Nurse Workforce Issues for the Health of Florida www.flcenterfornursing.org March 2009 2007-2009 Licensure Trends
Mina Li, MD., PhD., CSM Institute for Disability Studies (IDS) The University of Southern Mississippi
 The University of Southern Mississippi") Mina Li, MD., PhD., CSM Institute for Disability Studies (IDS) The University of Southern Mississippi October 9, 2010 Who are CYSHCN? Children/Youth with Special Health Care Needs (CYSHCN) are those who
Mina Li, MD., PhD., CSM Institute for Disability Studies (IDS) The University of Southern Mississippi October 9, 2010 Who are CYSHCN? Children/Youth with Special Health Care Needs (CYSHCN) are those who
Enhancing Outcomes with Quality Improvement (QI) October 29, 2015
 October 29, 2015") Enhancing Outcomes with Quality Improvement (QI) October 29, 2015 Learning Objectives! Introduce Quality Improvement (QI)! Explain Clinical Performance Person-Centered Medical Home (PCMH) Measures! Implement
Enhancing Outcomes with Quality Improvement (QI) October 29, 2015 Learning Objectives! Introduce Quality Improvement (QI)! Explain Clinical Performance Person-Centered Medical Home (PCMH) Measures! Implement
dual-eligible reform a step toward population health management
 FEATURE STORY REPRINT APRIL 2013 Bill Eggbeer Krista Bowers Dudley Morris healthcare financial management association hfma.org dual-eligible reform a step toward population health management By improving
Health Center Program Update
 Health Center Program Update NACHC Policy & Issues Forum March 14, 2018 Jim Macrae Associate Administrator, Bureau of Primary Health Care (BPHC) Health Resources and Services Administration (HRSA) 3/22/2018
FOR IMMEDIATE RELEASE April 17, Media Line Contacts: Covered California (916)
") FOR IMMEDIATE RELEASE April 17, 2014 Media Line Contacts: Covered California (916) 205-8403 California Department of Health Care Services (916) 440-7660 COVERED CALIFORNIA S HISTORIC FIRST OPEN ENROLLMENT
FOR IMMEDIATE RELEASE April 17, 2014 Media Line Contacts: Covered California (916) 205-8403 California Department of Health Care Services (916) 440-7660 COVERED CALIFORNIA S HISTORIC FIRST OPEN ENROLLMENT
Please answer the survey questions about the care the patient received from this hospice: [NAME OF HOSPICE]
![Please answer the survey questions about the care the patient received from this hospice: [NAME OF HOSPICE]](/thumbs/79/80331294.jpg "Please answer the survey questions about the care the patient received from this hospice: [NAME OF HOSPICE]") CAHPS Hospice Survey Please answer the survey questions about the care the patient received from this hospice: [NAME OF HOSPICE] All of the questions in this survey will ask about the experiences with
CAHPS Hospice Survey Please answer the survey questions about the care the patient received from this hospice: [NAME OF HOSPICE] All of the questions in this survey will ask about the experiences with
Appendix A Registered Nurse Nonresponse Analyses and Sample Weighting
 Appendix A Registered Nurse Nonresponse Analyses and Sample Weighting A formal nonresponse bias analysis was conducted following the close of the survey. Although response rates are a valuable indicator
Community Health Needs Assessment 2016
 Community Health Needs Assessment 2016 OSF ST. FRANCIS HOSPITAL & MEDICAL GROUP DELTA COUNTY CHNA 2016 Delta County 2 TABLE OF CONTENTS Executive Summary... 3 Introduction... 5 Methods... 6 Chapter 1.
Population Representation in the Military Services
 Population Representation in the Military Services Fiscal Year 2008 Report Summary Prepared by CNA for OUSD (Accession Policy) Population Representation in the Military Services Fiscal Year 2008 Report
Intermountain Fillmore Community Hospital Community Health Needs Assessment 2016
 Intermountain Fillmore Community Hospital Community Health Needs Assessment 2016 Fillmore Community Hospital 674 South Highway 99 Fillmore, Utah 84631 Intermountain Fillmore Community Hospital 2016 Community
Student 1 Agenda and Resolutions
 Student 1 Agenda and Resolutions National Conference of Family Medicine Residents and Medical Students July -, 01 Kansas City, MO 1. Resolution No. S1-1 Expanding Housing First Programs for People Experiencing
HEALTH WEALTH CAREER MERCER WEBCAST IMPACTING THE HEALTH OF YOUR HISPANIC EMPLOYEES: DISPARITIES, COSTS, TRENDS JULY 26, 2016
 HEALTH WEALTH CAREER MERCER WEBCAST IMPACTING THE HEALTH OF YOUR HISPANIC EMPLOYEES: DISPARITIES, COSTS, TRENDS JULY 26, 2016 TODAY S SPEAKERS DR. DIEGO RAMIREZ Mercer Global Health Management Consultant
California Community Clinics
 California Community Clinics A Financial and Operational Profile, 2008 2011 Prepared by Sponsored by Blue Shield of California Foundation and The California HealthCare Foundation TABLE OF CONTENTS Introduction
The Florida KidCare Program Evaluation
 The Florida KidCare Program Evaluation Calendar Year 2015 MED147 Deliverable # 59 12/6/16 Prepared by the Institute for Child Health Policy University of Florida Under Contract to the Agency for Health
Through A Client s Eyes. 10 Findings from the 2013 Survey of Clients in Colorado s Medicaid Accountable Care Collaborative Program
 Through A Client s Eyes 10 Findings from the 2013 Survey of Clients in Colorado s Medicaid Accountable Care Collaborative Program AUGUST 2014 CHI staff members contributing to this report: Jeff Bontrager,
Minnesota Statewide Quality Reporting and Measurement System: Quality Incentive Payment System Framework
 Minnesota Statewide Quality Reporting and Measurement System: Quality Incentive Payment System Framework AUGUST 2017 Minnesota Statewide Quality Reporting and Measurement System: Quality Incentive Payment
National Survey on Consumers Experiences With Patient Safety and Quality Information
 Summary and Chartpack The Kaiser Family Foundation/Agency for Healthcare Research and Quality/Harvard School of Public Health National Survey on Consumers Experiences With Patient Safety and Quality Information
Community Clinic Grant Program
 This document is made available electronically by the Minnesota Legislative Reference Library as part of an ongoing digital archiving project. http://www.leg.state.mn.us/lrl/lrl.asp Commissioner's Office
Achieving Health Equity After the ACA: Implications for cost, quality and access
 Achieving Health Equity After the ACA: Implications for cost, quality and access Michelle Cabrera, Research Director SEIU State Council April 23, 2015 SEIU California 700,000 Members Majority people of
Racial disparities in ED triage assessments and wait times
 Racial disparities in ED triage assessments and wait times Jordan Bleth, James Beal PhD, Abe Sahmoun PhD June 2, 2017 Outline Background Purpose Methods Results Discussion Limitations Future areas of study
Implementation Strategy For the 2016 Community Health Needs Assessment North Texas Zone 2
 For the 2016 Community Health Needs Assessment North Texas Zone 2 Baylor Emergency Medical Center at Murphy Baylor Emergency Medical Center at Aubrey Baylor Emergency Medical Center at Colleyville Baylor
Indianapolis Transitional Grant Area Quality Management Plan (Revised)
") Indianapolis Transitional Grant Area Quality Management Plan 2017 2018 (Revised) Serving 10 counties: Boone, Brown, Hamilton, Hancock, Hendricks, Johnson, Marion, Morgan, Putnam and Shelby 1 TABLE OF CONTENTS
Indianapolis Transitional Grant Area Quality Management Plan 2017 2018 (Revised) Serving 10 counties: Boone, Brown, Hamilton, Hancock, Hendricks, Johnson, Marion, Morgan, Putnam and Shelby 1 TABLE OF CONTENTS
2005 Survey of Licensed Registered Nurses in Nevada
 2005 Survey of Licensed Registered Nurses in Nevada Prepared by: John Packham, PhD University of Nevada School of Medicine Tabor Griswold, MS University of Nevada School of Medicine Jake Burkey, MS Washington
Medicare Spending and Rehospitalization for Chronically Ill Medicare Beneficiaries: Home Health Use Compared to Other Post-Acute Care Settings
 Medicare Spending and Rehospitalization for Chronically Ill Medicare Beneficiaries: Home Health Use Compared to Other Post-Acute Care Settings Executive Summary The Alliance for Home Health Quality and
The Affordable Care Act and Its Potential to Reduce Health Disparities Cara V. James, Ph.D.
 The Affordable Care Act and Its Potential to Reduce Health Disparities Cara V. James, Ph.D. Director, Office of Minority Health Centers for Medicare & Medicaid Services April 22, 2013 The Affordable Care