Board of Directors Meeting in Public
|
|
|
- Ruby Freeman
- 5 years ago
- Views:
Transcription

1 Board of Directors Meeting in Public 30 January 2019

2 MEETING OF THE BOARD OF DIRECTORS IN PUBLIC To be held on 30 January 2019 at 11:00 In the Training Centre, Swandean, Trust HQ AGENDA TBP01 /19 INTRODUCTION ACTION 1100 TBP01.1/19 Chair s Welcome and Introduction 1100 TBP01.2/19 Patient s Story 1120 TBP01.3/19 Apologies for Absence & Declaration of Interests 1120 TBP01.4/19 Minutes of the Board of Directors held on 28 November 2018 and matters arising Peter Molyneux, Chair For Approval A 1120 TBP01.5/19 Questions from Members of the Public View guidance on submitting questions here Oral 1120 TBP01.6/19 Chair s Report Peter Molyneux, Chair Board Site Visits Q3 For Information B 1125 TBP01.7/19 Chief Executive Report Sam Allen, Chief Executive STP Case for Change For Information C TBP02 /19 STRATEGY 1130 TBP02.1/19 Patient Flow Progress Report Simone Button, Chief Operating Officer For Information D 1145 TBP02.2/19 Estates and Facilities Strategy Sally Flint, Chief Finance Officer For Information E TBP03 /19 QUALITY 1200 TBP03.1/19 Quality Committee Report Gordon Ferns, Non-Executive Director For Information F 1205 TBP03.2/19 Integrated Performance Report Simone Button, Chief Operating Officer For Assurance G
3 1220 TBP03.3/19 CDS Presentation - East Sussex John Child, Service Director and Hamid Naliyawala, Clinical Director For Assurance Oral 1240 TBP03.4/19 Safe Staffing 6 Monthly Report Acosia Nyanin, Chief Nurse For Assurance H TBP04 /19 FINANCE 1255 TBP04.1/19 Finance and Investment Committee Report Martin Richards, Non-Executive Director For Information I 1310 TBP04.2/19 Finance Report Sally Flint, Chief Finance Officer For Assurance J TBP05 /19 GOVERNANCE 1305 TBP05.1/19 Board Assurance Framework Q3 Dom Ford, Director of Corporate Affairs For Assurance K 1315 TBP05.2/19 Charity Committee Summary Anne Beales, Non-Executive Director For Information L 1320 TBP06 /19 ANY OTHER BUSINESS TBP07 /19 Reflections Date and Venue for Next Meeting: 27 March :00-13:30 Langley Green Hospital, Conference Room 2
4 Sussex Partnership NHS Foundation Trust Board of Directors: 30 January 2019 Public Agenda Item: TBP01.4/19 Attachment: A For: Decision By: Rebecca Huth, Corporate Governance Administrator SUSSEX PARTNERSHIP NHS FOUNDATION TRUST Minutes of the Board of Directors Meeting held in Public on 28 November 2018 at 11:00 in the Training Centre, Swandean Present Peter Molyneux, Chair (PM) Sam Allen, Chief Executive (SA) Anna Van Der Gaag, Non-Executive Director (AVDG) Beth Lawton, Chief Digital and Information Officer (BL) Diane Hull, Chief Nurse (DH) Gordon Ferns, Non-Executive Director (GF) Jo Larbie, Non-Executive Director (JL) Rick Fraser, Chief Medical Officer (RF) Sally Flint, Chief Finance Officer (SF) Simone Button, Chief Operating Officer (SB) In Attendance Dan Charlton, Director of Communications (DC) Dom Ford, Director of Corporate Affairs (DF) Gavin Wright, Director of Human Resources and Organisation Development (GW) Nick Juba, Associate Non-Executive Director (NJ) Nick Lake, Clinical Director (NL) Rebecca Huth, Corporate Governance Administrator (RHu) (minutes) Observers Acosia Nyanin, Chief Nurse (effective from 03 December 2018) (AC) Alison Wallis, Clinical Director for Children and Young People s CDS (AW) Amy Herring, Lead Governor (AH) Arthur Mukando, Medical Staffing Rota Administrator (AM) Charles Young, Inspector, CQC (CY) Di Hickman, Service User Governor (DHi) Dr Swaraj Thancanamootoo, Specialist Registrar (ST) Elizabeth Hall, Public Governor (EH) Judy Abbott, Service User Governor (JA) Louise Patmore, Staff Governor (LPa) Louise Phillips, Inspection Manager, CQC (LP) Mel Smith, Service User Governor (MS) Ruth Hillman, Service Director for Children and Young People s CDS (RH) One member of public ITEM NO ITEM INTRODUCTION Page 1 of 11
5 TBP 48/18 Chair s Welcome and Introduction PM wished to welcome all those present to the meeting, in particular our three new Non-Executive Directors joining us today for their first Board of Directors meeting. PM wished to thank our existing Non-Executive Directors for giving more time and support to the Board over the past six months whilst we ve been recruiting. PM informed those present that today is DH s last day as Chief Nurse, as she moves on to another role closer to home. PM wished to thank DH on behalf of the Board for her work and commitment to patients and staff. TBP 49/18 Patient s Story PM advised that the Patient Story and CDS Presentation items will be taken together, and welcomed RH and AW to present. CDS Presentation Children and Young People s Service (ChYPS) AW explained that ChYPS is a broad service, covering Hampshire and Sussex, up to the Surrey border, providing early intervention and perinatal services. Our teams have a wide variety of contact with our population, from new-borns to adults, and take national policies into account to ensure we provide good, high quality services. ChYPS provide services over two Sustainability and Transformation Partnerships (STP) and over two care models in Hampshire and Sussex. AW discussed some current key areas of the service: Service review: The service is looking at the mental health and wellbeing pathways for ChYPS in Sussex, including the decreasing availability of other (external) services and the challenges we face with our medical workforce. We re aspiring to become the Trust of choice to support recruitment. Demand and Capacity: We re focusing on our demand and capacity to look closely at what the information is really telling us, such as what the demand is specifically for, and where our resources are going for capacity. We need to understand more what people s needs are when they come into our services and whether we re achieving our goals and delivering what we promise. Finally, to ensure we do our best here, we re ensuring all of our teams are aware of what we re doing as we need full service support to make these changes. What happens next: We want to provide the right service, at the right time, in the right place and we want to focus on earlier intervention. We re being proactive in our recruitment and our campaigns are all over social media, and once we recruit we re putting a huge focus on the retention of our staff. Other top priorities for our service are to expend availability of early family interventions and to safeguard our staff. We also have six projects or pathways being tried and tested by innovation, and we re raising the awareness of the pathways young children can go through, that don t always include a specialist mental health placement in the first stage. In order to make more contact with young children, we ve been making YouTube videos as we know young children are more likely to view these videos that leaflets or posters. We ve also created a special perinatal film to encourage people to use our services and trust them. PM thanked AW for her presentation. In discussion the Board raised the following issues :- Page 2 of 11
6 The range and number of clinical roles available and whether there were difficulties in recruiting psychiatrists; The broad remit of ChYPS especially now that the upper age limit for early intervention in psychosis has been lifted and the importance of the emphasis on early intervention to patient's lives as well as ensuring that employment advisers were embedded in EIP. In response it was explained that the CDS is increasing our non-medical prescribers to support the work load and it is also thinking about creating psychiatrist hubs, so our doctors can work in a number of areas and we can support our consultants to work as consultants. Following the lift in the upper age range for EIP the CDS has made some adjustments to our service delivery to ensure our transition is smooth. We are working with national colleagues to gain insight on how they are dealing with the change in age range. There will be an increased focus on prevention and to ensure that we are addressing any issues at an early stage. SA thanked AW and RH for the great presentation, and agreed that the Trust wants to be able to sustain delivery innovation. Patient Story (patient story played sound recording of a parent s experience with the service) The story showed that there were things that the service got right, and things that didn t go so well. The Board was reassured that the feedback has now been acted on. Action(s) Decision(s) TBP 50/18 None. None. Apologies for Absence & Declaration of Interests PM noted apologies from; Anne Beales, Non-Executive Director Lewis Doyle, Non-Executive Director Martin Richards, Non-Executive Director No further declarations were made. TBP 51/18 Minutes of the Board of Directors held on 26 September 2018 and matters arising There were no further comments on the minutes or actions. Action(s) Decision(s) TBP 52/18 None. Minutes of the Board of Directors held on 26 September 2018 were approved as an accurate record. Questions from Members of the Public No questions were received before the meeting. Page 3 of 11
7 Action(s) Decision(s) TBP 53/18 None. None. Chair s Report PM advised that a summary of Board member site visits are included in the report and we re continuing to plan visits to services, noting that visibility across the organisation is very important. Action(s) Decision(s) TBP 54/ visiting schedule to be agreed. None. Chief Executive Report SA wished to highlight two additional areas; Admin Conference We held our first conference for administration staff and after receiving the evaluation of the day we will share this and take our actions forward. Carers Rights Day 30 November 2018 We have a range of activities taking place on Carers Rights Day to promote the importance of our carers. AVDG noted the amount of quality improvement work going on throughout the Trust, and wondered whether the leadership programme the Board has been accepted on (noted in 2.11 of the Chief Executive report) is linked to the RubisQ Quality Improvement work, and if not, could it be. SA advised that this will be followed up before the start of the programme. Action(s) Decision(s) SA to check if the NHS Improvement: Leading for Improvement Programme is linked to RubisQ Quality Improvement. None. STRATEGY TBP 55.1/18 Interim Workforce and OD Strategy GW introduced the Strategy. He highlighted for the Board the commitments we ve made in the Clinical Strategy and our work plan for our workforce. GW explained that he s been spending a lot of his time so far in the Trust undergoing site visits to talk to staff, and wishes to make clear that the strategy is dependent on and contributes to other strategy enablers. GW added that if the strategy is approved, an action plan for the five themes highlighted within the report will be implemented over a two year period, with a lot of work already underway. In discussion the Board made the following points : Welcomed the focus on staff wellbeing and culture and was happy to support this work. Sought assurance about the level of engagement of staff in the development of the strategy and how we were going to introduce the new roles that are referred to in the strategy. Page 4 of 11
8 Sought clarification as to the main priorities and how we will measure the success of the strategy and whether it's making a difference. The importance of acknowledging how hard our staff work daily in respect of the priority outcomes and how much work our staff have already done e.g. we have 50 nurses coming in through our preceptorship academy and the work building on our peer support. The new roles and supporting individuals to do their role will make the real changes. Supported the emphasis on retention and the continued development of existing staff and the plans to further develop more psychologically informed processes. In response GW assured the Board that members from staff side and our governors had been actively engaged in the development of the strategy. GF confirmed that current staff have been involved in the engagement of developing new roles, that we acknowledge that acceptance of new roles can be difficult and we re sourcing guidance and advice on where the roles would best fit in. Successful implementation of the strategy will mean that the Trust has a clearer approach to staff retention than currently, placing health and wellbeing at the centre of this agenda, that the development of new roles and apprenticeships play a significant part in managing our workforce vacancies and that we have a culture based on fairness, learning and accountability. Furthermore, compliance with statutory and mandatory training and supervision will be embedded in day to day activity, overseen by managers with developed people management skills. On behalf of the Board PM thanked GW for his work on this in such a short space of time. Action(s) Decision(s) TBP 55.2/18 None. The Board of Directors approved the Interim Workforce and OD Strategy. Psychology and Psychological Therapies Strategy NL said that the Psychology and Psychological directorate includes 600 colleagues and the central team of senior leaders help to shape and lead the work. By creating and delivering this strategy we could better communicate the work we do and to tie this into other strategies to better support the work of all CDSs. The first version of the strategy will be led by staff in a bottom up approach, and we will have an underlying work plan to deliver our goals. Some of our key goals are introducing new roles, providing meaningful supervision and to like people up with a community to support innovation. GF asked how staff wellbeing of our broader employees will fit in with the strategy. NL advised that our role has been to add value into our carers and patients, but we re also focusing on staff here, to be more systematic and plan our approach to this work to involve all staff groups. RF supported this work and felt that there would be benefits in other directorates following this lead. RF asked how well our staff relate to the strategy. NL felt that our staff are finding out about how this fits in with our Clinical Strategy and we re continuing to engage and talk with them. AVDG felt that there are a large amount of people employed in the Trust who deliver psychological therapies, and asked to what extent this becomes something owned by those staff. NL acknowledged that we re not going to meet all of the psychological Page 5 of 11
9 needs out there, however we re looking at our role in supporting the development outside of the general staff group and to support the ownership of this in a joint up approach. On behalf of the Board PM Thanked NL for the work of the teams in producing the strategy. The Board recognised the influence this has on our patients and staff, and the importance to link this closely with our workforce and clinical strategies. Action(s) Decision(s) TBP 55.3/18 None. The Board of Directors approved the Psychology and Psychological Therapies Strategy. Communications and Engagement Strategy DC emphasised that our approach to communications is based upon targeted, twoway dialogue (rather than just broadcasting messages from the corporate centre) and promoting a narrative that is optimistic and credible (an approach defined as grounded optimism ). He described how our communications strategy is based upon evidence and best practice. DC highlighted the summary outcomes that will come from the communications strategy: 1. Continued focus on using evidence / feedback to evaluate and improve our communications activity (particularly in relation to internal communications / staff engagement) 2. Development of a clear, credible organisational narrative as part of the outcome of our strategy refresh process 3. Further work to explore how we can improve how our organisational reputation is perceived, in order to inform our strategic direction DC wished to acknowledge the importance of our communications and activity to show the deep understanding of the pressures staff and patients are under daily. DH advised that the nursing directorate will be forever grateful for the work and support of the communications team, particularly around recruitment, explaining that we ve showcased the improvements at Langley Green Hospital and we ve had service users creating recruitment films. GW felt that we need to continue to support our middle managers to ensure staff above and below are aware of Trust news. DC agreed that we need to communicate our organisational actions and objectives in a way that staff in all levels will understand. NJ felt that these have been three very interesting strategic documents presented one after the other, however queried how we re going to track the relationship between them, and how the three feed into or relate to our priorities for the organisation. JL agreed that the strategy is great, however felt that we need to continue the work on understanding what manager s feel our staff need to hear and be aware of. SF explained that she chairs the Disability Reference Group which provides documents in easy read, however realised that there is no member from communications on the group. AVDG was pleased to see the emphasis on learning disability services and accessible information, however asked how this information will be made available. DC advised that with this strategy we re bringing our work back to what our communications mean for patients and we ll be starting with our patients. Page 6 of 11
10 PM was pleased to see reputation management included in the strategy, adding that we need to know what this is to move forward. DC felt that the culture of our communications is so important, and we ll be using the staff and patient surveys to measure our reputation and triangulate the causes and consequences to identify what actions are needed to close the gap between image and identity adding that NHS Improvement are doing SA advised that these strategies are key for our overarching strategy refresh, and our project management office are reviewing the outcomes and objectives of these. SA requested that delivery of these three strategies are tracked and reported through the Board. Action(s) Decision(s) Review how we track our strategic plans in terms of delivery and interrelation, and ensure these fit in with our 2020 strategy refresh. None. QUALITY TBP 56.1/18 Quality Committee Report GF highlighted some areas; There is an increasing activity in our research areas, and feel that the Board could be more sighted on these areas the Research Assurance Committee reports to. There have been improvements in our statutory and mandatory training levels and we ve exceeded our target of 85%. Completion dates for serious incidents are improving; however we re working to allow the deadlines to be extended, where appropriate, to ensure all interested parties have been involved. The recommendations of the serious incidents are important; however the Board should note that some of the work will have been started before the reports are completed. It was suggested that we need to strengthen the interface between Clinical Academic Groups. It was agreed that the Board hold a development session to review research in the organisation, particularly research that relates to the Clinical Academic Groups, how we are closing the evidence to treatment gap and ensuring best clinical practice. Learning from Deaths RF explained that the purpose of this report is to ensure we are reviewing systematically the deaths of people receiving care. He highlighted that there were a high number of deaths in West Sussex for the quarter, however this relates to expected deaths in the various dementia services as the CDS cares for a later range of age. RF confirmed that a comprehensive review is undertaken for each death to extract themes out of the data, which we use to communicate between teams and gain learning. PM advised that we need to continue ensuring our learning from deaths is being embedded. Guardian of Safe Working Hours Quarter 2 Report and Presentation RF was pleased to report that we ve had no breaches during the quarter, and we re doing everything we can to implement an effective reporting structure, as our trainees from acute hospitals and GPs usually have different reporting structures. SA reported that she s attended a Junior Doctor induction as was really keen to Page 7 of 11
11 highlight this issue with them. She is clear that just because we don t receive any reports we can t assume that there are no issues. SA said she was assured the Junior Doctors know how to report issues as the Guardian has explained the process clearly to all. Junior Doctor Presentation ST presented his research on Junior Doctor satisfaction. He explained that a questionnaire has been distributed to our Junior Doctors, focusing on placement, education and training, career and pastoral support and safety at work. There were some really positive results. Highlights of the survey included; Junior Doctors gain experience in history taking, risk management plans and medication prescribing. Medication prescribing received mixed results in the survey, and ST felt that the training should be refreshed throughout placements. Top sources of stress included administration, knowledge and experience, difficult patients, emotional burden and isolation. Feedback on our trainers saw actively encouraging training, taking real interest and encouraging other experiences/specialities. The value of experience relating to doctor on call was varied, as was the handover between medical staff. We re talking to teams about how they can be more prepared for their handovers. How it feels overall to be a Junior Doctor at Sussex Partnership: supportive, good, experienced, education and isolation. Teams have created Wednesday afternoon sessions for Junior Doctors to gather and meet together to try and tackle isolation. Feedback also saw that our placements give Junior Doctors preparedness for future careers. Psychiatric placements overall are good, and we have an understanding of their stresses. In response to questions from the Board ST advised that: There are a few other areas, such as communication between psychiatric units and acute hospitals, adding that we could do some work to improve our referral process. That we appreciate the importance of separating educational and personal supervision and that this needs to be improved. RF thanked ST for his work, and noted that the solution for medical workforce is to grow our own workforce in this way. The data presented to the meeting is new and there is much to be done to implement the findings. Action(s) Decision(s) TBP 56.2/18 Update on Junior Doctor satisfaction within a year. None. Quality Improvement and Assurance Report SB advised that the key areas of concern to quality are demand and capacity in adult and children services. A review of team case load is being undertaken to support staff. We are aware that our demand and capacity issues relate to the high demand and difficulties of stepping down some patients, and all CDSs have action plans in place to support this and work around demand and capacity. With regards to waiting times in children and young people s services, one important issue is the lack of Psychiatrists available; however we have some good trajectories in Page 8 of 11
12 place showing improved performance, although there s still more to be done. In terms of patient flow, we continue to be challenged by the pressure on our system to provide inpatient beds. We ve had to place people out of area, with eight patients placed out of area today. We have a clinical bed manager in post and we have introduced this support out of hours as well. This has already had a good impact. In the next few months we re going to be implementing our psychiatric decision unit and also bringing in an extra capacity of six beds over the next three months; three in Meadowfield and three in Langley Green. These additional beds and our extra actions will support the reduction in out of area placements. Key areas of improvement include ongoing reduction in mixed sex accommodation breaches and significant improvements in physical health assessments. We ve made improvements in essential compliance training and our waiting times for early intervention to psychosis and improving access to psychological therapies are both performing well. Also, we have a downward trajectory for agency spend and this is no small measure to the hard efforts of all nursing and medical staff. PM thanked SB for the comprehensive update, acknowledging there are significant pressures, and noting the improvements. Given the importance of waiting times to patients the Board wanted to ensure that those involved in making these improvements happen were thanked and appreciated. PM asked how we re going to assure ourselves on the progress of appraisals and supervision. SB advised that all teams are collating information on their supervisions for this year and then we re going to look at how we can view this electronically. PM asked what reduction we re hoping to achieve with delayed transfer of care and external placements, and by what interventions. SB advised that we re tracking individual cases and trajectories, as well as looking at our bed requirements for busy periods. PM felt that we need to invest to save as there s significant evidence that this will have an impact. SF advised that we need to secure funding from the commissioners and we re pushing this. GF asked how we know the additional six beds will be enough. SA advised that per 100,000 population we are 1.5 beds short, so we re flexing our capacity to respond to demand. We re usually reluctant to invest in inpatient units as we know the answers are in the community and early intervention, but we feel that the six additional beds will support our demand while we made additional improvements. PM asked that the Board was provided with an analysis of what improvements were planned and what impact they were anticipated to make over what timescale to ensure that we have the right care, in the right place at the right time. SA responded that we re currently lobbying for increased investment in our services. Action(s) Decision(s) TBP 56.3/18 SA to circulate her presentation from a recent STP meeting regarding pressures to the Board. None. CDS Presentation (Children and Young Peoples Services) Taken under the Patient Story item. Action(s) Decision(s) None. None. Page 9 of 11
13 FINANCE TBP 57.1/18 Finance and Investment Committee Report The report was noted with no further comments. Action(s) Decision(s) TBP 57.2/18 None. None. Finance Report SF advised that at month 7 the Trust is making a surplus, however we currently remain behind plan due to the agenda for change pay award not being fully funded. We re continuing conversations with NHS Improvement and we recognise that we re not the only organisation facing this. In addition to the pay award, other areas are driving a deficit position. External placements are an on-going pressure. We have made good progress on our reduction of agency spend. We are currently behind on our service improvement plans, however most savings will be delivered at the end of the year. In terms of resource use, we re sitting at a rating of 2 which is a good place to be. Our best, mid and worst cases are outlined in the report, however if we don t deliver on our saving plans, we could miss out on a one off 2m sustainability funding reward. We re currently working on our 2019 plan, which will come to the private Board in January 2019 for approval in March The Board raised the following points:- The over-spend in inpatient units and the under-delivery on our service improvement plans and sought assurance that the team has confidence in the steps being taken to address this.. Whether there were decisions needed of the Board to support a move towards being in run-rate balance. Whether she feels the issues in Coastal West Sussex are going in the right direction and if the issues are being addressed. Whether the figures in the report make up the difference in our best, mid and worse case forecasts and where we can get assurance on the positive and negative drivers. Assurance was provided that we can evidence how we offset to meet the best, id and worse case forecasts and that this is reviewed by the F&I Committee. SF advised that detailed work to review progress in Coastal West Sussex is ongoing. The shortfall is primarily caused by the redesign which has slipped into the next year. SF wished to note that the Executive Assurance Committee & Finance and Investment Committee review the Trust finances very carefully and the team are very clear on what we need to achieve. Action(s) Decision(s) Finance and Investment Committee to review the Finance report, the content and how the information is detailed None. Page 10 of 11
14 GOVERNANCE TBP 58.1/18 Board Assurance Framework DF advised that the Board Assurance Framework was discussed in detail at the Audit Committee. Key risks at the end of Q2 are access to services, services working in a joined up way and recruitment and retention. PM asked that between now and the next meeting we look at the mitigations and what we re relying on, as he is unsure that these are the mitigations we rely on at the meeting. Action(s) To re-assess the Board Assurance Framework mitigations for Q3. Decision(s) None. TBP 58.2/18 Audit Committee Report The report was noted with no further comments. Action(s) Decision(s) None. None. TBP 58.3/18 Charitable Funds Committee Summary Report The report was noted with no further comments. Action(s) Decision(s) None. None. TBP 58.4/18 Use of the Trust Seal The report was noted with no further comments. Action(s) Decision(s) TBP 59/18 None. None. Any Other Business There was no further business. Date and Venue for Next Meeting: 30 January :00-13:30 Training Centre, Swandean, Trust HQ Signed. Date.. Peter Molyneux, Chair Page 11 of 11

15 Action Date Sussex Partnership NHS Foundation Trust Board of Directors 30 January 2019: Public Agenda Item: TBP01.4/19 Attachment: A For: Approval By: Rebecca Huth, Corporate Governance Administrator MATTERS ARISING: ACTION POINTS FROM THE BOARD OF DIRECTORS HELD IN PUBLIC ON 28 NOVEMBER 2018 Minute Reference Action Points Lead Action Required TBP 53/ visiting schedule to be agreed. Sam Allen On-going: Visibility being improved by Quality and Safety Review visits and individual site visits TBP 54/18 SA to check if the NHS Improvement: Leading for Improvement Programme is linked to RubisQ Quality Improvement TBP 55.3/18 Review how we track our strategic plans in terms of delivery and interrelation, and ensure these fit in with our 2020 strategy refresh. Sam Allen Sam Allen Complete: Sam has checked and confirmed that the work is linked with the programme. Complete: Progress on strategic plans will be reported to the Executive Management Committee and Board and incorporated in the Page 1 of 2
16 Action Date Minute Reference Action Points Lead Action Required strategy refresh TBP 56.1/18 Update on Junior Doctor satisfaction within a year. Rick Fraser Complete: Scheduled for November TBP 56.2/18 SA to circulate her presentation from a recent STP meeting regarding pressures to the Board TBP 57.2/18 Finance and Investment Committee to review the Finance report, the content and how the information is detailed TBP 58.1/18 To re-assess the Board Assurance Framework mitigations for Q3. Sam Allen Sally Flint Dom Ford Complete: SA circulated following the meeting. Complete: To be included in January 2019 report. Complete: To be included in 30 January 2019 report. Page 2 of 2
17 Report to Board of Directors Agenda item TBP01.6/19 Attachment B EHRIA code N/A Date of meeting 30 January 2019 Format of Paper Title of paper Chair s Report Written Author Peter Molyneux, Chair Oral Presenter Peter Molyneux, Chair Presentation Committees/meetings where this item has been considered N/A Purpose of report (tick all that apply) To provide assurance For decision Regulatory requirement To highlight an emerging risk or issue To canvas opinion For information To highlight patient, carer or staff experience Strategic Goals (tick all that relate) 1. Safe, effective, quality patient care 2. Local, joined up care 3. Put research, innovation and learning into practice 4. Be the provider, employer and partner of choice 5. Living within our means Summary of Report In this report the Chair will update the Board of Directors on a number of areas, discussions and activities. Recommendation The Board of Directors is asked to note the report and ask any questions of the Chair. Page 1 of 4
18 1. INTRODUCTION In this report the Chair will update the Board of Directors on a number of areas, discussions and activities. 2. REPORT 1. Chair Site Visits 1.1. Orchard House Site Visit 09 January 2019 I visited Orchard House, a Community CAMHS Team in East Sussex. It was clear that there has been significant progress in this service with improved office space and new consulting rooms and a full complement of substantive staff. This has been a significant achievement and is appreciated by patients and staff. There are significant challenges with carrying out assessments in a timely way and waiting times to access treatment are a serious issue. There are number of issues driving the increased demand and the increased complexity that the team is dealing with - some of which should be picked up by the Emotional Well Being Services Review. There are issues with part time staff driving between three local centres - but local access is appreciated by patients and families. In terms of what would make a difference staff were very realistic. It would be good to have a more intuitive version of Care Notes but this is a major project. People also recognised that logging on has become easier. One suggestion of what would become easier would be to have QR codes for direct reports and a phone app to make recording supervision easier. 1.2 Department of Psychiatry Site Visit 14 January 2019 I visited the Department of Psychiatry in Eastbourne, which compromises of three Adult Inpatient Wards. It was good to visit Heathfield Ward and to see the service that won the Bethan Smith Award this year. This was a well run ward with a good relationship between staff and patients. It was good to see to hear that there were improved arrangements for managing the links between physical and mental health - although these are to be fully tested. Given the emphasis being placed on risk profiling and the need to deliver integrated services for those people who experience frailty in older age we will need to make sure that our older peoples services are organised in the right way. If the ambition of the 10-year plan is to be realised then we need to be organised in a way that enables integration to take place. The male acute wards were under pressure with high turnover and high levels of acuity. There were a number of newly arrived patients who had complex needs and potentially high risk behaviour for whom staff had yet to establish early warning signs. The service was fully staffed with two qualified and three unqualified staff. The services had good insight into their strengths ad weaknesses and had identified opportunities to innovate. The services are delivering high quality care in a sub-optimal physical environment. The team shared with me their remedial plans and their longer term plans to improve the quality of accommodation for both staff and patients. Page 2 of 4
19 2. Meetings and Events 2.1 CEO Briefing Event - 3 December 2018 I attended the CEO Briefing Event, which gave staff the opportunity to hear the expected plans and outcomes for the NHS 10 Year Strategy, and to be involved in reviewing and refreshing our own Organisational Strategy. 2.2 Quality Improvement (QI) Silver Training 04 December 2018 I undertook the QI Silver Training with a number of Board members and Senior Leaders. 2.3 Chief Executive and Chair s Network 06 December 2018 I attended the Chief Executive and Chair s Network hosted by NHS Providers. The agenda for the day focused on; Planning for 2019/20 and the NHS long-term plan Future challenges and opportunities for the NHS Brexit implications, challenges and actions Reverse Mentoring Strategy and Policy Updates Annual General Meeting 2.4 STP Oversight and System Forum 10 December 2018 The STP Case for Change is appended to the Chief Executive s Report on the agenda for 30 January 2019 Board of Directors. 2.5 NHS Confederation Parliamentary Reception 18 December 2018 I attended the NHS Confederation Parliamentary Reception which had a focus on the following; NHS budget increase how best to use this over the next five years Impact of Brexit New technologies and their potential to transform service delivery Finding a sustainable solution for social care services 2.6 Sussex Community Trust, Chair & Chief Executive Meeting 08 January 2019 I met with Peter Horn (Chair) and Siobahn Melia (Chief Executive) to discuss how the 10- year plan is likely to develop community services. We have good examples of joint working and a good foundation on which to build further cooperation. We agreed to make sure that these examples are part of the conversation as we develop our understanding of place within the proposals. We will also look to find new ways of exploring how we can ensure that local people experience an integrated approach to their physical and mental health. I met with the Vice Chancellor of Sussex University, Professor Adam Tickell, and had a good conversation about the possibilities for cementing our relationship with the University and opportunities for development. 2.7 Citizens UK I met with Citizens UK who are establishing a chapter in Brighton and Hove. Citizens UK exists to find solutions to complex issues. They promote local community networks and seek to connect civil society to power for social gain. Their initial partners are the Diocese of Chichester and Sussex University. They are launching at the end of April at BHASVIC. They have good examples of where they have influenced the development of NHS services - especially CAMHS - and amplified the voice of those who struggle to access services or have complex needs that require a community response for interventions to be effective. Page 3 of 4
20 2.8 I have also attended; Langley Green Hospital Christmas party on 19 December 2018 Mental Health Network Dinner with CQC guest speakers on 15 January Joint Board and Council of Governors Session On 07 December we held a Joint Board and Council of Governors session with a range of focuses includeing; System Redesign and Integrated Care Systems Changes to investment in supported housing for West Sussex Future discussions for the Council of Governors We also had an external facilitator join us to discuss Developing Best Practice in Board and Council Relationships. It was a very positive day with great attendance and involvement from both the Board of Directors and Council of Governors. I am scheduling individual informal meetings with our Governors to further develop the relationship between the Board of Directors and the Council of Governors, and to provide Governors the opportunity to have more discussions and involvement in a less formal setting. 4. Upcoming Events/Visits Before the end of Janaury I will be attending the following; Medics Conference - 23 January 2019 HSJ Transforming Mental Health Summit - 24 January 2019 New Park House Site Visit - 29 January RECOMMENDATION The Board of Directors is asked to note the report and ask any questions of the Chair. Page 4 of 4
21 Report to Board of Directors Agenda item TBP01.6/19 Attachment B EHRIA code N/A Date of meeting 30 January 2019 Format of Paper Title of paper Board Site Visits Q3 Written Author Rebecca Huth, Corporate Governance Administrator Oral Presenter Peter Molyneux, Chair Presentation Committees/meetings where this item has been considered N/A Purpose of report (tick all that apply) To provide assurance For decision Regulatory requirement To highlight an emerging risk or issue To canvas opinion For information To highlight patient, carer or staff experience Strategic Goals (tick all that relate) 1. Safe, effective, quality patient care 2. Local, joined up care 3. Put research, innovation and learning into practice 4. Be the provider, employer and partner of choice 5. Living within our means Summary of Report CQC identify in their Well Led domain that direct senior knowledge of services will contribute to high quality and good governance. Direct engagement with staff enables Board members, in particular independent Non- Executive Directors, to verify for themselves the issues being highlighted to them at the Board. It also enables staff at all levels to have access to the Board. For these reasons board members are actively encouraged to regularly visit services across the trust. Recommendation The Board of Directors are asked to note the contents of this report. Page 1 of 2
22 1. INTRODUCTION The list below outlines the services and CDSs which have been visited by Board members in the last quarter. 2. REPORT Brighton and Hove CDS Rutland Gardens Mill View Hospital Forensic Healthcare HMP Ford East Sussex CDS Woodlands Bramble Lodge, Woodlands St Raphaels Department of Psychiatry Amberstone Hellingly (Elm Ward & Education and Training Team) Beechwood Iris Ward Cavendish House, Learning Disability Service Older Adults Mental Health Team, Hastings CAMHS Orchard House Care Home Plus Lindridge West Sussex CDS Acre Day Hospital Chalkhill Langley Green Crawley Road Shepherd House Meadowfield Chichester Centre Connolly House Harold Kidd Unit CRHTT Meadowfield 3. RECOMMENDATION The Board of Directors are asked to note the contents of this report. Page 2 of 2
23 Report to Board of Directors Agenda item TBP01.7/18 Attachment C EHRIA code Date of meeting 30 January 2019 Format of Paper Title of paper Chief Executive Report Written Author Sam Allen, Chief Executive Oral Presenter Sam Allen, Chief Executive Presentation Committees/meetings where this item has been considered Purpose of report (tick all that apply) To provide assurance For decision Regulatory requirement To highlight an emerging risk or issue To canvas opinion For information To highlight patient, carer or staff experience Strategic Goals (tick all that relate) 1. Safe, effective, quality patient care 2. Local, joined up care 3. Put research, innovation and learning into practice 4. Be the provider, employer and partner of choice 5. Living within our means Summary of Report In this report the Chief Executive will update the Board of Directors on a number of areas relating to local, regional and national issues. N/A Recommendation For the Board of Directors to note the report and ask any questions of the Chief Executive. Page 1 of 4
24 1. INTRODUCTION 1.1 The purpose of this report is to provide a summary from the Chief Executive of information relating to Sussex Partnership colleagues and clinical services along with an overview of relevant regional and national items of interest. 2. REPORT 2.1 NHS Long Term Plan The NHS Long Term Plan was published earlier this month. I welcome the focus on mental health and learning disabilities and the importance of integrating care. I am pleased the plan aligns well with our clinical strategy and the system-wide mental health strategy developed with our health partners. The development of 24/7 crisis services is a key priority and I am pleased to report our STP has prioritised 1.3m investment for the development of 24/7 crisis services across Sussex. 2.2 STP Population Health Check The Population Health Check (appendix a) for Sussex and East Surrey has been developed by the Sussex & East Surrey Sustainability and Transformation Partnership (STP) Clinical and Professional Cabinet. Membership of the Cabinet includes the Medical Directors and Clinical Chairs of partner organisations, as well as representation from Chief Nurses, NHS England, Public Health, the Academic Health Science Network and the Clinical Senate. The Population Health Check represents a diagnostic for our system and highlights the priority areas that need focus to allow health and care services to better meet the needs of our populations. It builds on local plans and intelligence and aims to provide a unified picture of the key areas for change across the health and care system. There are five priority areas highlighted in the Health Check: Workforce and capacity strategy. Shared decision-making and patient activation. Re-framing our cultural norms to make the right lifestyle choices easy to make. Addressing unwarranted clinical variation. Mental and physical health services and social services closer to home with good communication and co-ordination. The Population Health Check has been endorsed by the STP Executive, which is made up of the Chief Executives from all statutory NHS organisations across Sussex and East Surrey. It is going through the NHS Boards / Governing Body meetings of each of these organisations in January and February. The STP Clinical and Professional Cabinet will now be using the information outlined in the Population Health Check to develop a clinical strategy for the population. As the strategy is developed, a sustained period of engagement will take place with patients, staff, public, clinicians and other stakeholders. This engagement process will be called Our health and care Our future and will provide the opportunity for the strategy to be co-produced and informed by patient, public and staff feedback. The strategy will be aligned to the delivery of the NHS Long-term Plan. 2.3 Refreshing Our 2020 Vision Our work continues on the refresh of our organisational strategy, Our 2020 Vision. Page 2 of 4
25 Engagement sessions have started and will continue into February. 2.4 Mental Health Safety Improvement Programme I am pleased our two psychiatric intensive care units (Amber and Pavilion Wards) are participating in the first national mental health safety improvement programme. The programme is focusing on reducing the use of restrictive practices and complements our own quality improvement work focusing on this. 2.5 Winter Planning The STP has received a detailed update on all winter planning across the system. Demand was managed well over the December period however it has increased across all providers during January. This has also coincided with an increase in reported cases of influenza and delayed transfers of care. In late December we received resilience funding from NHS England and this enabled us to open an urgent care lounge at Langley Green Hospital. The Board is receiving an update today on our ongoing work to support Patient Flow through our services. Essentially this is about ensuring we deliver the right care in the right place at the right time. 2.6 Care Quality Commission The CQC published their recent inspection report for The Lindridge in December I am pleased to report that following four years rated as requires improvement Lindridge nursing home has been rated overall as Good. A new Registered Manager has recently been recruited and the improvements made since the last inspection continue to be embedded. The Care Quality Commission (CQC) will undertake a Well-Led Inspection at the Trust on February. 2.7 WRES Experts Programme Our Equality and Diversity Lead, Cassandra Blowers, is attending the second national Workforce Race Equality Scheme (WRES) experts programme. The programme is designed to support NHS Trusts make improvements against WRES. The Trust Equality and Diversity Steering Group met in January and received the latest update on progress. A WRES working group has been established to review progress and actions being taken for each indicator. 2.8 Flu Campaign At the time of writing this report 78% of our frontline staff have had the flu vaccination. This is a record uptake of the vaccine for the Trust and I commend our Physical Health Team and Peer Vaccinators. 3. Executive Management Committee The Executive Management Committee met on 22 January. This new meeting comprising of Executive Directors and a representative from each Care Delivery Service. It replaces the Executive Assurance Committee and Service Delivery Board (terms of reference attached at appendix b). The items considered included: Quality Improvement and Assurance Report Patient Flow Mental Healthline CQC Improvement Plan Page 3 of 4
26 Serious Incident Report Essential and mandatory training Annual Plan Quarter 3 objectives Data Quality Plan Commercial Report Finance Report Freedom to Speak Up Strategy Board Assurance Framework 3. Recommendation 3.1 For the Board of Directors to note the report and ask any questions of the Chief Executive and review and endorse the STP Population Health Check Page 4 of 4
 OUR")

27 Sussex & East Surrey Sustainability & Transformation Partnership (STP) OUR POPULATION HEALTH CHECK A CLINICALLY-LED DIAGNOSIS OF WHAT NEEDS TO CHANGE

28 SUBHEAD STYLE Contents Introduction Introduction What is this population health check? Why do we need an STPpopulation health check when we already have local plans? How do we offer best value? What did we find are the key themes? What do we need to change to address these key themes? Our Population Health Check in context What we found: our evidence base Our evidence: Our Population and Demographics Our evidence: Our Public and our Patients Our evidence: Our Services Our evidence: Our Staff Our evidence: Our Infrastructure Our Priorities Next Steps We need to develop a clinical strategy which delivers best value and patient centred care. We need to develop a clinical strategy which is future proofed We need to develop a clinical strategy which is clear on the optimal population size to lead delivery The process of developing the clinical strategy Agreement from core members of the STP Clinical and Professional Cabinet Contribution list References and bibliography We have many great services and people, delivering great care. However, there is an urgency to address the gaps in the quality and responsiveness of some of our services. There has been an under-investment in prevention and self-care and not enough emphasis on wellbeing and care. Services are not operationally or financially sustainable in the current set-up, which is based on historic and isolated services, not built around what local people need now. In essence, there is less partnership working than we need between patients and clinicians and between services. Given our demography, we need to rely as much on technology-enabled care as on state funded clinical and domiciliary workforce. There just won t be as many employees available in future as would be needed to provide current services to a larger population with more retired people and not many more working-age citizens. This Population Health Check represents a case for change and provides the evidence of the key issues and the priorities we will deliver together to ensure we offer sustainable services. Doing nothing is neither affordable nor sustainable Dr Minesh Patel and Mr Peter Larsen-Disney, Co- Chairs, Sussex and East Surrey STP Clinical and Professional Cabinet 2 3
29 OUR POPULATION HEALTH CHECK OUR POPULATION HEALTH CHECK Population Health Check This Population Health Check has been developed and agreed by a STP group called the Clinical and Professional Cabinet, which consists of the most senior medical and nursing leaders across our partnership. l We will be consistent with our messages on increasing population health and well-being and the importance of delivering value for money. l We are able to identify and work together on addressing unwarranted clinical variation to deliver value for money services across the system. l We will work together to improve communication and collaboration across the system and between clinicians and the public to enable decision based on objective, best value evidence and conversations. The STP is not one single separate plan. It is a way of making sure that the plans of all the partners across the area are joined up and working WHAT IS THIS POPULATION HEALTH CHECK? This document is a diagnostic analysis of the key issues we are facing in our local health systems today. This analysis provides the strong evidence base we need for the next phase, which will be an STP-wide Clinical Strategy. The overall goal of the Population Health Check is to identify the challenges facing our population s health and our system s sustainability in order to develop a strategy, which will see people living with better health that is value focussed and patient centred. WHY DO WE NEED AN STP POPULATION HEALTH CHECK WHEN WE ALREADY HAVE LOCAL PLANS? Our STP is comprised of four places responsible for locally driven community and integrated care with the aim of improving health outcomes for our communities and reducing avoidable illness and health and care expenditure. Each place is building a model that best responds to both the local health needs and context of the health and care organisations in the region, however many commonalities exist between them. Each place will oversee radical clinical transformation of Long Term Conditions, frailty, mental health, community, social care, general practice and urgent services to transform outcomes and quality. The STP is not one single separate plan. It is a way of making sure that the plans of all the partners across the area are joined up and working together. It aims to ensure that no part of the health and care system operates in isolation. We know that what happens in GP surgeries, for example, impacts on social care, which also impacts on hospital wards, and so on. With services feeling the strain, working together will give our nurses, doctors and care staff the best chance of success. l We will support each other to manage the impact of the 3Ts development at Brighton and Sussex University Hospitals NHS Trust (BSUH), which will reduce bed capacity in the short term through collaborative redesigning our model of services to enable care closer to home (delivering the lowest level of effective care). l We will provide STP-wide senior clinical support for local plans which may help the pace of change, with consistent messaging on delivering value based services. l We will develop simpler collaborative commissioning, whilst maintaining local engagement and ownership, to make best use of limited resources and to integrate care for patients, l We will share best practice and offer support on implementation of local transformation plans to deliver better value care at a faster pace, l We will further develop the skills of clinical leadership, workforce development and resilience through learning from others outside our neighbouring systems, l We will support consistent access to supportive mental health services to reduce costly reactive responses to crisis care. l We will develop system-wide digital technology to support communication across the system, l We will contribute to the strategic planning for the development of estates to ensure we are able to deliver care closer to home across the system. l We will provide consistent key message to the public so that A&E is not the option chosen as the urgent care option but that the public understand We are able to identify and work together on addressing unwarranted clinical variation to deliver value for money services across the system together. The added value of an STP Population Health Check, which 4 complements those Place Based Plans and delivers best value is: the benefits of accessing alternative services in the community. 5

30 OUR POPULATION HEALTH CHECK SUBHEAD STYLE The inexorable rise in demand for healthcare and growing pressures and constraints on the workforce and finance threaten the sustainability THE SYSTEM WILL, THEREFORE, COME TOGETHER ON ISSUES WHICH MAKE SENSE TO DO TOGETHER. Some of these initiatives, such as the STP Mental Health Strategy, are already underway and demonstrating significant improvements. However, it is crucial that the changes identified throughout are interconnected with the delivery of the STP Mental Health Case for Change, Mental Health Delivery Plan, Mental Health Workforce Plan and the identified Mental Health priority work streams and vice versa. This will then emphasise the importance of parity of esteem where mental health is valued equally with mental health. For example some of the changes will impact and are interdependent with this overall STP Population Health Check e.g. impact of Improving Access to Psychological Therapies (IAPT) Long-term conditions developments on Diabetes, Musculoskeletal (MSK) and Cardiovascular, the life gap for people with severe mental illness and the high proportion of smokers having an severe mental illness. Also the mental health Crisis & Urgent Care workstream need to work closely with the Urgent and Emergency Care workstream. HOW DO WE OFFER BEST VALUE? We need to offer best value care to our patients. In July 2017, the South East Clinical Senate produced a briefing entitled Emphasising Quality, Delivering Value (South East Clinical Senate 2017a), which recognises that: l The inexorable rise in demand for healthcare and growing pressures and constraints on the workforce and finance threaten the sustainability of the NHS. For clinicians across all disciplines, this means that we need to focus our combined resources on the care that delivers the greatest value. l Value in healthcare is defined as the achievement of the best outcomes for individual patients and for the public within available resources. It also means doing less of things that add little or no value to patients. l To achieve best value will require the development and use of standardised outcome measures that are more relevant to patients (such as the impact on their functional status and wellbeing), and their more active involvement through the process of shared decision making with well-informed patients. It also involves recognising unwarranted local variation in the delivery of high value care and addressing it. l Value is not a financial term. It is a term that integrates high quality, safe and cost effective care that improves patient or population outcomes. It can be represented as follows: VALUE (of an intervention) OUTCOME (health and social) RESOURCED REQUIRED (to deliver the coutcome) Forward View. The first principle within the New Care Models to engage people and communities is that care and support is personcentred: personalised, coordinated, and empowering. Person-centred approaches has recently beenpublished by Skills for Health, Skills for Care and Health Education England as a core skills education and training framework for the health and care workforce. l We need to begin focusing on assets and what matters to people rather than what s the matter with people. We need to improve communication between services. The way that clinicians work together in providing care to individual patients, and how they communicate with each other, is vital to providing an integrated, coordinated, patient-centred approach, and for delivering the best experience of care and outcomes for patients. Phone calls and conventional letters have been the default means of communication for decades, whilst over time technological changes, increasing specialisation, the need for greater efficiency, changing organisational and professional boundaries, and changing patient expectations, have ceaselessly evolved. (SE Clinical Senate. 2017b) WHAT DID WE FIND ARE THE KEY THEMES? We found that: l There are four main unhealthy behaviours of smoking, alcohol misuse, poor diet and lack of physical activity, as well as poor emotional and mental well-being, which are responsible for at least a third of ill health and are amenable to cost-effective preventative interventions. Focusing on prevention earlier in the life-course will accumulate greater benefits, but even in middle and older age groups, preventative approaches are cost-effective. Prevention requires prioritisation and investment across of the NHS. 6 l Better Conversations is a fundamental part of delivering the Five Year the system. This includes the need to treat symptoms early in primary 7 =

31 SUBHEAD STYLE OUR POPULATION HEALTH CHECK The population is getting older, many more people live with multiple chronic diseases, people are seeing their doctor more often and with more complex care to stop the development of a long-term condition. To date, across our STP, there has been an under-investment in prevention and self-care and not enough emphasis on wellbeing and care. l There were 1,314 stillbirths in the South East between , equating to roughly 36 stillbirths per month. A large proportion of stillbirths are attributable to risk factors some of which are fully or partly avoidable, indicating an opportunity for rate reduction. Independent risk factors for stillbirth include: obesity, smoking, acquired medical disorders (diabetes) and disadvantaged populations. l The STP covers a wide geographical area and many organisations, with a notable amount of variation in financial performance. For 2017/18, the combined net deficit (surpluses and deficits added together) for Clinical Commissioning Groups (CCGs) and Trusts in the footprint was 228.2m. l There is significant expected growth in the population generally and an enormous growth in the 65+ and 85+ age groups. Significantly, this includes an increase in life expectancy for people in poor health. One in three over-65s and half of those over 80 will suffer a fall each year. In addition to the physical consequences, falls can have a damaging psychological impact, resulting in loss of confidence and independence, and increased isolation and depression. The Department of Health has stated that a falls prevention strategy could reduce the number of falls by 15-30%. l Pressures on our GP services are critical causing issues with access for patients and staff stress. General Practice across the country is struggling to maintain services, and this situation is mirrored in Sussex and East Surrey. The population is getting older, many more people live with multiple chronic diseases, people are seeing their doctor more often and with more complex problems. General Practice has coped well so far, but we need to address these issues if we are not to face much bigger problems. l We have significant workforce shortages across the system, in particular in GP surgeries, mental health and social care, with increasing demand. l There have been many years of under-investment in estates, which has resulted in non-compliance, high backlog maintenance and an inefficient estate with high running costs. This hampers our ability to shift care closer to home. l Bed capacity is expected to increase by 176 beds by 2023/24 at BSUH as a result of the 3Ts rebuild. However, in the meantime, there will be a detrimental impact on capacity which needs to be supported across the wider system. l Care is often un-co-ordinated and duplicated leading to poor quality care with multiple hand-offs. The supportive systems are often difficult for the public to navigate, resulting in increased attendance to A&E. l Communication between clinicians across organisations and between clinicians and patients requires improvement. l We have a high level of mental illness and dementia, with the need to increase access to supportive services. l Digital technology needs to better support integrated care, population health management and empower patients in managing their care. We have not been good at establishing systems for self-support which are cheap, cost effective and improve outcomes (patient held records, patient educational materials /fora via online platforms for example) despite 90% of the population owning a smartphone / tablet or PC. l We have unmet need at one end of the spectrum and unnecessary and/or non-evidenced treatments at the other with variably informed decision-making in the middle. l There is variation across the trusts in delivering our constitutional standards (the standards everyone should expect) including Referral to Treatment Times (RTT), emergency admissions, Delayed Transfers of Care, bed occupancy, cancer waits and A&E 4-hour performance. l Our data shows us we have significant unwarranted variation across the STP that are impacting on quality in many areas but particularly in MSK, Cardiovascular and Falls/Fragility Fractures. There is also evidence that we over treat patients in some specialties. l Too many people are dying away from their usual place of residence or in a place that is not of their choosing. l Doing nothing is neither affordable nor sustainable. Digital technology needs to better problems. 8 9 support integrated care, population health management and empower patients in managing their care.

32 OUR POPULATION HEALTH CHECK WHAT DO WE NEED TO CHANGE TO ADDRESS THESE KEY THEMES? We concluded that: We have not focussed enough on promoting the determinants of good health because: l There remains considerable, and unacceptable, differences in life expectancy between areas across the STP and within local CCG / local authority areas. Service access, take up and outcomes need to be addressed for disadvantaged groups. l There are several points of contact for access to services, fragmented pathways and gaps in service availability (geographic and time of day), particularly around admissions avoidance and to support hospital discharges. Our patients with mental health needs are not always able to access support when they need it because: l There is a lack of a 24/7 crisis support. l There are four main unhealthy behaviours of smoking, alcohol misuse, poor diet and lack of physical activity, as well as poor emotional and mental well-being, which are responsible for at least a third of ill health and are amenable to cost-effective preventative interventions. l Focusing on prevention earlier in the life-course will accumulate greater benefits, but even in middle and older age groups, preventative approaches are cost-effective. Prevention requires prioritisation and investment across the system. Prevention includes the reduction of falls in the elderly and healthy living to reduce still births. In order to keep up with increasing demand, we need to collaboratively redesign our service models to bring care closer to home because: l There is an imbalance of bed/un-bedded capacity and demand in acute, primary, community and social care. l BSUH is undergoing a significant re-build programme through 3Ts, which will have an impact on bed capacity until it is completed. l We want more people to die in their usual place of residence and place of choice. l Capacity needs to be built in primary care, closer to home and thereby reduce presentations and referrals to physical and mental health secondary care. l The prevalence of severe mental illness is 5% higher than nationally, affecting 25,000 individuals l For dementia, prevalence is 25% higher than nationally, will increase further as the population ages, while the proportion of those with a diagnosis is 5% lower. A quarter of those patients with dementia who are fit to leave acute care wait over 50 days for discharge. l There is an increasing problem of addiction and its impact on the individual and the system. We do not have the workforce numbers and skills to meet current and future demands because: l There is an imbalance in staffing capacity and demand across the whole health and social care system. This includes front line staff providing direct patient/client care, back office staff, and key services e.g. pathology and radiology. There is an increasing problem of addiction and its impact on the individual and the system. l Bringing care closer to home, cannot be delivered without addressing the issue that the sustainability of primary care is significantly challenged across the system. Dedicated effort to address primary care challenges is crucial. Our Urgent and Emergency Care services cannot keep up with demand because: l Attendances to A&E and handover delays continue to put immense pressure on our services. l Over a quarter of A&E attendances could be treated at another suitable location e.g. primary care. l The average retirement age is 59 and we have 15 % of staff aged 55 years and over. l The turnover rate for all registered nursing, midwifery and health visiting staff ranges from 13% - 20%. l In social care there is a significant annual turnover of 26% for registered nurses. l There are difficulties recruiting and retaining substantive mental health nurses and psychiatrists. 10 l In June 2017, the Sussex and East Surrey STP had a shortfall of GPs 11 (Full-time equivilants) of 193.
 Direct Care")
33 OUR POPULATION HEALTH CHECK OUR POPULATION HEALTH CHECK We need to enable our workforce to have conversations which enable patients to make the right decision about care Our digital technology does not meet current and future needs because: l There is a lack of ability and confidence to access shared information to support for Clinicians, professionals, patients and carers in: (a) Direct Care and Self-Management, (b) Population Health Management and Evaluation, (c) Research and Innovation. l Digital systems do not yet integrate effectively enough to support new models of care or meet expectations. l There is a lack of health and care services digital maturity, partnerships and agility to take advantage of the opportunities of emerging technologies (e.g. Artificial Intelligence (AI), Precision Medicine, Internet of Things) There is a lack of demand management to create the most efficient pathways because: l There is a lack of working practice changes required to encourage channel shift. l There is a lack of standardised communication and engagement strategies to reduce demand on the system. l Communication between clinicians across boundaries needs to be addressed as a priority. Unwarranted clinical variation exists across the system leading to inequity in access to the good standards of care because l There is unwarranted variation in referrals guidelines, treatment, medicines and Continuing Healthcare funding when we compare ourselves to our demographic peers. l There is insufficient shared decision-making between patients and their healthcare professional. We need to enable our workforce to have conversations which enable patients to make the right decision about care, based on objective evidence and dialogue and containing expectations to value based care. THE FOLLOWING CHART SUMMARISES THE KEY THEMES AND WHAT WE NEED TO CHANGE IN OUR SES STP 5 BEHAVIOURS 1. Smoking 2. Physical inactivity 3. Unhealthy diet 4. Excess alcohol 5. Social isoloation 5 RISK FACTORS 1. Hypertension and breathing problems 2. Obesity and High Chloesterol 3. Hyperglycaemia 4. Frailty and falls 5. Anxiety and depression 5 DISEASES 1. Cancer 2. Circulation and respiratory disease 3. Diabetes 4. Bone and joint conditions 5. Mental Health conditions 75% OF DEATHS AND DISABILITY 5 IMPACTS ON PATIENTS AND SERVICES 1. There is an increase in life expectancy (increased demand), which includes an increase of people living longer in poor health (higher acuity). 2. The capacity in the NHS and social care cannot keep up with demand leading to delays and poor quality care. 3. Insufficient numbers of dying patients being cared for in their usual place of residence. 4. There is an increase in reactive, urgent care. 5. There is an increase in the cost of delivering services. 5 STP PRIORITIES 1. STP workforce and capacity strategy. 2. Shared decision-making and patient activation. 3. Re-framing our cultural norms to make the right lifestyle choices easy to make. 4. Addressing unwarranted clinical variation. 5. Mental and physical health services and social services closer to home with good communication 12 and co-ordination. 13 LEADS TO LEADS TO LEADS TO LEADS TO
34 OUR POPULATION HEALTH CHECK IN CONTEXT OUR POPULATION HEALTH CHECK HAS TRIANGULATED PREVIOUS ANALYSIS INTO A SINGLE CASE PRIORITY AREA STP EXECUTIVE STP CLINICAL AND PROFESSIONAL CABNIET Older people + disabilities/ Longterm conditions Circulation and Respiratory (cardiovascular disease, coronary heart disease, cronic obstructive pulmonary disease (COPD), diabetes) Cancer Mental health Urgent and Emergency Care Co-ordinated and well communicated care 11 interventions MSK Get It Right (GIRFT), Continuing Healthcare (CHC), Clinically Effective Commissioning, Medicines, Optimisation Clinically Effective Commissioning (CEC) / Procedures of limites clinical effectiveness (POLCE) Mental health strategy Urgent and emergency care including 111, 3Ts Digital Strategy Workforce strategy Right: bone and joint, MSK unwarranted variation, Falls and Fagility fractures, end of life care, over treatment, medicalisation Rightcare 5:5:5 (prevention, detection, management / risk reduction) Stable angina, Atrial Fibrillation (AF) / Hypertension and breathing problems / High Cholesterol, Hyperglycaemia, obesity, diabetic foot amputations). Shared decisionmaking and social activation 5:5:5 (cancer risk factors; screening; early detection and treatment, survivorship) Mental health in relation to 5:5:5 (prevention, wellbeing, early intervention, social isolation, mental health and long-term conditions and dementia) Capacity across the health and care system Improving communication across primary and secondary care. Patient activation STP PLAN AND REFRESHED PLAN (11 KEY INTERVENTIONS) Older people, dementia end of life care, reablement, falls reduction Adults with physical disability build knowledge and change behaviours Acute liaison, SEMI Acute liaison, SEMI Rapid response in community and acute services Discharge planning Single point of access Specialist advice Integrated care EXISTING SYSTEM TARGETS/ MEASURES Delayed transfers of care, dementia indicators (improvement and Assessment Framework (IAF), Urgent and Emergency Care GP access, Learning disabilities Quality and Outcomes Framework (QOF), RightCare, diabetes. Maternal smoking, obesity (IAF) 2 week wait, 31 days, 62 days Screening, stage 1 and 2, diagnosed in A&E IAF, IAPT / dementia / acute crisis / CYP A&E 4 hour waits Recruitment and retention Agency spend Maternity Better Births Supporting a good start in life Still birth reduction Our Population Health Check in context There are 24 large organisations in our partnership local authorities, providers and clinical commissioning groups. This STP recognises the very critical part played by so many other smaller but core health, care and wellbeing organisations across the STP. Our footprint is home to 1.7 million people providing health and social care at a cost of 4bn. It cannot be under-estimated the importance of planning changes to care across the health and social care system so that changes are not made in isolation but in partnership, with the impact of changes being clear and mitigating any negative consequences together. POPULATION SIZE BY LOCATION (M) CWS 0.51 Crawley 0.13 B&H 0.31 HMS 0.23 HWLH 0.17 East Surrey 0.18 H&R 0.19 EHS 0.19 NHS Commissioners Brighton & Hove CCG Coastal West Sussex CCG Crawley CCG East Surrey CCG Eastbourne Hailsham & Seaford CCG Hastings & Rother CCG High Weald Lewes Havens CCG Horsham & Mid-Sussex CCG Specialised Commissioning (NHS E South) Total = 9 NHS Providers Brighton & Sussex University Hospitals East Sussex Healthcare Queen Victoria Hospital South East Coast Ambulance Service Surrey & Borders Partnership Surrey & Sussex Healthcare Sussex Community Sussex Partnership Western Sussex Hospitals GP Providers Total = 9 (excluding GP Providers) Non-NHS Providers Brighton & Hove City Council East Sussex County Council Surrey County Council West Sussex County Council First Community Health and Care IC 24 Total = 6 STP Total = 24

35 IN CONTEXT SUBHEAD STYLE We must also acknowledge some of the many examples we have of great care across the health and social care services across our STP. STPs are a way for the NHS to develop its own, locally appropriate proposals to improve health and care for patients. They are working in partnership with democratically elected local councils, drawing on the expertise of frontline NHS staff and on conversations about priorities with the communities they serve. Partnerships will be forums for shared decision making, supplementing the role of individual boards and organisations. Their immediate focus is on refining and implementing their sustainability and transformation plan so that patients can see practical benefits in their local health system. STPs do not replace new care models; instead they will allow the ability to build on their success, by providing a collaborative system of leadership and governance which will allow new care models to evolve and spread. (NHS England, 2018) Although this document focusses on what we need to change, we must also acknowledge some of the many examples we have of great care across the health and social care services across our STP. For example: l East Sussex Better Together: Health and Social Care Connect (HSCC) which offers both the public and professionals a single point of access for adult health and social care enquiries, assessments, services and referrals. Streamlining access frees GPs to see other patients rather than having to refer to several different services for a patient. It also supports faster access to the services for patients in their home. l Central Sussex and East Surrey Commissioning Alliance (CSESCA) North: Integrated, patient-centred teams developing in Primary Care Homes. East Grinstead is a rapid test site for a Primary Care Home model: Key work-streams are addressing urgent on the day primary care capacity with GPs working in the Minor Injury Units (MIUs). l Central Sussex and East Surrey Commissioning Alliance (CSESCA) South: Dementia Golden Ticket in HWLH. The Golden Ticket delivers a holistic mix of services to address health and wellbeing, supporting people with dementia and their carers in every aspect of their lives. Evaluation of the project shows that it is already reducing GP visits and emergency admissions to hospital. People who said that they had previously felt isolated received support to live more independently. l Coastal Care: Frailty pathway redesign. The Paramedic and Occupational Therapy team work together on the Falls Response vehicle, provided by Sussex Community NHS Foundation Trust, with the pilot being funded by Coastal West Sussex CCG. So far the conveyance rate for this vehicle in the first four weeks is 9.18% compared to l Sussex Partnership NHS Foundation Trust (SPFT): Developing a single access point to ensure that people in crisis can access services 24 hours a day and a no wrong front door approach with access points for other services. They have set up a front door staffed by peer workers, care navigators, carers, voluntary sector staff and mental health clinicians. l South East Coast Ambulance Service NHS Foundation Trust (SECAmb): 999, Emergency Operations Centre and 111 Rotational Workforce: Working with HEE and commissioners, SECAmb is developing a number of rotational workforce positions. These are focussed on rotating staff out (e.g. Paramedic Practitioners in primary care) and rotating staff in from other organisations (e.g. midwives). This is allowing the Trust to test workforce and governance issues before beginning wider work on rotational workforce approaches such as mental health nurses and rotating SECAmb paramedics into hospice and urgent care centre settings. l Sussex Community NHS Foundation Trust: Healthy Child Programme, which provides a range of health interventions and support, beginning in pregnancy and continuing through to the end of formal schooling. l IC24: Developing the multi-professional urgent care workforce and strengthening the role of the GP as a clinical leader. l Specialist Palliative Care: The adult and children s hospices and Specialist Palliative Care services serving the STP area are all supported by their local communities to provide holistic multi-professional care for those facing death and bereavement. Adults known to hospice services are less likely to die in hospital and have a higher chance of dying in their usual place of residence. l Academic Health science Network: The Atrial Fibrillation (AF) project identified 580 individuals who were eligible for anticoagulation and would benefit from a change of treatment to reduce their risk of an AF-related stroke. By the end of May 2018, 219 individuals had had their medicines optimised by their GP practice. This has reduced the risk of AF-related strokes to such an extent that the equivalent of six AF-related strokes have been avoided, avoiding debilitating effects on individuals and their families and avoiding costs to state-funded health and social care of over 160,000. Adults known to hospice services are less likely to die in hospital and have a higher chance of dying in their usual place of residence. Some residents living within our STP, are treated in Kent and Medway % for the previous 5 weeks. 17 and Surrey and are also affected by their STP Cases for Change. Kent and
36 IN CONTEXT OUR EVIDENCE People with mental ill health have poor outcomes and may not always be able to access services Medway STP, Surrey Heartlands STP and Frimley STP have all identified the same issues in their Cases for Change in that: l There is not enough focus on maintaining independence and ill health prevention, l There are challenges in primary care provision, which is extremely fragile in some areas, l There are gaps in service and poor outcomes for those with long term health conditions, What we found (our evidence) Our evidence: Our Population and Demographics l We do not support people with long-term conditions and needs to look after themselves as effectively as we should, OUR APPROACH TO HEALTH AND WELLBEING INEQUALITIES l Many people are in hospital who could be cared for elsewhere, l There is a growth in demand from older, more complex patients, l Planned care is not delivered as efficiently and effectively as it could be, l There are particular challenges in the provision of cancer care, l People with mental ill health have poor outcomes and may not always be able to access services, l There are capacity issues, General socio-economic, cultural and environmental conditions Education Work environment Living and working conditions Social and community networks Unemployment Water and sanitation l There is a lack of Digital integration and innovation, l They have an unsustainable workforce model, l They need to reduce clinical variation, Agriculture and food production Individual lifestyle factors Age, sex and constitutional factors Health care services Housing l Urgent and Emergency care needs to reduce. In addition they have also identified the following which we have not identified in that some local hospitals find it difficult to deliver services for seriously ill people: some services are vulnerable and potentially unsustainable. There is a need to review their specialist acute model including mental health. Existing capacity needs to be redesigned to be used much more productively. Our approach reflects the responsibilities of the whole system in addressing health and well-being NHS, councils, police, education, voluntary sector, communities and individuals. This well-being approach recognises that health is created by wider factors than health services. This approach requires a strategic commitment to building a culture in which individuals, organisations and communities work together to Ref: Determinants of Health, Dahlgren and Whitehead (1991) 18 identify and pool their capacity, skills, knowledge, assets and resources 19
37 OUR EVIDENCE OUR EVIDENCE RELATIVE CONTRIBUTION OF THE DETERMINANTS OF HEALTH HEALTH BEHAVIOURS 30% Ref: Adapted from Gonnering RS and Riley WJ (2018) Robert Wood Johnson and University of Wisconsin Population Health Institute SOCIO- ECONOMIC FACTORS 40% CLINICAL CARE 20% to improve health and wellbeing outcomes for all our residents. Such an approach requires a shift from a demand management approach to a whole system approach to prevention which addresses the causes of the causes as identified in Dahlgren and Whitehead model (1991) above. The causes of the causes recognises that if the causes of poor health are social, economic and environmental then the solutions need to be too from social determinants to those of the built environment, and these solutions require concerted, sustained, partnership working. CAUSES OF THE CAUSES BUILT ENVIRONMENT 10% Our Joint Strategic Needs Assessment (JSNA) show our health priorities are largely the same as elsewhere good mental health and wellbeing underpins success; poor physical health is linked to lifestyle behaviours, health inequalities result from social and income inequality; healthy futures are built on good employment and decent homes. However, there are extreme variations in terms of socioeconomic status, health outcomes, environment and economic prosperity. These are often masked by averages, meaning health outcomes can seem on a par with the rest of England, when for parts of Sussex and East Surrey the reality is significantly and enduringly worse. There remain considerable, and unacceptable, differences in life expectancy between areas across Sussex and East Surrey and within local CCG / local authority areas. Service access, take up and outcomes need to be addressed for disadvantaged groups. Four main unhealthy behaviours of smoking, alcohol misuse, poor diet and lack of physical activity, as well as poor emotional and mental wellbeing are responsible for at least a third of ill health and are amenable to cost-effective preventative interventions. Substance misuse, in all its forms, continues to present challenges across the STP area, and notably in the Hastings and Brighton and Hove areas. Unhealthy behaviours of smoking, alcohol misuse, poor diet and lack of physical activity, as well as poor emotional and mental well-being are responsible for at least a third of ill health Social Economic Creating opportunities for people to participate in the life of the community: includes education and early childhood development, providing a sense of place, belonging and safety, information, inclusion, informal social support, health and community services, arts and culture, sport and leisure. Encouraging sustainable economic development and equitable access to resources includes regeneration, job creation, training, social protection, benefits, occupational health and safety and incentives. MODIFIABLE RISK FACTORS AND LONG TERM CONDITIONS MODIFIABLE RISK FACTORS (these can be reduced or controlled by intervention, and by doing so reduce the probability of disease) METABOLIC CHANGES (the biochemical processes involved in the body s normal functioning) LONG- TERM CONDITIONS Natural Looking after natural surroundings and ecosystems: includes clean water, air, soil, natural, land care, waste recycling, energy consumption and climate change adaption. Tobacco use Raised blood pressure Cardiovascular disease Physical inactivity Raised total cholesterol Diabetes From Health in All Our Policies (Local Government Association 2016) Built Altering physical surroundings icludes: urban layout, building design and renewal, housing quality, affordability and density, parks and recreatio facilities, roads, paths and transport and the provision of other amenities, such as seating and toilets. Alcohol use Poor diet (increased fat and sodium, with low fruit and vegetable intake). Elevated glucose Overweight and obesity Cancers Emotional and mental well-being 20 21
38 OUR EVIDENCE Self Care Continuum Prevent Reduce Delay LIFE COURSE APPROACH Starting well in life is important for every child. The first few years of life are critical for readiness to learn, educational achievement, income and economic status - strong predictors of future health and wellbeing. What happens during pregnancy and early years impacts on their risk of long term ill health such as obesity, substance misuse, risk of heart disease, dental decay and poor mental health. These differences are almost entirely explained by deprivation and inequalities. Public health interventions have an important part to play to stem the tide of longterm conditions and increasing costs. Focusing on prevention earlier in the life-course will accumulate greater benefits, but even in middle and older age, preventative approaches are cost-effective. Prevention requires prioritisation and investment across the system. Self care Daily Choices Lifestyle Self-managed ailments Long terms conditions Actute conditions Compulsory psychiatric care Major trauma Residential care Enablers: Asset based needs assessment Aligned Strategies Collaborative partnerships START WELL LIVE WELL AGE WELL Place level solutions Digital solutions for self-management Individual/Service level solutions Environmental solutions to make the healthier choice the easier choice Social marketing/ community led support Public and patient support & materials Community level solutions Community - connectivity /changing social norms Systematic workforce development Embedding prevention into care pathways Systematic self care & digital support A WHOLE SYSTEM APPROACH TO PUBLIC HEALTH As well as individual service interventions, public health interventions to build stronger and more resilient communities and places which support people to maintain independence and manage their own health and wellbeing across the course of their lives, are an important components of a whole system approach to prevention across NHS, local authorities, voluntary sector, community groups and wider stakeholders. Working together, we can achieve the cultural shift we need to sustain improvements for people wherever they live and create a focus on health rather than the treatment of illness. This is increasingly important if public services are to be sustainable in the future all parts of the public sector face significant budget pressures and the NHS and local government are by no means exempt. Improving the public s health will help secure the future of these services and deliver longer, healthier lives for all our residents. CURRENT RESIDENT POPULATION AND PROJECTED TO 2030 (DATA ROUNDED TO NEAREST 100) OVERALL RESIDENT POPULATION ESBT Coastal CSESCA North CSESCA South 0-19 YEARS ESBT Coastal CSESCA North CSESCA South YEARS ESBT Coastal CSESCA North CSESCA South 85 AND OVER ESBT Coastal CSESCA North CSESCA South 2016 POPULATION 2030 PROJECTED % CHANGE 375, , , ,800 79, , ,100 99,400 82, ,200 79,000 66,600 16,000 20,200 14,500 11, , , , ,100 83,00 111, ,00 103, , , ,900 86,900 22,200 28,500 20,600 15, % 12.0% 9.5% 9.2% 4.7% 6.5% 6.8% 4.5% 33.1% 31.0% 32.8% 30.5% 38.8% 41.1% 42.1% 32.5% Improving the public s health will help secure the future of these services and deliver longer, healthier lives for all our residents. Sources: Aggregated CCG data provided by ONS Population - ONS Mid-Year Estimate (Resident Population) Projected - ONS Population projections for clinical commissioning groups and NHS regions 22 23
39 OUR EVIDENCE OUR EVIDENCE Disability Free Life Expectancy MEN ( ) Source: ONS Disability-free life expectancy (DFLE) Years England = 64.1 years Hastings & Rother Brighton & Hove The resident population across the overall area is projected to increase between 2016 and 2030, from a projected 9.2% increase in the CSESCA South area to 12% in Coastal. The greatest increases are projected in the older age groups, notably amongst people aged 85 years or over. Growth in the child population is lower than overall change. The overall population increase, and the rise in the older age groups will impact the demand for health and social care services, with frailty and the number of people with one or more long-term health condition rising Eastbourne, Hailsham and Seaford Crawley Coastal W Sussex High Weald Lewes Havens East Surrey Horsham & Mid Sussex WOMEN ( ) Source: ONS Disability-free life expectancy (DFLE) Years England = 65.0 years Hastings & Rother Brighton & Hove Eastbourne, Hailsham and Seaford Crawley Coastal W Sussex Life expectancy varies considerably across the area; this reflects deprivation, with shorter life expectancies in the most deprived local authority areas. In Hastings male disability-free life expectancy is over five years lower than that in Horsham and Mid Sussex, East Surrey and High Weald, Lewes and the Havens. Hastings and Rother also has the lowest female disability-free life expectancy at 64.1 years compared with Horsham and Mid Sussex at 69.4 years. High Weald Lewes Havens East Surrey Horsham & Mid Sussex DEPRIVATION - INDEX OF DEPRIVATION 2015 While overall the STP area is relatively affluent, there are some areas, notably along the coastal strip in Hastings, Brighton and Hove and Littlehampton, which rank within the most deprived areas in England; deprivation that has persisted over many years. In relation to child poverty, rates at a CCG level (2013) range from 7.3% in Horsham and Mid Sussex to 22.7% of children in Hastings and Rother, but again there are neighbourhoods where more than a third of children live in low income households
40 OUR EVIDENCE OUR EVIDENCE The pace of change in older age will increase markedly over the next ten years POPULATION KEY FACTS The population is increasing, with higher increases in the older age groups. It is also important to note that the pace of change in older age will increase markedly over the next ten years. In the first five years, the annual increase in the 65+ population is projected to be between 6,000 to 8,000(across the whole STP area) but this then starts to rise, and peaks at around 14,000 in the next 10 years. YEAR-ON-YEAR CHANGE IN THE POPULATION AGED 65 OR OVER 2017 TO 2041 (COMBINED EIGHT CCGS AREAS) Given the increase in the old age groups, there will be more people living with a long term health condition. Many people will have multiple long term conditions. There will be considerable challenges in sustaining services and maintaining quality. LONG TERM CONDITIONS - DATA FROM QOF REGISTERS OF PATIENTS IDENTIFIED V MODELLED ESTIMATES OF PREVALENCE Figures rounded to nearest 50. Register data relate to 2016/17 Brighton & Hove Coastal West Sussex QOF Register 16,750 ASTHMA Estimated undianosed No recent estimate ATRIAL FIBRILLATION QOF Register Estimated undianosed QOF Register 4,100 1,850 4,250 COPD DEMENTIA DIABETES HYPERTENSION Estimated undianosed No recent estimate QOF Register Est diagnosis rate (65+) QOF Register Estimated undianosed QOF Register Estimated undianosed 1,700 64% 10,500 7,800 28,900 27,950 32,750 13,900 3,650 10,050 5, % 30,250 9,250 83,400 54,550 Crawley 7,650 1, , % 7,100 1,150 16,250 11,750 Year-on-year change in the population aged 65 or over 2017 to 2041 (Combined eight CCGs areas) 16,000 14,000 12,000 10,000 8,000 6,000 4,000 2, Eastbourne Hailsham & Seaford 12,900 6, ,400 2, % 10,750 4,900 34,100 22,100 East Surrey 10,600 3, ,500 1, % 7,800 3,300 22,250 17,050 Hastings and Rother High Weald Lewes Havens Horsham & Mid Sussex 10,250 5, ,250 1, % 10,150 5,450 30,700 17,650 10,150 4, ,900 1, % 7,750 4,300 25,750 17,300 14,750 5,050 1,650 3,250 2, % 10,400 4,400 33,650 22,850 Source: ONS Population Projections (combined CCG areas) % Of Patients Reporting a Long Term Musculoskeletal Problem (2017 LA Level) 25% 20% 15% 10% 5% East Sussex West Sussex Brighton & Surrey SE England England Hove % 18.7% 15.7% 14.5% 14.2% 15.4% 16.5%
41 OUR EVIDENCE OUR EVIDENCE MENTAL HEALTH ESTIMATION OF COMMON MH MENTAL HEALTH PROBLEMS MENTAL HEALTH Estimation of Common Mental Health Problems 2014/15 % of years High Weald Lewes Havens 12.0% Eastbourne, Hailsham & Sfd 12.4% Crawley 12.7% Horsham & Mid Sussex 12.8% Coastal West Sussex 12.9% MH START WELL C B A Smoking at the time of delivery In 2017/18, 1,600 women were known to be smokers at the time of delivery (9.1% of those with recorded status). The percentage in Hastings and Rother was over 15%. Breastfeeding initiation is high Over 82% of mothers breastfed their babies in the first 48hrs after delivery in 2016/17. The rate was highest in Brighton & Hove (88.2%), lowest in Hastings and Rother (73.3%) Readiness for School In 2017, the percentage of children achieving a good level of development in Brighton & Hove (69.7%) and West Sussex (70.6%) lags behind East Sussex and Surrey, and is lower than England. East Surrey 13.3% Hastings & Rother 13.8% Brighton & Hove 17.3% C A B Social mobility rated very good in...tendridge (Surrey) But rated very poor in Arun, Crawley and Hastings SERIOUS MENTAL ILLNESS Obesity 7.8 % fo reception pupils and 15% of year 6 pupils were measured as obese in the STP area (2014/15 to 2016/17). Higher percentages of excess and obese children in more deprived areas. Prevalence of mental health conditions, percent Horsham & Mid Sussex Crawley East Surrey High Weald Lewes Havens Coastal W Sussex Eastbourne, Hailsham and Seaford Hastings & Rother FOR SALE???? Brighton & Hove C A 7 hours + of sedentary behaviour? In the 2014/15 What about Youth Survey over 60% of 15 years olds surveyed in the C STP area reported B A a mean daily sedentary time (in the last week) over 7 hours per day Smoking at age 15 years 5 The percentage of 15 year olds who said they were current smokers was high in Brighton & Hove (14.9%), East Sussex (12.8%) and West Sussex (10.6%). Nationally the B rate was 8.2%. Hospital admissions for self-harm (10-24 years) In STP areas compared with England, Brighton & Hove, Hastings and Rother and Coastal FOR SALE??? West Sussex have particularly high rates? of admission.? 5? FOR SALE???? 28 29
42 OUR EVIDENCE C B A B A C B LIVE A WELL Low Unemployment 5 STP area has, overall, a low unemployment rate, but some areas higher such as Hastings C B A B? Over 110,000 older people live? alone? in the overall STP area? own? Of the older people living on their the vast majority are women (over 70%). Over 5 83% of older people are owner occupiers FOR SALE C But low wages 5 in some areas Notably full-time wages (2017) are low in Adur, Hastings and Eastbourne. C B A? FOR SALE???? Over? 250,000 smokers on GP registers C??? A? C B A C??? B?? C 5? C or more, including 15,000 carers aged 65 or overs.????????????? C A 18,000+ on Dementia Registers B we know that many people with dementia are not diagnosed. But? FOR SALE????? of physical inactivity vary? Rates? In Eastbourne 27% of adults are estimated to undertake less than 30 minutes of physical activity per week.??? Physical?activity rates vary? 5 Measured at local authority level, the % of adults undertaking the recommended physical activity level vary from 78% in Brighton & Hove to 62.2% in Crawley. FOR SALE 5 5 over 10% of patients. Again there is variation with 13% of patients in This represents Eastbourne, Hailsham and Seaford identified with depression. B?? Over Carers? 183,000 B A?.in? the STP area, including over 37,000 people who area caring for 50 hours a week? Over 155,000 adults with depression on GP registers 30 B FOR SALE? FOR SALE A A 250,000+ adults estimated to? be? binge drinkers 5 In 2016/17 there were over 1,600 alcohol-specific hospital admissions FOR SALE?A C 5 Admissions after a fall are high???? groups? In old age a fall can trigger a move into residential care. For people aged 80+ Brighton & Hove, Surrey and West Sussex rates of emergency admissions are far higher 5 than the England rate FOR SALE across the patch and between socio-economic groups. High Considerable differences FOR SALE rates in Brighton and Hove and Hastings. B? B A Falling short of the 5-a-day 5 Across the STP area, adults consume only 2.5 to 3 portions of fruit & vegetables a day, and FOR SALE estimates of overweight or obese adults at local authority level range from 48% to 64%. 5? C? Pressures? Housing 5 Over 40,000 households on council waiting lists, households a quarter C B accepted Aas homeless and in priority need.?? 70,000 households?estimated to be in fuel poverty?? people,? Not restricted to older but health effects can be greater on the very young and very old. 5 B A FOR SALE? 5 AGE C WELL A 5 C FOR SALE 5 Social isolation and loneliness Frequently reported by older people???and has an impact on mental and physical wellbeing. Over 60% of carers?known? to social care say they do not have as much social contact as they would like. Deaths at home Overall a higher percentage (50.7% in 2016) of people in the STP die??(including in their usual residence care homes), compared with England, but this is far??? lower in Crawley (37.2%) Variation in Disability Free Life Expectancy (DFLE) Hastings and Rother has the lowest DFLE for both men and women (62.5 years and 64.1 years respectively) and Horsham and Mid Sussex the highest (69.1 years for men and 69.4 years for women)?? 31
43 OUR EVIDENCE CASE STUDY - WELLBEING PRESCRIPTION SERVICE EAST SURREY The Wellbeing Prescription service allows GPs and other health and social care workers to refer people to local Wellbeing Advisors. The Wellbeing Advisors are trained to identify the clients needs, provide them with advice and signpost them to relevant local services and activities. The service is delivered in partnership by Tandridge District Council, Reigate & Banstead Borough Council and East Surrey GP practices and is commissioned working closely with NHS East Surrey Clinical Commissioning Group and Surrey County Council through the Better Care Fund. Quarter 1 18/19 monitoring report shows that 77% of people who have used the Wellbeing Prescription service made a positive change to their lifestyle and 75% have visited their GP less often since using the service. The Wellbeing Advisors can help people with issues such as weight management, getting more active, smoking cessation, social isolation and support with mental and emotional wellbeing. In addition there is Wellbeing Prescription Plus service, which is provided in the homes of patients with multiple, complex needs, as part of an integrated care approach. CASE STUDY - EAST SUSSEX - EMBEDDING PREVENTION ACROSS THE SYSTEM The Personal and Community Resilience Programme in East Sussex brings together partners across the statutory (CCGs, local authorities, Healthcare Trusts, Police, Fire and Rescue Service, Department for Work and Pensions) and voluntary and community sectors to take action to grow strong communities which improve health; and to co-ordinate activity to embed prevention across the system. The programme includes transformation programmes in key settings (the places where people spend their lives) such as schools, nurseries, and healthcare settings including GPs, pharmacies, hospitals and community health care services, to support them to play a greater role in improving health. As part of this: l 3,169 frontline staff have been trained to Make Every Contact Count l 96% of all primary and secondary schools have developed and are delivering whole school health improvement plans l 81% of all nurseries (private and local authority) have audited and are improving their healthy eating and physical activity offer CASE STUDY - WEST SUSSEX - SUGAR REDUCTION PROGRAMME The West Sussex Sugar Reduction Programme was launched in January 2015 (N.B. primary school meals sugar reduction began at the end of 2014). Whilst the overall programme has been successful, sugar reduction in primary school meals has achieved particularly significant results, winning a Public Health England (PHE) award in September 2016 in recognition of this. To date, the following achievements have been made: l Primary school meals now have over 2 kilos less sugar, per child, per average school year. l Daily sugar consumption reduced from 18.5g to 6.6g per child l The total amount of sugar reduced equals 5 double decker London buses per school year! l That s a 65% sugar reduction in just 3 years! l 89% of General Practices are undertaking new health improvement programmes in their practices l 96% of pharmacies registered as Healthy Living Pharmacies (HLP) Level 1, and 30 targeted pharmacies are being developed as HLP Level2 l 88,579 people received their NHS Health Check (over the past 5 years) l A whole systems approach to Social Value is being developed across the county, linked to local priorities and growing strong communities The programme l 30,000 children per day are benefiting care services includes transformation programmes in key settings such as schools, nurseries, and healthcare settings including GPs, pharmacies, hospitals and community health

44 OUR EVIDENCE OUR EVIDENCE This programme is aiming to reduce the harm caused by substance misuse and unsafe, early sexual behaviour in young people CASE STUDY BRIGHTON AND HOVE ADOLESCENT HEALTH OFFER This programme is aiming to reduce the harm caused by substance misuse and unsafe, early sexual behaviour in young people. The offer is a single, integrated service including: l Music workshops and mentoring programme for young people use cannabis but do not see it as a problem l DASH (Drug, Alcohol and Sexual Health) Prevention team which provides a package of resilience building interventions l Specialist Substance Misuse Treatment Service l School based health drop-ins staffed by school nurses and youth workers and text messaging support via CHATHEALTH Our evidence: Our public and our patients We always value the views of patients and carers and we have quoted a few examples of patient experience throughout. Some show excellent care and some highlight areas for improvement. For example: GOOD EXPERIENCES Every staff member I have encountered has been brilliant, respectful and knowledgeable. l PSHE (Personal, Social, Health and Economic) direct support to schools to improve the universal curriculum l Communication plan, including social media campaign which is aimed at equipping parents to have direct conversations with young people to explain the harms caused by using drugs / drink / tobacco. When my husband had a TIA, I could not fault the care of ambulance crew, A&E at hospital, emergency floor EXAMPLE A homeless woman with mental health issues including suicidal thoughts, supported by an outreach team to apply for funding, diary reminders for appointments. The support has dramatically reduced her illicit substance use and she feels more in control
45 OUR EVIDENCE SUBHEAD STYLE Not enough people know about the wide range of services pharmacies can offer. EXPERIENCES THAT COULD BE BETTER EXAMPLE 87 year old discharged post-surgery and told to expect a visit from social care that day. No one came. Only allowed one visit to change her dressing. (ESBT) EXAMPLE The importance of continuity of relationships (for young people) with professionals came out in her frustration with the variability and short term nature of those encounters. (Coastal Cares) Whenever we get into a discussion with patients and the general public there are a number of recurring themes which regularly surface, they are: l Good access to primary care, l Keeping care local, l Care that is well coordinated, l Having the right information to support self-care and as much focus on wellbeing as on health, l In addition, local people recommended expansion of the range of local services in local communities so these would be more integrated and accessible both for patients and also for family and carers. All across the STP, commissioners have been engaging the public to gain their views on current services and/or proposed changes. In the Alliance, CCGs have been conducting a series of discussions called the Big Health and Care Conversation and more of these events are planned. IDEAS FOR IMPROVING CARE I would like advocates, community navigators and health coaches to have a greater role in supporting people to understand their health conditions and medicine People need to be more aware of healthy lifestyles and to take more responsibility for own health. So more education. EXAMPLE The daughter of a 95 year old woman with dementia raised concerns over her mother s care in a care home. Even though they were funding the care, support to raise concerns would have been welcomed. Once we have agreement on the content and strategic direction of the Population Health Check we will engage more widely with our staff, wider partners, Health Overview and Scrutiny Committees etc. and mobilise our communications and engagement resources to widen debate and gain ownership of the plan. OUR EVIDENCE: WHAT DO PATIENTS EXPERIENCE? We need to move from how things are now, a fragmented and reactive system, to a future system designed around the individual. How it looks now: l A fragmented system with multiple providers, characterised by a lack of coordination, l A service which is reactive not proactive, l Pathways of care that are unnecessarily complex. We need to move from how things are now, a fragmented and reactive system, to a future system designed around the individual
?")
46 OUR EVIDENCE SUBHEAD STYLE We need to work with our local communities to help people help themselves. This is what most people tell us they want. OUR EVIDENCE: WHAT SHOULD OUR PUBLIC AND PATIENTS EXPECT (PRINCIPLES OF CARE)? We understand the importance of a person centred asset based approach to empowering people to develop the knowledge skills and confidence to self-manage. The focus needs to be on our population rather than organisational silos, with prevention and self-management at its core. This is enabled through strength based social care, shared decision making, making every contact count, collaborative care and support planning and health coaching. collaboratively with your health and care professionals to develop a care and support plan describing what s important to you. l There is likely to be a key worker or co-ordinated assigned to you. l You will have a care record which you will be able to see and add to. l If you need hospital care, there may be changes to how and where this is offered, with hospitals working as partners to provide more specialised services and with more technology-enabled care. People have the right to a high-quality health and care service when they really need it. With rights, however, come responsibilities. We need to work with our local communities to help people help themselves. This is what most people tell us they want. We need to work with people to redesign the system. To do this, we will adopt the following principles of care: l Make Prevention Everybody s business, l Maximise Independent Living and Self-Care, l Target proactive care of people at highest risk of hospitalisation and needing higher intensity care, l Reduce the time people stay in hospital for and discharge them safely, l Make patient journeys more joined up, without waste, repetition or duplication, l Make Sussex and East Surrey STP a great place to work in all our local organisations, l Prioritise investment areas which bring maximum benefit for patients. l If you are frail and elderly and you need to go into hospital, you are more likely to receive support to go straight home to recuperate, rather than having to go somewhere else first. l Health and social care services will work with you as a partner to help you to live your life independently l You can make the last stage of your life as good as possible because everyone works together confidently, honestly and consistently to help you and those important to you, including your carers. (ref: National Palliative and End of Life Care Partnership,2015) Health and social care services will work with you as a partner to help you to live your life independently OUR EVIDENCE: WHAT WILL THIS MEAN FOR US ALL? l You will be empowered and supported to develop the knowledge, skills and confidence to self-manage and stay well. l We will create environments which make it easier to be healthy. You are also more likely to be offered a personal care or health budget. 38 l If you become unwell with a long-term condition, you will work 39
47 OUR EVIDENCE Whilst some people receive excellent care, others experience fragmented and poorly coordinated care. Our evidence: Our services DYING l We want more patients to die in their usual place of residence. Across the STP we have a high number of care homes and we should capitalise on this and support more residents to die in these supported and homely environments. l In the Sussex and East Surrey STP, there were 19,585 deaths in The percentage of all deaths with dementia as an underlying or contributory cause of death were higher in 50% of the CCGs. l The percentage of all deaths that are aged 85 years and older were higher than the national average for all CCGs. Due to the complexity of four parties being involved in our mother s care ([hospice], [care home], District nurses and the GP) there were times when communication and responsibility were disconnected I can t think of anything you can improve on, I am 91 years old and my wife passed away in March of this year at the age of 95. She had Parkinson s and dementia, she wanted to die at home so I looked after her at home for 3 years or more and the help and care I got from the NHS was l We are poor at identifying people who are at the end of their life. l There is fragmentation of services and lack of shared records. St Catherine s hospice so good I can t say a bad word about it. Coastal Care-Primary and Urgent l Whilst some people receive excellent care, others experience fragmented and poorly co-ordinated care. care survey) Percentage of death in different locations by CCG A&E 4HR WAITING TIME PERFORMANCE STP WIDE Brighton & Hove Crawley Eastbourne, Hailsham & Seaford High Weald Lewes Havens Coastal West Sussex East Surrey Hastings & Rother Horsham & Mid-Sussex 94.0% 92.0% 90.0% 88.0% 91.0% 92.3% 91.0% 87.8% 90.1% 88.5% 86.9% 89.5% 90.1% 89.7% % 85.8% 85.9% % Hospital Hospice Home Care Home Other Q1 Q2 Q3 Q4 Q1 Q2 Q3 Q4 Q1 Q2 Q3 Q %
48 OUR EVIDENCE OUR EVIDENCE A&E BREACHES STP WIDE Although there is no right or wrong formula of what services should be provided in a non-acute setting, it is generally viewed that an over-reliance on acute based care is comparatively more expensive due to the prevailing payment system (Payment by Results) There is variation across the trusts in delivering on Referral to Treatment Times (RTT) Admissions CCG Outcomes Indicator Set- domain 3 >> 3.1 Emergency admissions for acute conditions that should not usually require hospital admission ( (Jul-Jun)) >> East Surrey and Sussex Q2 Q3 Q4 Q1 Q2 Q3 Q4 Q1 Q2 Q3 Q Whilst individual Trusts occasionally meet the 95% 4 hour A&E waiting time standard, as a whole, the Sussex and East Surrey STP has not met the standard since it was formed in late /4 acute providers have breached the four hour waiting time target at Q3 16/17. In 2016/17, 2 of the acute trusts were more than 5% below the expected 95% of patients to be seen within 4 hours for Type 1 A&E attendances. The other 2 trusts were above 90% but below 95% for 3 of the 4 quarters. The NHS Planning Guidance (2018/19) expects 95% to be achieved by month 12. Coastal West Sussex and East Sussex areas showing levels of hospitalisation almost four times as high as in other There are significant hand over delays at our hospitals. Between and SECAmb lost in excess of 3,200 operational ambulance hours to turnaround delays greater than 30 minutes. This was a 13% increase over the same period last year. This is equivalent to losing 13 ambulances on duty every day of this 10 day period. ACCESS ADMISSIONS There is very large variation in patterns of hospital use for conditions that would not usually require hospitalisation, with Coastal West Sussex and East Sussex areas showing levels of hospitalisation almost four times as high as in other areas of the STP. RTT performance STP wide areas of the STP. The reasons for this are multi-fold and span patient behaviours but also the 84.0% 42 availability, accessibility and responsiveness of non-hospital based services Q1 Q2 Q3 Q4 Q1 Q2 Q3 Q % 90.0% 89.0% 88.0% 87.0% 86.0% 85.0% 86.9% 86.8% 87.1% 89.6% 89.8% 88.3% 87.3% 86.2%
49 OUR EVIDENCE OUR EVIDENCE CANCER MORTALITY CCG Outcomes Indicator Set- domain 1 >> 1.9 Under 75 mortality rates from cancer (2015) >> East Surrey and Sussex I was recently diagnosed with breast cancer following my first over 50 screening. I have had the surgery and I have just started chemotherapy. I just wanted to let you know how amazing the staff at BSUH have been; The radiographers and nurses in the breast care unit, pre assessment clinic, theatre and Ansty ward at PRH and imaging l There is significant variation in mortality rates from cancer, with patients in coastal areas, in particular Brighton and East Sussex being in some instances 20% more likely to die from cancer than patients in Horsham/Mid Sussex. l In our STP, cancer incidence is high, with low diagnosis at stage 1 and 2. Take up of cervical and breast screening is low. l We lack of access to modern, high quality and local radiotherapy services. CANCER SURVIVAL CCG Outcomes Indicator Set- domain 1 >> 1.10 One-year survival from all cancers (Diagnosed 2014) >> East Surrey and Sussex l There is inadequate introduction and adoption of timed pathways in Lung, Prostate and Colorectal cancer. l There is variation across the trusts in delivering on cancer waits. l Diagnostic capacity and workforce shortages continue to be an issue. LATEST PERIOD LATEST VALUE RANK WITHIN SOUTH (Ref: STP dashboard 2018) SPINE CHART = selected STP = middle 50% of South STPs = England average = STP median WORST BEST Cancer incidence (total tumours)^ /13 Cancer incidence (rate) /13 Breast cancer screening coverage 2015/ % 12/13 Cervical cancer screening coverage 2015/ % 9/13 Bowel cancer screening coverage 2015/ % 8/13 Diagnosis at stage 1 or % 12/
50 OUR EVIDENCE UNWARRANTED VARIATION We know there are areas of healthcare, which demonstrates variation in practice and quality across our STP. Key areas of variation in our STP are: l Cardio Vascular Disease (including Stroke care, Atrial Fibrillation, stable angina and diabetes) l Trauma and Injuries (Falls and Fragility Fractures) UNWARRANTED VARIATION: CARDIOVASCULAR STROKE In stroke care there is: l Inadequate achievement of NICE (National Institute for Health and Care Excellence) Guidelines standards for non-elective stroke care and the South East Clinical Network Stroke standards. l There continues to be variation across the STP in stroke services, especially in relation to access to allied access to six-month reviews. l MSK Routinely Admitting Teams Trust Brighton and Sussex University Hospitals NHS Trust East Sussex Healthcare NHS Trust Maidstone and Tunbridge Wells NHS Trust Maidstone and Tunbridge Wells NHS Trust Medway NHS Foundation Trust Surrey and Sussex Healthcare NHS Trust Western Sussex Hospitals NHS Trust Western Sussex Hospital NHS Trust After my stroke, I felt isolated and lost confidence Number of patients Team Name Admit Royal Sussex County Hospital Eastbourne District General Hospital Maidstone District General Hospital Tunbridge Wells Hospital Medway Maritime Hospital East Surrey Hospital St Richards Hospital Worthing Hospital Disch The aftercare failed to meet any expectations Mum wasn t admitted to the ward for 9 hours PATIENT CENTRED - APRIL TO JULY 2017 Patient Centred Data D1 Scan D2 SU D3 Throm D4 SpecAsst D5 OT D6 PT D7 SALT D8 MDT SOUTH ENGLAND - SOUTH EAST SCN A A A A C A B A B B C D E D C C B C C D D B B B A B B C D B C A B C A B E B C A B C A A D C C B C E A B C C B C D D B C D B C B D9 Std Disch A A C D A B B A D10 Disch Proc B B B B B D C D PC KI Level B C A C D B C B Six Month Assessment Number Applicable % Applicable 98% 100% 100% 100% 98% 99% 99% 100% % Assessed 6% 13% 0% 0% 4% 2% 0% 0% Number assessed
51 OUR EVIDENCE PATIENT CENTRED - APRIL TO JULY 2017 Routinely Admitting Teams Number of patients Patient Centred Data Trust Team Name Admit Disch D6 PT D7 SALT D8 MDT D9 Std Disch D10 Disch Proc PC KI Level SOUTH ENGLAND - SOUTH EAST SCN Brighton and Sussex University Hospitals NHS Trust Royal Sussex County Hospital East Sussex Healthcare NHS Trust Eastbourne District General Hospital Maidstone and Tunbridge Wells NHS Trust Maidstone District General Hospital Maidstone and Tunbridge Wells NHS Trust Tunbridge Wells Hospital Surrey and Sussex Healthcare NHS Trust East Surrey Hospital Western Sussex Hospitals NHS Trust St Richards Hospital Western Sussex Hospital NHS Trust Worthing Hospital A B A A B C B B E A B C C C B D B B B C B B A D D A A A B C B C D D C A B B C B C A UNWARRANTED VARIATION: CARDIOVASCULAR: STROKE PREVENTION AND ATRIAL FIBRILLATION (AF) For every 25 high risk patients treated for AF, one serious/debilitating stroke is avoided. The chart below shows that, compared with our demographic peers, we often have a gap between our expected prevalence versus our actual prevalence. Eastbourne, Hailsham and Seaford CCG and Hastings and Rother CCG are identifying more cases than their comparative peers. Where we are finding patients and putting them on blood thinners, our spend on non elective stroke is lower than our demographic peers because we are preventing strokes. Within three years we could stop 660 Strokes if we treated all patients with AF with anti coagulation. This equates to 11.2 million. Stroke- Non-elective spend on discharges - Best 5 Direct current cardioversion (Majority PBC=10C) - Total spend on discharge - Best 5 AF & CHADS2 score >1: % currently treated with anti-coagulation therapy - Best 5 AF observed prevalence compared to expected prevalence - Best 5 8,000 Stroke- Non-elective spend on discharges - CCG Direct current cardioversion (Majority PBC=10C) - Total spend on discharges - CCG AF & CHADS2 score >1: % currently treated with anti-coagulation therapy - CCG AF observed prevalence compared to expected prevalence - CCG 100% Six Month Assessment Number Applicable % Applicable 98% 100% 100% 100% 98% 100% 100% 7,000 6,000 90% 80% 70% Number assessed ,000 60% % Assessed 2% 10% 0% 0% 0% 0% 0% 4,000 3,000 50% 40% 2,000 30% 20% 1,000 10% 0 NHS Brighton & Hove CCG NHS Coastal West Sussex CCG NHS Crawley CCG NHS East Surrey CCG NHS Eastbourne, Hailsham and Seaford CCG NHS Hastings and Rother CCG NHS High Weald Lewes Havens CCG NHS Horsham and Mid Sussex CCG 0% EST. AF PREVALENCE 1.97% 3.44% 2.04% 2.51% 3.58% 3.52% 3.11% 2.81% EST. BEST 5 PREVALENCE 2.06% 3.07% 2.24% 2.42% 3.15% 3.21% 2.97% 2.53% NHS Brighton NHS Coastal NHS Crawley NHS East NHS NHS Hastings NHS High NHS & Hove CCG West Sussex CCG Surrey CCG Eastbourne, and Rother Weald Lewes Horsham and 48 CCG Hailsham and CCG Havens CCG Mid Sussex 49 Seaford CCG CCG
52 OUR EVIDENCE The NHS reports that people who have diabetes are 15 times more likely to undergo amputations than other people without the condition. UNWARRANTED VARIATION: CARDIOVASCULAR DISEASE: DIABETES In diabetes care there is wide variation in: l The number of major and minor amputations and length of stay. l The average number of major amputations in England is 8.1 per 10,000 (standardised rate). Across our STP the rate ranges from 5.8 High Weald Lewes Havens CCG to 10.2 Eastbourne, Hailsham and Seaford CCG. The average number of minor amputations in England is 20.7 per 10,000 (standardised rate). Across our STP the rate ranges from 17.7 (Crawley CCG) to 28.9 Eastbourne, Hailsham and Seaford CCG. l Our current diabetic foot amputation rate will continue to rise. Currently 52% of our diabetic foot ulcers are rated as severe and at least 56% were unhealed at 12 weeks, with 83% of patients waiting more than two days for referral and triage and 38% waiting at least 14 days (NICE recommendation for referral and triage within two days). l There is still a gap in the actual to expected prevalence rate of diabetes. There is variation across our STP in terms of Primary Care achievement of quality targets such as blood sugar management, blood pressure, cholesterol and the other 8 Care processes. KEY FACT The NHS reports that people who have diabetes are 15 times more likely to undergo amputations than other people without the condition. Diabetes is one of the leading causes of amputation of the lower limbs throughout the world. Charity Diabetes UK notes that problems of the foot are the most frequent reasons for hospitalisation amongst patients who have diabetes. CCG Major amputations per 1,000 diabetic patients April March 2014 Major amputations per 1,000 diabetic patients April Major amputations per 1,000 diabetic patients England East Surrey CCG 1.0 (19) 0.8 (17) 0.9 (19) Horsham & Mid Sussex CCG 0.6 (15) 0.8 (21) 0.82 (21) Crawley CCG 0.5 (9) 0.9 (17) 0.93 (16) Coastal West Sussex CCG 0.9 (71) 1.0 (79) 0.54 (80) Brighton & Hove CCG 1.0 (32) 0.9 (29) 0.8 (27) High Weald, Lewes & Havens CCG 0.6 (12) 0.6 (14) 0.58 (16) Hastings & Rother CCG 1.0 (27) 0.9 (27) 0.81 (29) Eastbourne, Hailsham & Seaford CCG 1.7 (47) 1.1 (33) 1.02 (36) South East Coast Total (613) CCG Minor amputations, annual rate per 1,000 adults with diabetes Minor amputations, annual rate per 1,000 adults with diabetes Minor amputations, annual rate per 1,000 adults with diabetes England East Surrey CCG 2.6 (51) 2.3 (48) 2.42 (57) Horsham & Mid Sussex CCG 1.5 (39) 2.0 (57) 2.23 (67) Crawley CCG 1.4 (25) 1.4 (26) 1.77 (30) Coastal West Sussex CCG 1.9 (143) 2.1 (163) 1.84 (184) Brighton & Hove CCG 2.1 (66) 1.8 (58) 2.07 (71) High Weald, Lewes & Havens CCG 2.3 (49) 1.8 (39) 2.15 (59) Hastings & Rother CCG 2.4 (68) 2.4 (69) 2.05 (74) Eastbourne, Hailsham & Seaford CCG 2.7 (76) 2.9 (84) 2.89 (98) South East Coast Total 2.02 (1334) (SEC average) 2.07 (1274) 2.33 (1739) In the first 5 weeks of attending (the National Diabetes Prevention Programme tailored education) I had lost almost a stone in weight and my cholesterol is falling 50 51
53 OUR EVIDENCE OUR EVIDENCE We have a higher spend on angiography and stents than our demographic peers but not always resulting in better outcomes K633, K364, K636: Angiography - Total spend on discharges - Best 5 UNWARRANTED VARIATION: CARDIOVASCULAR DISEASE: OVER-TREATING PATIENTS WITH STABLE ANGINA The NICE pathway states that patients with stable angina should have a computerised temography angiogram first which is non-invasive and cheaper than an invasive angiogram. Only about 20% of patients who have had a CT angiogram would need to go on to have an invasive angiogram. 80% should be given medication to manage their angina. If the medication does not help the pain, a shared decision-making conversation should take place which makes it clear that if the patient has a stent inserted, it will not prolong their life, with the exception of a small defined cohort of our population, but it will help with chest pain. The chart below shows that compared with our demographic peers, we have a lower reported prevalence of CHD than our estimated numbers. Also we have a higher spend on angiography and stents than our demographic peers but not always resulting in better outcomes. There is variation in the implementation of these NICE guidelines across our STP, resulting in too many invasive angiograms and stents. K633, K364, K636: Angiography - Total spend on discharges - CCG K751, K752: Stents - Total spend on discharges - Best 5 K751, K752: Stents - Total spend on discharges - CCG UNWARRANTED VARIATION: TRAUMA AND INJURIES (FALLS AND FRAGILITY FRACTURES) The chart below shows that there is wide variation in the number and treatment of falls compared with our demographic peers: One in three over-65s and half of those over 80 will suffer a fall each year. The Department of Health and Social Care has stated that a falls prevention strategy could reduce the number of falls by 15-30%. Admissions relating to fractures where a fall has occurred, notably hip fractures and those people over 65 without significant injury and are not always getting a multifactorial falls assessment and exercises, which we know reduce subsequent falls by 24%. We do not always have effective case-finding and appropriate drug treatment for osteoporosis, particularly after the first fracture has occurred. We know if this treatment is taken then there is a reduction in the risk of the next fracture by 50%. Tendency to fall, not elsewhere classified (R296): NEL Spend - per 1,000 - Best 5 Rate of injuries due to falls in people aged 65+ per 100,000 age-sex weighted population - Best 5 Percentage of GP registered population aged Best 5 Tendency to fall, not elsewhere classified (R296): NEL Spend - per 1,000 - CCG Rate of injuries due to falls in people aged 65+ per 100,000 age-sex weighted population - CCG Percentage of GP registered population aged CCG Reported to estimated prevalence of CHD (%) - Best 5 Reported to estimated prevalence of CHD (%) - CCG 3, % Mortality from CHD: under 75 - Best 5 6,000 5,000 4,000 3,000 2,000 1,000 0 NHS Brighton & Hove CCG NHS Coastal West Sussex CCG NHS Crawley CCG NHS East Surrey CCG Mortality from CHD: under 75 (%) - CCG NHS Eastbourne, Hailsham and Seaford CCG NHS Hastings and Rother CCG NHS High Weald Lewes Havens CCG NHS Horsham and Mid Sussex CCG 100% 90% 80% 70% 60% 50% 40% 30% 20% 10% 0% 3,000 2,500 2,000 1,500 1, Brighton & Hove CCG Coastal West Sussex CCG Crawley CCG East Surrey CCG Eastbourne, Hailsham and Seaford CCG Hastings and Rother CCG High Weald Lewes Havens CCG Horsham and Mid Sussex CCG 90% 80% 70% 60% 50% 40% 30% 20% 10% 0% CCG CHD PREVALENCE 2.19% 4.11% 2.77% 2.77% 4.12% 4.20% 3.11% 2.96% BEST 5 PREVALENCE 2.86% 3.71% 2.71% 2.69% 3.89% 3.85% 3.33% 2.70% NHS Brighton NHS Coastal NHS Crawley NHS East NHS NHS Hastings NHS High NHS & Hove CCG West Sussex CCG Surrey CCG Eastbourne, and Rother Weald Lewes Horsham and 52 CCG Hailsham and CCG Havens CCG Mid Sussex 53 Seaford CCG CCG
54 OUR EVIDENCE UNWARRANTED VARIATION: MSK For example, In musculoskeletal surgery there is wide variation in: l The volume of Total Hip Replacement surgery per surgeon. 34% of surgeons do less then 10 procedures a year, 54% do less than 20 procedures a year and only 30% perform greater or equal to 50 l The number of revisions within a year post joint replacement per surgeon l The rate of infection post joint replacement per hospital Surgical site infection rates per Trust for Total Hip Replacement 3.5% 3.0% 2.5% 2.0% 1.5% 1.0% 0.5% Number of Total Hip Replacement per surgeon 0.0% Revision rate (%) Total Knee Replacement 1 year revision rates 1.92 WSH WSH WSH WSH-2 WSH WSH-11 BSUH-5 BSUH-7 BSUH-8 WSH-8 BSUH-9 WSH-13 WSH-6 WSH BSUH-3 BSUH-1 BSUH-2 BSUH-4 BSUH-6 WSH-1 WSH-14 UNWARRANTED VARIATION: MSK - TOTAL KNEE REPLACEMENT The chart below shows that we are doing more procedures, spending more on elective care and delivering poorer outcomes than our demographic peers. The % of patients 60 and over having same side knee replacement within one year of arthroscopy is declining but is still six times higher than the national average. Nice Guidance recommends conservative management (exercise/weight management/patient education) before consideration for surgery as these approaches can reduce pain, improve function and avoid the need for a Joint replacement as osteoarthritis is not always a progressive condition. Good quality Shared decision making is important to give patients the information they need to make a decision that s right for them. Primary Knee Replacement - Age-Sex Standardised Spend per 1,000 - Best 5 Knee Replacement (primary), EQ-SD Index, Health Gain - Best 5 Primary Knee Replacement - Age-Sex Standardised Spend per 1,000 - CCG % Of people (over 45) who have knee osteoarthritis (total) - CCG Knee Replacement (primary), EQ-SD Index, Health Gain - CCG 0% Hastings and High Weald Eastbourne, Coastal West Crawley Horsham and Brighton & East Surrey Rother CCG Lewes Hailsham and Sussex CCG CCG Mid Sussex Hove CCG CCG 54 Surgeon Havens CCG Seaford CCG CCG 55 18,000 16,000 14,000 12,000 10,000 8,000 6,000 4,000 2,000 0 % Of people (over 45) who have knee osteoarthritis (total) - Best 5 40% 35% 30% 25% 20% 15% 10% 5%
55 OUR EVIDENCE SUBHEAD STYLE 18,000 16,000 14,000 12,000 10,000 8,000 6,000 4,000 2,000 0 Primary Knee Replacement - Age-Sex Standardised Spend per 1,000 - Best 5 % Of people (over 45) who have knee osteoarthritis (total) - Best 5 Knee Replacement (primary), EQ-SD Index, Health Gain - Best 5 Hastings and Rother CCG High Weald Lewes Havens CCG UNWARRANTED VARIATION: MSK - TOTAL HIP REPLACEMENT The chart below shows we are spending more than our demographic peers with health gain worse (apart from Eastbourne, Hailsham and Seaford CCG) and prevalence is identical. Eastbourne, Hailsham and Seaford CCG Coastal West Sussex CCG Primary Knee Replacement - Age-Sex Standardised Spend per 1,000 - CCG % Of people (over 45) who have knee osteoarthritis (total) - CCG Knee Replacement (primary), EQ-SD Index, Health Gain - CCG Crawley CCG Horsham and Mid Sussex CCG Brighton & Hove CCG East Surrey CCG 40% 35% 30% 25% 20% 15% 10% 5% 0% I would like Community Navigation to be extended in the city. I would like patients to be able to self-refer and to have navigators in communities, like a go to person. Some people only know to go to A&E for urgent care there is a lack of awareness about other places people can go. More needs to be done to promote the alternative to A&E and opening times. AMBULATORY CARE SENSITIVE CONDITIONS Attendances at our A&E Departments continue to rise with a 4% increase reported over the first 3 quarters of compared to Over a quarter of all attendances at A&E could have been treated at another suitable location (e.g. primary care provision) however patient behaviours and the availability of alternative pathways continue to drive this increase in activity. Ambulatory care sensitive conditions CCG Outcomes Indicator Set- domain 2 >> 2.6 Unplanned hospitalisation for chronic ambulatory care sensitive conditions ( (Jul-Jun)) >> East Surrey and Sussex There are several points of contact for access to services, fragmented pathways and gaps in service availability (geographic and time of day), particularly around admissions avoidance and to support hospital discharges. This results in multiple handoffs and confusion over the correct pathways, building in inefficiencies in how services are being delivered, increasing conveyance and admissions and the length of stay in hospitals
56 OUR EVIDENCE DELAYED TRANSFER OF CARE (DTOCS) There are many patients in hospital beds who should be cared for at home. An increasing rate of incomplete to complete pathways has caused a worsening performance against the Referral to Treatment 18 week incomplete standard. At quarter 2 of 2017/18, 5 out of the 6 providers breached the standard. In 2016/17 bed occupancy was at 92.7% (ranked as 35/44 across the STPS) and the percentage of beds attributable to Delayed Transfers of Care (DTOC) was 8.9% (ranked as 37/44 across the STPs). 1 = best, 44 = worst. A disproportionate number of those fit to leave their current setting of care have dementia, with over a quarter of patients with dementia or a cognitive impairment fit to leave waiting for over 50 days to leave their settings of care. FLOW A bed audit carried out across the STP identified 22% of patients across Sussex and East Surrey that are fit to leave their current setting of care. A total of 49% of patients who were classified as fit to leave their current setting of care have remained in hospital for over a week. There were 97% of acute patients fit to leave who were admitted as non-elective patients. A total of 75% of acute patients and 92% of community patients fit to leave their current setting of care are over the age of 70. A majority of delays are attributed to patients awaiting social care, although patient and family choice is a major cause for delay in the community setting. (CF April 2017). Beds Occupied by Stranded Patients (7+ days) Sussex and East Surrey 49% of patients who were classified as fit to leave their current setting of care have remained in hospital for over a week. South East DTOC % (Bed day delays per occupied bed) Sussex & East Surrey 8.0% 7.0% 6.0% 5.0% 4.0% 3.0% KEY FACT 47% of carers in the Counting the Cost survey reported that being in hospital had a significant detrimental effect on the general physical health of the person with dementia and 54% reported a negative effect on the symptoms of dementia such as becoming more confused and less independent (Alzheimer s Society 2009) South East Kent, Surrey and Sussex Brighton and Sussex University Hospital NHS Trust Western Sussex Hospital NHS Foundation Trust Surrey and Sussex Healthcare NHS Trust 59% 58% 57% 56% 55% 54% 53% 52% 51% 50% 49% 48% 47% 46% 45% Nov-17 Dec-17 Jan-18 Feb-18 Mar-18 Surrey and Sussex Healthcare NHS Trust East Sussex Healthcare NHS Trust Western Sussex Hospitals NHS Foundation Trust Brighton and Sussex University Hospitals NHS Trust 2.0% 1.0% East Sussex Healthcare NHS Trust Queen Victoria Hospital NHS Foundation Trust 0.0% Nov-17 Dec-17 Jan-18 Feb-18 Mar
57 OUR EVIDENCE OUR EVIDENCE Beds Occupied by Extended lenght of stay Patients (21+) Sussex and East Surrey 25% 24% 23% 22% 21% 20% 19% 18% 17% 16% 15% Nov-17 Dec-17 Jan-18 Feb-18 Mar-18 Surrey and Sussex Healthcare NHS Trust East Sussex Healthcare NHS Trust Western Sussex Hospitals NHS Foundation Trust Brighton and Sussex University Hospitals NHS Trust Reduction in beds: The Royal Sussex County Hospital site in Brighton is delivering a 10-year strategy to improve their estate, which will impact on their ability to deliver care in a timely way. A strategic/system-wide solution is needed to support those pathways affected as all Trusts will be affected. BED DAY UTILISATION There are currently 3,519 acute inpatient beds across the STP. Bed occupancy across all sites is forecast to increase in 2016/17. Inpatient Beds RSCH Bed capacity will increase as a result of 3Ts and a proposed emergency floor redevelopment Today 3Ts by 2023/24 Proposed Emergency Floor redevelopment BED DAY UTILISATION Across the STP, bed occupancy per provider ranged from 62% (at the specialist provider) to 96% at Quarter /18. Royal Sussex County Hospital Princess Royal Hospital Royal Alexandra Childrens Hospital East Surrey Hospital Worthing Hospital St Richard s Hospital Conquest Hospital Eastbourne DGH Queen Victoria Hospital Compared with our peers, there is statistically significant variation in the number of bed days across all common conditions. There are currently 3,519 acute inpatient beds across the STP. l Average length of stay (AloS) increased between 2010/ /17. BED OCCUPANCY BSUH SaSH WSHT ESHT QVH Demand must be managed to align acute capacity and demand and to prevent shortfalls in available beds to meet the needs l Over the last three years, the general and acute bed base has remained relatively constant but bed occupancy has increased over time. l Bed capacity is expected to increase by 176 beds by 2023/24 at BSUH as a result of the 3Ts rebuild. l Elective referral rates are increasing across the system and longer lengths of stays are driving a significant elective backlog at all Trusts. l Demand must be managed to align acute capacity and demand and to prevent shortfalls in available beds to meet the needs of the population. 15/16 93% 72% 85% 94% 89% 85% 88% 101% 62% 16/17 96% 74% 88% 96% 91% 87% 90% 103% 64% of the population Royal Sussex County Hospital Princess Royal Hospital Royal Alexandra Childrens Hospital East Surrey Hospital Worthing Hospital St Richard s Hospital Conquest Hospital Eastbourne DGH Queen Victoria Hospital
58 SUBHEAD STYLE OUR EVIDENCE Average occupancy by quarter Q Q % 95% SES Weighted Average England CARE QULITY COMMISSION (CQC) RATINGS Brighton and Sussex University Hospitals NHS Trust (BSUH): The Trust was last inspected in April 2016 and updated in August CQC found them to be inadequate in the areas of safety, responsiveness and leadership. The culture of the Trust was viewed as exceptionally challenging. Since the inspection, Western Sussex Hospitals NHS Foundation Trust has taken over the management of the BSUH and improvements have been seen in a number of areas. Everything was rated as good or outstanding, apart from the Emergency Department 90% 85% East Sussex Healthcare NHS Trust: In June 2018, the CQC noted the Trust has made a marked improvement in the quality of its care, and concludes that the Trust no longer needs to be in special measures for quality. In the areas inspected by the CQC, everything was rated as good or outstanding, apart from the Emergency Department at Eastbourne, which was rated as requires improvement, but good for well led and caring. at Eastbourne, which was rated as requires improvement, but good for well led and caring. 80% Q Q Q Q Total general and acute bed base Q Q , Q Q Q Q Q Q Q SECAmb: Following CQC inspection in 2017 the Trust was rated as Inadequate. This resulted in the Trust remaining in Special Measures and the development of a recovery plan that addresses CQC findings together with work across different areas of the Trust. This includes an overarching Culture and Organisational Development and an extensive programme of work dealing with workforce, recruitment, training and retention. CQC is conducting an inspection of the Trust in July (Core Services and Emergency Operations Centre) and August (Well Led) this year. The results of the inspection will be published in the Autumn. The work across the Trust is also being informed by a jointly commissioned Demand and Capacity review to identify resource requirements to fully meet Ambulance Response Programme standards. 800 TRUST CQC RATING 700 BSUH Good BSUH SaSH ESHT WSHT SASH QVH Requires improvement Outstanding Outstanding Good WSHT ESHT QVH SPFT SCFT FCH SB Good Good Outstanding Good Q1 Q2 Q3 Q4 Q1 Q2 Q3 Q4 Q1 Q2 Q IC24 Good 63 SECAMB Inadequate
59 SUBHEAD STYLE OUR EVIDENCE MENTAL HEALTH SERVICES The health and life outcomes for people experiencing mental health issues in our STP will continue to fall short of those of the general population unless we act to deliver the opportunities aligned with the five year forward view for mental health. To meet the government target of 21,000 new mental health posts by 2021, the STP projected response is set out below The Sussex and East Surrey STP has an agreed Mental Health Strategy following a detailed Case for Change which identified that: l Sussex and East Surrey STP need to ensure that 25% of people living with common mental health problems are seen by a local Improved Access to Psychological Therapies service every year. l Capacity needs to be built in primary care, closer to home and thereby reduce presentations and referrals to physical and mental health secondary care. l For dementia, prevalence is 25% higher than nationally, will increase further as the population ages, while the proportion of those with a diagnosis is 5% lower. l A quarter of those patients with dementia who are fit to leave acute care wait over 50 days for discharge. l Three quarters of first episodes of mental ill health occur in young people before the age of 25. KEY FACT Life expectancy for those with severe mental illness is twenty years worse than the general population My partners mental health and mine wasn t a priority after my stillborn, they took slightly better care but no mention of mental care at any appointments Mental Health Services - Posts and People , Clinical posts: Choice New posts in growth areas Posts Non-Clinical posts: 271 l The prevalence of Severe Mental Illness is 5% higher than nationally, affecting 25,000 individuals. 169 Choice Transfer posts to transformation & growth areas Assumption modelled on observed trend Leavers - Non Clinical Assumption modelled on observed Choice trend Choice Fixed Choice Replacement Staff (Local) Leavers - Clinical People Improved retention Newly Qualified Staff from training New roles (Nurse Associates, Physicians Associates etc) 727 4,290 Impact vacancy difference Staff in Post difference Dynamic V Static inputs GP SERVICES The National Picture Workload: Actual GP appointment numbers are not routinely collected by NHS England but the information we have would suggest significant rises, for instance 15.4% between 2010/11 and 2014/15. The Kings Fund (2016) estimated that there had been a 15 per cent overall increase in contacts, 13 per cent increase in face-to-face contacts and a 63 per cent increase in telephone contacts. Workforce numbers: Nearly a quarter (23%) of the GP workforce is over 55. Less than a quarter (22%) of GP trainees plan to practise full-time one year after qualifying, according to a recent study by the King s Fund, falling to 5% who expect to be working full time after 10 years. The intensity of the working day was cited as the most common reason. Morale: A 2017 survey conducted by Exeter University in the South West indicated that over half of the GP workforce reported low or very low morale, and 40% of all GPs intended to retire within five years. Practice Closures: Increasing numbers of practices are either closing their lists to new patients (a medium term approach) or capping their list (a shorter term approach), in order to maintain the quality of the service to existing patients within the resources they have. Estates Issues: A 2018 BMA Survey revealed that four out of 10 GPs feel their premises are not adequate for patient care, describing how they are Less than a quarter (22%) of GP trainees plan to practise fulltime one year after qualifying Base Staff in Post Vacancies 64 + Change - Change struggling to provide essential services in buildings that are cramped and 65

60 OUR EVIDENCE SUBHEAD STYLE Pressure through retirement of partners and salaried GPs has been a contributing factor to 16 practices closing and 10 mergers since 2013 outdated. It also reported that six out of 10 GPs in England are forced to share consulting rooms or hot-desk around their surgeries. STP examples l Increasing elderly: The West Sussex Joint Services Needs Assessment (JSNA) estimates that the local population aged 70+ will grow at the fastest rate of any demographic; and that by 2039 more than 30% of the CCG resident population will be aged 65 or over. They also project that this means that the number of adults in this age group admitted to hospital with falls will nearly double over the same period. There are already some small areas of West Sussex where more than 50% of the resident population are aged 65 or above. Between 2018 and 2030 the JSNA predicts that the number of cases of dementia will rise by 45%. l Workforce: According to NHS England figures, in 2015 there were 960 full time equivalent (FTE) GPs across East Surrey and Sussex. In order to deliver the growth required to deliver our proportion of the 5,000 extra GPs promised in the GP Forward View we would need to boost that to 1106 FTE GPs (so an increase of 146). However the GP FTE across the patch as of Sept 2017 number 936 a fall of 24 FTE, or 170 short of the target Figures for nurses seem to be broadly stable, GP Nurses FTE as of Sept 2015 numbering 502, and as of June 2018, 522. Large percentage of both practice nurses and GPs in our area that are over 55 and coming up to retirement. It is anticipated that there will be a loss of a third of GPs over next 10 years as they reach 55+. The retirement risk in ESBT is 46% of practice nurses in Hastings and Rother and 31% in Eastbourne, Hailsham and Seaford age 55+ with GPs 55+ at 24% in Hastings and Rother and 17% in Eastbourne, Hailsham and Seaford. Currently 210 GPs (18.5% of the workforce) are over 55 years. l The STP has 203 practices. There are 12 single-handed GP practices and 189 partnerships, with the smallest registered list of 1,379 and the largest being 25,054. Pressure through retirement of partners and salaried GPs has been a contributing factor to 16 practices closing and 10 mergers since The GP workforce across the STP is in decline, of between 3% in the Coastal West Sussex area to 15% in Hastings and Rother CCG. In Brighton, nine surgeries (out of an initial total of 44) have closed in the last four years, displacing more than 33,000 patients, and putting extra pressure on already-struggling practices nearby. Brighton has been described in the press as possibly the hardest hit town in the whole of the UK? In Hastings and St Leonards, at one point in the last 12 months 10 out of 14 practices had either closed or capped their patient lists, putting enormous pressure on the remaining practices. In Arun in Coastal West closure of a practice of 8,000 patients. The retirement of partners and salaried GPs has been a contribution factor to 16 practice closures and 10 mergers. l Utilising the GP international recruitment scheme has not delivered the volume of new GPs anticipated. A target of 25 was set for 2018 but only five have been recruited. OUR SERVICES KEY FACTS l Our pathways are often fragmented and there are frequent breakdowns in handoffs between agencies. l There are delays in people accessing services and therefore may be missing out on timely treatment. l There is a lack of timely access to effective primary and community services driven by insufficient capacity in primary care and community services. l Discharge arrangements from acute care is variable, which means patients spend longer than necessary in hospital. l We are often not meeting our constitutional standards for A&E, Referral to-treatment. l There are gaps in reaching minimum standards of care in such areas as stroke, diabetes and cancer. l General practice is facing significant issues in workforce with a backdrop of increasing demand MAIN CHALLENGES: l Addressing the significant un-warranted variation in MSK, Cardiovascular and falls/ fragility fractures. l Making a step change in managing flow, stranded and super stranded patients. l Improving shared decision making. THE CONSEQUENCE WE OBSERVE: l Frequent, unnecessary admissions to hospital when patients could be cared for in a different setting. 66 Sussex, three out of six practices have had to cap their lists due to the 67 l Challenge in meeting and maintaining A&E and elective care targets. There are gaps in reaching minimum standards of care in such areas as stroke, diabetes and cancer.
61 OUR EVIDENCE OUR EVIDENCE OUR PEOPLE - OUR CHALLENGES CROSS CUTTING THEMES CROSS CUTTING THEMES RECRUITMENT & RETENTION COLLABORATIVE WORKING ACROSS STP Our evidence: Our staff LEADERSHIP CAPABILITY USE OF TEMPORARY STAFF STAFF HEALTH STAFF ENGAGEMENT l In social care there is a significant annual turnover of 26% for registered nurses, which rises to 32% turnover amongst support workers providing direct care in East Sussex. l Skills for care estimates that in Brighton & Hove, 8.6% of roles in adult social care were vacant, this equates to around 700 vacancies at any one time. This vacancy rate was similar to the region average, at 6.8% and similar to England at 6.6%. l Difficulty recruiting and retaining substantive mental health nurses and psychiatrists, has led to a sustained and increasing agency spend (in Sussex agency spend in mental health services was 2.6m in 2012/13 rising to 9.8m in 2015/16). Difficulty recruiting and retaining substantive mental health nurses and psychiatrists, has led to a sustained and increasing agency spend CROSS CUTTING THEMES CROSS CUTTING LOCAL THEMES LACK OF SPECIALIST POSTHOLDERS MENTAL HEALTH Recruitment and retention of staff Culture of working in mental health Complex structures and links to social care REDUCTION IN EDUCATION FUNDING PRIMARY & COMMUNITY CARE Lack of GPs (current & future) Demographic of workforce Cross site working/ collaboration New roles required to meet increasing demand SIGNIFICANT VARIATIONS IN WORKFORCE ACUTE Reliance on temporary staff Mode/hospital variations Nursing, midwifery, medical and AHP recruitment SECAMB High attrition Attraction to skilled roles Culture Leadership SOCIAL CARE Finding & keeping the right staff Terms & conditions of service Job roles Working conditions KEY FACTS l There are 10,926 headcount staff and 9, FTE Registered Nursing, Midwifery and Health Visiting Staff across Sussex and East Surrey STP. l The average retirement age is 59, with 15.38% of staff aged 55 years and over. The staff groups with over 20% of staff aged 55 and over that may be approaching retirement ranges from Registered School Nurses at 31% to Community Services (excl. Health Visitors and District Nurses) at 20.68%. l The Turnover Rate for all Registered Nursing, Midwifery and Health Visiting Staff ranges from 12.84% in Maternity Services (excl. l In June 2017, the SES STP had a shortfall of GPs (FTE) of 193. l The average level of sickness absence across acute trusts for was just over 4%. Just a 1% improvement in sickness absence equates to 280m in staff costs without accounting for lower dependence on agency staff and reduced cancellations. l Spend on temporary staffing continues to increase. KEY ISSUES: l We have significant issues relating to workforce and need to ensure we have the right people in the right place at the right time to deliver care. l Given our demography, we need to rely as much on technologyenabled care as on state funded clinical and domiciliary workforce. There just won t be as many employees available in future as would be needed to provide current services to a larger population with more retired people and not many more working-age citizens. l We have an inadequate number of mental health posts to meet the needs of our population. l We need to increase the workforce within Primary Care to support changes to the way we deliver care across the system. THE CONSEQUENCES WE OBSERVE: l There is a real risk that we are failing to attract and retain the best talent. l There is a significant risk to the resilience of services and the 68 Registered Midwives) to 20.29% in district nursing. 69 sustainability of a workforce.

62 OUR EVIDENCE OUR EVIDENCE Significant elements of the estate are either functionally unsuitable or compromised in the current configuration Our evidence: Our infastructure ESTATES There is a diverse legacy of primary, community and acute provider estate across the STP. Historically there have been many years of under-investment in estate, which has resulted in non-compliance, high backlog maintenance and inefficient estate with high running costs. Significant elements of the estate are either functionally unsuitable or compromised in the current configuration. DIGITALISATION Individual Digital Maturity of secondary care providers is broadly in line with national average with evidence of improvement over the past year. However the maturity levels between providers vary significantly. There is significant variation in technology usage across the STP with limited consolidation of suppliers except for PACS (Picture and Communication System) for Radiology, which represents a significant opportunity. There is a lack of effective information sharing which presents a significant barrier to implementing new models of care. There is multiple ownership of the estate, which ranges from NHS acute and community provider organisations, GP partners, NHS Property Services, third party commercial landlords, public/private partnerships to local authority partners. There is a lack of formal lease/licence agreements in place resulting in ambiguity over estates running costs, occupation and utilisation information. Estates running costs are higher than the national Carter benchmark indicators. Key high cost acute sites include the Royal Sussex County Hospital, St Richards Hospital, Worthing Hospital, East Surrey Hospital and Eastbourne District General Hospital. There is also a substantial backlog maintenance requirement across the acute and community estate, with high and significant risk elements exceeding 81million (excluding primary care and NHS Property Services community estate). Population Health Management and Risk Stratification are fragmented and vary in use and sophistication. The information governance community is capable and enthusiastic, but capacity is variable and is a limited resource overall. Clinicians and professionals lack clarity and confidence to support information sharing. Digital Maturity - Secondary Care Sussex and East Surrey 2016 Sussex and East Surrey Strategy Alignment Leadership Resourcing Governance Information Governance Records & Plans Assessment Care Transfer of Orders & Results Management Medicine Optimisation Decision Support Remote & Assistance Care Asset & Resource Optimisation Enabling Infrastructure Clinical Business & Intelligence Standards

63 SUBHEAD STYLE OUR EVIDENCE FINANCE Current situation: The STP covers a wide geographical area and many organisations, with a notable amount of variation in financial performance. In 2017/18, seven out of nine Trusts ended the year in surplus. The two trusts in deficit - East Sussex Healthcare NHS Trust and Brighton and Sussex University Hospitals NHS Trust - are in Financial Special Measures. Of eight CCGs in the footprint, one ended the year in surplus. Overall the combined net deficit (surpluses and deficits added together) for CCGs and trusts was 228.2m. It should also be noted that this figure includes significant amounts of one-off funding, including Sustainability and Transformation Funding, which was released at the end of the year. 2018/19 planning: Control totals (the required surplus/deficit set by regulators) for 2018/19 add up to a total net deficit of 185.8m for CCGs and Trusts, including one-off sustainability funding for providers. An additional 111.6m of commissioner sustainability funding is available to those CCGs that meet their deficit control totals. OUR INFRASTRUCTURE KEY FACTS There is a multiplicity of IT system many of which do not communicate to each other. l We have Information Governance issues. l There is a significant mismatch between revenue and expenditure. l We have higher use of acute services that are proportionally more expensive. l Our community and primary care assets are not optimised or necessarily fit for purpose. Main challenges: l The provision of a balanced estate portfolio that is fit for purpose in a constrained capital environment and meets the needs of the population. Our community and primary care assets are not optimised or necessarily fit for purpose. Strategic Financial Framework: The STP has a Strategic Financial Framework that sets out the approach to system-wide financial sustainability over a 5-year time horizon. It is comprised of four elements: l Improving productivity and efficiency l Delivering the right care to improve value l Achieving a sizable reduction in the current deficit position of the STP. l Rising to the Digital requirements as a priority. The consequence we observe: l Duplication in processes. l Transforming and investing for change l Inability to maximise use of technology for patient benefits. l Improving system contracting/admin These elements are progressed through 11 STP programme priority areas and supported by four enabling work streams. The STP five-year financial model brings these aspects together and calculates their combined medium to long-term financial impact, taking account of risk, to allow financial sustainability to be assessed. This is updated iteratively to reflect the progress and evolution of ongoing transformation work, and to allow reassessment of its financial impact

64 OUR PRIORITIES OUR PRIORITIES Our priorities The evidence presented in the Population Health Check naturally leads to the following priorities. l Addressing capacity and demand l Tackling unwarranted clinical variation l Reduced productivity. l We cannot afford to continue to pay for services at the current rate. 5. Reducing A&E attendances through ensuring the resources are available to support patients nearer home, including addressing fragmented pathways, gaps in service availability, communication across services, mental health support and digital shortfalls which block shared access to information. Make navigating the system easy for the public and encourage the development of advance and anticipatory care plans which are accessible to all who need to see them. l Focussing on workforce l Moving to a people centred value based system l Reducing the financial deficit We need to deliver value across our STP i.e. the best outcomes for the individual and for our population within the available resources. This includes doing less of things that add little or no value to patients. This includes reducing the over medicalisation of care. This requires: 1. The development and implementation of a clear workforce and capacity strategy, which will address the short-term and long term (future-proofing) crisis in relation to the number of staff and skills. 2. Improving shared decision making i.e. more active involvement with well-informed patients and developing and using standardised outcome measures that are more relevant to patients (such as the impact on their functional status and wellbeing). 3. Leading the reframing our cultural norms, so that making the right choice in relation to lifestyle changes, is the easy choice. This includes putting initiatives, such as Making Every Contact Count and healthy eating, into relevant contracts to deliver the highest standards of workbased health. 4. Recognising unwarranted clinical variation and addressing it. We can achieve this through the combination of Right Care, Clinically Effective Commissioning and Getting it Right First Time (GIRFT) all of which describe key clinical areas where Quality Improvement is required
65 NEXT STEPS NEXT STEPS Next steps We need to develop a clinical strategy which delivers best value and patient centred care. PERSON CENTRED APPROACHES FRAMEWORK (SKILLS FOR HEALTH/SKILLS FOR CARE/HEALTH EDUCATION ENGLAND) ENABLING PEOPLE TO WORK IN THIS WAY THROUGH DEVELOPMENT OF THE WORKFORCE, ORGANISATIONS AND SYSTEMS 3complexity and sigificant risk collaboratively manage highest LEARNING OUTCOMES Conversations with people to BEHAVIOURS CORE COMMUNICATION AND RELATIONSHIP BUILDING SKILLS Person-Centred Approaches BEHAVIOURS LEARNING OUTCOMES VALUES LEARNING OUTCOMES Coversations to engage with people Conversations to enable and support people WE NEED TO DEVELOP A CLINICAL STRATEGY WHICH IS FUTURE PROOFED On a local level Sussex and East Surrey is facing significant challenges in providing sustainable care for its population. These challenges include financial pressures as well as workforce recruitment and retention shortfalls. Much of this Population Health Check describes variation in consumption of healthcare, through variation in referral from primary 1 BEHAVIOURS 2 LEARNING OUTCOMES length of stay and bed occupancy (note the Carnell Farrar data and information provided by Rightcare), and the consequent opportunity this affords the STP. This provides both the immediate case for change and the initial targets. Eric Topol is conducting his review with Health Education England for the Secretary of State on how technology will impact care and the training of carers. This review builds on Facing the Facts, Shaping the future (Health Education England, December 2017) and starts with acknowledging that the pace of development of genomics, digitisation and data analytics, machine learning and AI, biotech, nanotech and robotics is game changing. An empowered and more digitally aware and competent population will demand at the least that the medical information known about them is recorded in a way that promotes their care. We already see both the success and acceptability of care records that can be read by paramedics, primary care and the emergency department. Advanced care decisions that are not paper based and don t need to be sought and transferred with the patient from the nursing home out of hours with a high chance of loss is acceptable to the public and to staff. In fact it is probably already more acceptable than the unreliable paper based norm. We already see the common theme of complaint of people being asked repeatedly, by a succession of carers for the same information. This is probably a basic and the advantage in reducing conveyance, reducing harm and reducing length of stay has been demonstrated. Beyond this people will increasingly expect a better offering, more tailored to them as an individual, responsive when they need it not batched for provider convenience. Again, within this STP, there are models of care that are not face to face and are IT-enabled. These have reduced out-patient attendance, crowding in waiting rooms, and cost (e.g. Digital virtual clinics for people living with inflammatory bowel disease and Virtual Fracture Clinics in BSUH). Importantly they have left patients feeling better supported and better able to manage their long term conditions and stay motivated in their recovery. They provide a digital relationship and connection to clinicians and healthcare professionals more suited to the always on expectations of our digital selves. The importance of the digital agenda has been underlined by the Prime minister in her Macclesfield speech. The Office for Life sciences (OLS) has issued a variety of challenges and at the present time there are open calls for a second wave of digital and Internet of Things (IOT) test beds, An empowered 76 care, through to differences locally to peers in secondary care intervention, industrial strategy challenge funding, ageing grand challenges, an active 77 and more digitally aware and competent population will demand at the least that the medical information known about them is recorded in a way that promotes their care.
66 NEXT STEPS NEXT STEPS Brighton ranked particularly strongly in its innovation for data, virtual reality, health and artificial intelligence despite being relatively smaller than its competitors call for new Collaborations of Leadership in Applied Health Research and Care (this time badged as Applied Research Collaborations). All of these calls have tens of millions of pounds available to demonstrate new ways of working, drawing on modern and forward-facing technology, that deliver improved outcomes with a different kind of workforce. All require scalability and all require a legacy to be left locally. Our STP contains a medical school, two universities, thoughtful and effective collaborations between health and social care, between academia and industry and care. It has an abundance of small and medium enterprises with Brighton & Hove ranked fourth in a new index highlighting the size and success of digital industries around the country and their potential for growth. Brighton ranked particularly strongly in its innovation for data, virtual reality, health and artificial intelligence despite being relatively smaller than its competitors. It has a strong record of research and of education. It is bracketed by two STPs with similarly strong records of new models of care (Kent vanguard, Surrey wave one Internet of Things test bed). Its hospitals already connect digitally around imaging and diagnostics. WE NEED TO DEVELOP A CLINICAL STRATEGY WHICH IS CLEAR ON THE OPTIMAL POPULATION SIZE TO LEAD DELIVERY Some of the changes needed will be led and delivered locally, supported by the STP as the direction of travel. A few will be led by the STP organisations together, providing that adds value and does not duplicate local work. E - REGIONAL & EMERGENCY SYSTEM - 4.5M D - CLINICAL & DIAGNOSTIC NETWORKS - 2.5M C - STP/SYSTEM WIDE M B - PLACE BASED CARE COMMUNITY - 500K We also should not miss the link that investment in the local economy improves job prospects, affluence and helps mitigate the impact that poverty has on the health and wellbeing of our local population. There are strong digital and IT economic sectors already in our local economies with around 25% of Brighton & Hove s economy is in the Creative Digital and IT sector which has seen 40% growth over the past 5 years, with strong academic relationships through the Digital Catapult and one of the first 5G testbeds in the country. BUSINESS LANDSCAPE National Engagement A - LOCAL COMMUNITY TEAM K Emergency System Partner Support Regional & Emergency System (E) In our quest to drive out waste and address historic financial over spend, which is urgent, we will take the opportunity to work on models of care that put our people at the heart of new pathways. We must not lose sight of this. Surrey & Sussex Cancer Alliance Operational Delivery Networks Expert Opinion & Diagnostics Regional Diagnostics Alliance Population Health Management Capacity Planning & Coordination Population Health Intelligence Integrated Care/ wider system pathways Integrated Urgent & Emergency Care Clinical & Diagnostic Networks (D) STP/Urgent Care System (C) Place Based Care Community (B) Prevention & Self Management Patient Identification & Care Planning MDTs Local Community Team (A) 78 79

67 NEXT STEPS NEXT STEPS LOCAL COMMUNITY TEAM 30-50K Prevention & Self Management l Falls prevention l Social prescribing l Health coaching l Building knowledge & changing behaviours l Support for people to manage their long term condition PLACE BASED CARE COMMUNITY 500K Expert Opinion & Diagnostics l Timely diagnostics l Access to expert opinion l Timely assessment Patient identification & care planning l Identifying frail & vunerable patients l Developing and implementing care plans Capacity Planning & Coordination l Demand & Capacity Planning l Transitions of care & patient flow l Mental health liaison l Social care coordination l Community & capacity development Integrated Urgent & Emergency Care l A&E coordination l See and Treat Multi-disciplinary Teams l Care coordination l Reablement l Bringing integrated Health and Social Care into the home l Rapid response l Single Point of Access l Telecare/health THE PROCESS OF DEVELOPING THE CLINICAL STRATEGY (ADDED POST SIGN OFF. STP EXEC GROUP AGREEMENT) The Population Health Check provides the rationale for addressing certain themes as priorities; it does not attempt to offer solutions. In order to achieve that, we will now: l Develop a public-facing version of the report, which will include graphics and a visual explanation of the report for the open section of Boards and Governing Bodies. l Draft an engagement and communication strategy in order to ensure we are engaging at the earliest opportunity on how to address the themes identified. l Our Medical Directors and Chief Nurses will be discussing the report more widely internally with their clinical colleagues and with their Executive leads. This Clinicallyled Strategy will describe how we will be moving forward on delivery of the priorities at pace. STP/WIDER SYSTEM 1.7M Operational Delivery Networks and clinical networks l Trauma l Maternity l Vascular l Burns l Clinical networks: specialist cardiology, cardiac surgery, renal dialysis, and paediatric surgery Population Health Management l Population health planning l research and Evaluation l Provider and collaboration Integrated Care/wider system pathways l 111 Service l UEC l Mental Health l Capacity (3Ts) l Clinical variation l Maternity l We will be ensuring that co-dependent strategies, such as workforce, digital technology, estates etc. are aligned with the Population Health Check and the developing Clinical Strategy. l Develop a plan to deliver a Clinical Strategy within six months. This Clinically-led Strategy will describe how we will be moving forward on delivery of the priorities at pace. CLINICAL & DIAGNOSTIC NETWORKS 12.5 Clinical & Diagnostic Networks l Surrey & Sussex Cancer Alliance l Radiology Network l Pathology l South East Clinical Networks Population Health analytics l Sussex & Surrey Integrated Dataset l Research and Evaluation l Have had an opportunity to contribute to its development. l Agree with the Population Health Check, including the next steps. l Are committed to championing the Population Health Check and contributing to the development and delivery of the resulting Clinical Strategy. REGIONAL & 1.7M National Engagement Emergency System Partner Support l NHS England l NHS Improvement l NHS Digital l Specialist Commissioning l 999 & Ambulance Service l care Plan Sharing service l HEE KSS l KSS AHSN l NIHR Clinical Research Network KSS l South East Coast Clinical Senate 80 81
68 AGREEMENT AGREEMENT Agreement from the Core members of the STP Clinical and Professional Cabinet We would like to formally confirm our support for this Population Health Check. We confirm that we: l Have had an opportunity to contribute to its development l Agree with the Population Health Check, including the next steps l Are committed to championing the Population Health Check and contributing to the development and delivery of the resulting Clinical Strategy David Walker Medical Director East Sussex Healthcare NHS Trust 22/08/2018 Ed Pickles Medical Director Queen Victoria Hospital NHS FT 17/09/2018 Karen Eastman Clinical Lead for Unwarranted SES STP 12/09/2018 Clinical Variation Fionna Moore Medical Director South East Coast Ambulance 29/08/2018 Services NHS FT Des Holden Medical Director Surrey and Sussex Healthcare 02/10/2018 NHS Trust Richard Quirk Medical Director Sussex Community NHS FT 13/09/2018 Rick Fraser Consultant Psychiatrist and Sussex Partnership NHS FT 30/08/2018 Chief Medical Officer Justin Wilson Chief Medical Officer Surrey and Borders Partnership 09/10/2018 NHS Trust Sue Marshall Executive Chief Nurse Sussex Community NHS FT 13/09/2018 Jonathon Warren Chief Nurse Surrey and Borders Partnership Trust 22/08/2018 Liz Mouland Chief Nurse and Director of First Community Health and Care 21/08/2018 Clinical Standards Patricia Brayden Medical Director St Catherine s Hospice, Crawley 31/08/2018 Andrew Catto Medical Director IC24 31/08/2018 Name Title Organisation Date agreed Minesh Patel Clinical Chair (Co-chairperson) NHS Horsham and Mid Sussex CCG 25/09/2018 Peter Larsen-Disney Clinical Director of 3Ts Brighton and Sussex 20/08/2018 (Co-chairperson) University Hospital NHS FT Rob Haigh Medical Director Brighton and Sussex University 14/09/2018 Hospitals NHS Trust George Findlay Chief Medical Officer/ Deputy Brighton and Sussex 02/10/2018 CEO University NHS Trust and Western Sussex Hospitals NHS FT David Supple Clinical Chair NHS Brighton and Hove CCG 05/09/2018 Gill Galliano Acting Lay Chair NHS Coastal West Sussex CCG 02/10/2018 Alison Taylor Deputy Medical Director NHSE 29/08/2018 Allison Cannon Chief Nurse STP Commissioners 28/08/2018 Karen Devanny Chief Nurse and Director CSESCA 12/09/2018 of Quality Guy Boersma Managing Director KSS AHSN 17/09/2018 Michael Bosch RCGP STP Ambassador and Alliance for Better Care 20/08/2018 Alliance for Better Care GP GP Federation Federation Anna Raleigh Director of Public Health WS CC-Evidence: Our Population 18/09/2018 and Demographics Richard Brown Medical Director S&SLMCs 20/09/2018 Laura Hill Clinical Chair NHS Crawley CCG 05/09/2018 Elango Vijaykumar Clinical Chair NHS East Surrey CCG 25/09/2018 Martin Writer Clinical Chair NHS Eastbourne, Hailsham and 02/10/2018 Seaford CCG David Warden Clinical Chair NHS Hastings and Rother CCG 13/09/2018 Elizabeth Gill Clinical Chair NHS High Weald Lewes Havens CCG 25/09/
69 AGREEMENT CONTRIBUTORS Agreement from the Core members of the STP Clinical and Professional Cabinet Contribution list List of colleagues who have received and have been given the opportunity to contribute to the Population Health Check so far We would like to formally confirm our support for this Population Health Check. We confirm that we: l Have had an opportunity to contribute to its development l Agree with the Population Health Check, including the next steps Bob Alexander STP Executive Chair SES STP Bruce Allan GP Worthing Medical Group Sam Allan Chief Executive SPFT Helen Atkinson Executive Director of Public Health and Head of Surrey County Council Adult services Michael Bailey STP workforce Project lead SES STP Gaynor Baker STP Estates Lead SES STP Name Title Organisation Date agreed Lawrence Goldberg Chair South East Clinical Senate 20/08/2018 Paul Bennett Delivery and Improvement Director NHSI (SE) Sarah Billiard Chief Executive First Community Health and Care Michael Bosch RCGP STP Ambassador and Alliance for Better Alliance for Better Care GP Care GP Federation Federation Guy Boersma Managing Director KSS AHSN Patricia Brayden Medical Director St Catherine s Hospice, Crawley Karen Breen TP Programme Director SES STP Richard Brown Medical Director Surrey and Sussex LMC Jessica Britten Chief Operating Officer ESBT Adrian Bull Chief Executive ESHT Allison Cannon Chief Nurse STP Commissioners Andrew Catto Medical Director IC24 Jacqueline Clay Principal Manager West Sussex Public Health and Social Research Unit Karen Devanny Chief Nurse and Director of Quality CSESCA Sarah Doffman Chief of Medicine Brighton and Sussex University Hospital NHS FT Adam Doyle Accountable Officer CSESA and CWS CCG Karen Eastman Lead for Unwarranted Clinical Variation SES STP 84 85
70 CONTRIBUTORS CONTRIBUTORS Fiona Edwards Chief Executive Surrey and Borders NHS Trust Amanda Fadero Director Coastal Care George Findlay Chief Medical Officer/ Deputy CEO Brighton and Sussex University Hospitals NHS Trust Western Sussex Hospitals NHS FT Pennie Ford Director of Assurance and Delivery NHSE (SE) Rick Fraser Consultant Psychiatrist and Chief Medical Officer Sussex Partnership NHS FT Darrell Gale Director of Public Health East Sussex County Council Elizabeth Gill Clinical Chair NHS High Weald Lewes Havens CCG Rachel Gill Consultant in Public Health Surrey County Council Lawrence Goldberg Chair South East Clinical Senate Marianne Griffiths Chief Executive WSHT and BSUH Tom Gurney Communications Lead SES STP Rob Haigh Medical Director Brighton and Sussex University Hospitals NHS Trust Des Holden Medical Director Surrey and Sussex Healthcare NHS Trust Laura Hill Clinical Chair NHS Crawley CCG Jackie Huddleston NHS England South East (Kent, Surrey, Sussex) NHS England South East (Kent, Surrey, Sussex) Caroline Huff Clinical Programme Director SES STP Steve Jenkin Chief Executive QVH Maggie Keating STP UECN Senior Programme Manager SES STP Peter Kottlar Chief Operating Officer East Surrey CCG (CSESA) Peter Larsen-Disney Clinical Director of BSUH 3Ts and Co-chairperson Brighton and Sussex University of the SES STP Clinical and Professional Cabinet Hospital NHS FT David Lipscomb Chair Diabetes Oversight Group Sussex and Surrey STP SCFT Hugo Luck Associate Director of Operations HWLH CCG and CSESA (S) Nick Lake Deputy Medical Director SPFT Vaughan Lewis Medical Director Specialised Commissioning NHS South NHSE Susan Marshall Chief Nurse Sussex Community NHS FT Siobhan Melia Chief Executive SCFT Ralph McCormack Programme Director Commissioning Programmes STP Liz Mouland Chief Nurse and Director of Clinical Standards First Community Health and Care Minesh Patel CCG Clinical Chair and Co-chairperson of the SES NHS Horsham and Mid Sussex STP Clinical and Professional Cabinet CCG Maggie Patching Workforce Transformation Lead HEKSS Amanda Philpott Accountable Officer HR CCG and EHS CCG Ed Pickles Medical Director Queen Victoria Hospital NHS FT Mark Preston Director of Organisational Development & People SASH Richard Quirk Medical Director Sussex Community NHS FT Anna Raleigh Director of Public Health and co-ordinating lead West Sussex CC for SES STP DsPH input Rosalind Ranson Primary Care Lead IC24 Nicola Rosenberg Public Health Consultant BH CC Paul Simpson Chair SES STP Finance Group Ashley Scarff Director of Commissioning & Deputy Chief Officer HWLH CCG Sam Stanbridge Director of Commissioning East Surrey CCG (CSESA) Su Stone Clinical chair NHS Coastal West Sussex CCG David Supple Clinical Chair NHS Brighton and Hove CCG Alison Taylor Deputy Medical Director NHSE Tim Taylor Medical Director Western Sussex Hospitals NHS FT Sarah Valentine Strategic Director of Contracting & Performance Sussex & East Surrey CCGs David Walker Medical Director East Sussex Healthcare NHS Trust David Warden Clinical Chair NHS Hastings and Rother CCG Jonathan Warren Chief Nurse Surrey and Borders Partnership Trust Mark Watson Digital Programme Manager SES STP Justin Wilson Chief Medical Director Surrey and Borders Partnership NHS FT Michael Wilson Chief Executive SASH Martin Writer Clinical Chair NHS Eastbourne, Hailsham and Seaford CCG Elango Vijaykuma Clinical Chair NHS East Surrey CCG Alistair Hill Director of Public Health BH City Council Fionna Moore Medical director South East Coast Ambulance Services NHS FT 86 87
71 REFERENCES REFERENCES References/bibliography ESBT (East Sussex Better Together) (Nov 2016) The Case for Change in East Sussex (Accountable Care) sites/10/2016/11/the-case-for-change-in-east-sussex-accountable-care.pdf Alzheimer s Society (2009) Counting the cost: Caring for people with dementia on hospital wards. report.pdf BMA (2018) GP premises not fit for patients. Carnell Farrer (CF) (March 2017) Acute services work stream: demand and capacity review. (On application STP Office) Carnell Farrer (CF) (April 2017) Sussex and East Surrey STP review and refresh. Summary report. (On application STP Office) Carnell Farrer (April 2017b) Capped expenditure process information for benchmarking and opportunities. Available on application Carter, (2016) (DoH) Operational productivity and performance in English NHS acute hospitals: Unwarranted variations. An independent report for the Department of Health by Lord Carter of Coles file/499229/operational_productivity_a.pdf Central Sussex and East Surrey Alliance (2016) Place Based Delivery Plan Based%20Plan%20FINAL.pdf CSESA Primary Care Cornerstone of the PBP, (2016) Available on application Coastal Care (2016): Inspiring healthy communities together Coastal Care (2017) Coastal Care Delivery Plan (2017) on application Dahlgren and Whitehead (1991) Determinants of Health, Dahlgren, G., & Whitehead, M. (1991). Policies and strategies to promote social equity in health. Stockholm: Institute for Future Studies. Google Scholar DoH (2016) (Professor Tim Briggs: The Future of Commissioning for Planned Surgery Getting it right for orthopaedics Learning from the first round of Getting it Right First time Eastman, K (2017) Presentation to the SES STP Clinical Board. Available on request. Gonnering RS and Riley WJ (2018) Robert Wood Johnson and University of Wisconsin Population Health Institute: Health Outcomes and Health Factors. Hunt, Jeremy (2015) New Deal for General Practice. House of Commons Library (2015) Kings Fund (2009) General Practice in England. Kings Fund (2015) Place-based systems of care: A way forward for the NHS in England. Kings Fund (2016) Understanding pressures in General Practice. Understanding-GP-pressures-Kings-Fund-May-2016.pdf Kings Fund (2018) Through the eyes of GP trainees: workforce of the future National Palliative and End of Life Care Partnership (20150 Ambitions for Palliative and End of Life Care. Palliative-and-End-of-Life-Care.pdf Nuffield (2017) Shifting the Balance of Care. NHSE (2018) NHS Rightcare (2016) Commissioning for Value Focus pack: cardiovascular disease. NHS Rightcare (2016b) Commissioning for Value pack: Long Term Conditions NHS Rightcare (2017) Tools and Techniques. Tools%20%26%20Techniques.pdf ESBT (East Sussex Better Together) (2014): Commissioning a sustainable, integrated health and social care system that best meets population need NHS Rightcare (2017b) Mental Health conditions packs 88 sussex-better-together/ 89
72 REFERENCES REFERENCES NHSE (2016) Better Births: Improving outcomes of maternity services in England. A Five Year Forward View for maternity care. PHE-Public Health England (2017a) Public Health outcomes framework. pdf PHE-Public Health England (2017b) Public Health outcomes framework. pdf PHE-Public Health England (2017c) Public Health outcomes framework. pdf PHE-Public Health England (2017d) Public Health outcomes framework. pdf Public Health (2017) Local Alcohol profile. PHE Public Health England (2016a) Health profile. PHE Public Health England (2016b) Health Profile PHE Public Health England (2016c) Health Profilehttp://fingertipsreports.phe. org.uk/health-profiles/2016/e pdf PHE Public Health England (2016d) Health Profile SE Clinical Senate (2016) Reducing avoidable hospital based care: re-thinking out of hospital clinical pathways. england.clinicalsenatesec@nhs.net, SE Clinical Senate (2017a) Emphasising Quality, delivering value. england.clinicalsenatesec@nhs.net, SE Clinical Senate (2017b) Improving Clinical Communications Between Primary and Secondary Care Clinicians: A review and recommendations for the Sussex and East Surrey STP. england.clinicalsenatesec@nhs.net, SE Clinical Network (2017) Sussex and East Surrey Local Maternity System (LMS): 10/05/2017: Laura Ansboro presentation. Available on application. Skills for Health/Skills for Care/Health Education England (2017) Person- Centred Approaches. Empowering people in their lives and communities to enable an upgrade in prevention, wellbeing, health, care and support. Framework.pdf?s=form SPFT (April 2017) Clinical Strategy: The next steps in our journey Stevens, Simon (June 2016) speech to NHS Confederation. STN (Sussex Trauma Network) (2017) Operational Policy. Available on application. Surrey and Sussex Cancer Alliance (March, 2017) Delivery Plan: A highlevel Cancer Transformation plan to ensure the sustainable development and delivery of cancer services. Available on request. PHE, CQC, NHSE (2017) End of Life Care: STP Support tool. PULSE (2018) Revealed: 450 GP surgeries have closed in the last 5 years. gp-surgeries-have-closed-in-the-last-five-years/ article PULSE (2018) Brighton: the hardest hit town in the whole of the UK. Simpson, P. and Holden, D (Jan 2017) Getting it right first time: orthopaedics Model Hospital Data (available on application) SES STP (Sussex and East Surrey Sustainability and Transformation Plan). and%20east%20surrey%20alliance%20%282016%29%20place%20based%20 Delivery%20Plan SES STP Finance Group (2017) Capped Expenditure Process: Sussex & East Surrey STP: response stage #2. Available on application. SES STP (July 2017) Mental health in Sussex and East Surrey: the case for change (v0.5) available on application
 Copyright 2019 Sussex and East Surrey Sustainability &")

73 Sussex & East Surrey Sustainability & Transformation Partnership (STP) Copyright 2019 Sussex and East Surrey Sustainability & Transformation Partnership Produced by Published February 2019 All information correct at time of printing
74 Purpose Executive Management Committee The purpose of the Executive Management Committee is to ensure robust systems of governance, risk management and internal control that enable clinical and managerial leaders to ensure safe, high quality, patient-centred care, and delivery of Trust plans and strategies. Duties The duties of the EMC are: to develop strategy, operational plans, policies, procedures and budgets, for approval by the Board of Directors; to monitor performance against the Trust objectives and annual plan; to monitor performance against local and national standards, and regulatory and statutory requirements; to monitor the safety and quality of operational services; to ensure the active liaison, co-ordination and accountability of Care Delivery and Support Services; to review business cases in advance of consideration by the Finance and Investment Committee and/or Board of Director; to approve business cases in line with the delegated financial authority of the EMC; to take decisions on all strategic operational matters; to ensure the active assessment, management and control of risk; to prioritise and allocate resources, consistent with the Trust annual plan and strategies; Authority The Committee is authorised to take management decisions on any matter which is not reserved to the Trust s Board of Directors. Members The Committee shall be comprised of Executive Directors, and one representative from each Care Delivery Service. Executive Directors and Care Delivery Services may nominate a deputy to attend in their place, subject to the prior approval of the Chief Executive. The Chair of the Committee will be the Chief Executive, in their absence; the Chair will nominate a deputy. The Committee may ask any member of staff to be in attendance for all or part of the meeting. Frequency Meetings shall be held once a month. Quorum The Executive Management Committee will be deemed quorate to the extent that the following members are present; The Chair (or agreed Chair in their absence) At least three Executive Directors At least three Care Delivery Service representatives Calling Meetings Meetings will be called at the request of the Chair. Page 1 of 2
75 Notice of each meeting, including an agenda (and where available supporting papers) will be sent to the members of the Committee three clear days before the date of the meeting. Reporting The approved minutes of each Committee meeting will be made available to all Committee members. The Committee Chair will report, as required to the subsequent meeting of the Board of Directors. The following Committees are accountable to the Executive Management Committee: Clinical Services Transformation Board Digital Board Operational Management Board Estates and Facilities Executive Group Emergency Planning and Resilience Group Equality and Diversity Steering Group Information Governance and Security Assurance Group Professional Policy Forum Partnership Forum Communication All papers, minutes and documents are available in alternative formats, if requested. All meetings are in accessible venues, taking account of the needs of all attendees. Key messages from this Committee will be communicated by the Chief Executive to all staff. Review These terms of reference will be reviewed annually. Page 2 of 2
76 Report to Board of Directors Agenda item TBP02.1/19 Attachment D EHRIA code Date of meeting 30 January 2019 Format of Paper Title of paper Patient Flow Progress Report Written Author Lindsay Towle- Patient Flow Programme Manager and John Child- Service Director- East Sussex and Brighton & Hove Care Delivery Services Oral Presenter Simone Button- Chief Operating Officer Presentation Committees/meetings where this item has been considered Executive Management Committee Purpose of report (tick all that apply) To provide assurance For decision Regulatory requirement To highlight an emerging risk or issue To canvas opinion For information To highlight patient, carer or staff experience Strategic Goals (tick all that relate) 1. Safe, effective, quality patient care 2. Local, joined up care 3. Put research, innovation and learning into practice 4. Be the provider, employer and partner of choice 5. Living within our means Summary of Report This paper describes the activities that are being developed and supported through the Acute Patient Flow Steering Group. These are intended to respond to challenges for acute services where demand is exceeding capacity and there is a continuing requirement to utilise private sector out of area placements (ECR) for patients where inpatient care and treatment is indicated. The reasons for the continued acute patient flow challenges are described, and patient flow data provided which indicates sustained increase in the numbers of people detained on Section 136 and the conversion following assessment to formal admission (further detention on a Section of the Mental Health Act). There is recognition that there are strategic plans already in place, which seek to impact on the current pressures experienced within secondary mental health services: The Sussex & East Surrey Sustainability & Transformation Partnership (STP) Mental Health Programme- created following the development of the STP mental health case for change. A number of work streams including Patient Flow, Urgent Care, Access, Rehabilitation and Single Point of Access. Programme and work-stream resource in place with defined governance structures Page 1 of 12
77 SPFT s Clinical Strategy- internal to SPFT, work-streams including Single Point of Access and Urgent Care. Clear link to STP Mental Health Programme. Project resource in place with defined internal governance structures SPFT Improving Patient Flow plan- governed by Patient Flow Steering Group, supported by Acute Data Group- strategic and operational leadership of priorities within SPFT including Delayed Transfer of Care (DToC), Clinical Bed Management proposals and Psychiatric Decision Unit. Individual CCG commissioning plans for 2018/19. For example Community Rehab Team in East Sussex, Mental Health Liaison Team investment in Brighton & Hove This paper describes next steps, recommendations and includes a Quality Impact Assessment for reducing out of area placements. Recommendation The Board of Directors is asked to note the work which has been undertaken to address the challenges around Patient Flow and the further work planned. Page 2 of 12
78 1. INTRODUCTION 1.0 Introduction - Patient Flow Steering Group The Trust established the Patient Flow Steering Group (PFSG) in January 2018 and identified a number of core objectives. A Data Analysis Group was also convened at this time to ensure that the scope and scale of the activity (demand and capacity) throughout the mental health system could be more fully understood and that robust and relevant data could be made widely available to engage across the whole of adult services. The Trust has initiated prolonged periods of business continuity due to the demand pressures over the last 8 months. The acute services are consistently operating with occupancy levels of 98% and above. The Trust has agreed a threshold for instigating Business Continuity where 5 or more patients have been placed in an ECR bed. Figure 1 below provides a histogram for patients Length of Stay across adult acute wards in Sussex. The PFSG has used this information to develop specific actions in response to the individual patient cohorts. Fig. 1 Histogram for patient LoS identifies significant proportion of admitted patients are discharged within 8 days while around 30% of patients have a LoS exceeding 48 days. LoS <8 days Mean LOS LOS > 48 days The PFSG has supported the introduction of a Clinical Bed Management Lead (senior Nurse) to provide oversight on a daily basis for all referrals for inpatient admission and to clinically prioritise allocation of available capacity and escalation where patient risk and need and monitoring for patients who are admitted to an out of area placements and repatriation to local acute services. This role has now been extended to weekends and a comprehensive review has been completed and proposed reconfiguration to fully implement a centralised model for the management of all referrals to inpatient services and the Trust Places of Safety. Further engagement work has taken place across all areas to better understand the local services, identify specific challenges and to share good practice and national evidence to enhance patient flow. Adult CDS have continued to develop and improve daily patient flow monitoring and extensive work has been undertaken to provide regular LoS repots for adult inpatient services to more readily demonstrate areas for focus and local action. In each area Complex Case Review panels and the development of resources to support discharge are established and the PFSG will continue to support evidence based care pathways identified and recommended through the CAGs, particularly for patients within Cluster 8 and patients within the super psychotic cluster. The PFSG reports to the Clinical Transformation Board and the Adult Services Board, with further specific reporting and recommendations made to additonal operational and service delivery Boards as required. The PFSG has reported to the STP Patient Flow group and is aligned to this work-stream of the STP. Page 3 of 12
79 Nov-16 Dec-16 Jan-17 Feb-17 Mar-17 Apr-17 May-17 Jun-17 Jul-17 Aug-17 Sep-17 Oct-17 Nov-17 Dec-17 Jan-18 Feb-18 Mar-18 Apr-18 May-18 Jun-18 Jul-18 Aug-18 Sep-18 Oct-18 Nov REPORT 2.0 ECR Out of Area Placements Whilst the number of admissions has remained relatively stable, there has been an identified increase in the incidence of S136 and the subsequent referral for formal admission of patients detained on MHA Section following assessment on S136 (Fig.2). The majority of S136 are completed out of hours and the increased demand has exceeded the capacity for the Trust Places of Safety which has resulted in patients being conveyed to an A&E department and subsequent escalation where patients are delayed awaiting an acute mental health bed. This sustained additional pressure has resulted in the need to decommission Places of Safety whilst inpatient capacity is identified and Fig. 2 Total number of referrals for inpatient admission following S136 assessment Total S136 Admissions Change in S136 legislation Analysis of the ECR data utilising the Occupied Bed Days (OBD) (Fig.3) between November 2016 and November 2018 demonstrates that there has been a reduction in the overall ECR OBD and that this improvement has been consistent improvement from March A number of factors contribute to this reduction in ECR OBD summarised below: Fig. 3 SPC Chart for ECR Overall Bed Days November 2016 to November 2018 Out of Area Placements (OAPs) / ECRs - Bed Days 1,400 1,200 1, UPL, 1,233 Mean, 630 LPL, 27 Introduction of Clinical Bed Management Lead and Trust wide management of acute resources Improved CDS daily management of referrals for admission, DTOC, extended length of stay, forecasting discharges, etc Weekly DTOC escalation system call attended by SPFT, local authority and discharge co-ordinators Fortnightly STP CEO DTOC escalation calls Introduction of Clinical Discharge Co-ordinator role in East Sussex Establishment of local Complex Case Review Panel process Page 4 of 12
80 Facilitating supportive discharge role in each CDS It is noted that for patients where a discharge has been completed that the mean LoS for these patients has reduced and this improvement has been sustained since April However, a cohort of patients are continuing to be identified where the length of admission is extended. The majority of these patients have not been identified as a DTOC and are still identified to require hospital based treatment and care. The histogram (Fig.1) indicates the number of patients where the LoS exceeds 48 days and this cohort of patients will utilise the majority of OBD across all acute inpatient services. Fig. 4 SPC Graph demonstrating decrease in mean LoS for patients where discharge has been completed The STP Patient Flow work-stream commissioned NICHE to complete modelling of demand and capacity and activity across the mental health system against a number of scenarios to demonstrate potential impact on overspill and acute ward occupancy over a five year projection. The scenarios that were incorporated into this modelling included: Further reduction in the mean LoS across the acute wards (related to the SAM and focus on patients with extended LoS) Development of the Psychiatric Decision Unit Enhancement of the Crisis Home Treatment Teams to increase intensive treatment and responsiveness (24/7) DTOC maintained at 3.5% Additional capacity for acute adult beds (Meadowfield and Langley Green) Permanent implementation of the Street Triage function in Brighton and anticipated reduction in incidence of S136 by 30% In order to achieve a reduction in acute ward occupancy to below 95% and reduce the requirement to utilise out of area placements all the above actions would need to be achieved. However, it is also noted that while there is fluctuation in demand and identified risks identified to fully achieving all the required actions, it would not be possible to eliminate the need to utilise out of area placements, although this would be expected to decrease. Demand for out of area placements has been consistent over an extended period of time (Fig. 5) although the LoS for patients admitted to an out of area placement has decreased. The SPFT / CCG 2018/19 contract negotiations resulted in a 50/50 financial risk share for all ECR bed usage in the financial year. YTD M06 shows a 21% increase over the same period last year, and assuming the same value profile as 17/18 would indicate a 18/19 FOT of 2.078m. Page 5 of 12

 the Specialist Assessment MDT (SAM) has been established to oversee the management of patients who require")
81 Fig. 4 Average Out of Area Placements (ECR) admitted patients per month The modelling of data for activity completed by NICHE is expected to futher inform and support the priorities for the PFSG. Colleagues attended workshops facilitated by NICHE to interrogate the data and robustness of the scenarios where achieving the reduction in acute ward occupancy to below 90% was identified as challenging and that the reduction in the number of patients where the length of stay exceeds the mean was identified as the most significant contributory factor. A summary of progress against the scenarios/actions is provided: Length of Stay (LoS) the Specialist Assessment MDT (SAM) has been established to oversee the management of patients who require funding for specialist, hospital based, rehabilitation treatment provided through a tertiary placement. A core function for this team will be to provide robust in-reach to the adult acute wards to support the development of discharge pathways for patients with an extended LoS. The SAM MDT (initial staffing model) was fully recruited to in December 18 and a further review of the operational model for this team will be completed to ensure a more pro-active function for the adult acute wards including consideration of the skill mix and resources required to achieve overall reduction in mean LoS. A workshop is planned for February 2019 and new leadership has been identified. Psychiatric Decision Unit: Implentation has commenced and it is expected that this clinical facility (located in Brighton) will be operational in April The most significant risks to anticipated outcomes are identified as continuing challenges to recruitment of suitably skilled and experienced staff and ensuring patient flow within the PDU. Crisis Home Treatment Team: STP Mental Health Programme Board has committed financial resource for 2019/20 to enhance the urgent care services and enable delivery of the 24/7 crisis pathway. Data related to compliance of CORE Fidelity will inform the model for CRHT and is expected to improve responsiveness to referrals, increase intensity of home treatment and provide community based assessments to divert patients from A&E and reduce S136. The STP Urgent Care Workstream is developing the clinical model and a workshop was held 23 rd January Additonal acute capacity: additional acute capacity has been identified at Meadowfield and it is expected that 3 additonal bedrooms will be available by 4 th February. A further 3 acute beds have been identified at Meadowfield and are expected to be available by July 2019 and 3 acute beds at Langley Green expected to be available in July It is noted that a programme of refurbishment of bedrooms had been ongoing at the Meadowfield site for many months and to achieve this programme there was a temporary closure of 2 acute bedrooms which has now ended. Brighton Street Triage: this function commenced in December 2018 and an evaluation of the impact has now commenced and it is expected that this will be recurrently funded from April DTOC a series of Task and Finish Groups have been completed and these have been attended by all partner organisations to develop and support a number of High Impact Page 6 of 12
82 Actions (HIA). An action plan and trajectory to achieve the national benchmark for DTOC at 3.5% is supported by the STP and the progress against these HIA is monitored through the overarching STP Demand and Capacity Action plan and PFSG. Delayed Transfer of Care (DTOC) The reduction in DTOC is dependent upon the capacity within the locally commissioned services to meet the needs of patients and Fig. 5 provides the current overview. The demand for nursing and residential placement for EMI (particulary dementia) and mental health supported accommodation is particularly challenging where the complexity of patient need and risk and capacity has resulted in an increasing cohort of DTOC patients described as super stranded where the discharge from an acute ward exceeds 50 days. Fig. 5 Current DTOC Trajectory target 4.5% against actual OBD/patients overall actual 7.5% Trajectory of DToC Patients DToC Patients Trajectory DToC Patients Actual % DToC Trajectory % DToC actual 12.0% 10.0% 8.0% 6.0% 4.0% 2.0% 0.0% 3. NEXT STEPS To consider the finalised NICHE report and recommendations which will inform the priorities for the STP Programme. The report will be received in late Jaunary 2019 and presented to the STP Mental Health Delivery Group Revise the STP trajectory for out of area placements against the modelling and projections demonstrated by NICHE modelling Ensure that the additional capacity identified in West Sussex is available and that the programme of refurbishment maintains patient safety and is compliant with EMSA Implementation of the centralised Clinical Bed Management Model following formal consultation Continued provision of LoS dashboard and further support to improve acute ward performance Implementation of the Psychiatric Decision Unit and evaluation framework to be developed which will demonstrate whole system impact and outcomes Review of the SAM operational and clinical model to optimise reduction in the number of patients with extended length of acute admission Evaluation of the LGH Urgent Care Lounge which has been developed through Winter Resilience Funding for initial 3 month period The Patient Flow Steering group has developed an assurance framework for out of area placements. This will be further developed and expanded to the use of private transport providers. Page 7 of 12
83 4. CONCLUSION The development of a trajectory to reduce out of area placements will need to be a whole system endeavour which takes into account factors which require the support and input of the wider system. The Trust requires assertive support from Local Authorities and CCGs across the STP footprint to address the systemic challenges around timely access to mental health supported accommodation and proactive management of the care home market to ensure there is adequate capacity to meet the growing level of complexity and prevalence of dementia and multiple long term conditions in our population. The Trust requires all partners and stakeholders to be fully commited to delivering the DTOC HIA plan and completion of these agreed actions Implementation of the Psychiatric Decision Unit continues with the planned implementation date in April 2019 and is included within the STP Mental Health Urgent Care workstream development of a model for crisis care in 2019/20. The STP Mental Health Urgent Care workstream leads on the development of a model for crisis care for agreement by the STP Mental Health Programme Board early in 2019/20 and a detailed implementation plan and timeline is provided. The indicative Quality Impact Assessment for reducing out of area placements service development plan is included as an appendix of this paper. It is recommended this is subject to Executive scrutiny alongside the Quality Impact Assessments for all the service improvement schemes for 2019/20. The assurance framework for independent providers is further developed and presented to the Quality Committee. 5. RECOMMENDATION The Board of Directors is asked to note the work which has been undertaken to address the challenges around Patient Flow and the further work planned. Page 8 of 12
84 Appendix Quality Impact Assessment Complete for any Service Improvement Plan (SIP) over 200k in value or where there is a significant risk to an impact on quality Project Title Reduction in Out of Area Placements / Patient Flow- cross cutting scheme across all Adult Care Delivery Services Overview of scheme Patient Flow project seeks to eliminate use of Out of Area Placements (ECRs), improve patient flow within acute hospital, reduce length of stay, reduce DTOC and reduce inappropriate admissions to acute wards. Key aims to provide acute in-patient care locally and shift the locus of care from acute to community service in line with Trust and STP strategy Estimated savings TBC- depending on 18/19 out-turn position and extension of ECR risk share with the Clinical Commissioning Groups in 2019/20 Project Lead Lindsay Towle- Patient Flow Programme Lead Executive Lead Simone Button- Chief Operating Officer Service Director Lead John Child- Service Director- East Sussex & Brighton and Hove Care Delivery Service Fit with best practice A reduction in out of area placements is a key strategic objective of national mental health policy, the Sussex and East Surrey Sustainability and Transformation Partnership Mental Health Programme and the Trust s Clinical Strategy. Additional benefits other than financial A reduction in out of area placements will impact positively on: Page 9 of 12
85 Patient and carer experience Increasing number of patients receiving in-patient care closer to their own networks A proven reduction in length of stay Increasing number of patients receiving care by a service that is more familiar with their needs A reduction in delayed transfers of care Potential quality risks Reducing the number of Out of Area placements reduces a number of quality risks. A continued use of out of area placements will impact on: Patient, family and carer experience travelling potentially significant distance to hospitals across the UK Patients will receive in-patient care away from local services and networks with whom they maybe more familiar It is likely that patients in-patient stays will be longer if care is received out of area Conveyance to out of area placements in independent sector hospital placements is likely to be undertaken by non- NHS transport providers. There is limited regulation and quality standards for these providers. Out of area placements are, in the vast majority, undertaken in non-nhs independent hospitals which may receive a different level of regulation against quality standards when compared to NHS providers These risks are mitigated by a variety of strategic and operational actions. These include: Strategic objectives to reduce the number of out of area placements for the Trust and STP Focus of STP Mental Health Patient Flow Programme and SPFT s Improving Patient Flow Steering Group SPFT Patient Flow Improvement Programme Development of Psychiatric Decision Unit Centralised Clinical Bed Management Investment in 24/7 via STP resource for 2019/20 Development of urgent care lounges in West Sussex System wide attention on improving delayed transfers of care. The Trust has completed a quality assurance matrix of available ECR providers to ensure patients are placed in providers that meet an appropriate standard of care. Care is made to ensure the choice of ECR provider is an close to the patient s local networks as possible. Patients placed in out of area placements are routinely followed by clinicians within the Trust. This work is coordinated by the Clinical Lead Nurse for Bed Management in conjunction with Link Nurses, Clinical Discharge Coordinators and Lead Practitioners. Decisions made to recall patients from out of area providers are made on following clinical prioritisation. Page 10 of 12
86 Impact in other areas A reduction in out of area placements would result in: Patient experience Potential positive impact on acute trusts via flow in Emergency Departments Reduction in number of patients detained under Section 136 being conveyed to Acute Trusts Emergency Department A positive impact on acute staffing- reduction in admissions, reduction in occupancy rates Impact on acute staffing- reduced activity, pressure A positive impact on Local Authority AMHP services by reducing demand A positive impact on the STP financial position reducing the spend on Out of Area Placements and additional transport for conveyance A reduction in out of area placements will impact positively on: Patient and carer experience Increasing number of patients receiving in-patient care closer to their own networks A proven reduction in length of stay Increasing number of patients receiving care by a service that is more familiar with their needs A reduction in delayed transfers of care Safety A reduction in out of area placements would impact on: Acute in-patient care provided in SPFT facilities Potentially reduced incidents, use of seclusion, restraint Reduced waits in A&E / Hospital Place of Safety Reduced the number of patients detained under Section conveyed to Acute Trust A&E Departments. Reduced LoS / DTOC- improved outcomes for patients with more timely discharge Reduced out of area conveyance Overall effect on quality A reduction in out of area placements will result in an overall improvement in quality for the reasons listed above. Page 11 of 12
87 Signed: John Child Date Service Director Signed. Date... Sally Flint, Chief Finance Officer Signed Date. Acosia Nyanin, Chief Nurse Signed Date. Rick Fraser, Chief Medical Officer Page 12 of 12
88 Report to Board of Directors Agenda item TBP02.2/19 Attachment E EHRIA code Date of meeting 30 January 2019 Format of Paper Title of paper Estates & Facilities Strategy Written Author Presenter Nigel Burchett Director of Estates & Facilities Sally Flint, Chief Finance Officer and Deputy CEO Oral Presentation N/A Committees/meetings where this item has been considered Finance & Investment Committee Purpose of report (tick all that apply) To provide assurance For decision Regulatory requirement To highlight an emerging risk or issue To canvas opinion For information To highlight patient, carer or staff experience Strategic Goals (tick all that relate) 1. Safe, effective, quality patient care 2. Local, joined up care 3. Put research, innovation and learning into practice 4. Be the provider, employer and partner of choice 5. Living within our means Summary of Report The Trust s Estates Strategy which was last published in October 2017 has recently been updated and is attached to this summary. This revision provides the latest Estates data emanating from Estates Return Information Collection (ERIC) and Patient Led Assessments of the Care Environment (PLACE) scores. It also shows benchmarking data on performance taken from The Model Hospital issued by NHS Improvement. The Trust has launched a new initiative called Dare to Care as part of our Care Without Carbon Strategy which highlights how we aim to become more environmentally friendly as a Trust and reduce our carbon emissions. Importantly it highlights the progress we have made in improving the quality of our environments and the focus we are putting on modernising our Estate over the next five years. Recommendation The Board is asked to note the contents of the revised Estates Strategy and the progress made on our journey towards achieving a high quality and well managed estate. Page 1 of 3
89 1. INTRODUCTION The Trust s estate comprises of approximately 96,000 m 2 made up of:- 54 Freehold properties 43 Leasehold properties 6 PFI properties This includes 45 inpatient wards & homes with a total of circa 702 beds, some 73 community team bases and 30 corporate buildings. The Trust has identified the following as the overarching aims for our estate: Safe, secure and effective environments Right property in the right location Reducing overall costs Improve the appropriateness and quality of environments for patients and staff Develop more environmentally sustainable buildings and services Generate income from property where possible Enhance security across the Trust The Estates Strategy is a strategic document which articulates how our Estate is performing and our direction of travel to improve the quality of our environments for the benefit of patients and staff. It aligns closely with our Trust strategies most importantly our Clinical Strategy. 2. REPORT The Trust s Estates Strategy is attached to this summary. In order to deliver our Estates Strategy we have a focussed on a number of key priorities. These include: Ensuring compliance with regulatory standards. We actively participate in quality and safety audits and respond pro-actively to any issues highlighted by CQC visits and Mental Health Act ward visits. There is focus on robust processes with regards ligature reduction, eliminating mixed sex accommodation in our inpatient units and improving our s136 suites and seclusion rooms to a common standard. We have developed a standard specification for our s136 suites in liaison with our clinical teams and have a planned programme of upgrade works. We are also cognisant of our inpatient dormitory accommodation and are making longer term plans to move towards single rooms with en-suite accommodation where these exist. All of the above are contained within a single tracking sheet with action plan to address the issues. We have also developed a central estates data base called CAFM for storage of our estates information. Improving the quality of our accommodation. We have a diverse portfolio of property stretching across a wide geographical area. We continue to allocate capital resource each year to prioritise improvements that are required. The prioritisation of our capital expenditure is made in consultation with our clinical services with approvals on specific schemes being made via our Capital Review Group and onwards as required to the relevant Trust Committees and Boards. Last year we completely refurbished and opened Brunswick Ward at Mill View Hospital and are underway with a major refurbishment at The Burrowes, on the Swandean Hospital site in Worthing. We have also commenced phase 1 of a major upgrade prograde programme across 14 of our community buildings. We have looked at the potential capital requirements over the forthcoming 5 years in order to get all our in-patient wards & associated areas, plus community buildings to a fully compliant, good safe standard for our patients, visiting carers and families and staff. This Page 2 of 3
90 amounts to circa 157 million. We will look to identify alternative means of procurement where we are unable to fund this directly ourselves e.g. via a Third Party Development and leaseback arrangements. Becoming environmentally friendly. Our Environmental Strategy is called Care Without Carbon and new Trust targets have been set to 2025, replacing our previous 2020 targets. Our target for 2025 is a 51% reduction in our carbon footprint, in line with Climate Change Act targets. Over the last three years we have seen a year-on-year reduction in our CO 2 emissions. In order to further advance our sustainability goals and maximise the benefits we have broadened our scope to take a more coordinated approach to sustainability locally. Three collaborative projects have been initiated to date: a joint Energy Performance Contract (EPC) procurement; a Courier Services Review and a joint waste tender with five of the STP trusts. We have a Programme Board and Project Board that specifically monitors our progress. We recently launched a Trust wide Dare to Care Campaign to encourage everyone to make a difference in our Trust wide approach to sustainability. In January 2019 we were successful in a bid to secure 300,000 to install LED lighting across key areas of our estate which along with other measures will assist in improving energy efficiency. Planning Estates Changes. It is important that we are future focussed regarding what we want the estate to look like in a few years time. We need to ensure that estate is of the optimum size, is in the right location and is of the right quality. To this end we have created an estates modernisation programme comprising some 26 individual projects. For some of our larger sites we are undertaking master planning work and are looking at future investment requirements. With our Care Delivery Services we are also looking at what new accommodation may be required to enable us to vacate estate that is not performing so well. Ensuring the financial performance of our estate is optimal. Via estates return information that we are mandated to supply to NHS Improvement we are able to benchmark the overall financial performance of our estate and as an organisation we are in the best performing quartile against all Trusts nationally. SPFT running costs overall are 275m2 compared to a benchmark of 295 m2 and peer running costs of 335m2. The total estates and facilities running cost is the cost of running an NHS estate, including, staff and overhead costs. In-house and out-sourced costs, including Private Finance Initiative costs. 3. RECOMMENDATION The Board is asked to note the contents of our revised Estates Strategy and the progress made on our journey towards achieving a high quality and well managed estate this report. 4. NEXT STEPS We will update our Estates Strategy in a year s time. This will allow us to include the latest data on the performance of estate from our statutory returns and to highlight progress against our various estates and facilities workstreams. We will continue to focus on improving our estate and where necessary will ensure robust action plans are in place to ensure delivery. The Estates and Facilities team are planning to hold a prioritisation workshop with finance, clinical governance and colleagues from Operational Services to agree the Capital Programme for 2019/20. This will ensure that the programme takes the form of the delivery plan underpinned by the Estates and Facilities Strategy and takes account of Building Environment Safety, Clinical Compliance and issues arising from internal Quality and Safety Reviews and CQC inspection Page 3 of 3

91 Sussex Partnership NHS Foundation Trust Estate Strategy Published October 2017 Updated January 2019 Author: Nigel Burchett Director of Estates and Facilities
92 Contents Executive Summary 3 Vision for The Estate 5 Summary of Our Estate 7 Performance of Our Estate 9 Strategic and operating context 15 Our Estate in the context of Trust Priorities 20 Care Without Carbon Improving Trust Sustainability 24 How our Estate is changing over the next five years 33 How we will deploy our Estate to recruit, retain and support our staff 35 Conclusion 37 Appendix A. List of sites 38
93 Executive Summary Welcome to the Sussex Partnership NHS Foundation Trust Estate Strategy which has been updated since it was first published in October This revision incorporates data emanating from Estates Return Information Collection (ERIC) data and Patient Led Assessments of the Care Environment (PLACE) scores. It also shows benchmarking data on performance taken from The Model Hospital issued by NHS Improvement. We have launched a new initiative called Care Without Carbon which highlights how we aim to become more environmentally friendly as a Trust and reduce our carbon emissions. This Strategy compliments our other Trust Strategies, notably the clinical and digital strategies as we make progress towards delivering the Trust s 2020 vision and the refresh we are already planning. This document sets out our ambition for a consistently high quality estate to support all our services to deliver outstanding care and treatment you can be confident in. Ensuring a safe and appropriate environment, maintaining our facilities and delivering excellent cleaning and catering services is the core of what we do in the management of our estate. Much of this work takes place behind the scenes, but a good experience of Sussex Partnership NHS Foundation Trust services depends on these being delivered efficiently and effectively. Since the issue of The Estates Strategy in October 2017 we have started on an ambitious programme of Estates Modernisation which will continue to take place over the next five years. This will include further rationalisation of our Estate, undertaking refurbishments and acquiring new facilities in strategic locations. We want to ensure that all our services are delivered from environments that are optimal for the delivery of patient care. The strategy addresses how we need to optimise our assets to ensure best value for money and release funding to invest in new capital developments. In relation to growth, work continues to develop our thinking around the masterplans for the Trust s key sites, taking into account our ambitions for service delivery and opportunities and constraints in developing capital schemes. Much has changed in the wider strategic landscape. We have seen a greater emphasis on partnership and collaboration across the health and care system, with work progressing on a Sustainability and Transformation Partnership s (STP s) for the NHS across all the areas that we operate. We are also developing our plans in the context of commissioner led Local Estates Strategies (LES s), and deepening relationships with other partners, including our commissioners (both NHS England who are responsible for specialist commissioning, and our CCGs who commission local secondary care services), our partner NHS Trusts, primary care and local councils that both commission and provide adult and children s social care. Furthermore, there is increasing emphasis across the NHS to improve our efficiency in the use of the estate to protect front line service delivery within available means. In particular the review of the productivity of the NHS by Lord Carter of Coles identifies how the estate can be better utilised, and sets targets for reducing the amount of void and under-utilised estate, as well as the proportion of the estate required for non-clinical functions. Achieving or bettering the Carter benchmarks will be a key measure for how we are delivering best value for our estate as a whole. It is timely, therefore, to review our own Estate Strategy to take account of these wider developments. The strategy tells the story about how we are using our buildings to change the way we deliver healthcare services, in particular how we are planning the use of our estate to support the Trust s 2020 vision. This Estate Strategy sets out the steps we will take to invest in and manage our estate effectively to ensure we have the right buildings in the right places to support the Trust. It also describes how we are harnessing the benefits of technology to ensure our environments can be secure whilst promoting the privacy, dignity and well-being of all who use our buildings. Our digital strategy Estates Strategy (updated January 2019) 3

94 sets out how we are harnessing the rapidly growing benefits of ICT to transform the way we deliver services and our Estate Strategy shows how we are adapting our facilities to support new ways of working to improve patient care and staff working lives. We face a number of challenges in ensuring we are able to meet the growing and changing needs of the population we serve. Sussex already has the highest proportion of older people amongst its population, with 25,000 people having dementia, and this is set to increase. We have a long way to go until we achieve parity in terms of funding and access to mental health services (three quarters of people physical health disorders receive treatment, compared to only one in four of people with mental health disorders). We need to do more to ensure the physical health needs of people receiving mental health services are met, and correspondingly that the mental health needs of physical health patients are addressed. We need to deploy our estate effectively to ensure that all patients benefit from the high quality estate they deserve as well as ensuring that our Trust is a welcoming place to work for all our 5,000 members of staff. The Estate Strategy is a living document, and any specific proposals set out represent a point in time. Our planning will need to be sufficiently flexible enough to respond to changing demands as the local health economies work together to determine how best to configure services to meet changing population need within available resources. These levels of strategic planning will help to shape our own assessment for the future requirements for the estate. Whilst the specifics will continue to evolve our principals remain constant. Everything we do aims to deliver outstanding care and treatment you can be confident in. To do this we need to have the right buildings in the right places to support excellent service delivery now and in the future. Samantha Allen, Chief Executive 4 Sussex Partnership NHS Foundation Trust
95 Vision for The Estate Sussex Partnership NHS Trust provides care across Sussex for people with mental health problems and learning disabilities. We also provide a range of specialist services across south east England. We care for people all of ages, from children and young people through to older people with conditions such as dementia. We aim to improve people s lives by providing high quality care and the best possible experience of our services. We provide services in a wide range of places including hospital, community clinics, people s homes and GP practices. This means that we require a range of specialist facilities to support excellent healthcare through a high quality patient care environment. Providing a high quality working environment for all our 5,000 members of staff is also a prerequisite for delivering consistently high quality care. Resources are finite and we need to ensure that our estate is well used to deliver a consistent and excellent environment in a way that we can afford. Our aim is to achieve a consistently high standard of accommodation for patients and staff whilst managing our resources effectively. This means using our estate well and we will continue to look for opportunities to optimise our estate, using benchmark measures for the utilisation of the estate set by Lord Carter and others, to ensure we obtain best value for money from our facilities. The starting point for any strategy is our 2020 vision, and our more recently published clinical and digital strategies, all of which this strategy supports. This 2020 vision, published in April 2015, describes what we will do to improve the services we provide to patients. Although the way in which health and care services are planned and coordinated is changing, our ambition for mental health services has not. We know, from feedback from patients and carers, that it can often feel difficult for people to find the help they need and that it can often feel like they are passed around the system. Even where care is complex and involves multiple organisations it is our job to work so well with partners that patients and carers only notice the quality of care and support they are receiving and not the joins between members of different professions and agencies involved in delivering care. We are working hard to build on our existing partnerships, but clearly more needs to be done. Having the right facilities in the right place, with the IT infrastructure and flexibility and adaptability to improve coordination of care across organisational boundaries is essential to achieving our ambition. Our strategy sets out our journey towards achieving a consistently well utilised, high quality and well managed estate. However, it is about far more than the bricks and mortar from which we look after our inpatients, provide our outpatient clinics, and deliver administration and support services. Whilst this document is about building in the traditional sense of hospitals, clinics, offices etc., it is also about building the capacity, flexibility, partnerships and resilience to face the challenges ahead for our services. The development of the Estate Strategy has been through a process of engagement working with the Care Delivery and Support Services, the Board and wider stakeholders. Estates Strategy (updated January 2019) 5
96 Across our organisation we have identified the following as the overarching aims for our estate: Safe, secure and effective environments Right property in the right location Reducing overall costs Improve the appropriateness and quality of environments for patients and staff Develop more environmentally sustainable buildings and services Generate income from property where possible Enhance security across the Trust Since October 2017 we have made good progress in improving and planning the future of our Estate and with the support of our Care Delivery Services we have: Implemented our Computer Aided Facilities Management (CAFM) Software System which holds all our Estates Data in a single place and allows us to monitor compliance across our Estate. Utilised our new Capital Project Framework to allow us to progress our Capital programme of projects in a more streamlined way. Carried out a range of improvements to our inpatient units Commenced implementation of a large number of premises improvements in our Community Estate Planned our Estates Modernisation Programme for the next 5 years Launched our Care without Carbon Environmental Strategy Re-tendered our waste contract saving 500K over five years Secured 300,000 from The NHSI Energy Fund to improve LED lighting in 2019 Enhanced space utilisation in a number of our premises. The above is in addition to the day to day operations of our dedicated Estates and Facilities staff who keep our premises safe, secure and clean as well properly maintained. 6 Sussex Partnership NHS Foundation Trust
97 Summary of Our Estate We provide hospital and community mental health services across Sussex, as well as more specialist mental health services across a wider footprint. Our estate comprises of approximately 96,000m Freehold properties 43 Leasehold properties 6 Private Finance Initiative (PFI) properties This includes 45 inpatient wards & homes with a total of circa 702 beds, some 73 community team bases and 30 corporate buildings. We operate mainly across Sussex, but we also provide children s and young people s services across Hampshire with some specialist services supporting patients from further afield. A map of our main locations is shown on the following page. We manage and maintain our own estate, as well as provide our own hotel services (cleaning, catering and portering) for many of our facilities. We also provide Facilities Management services to other owners and occupiers of healthcare estate. We employ 227 WTE staff across our estates and facilities services, representing one of the largest staff groups. Our team includes electrical and mechanical engineers, as well as cleaning, catering and portering staff in addition to asset and facilities managers. It costs circa 25m each year for us to hold and service our estate. This comprises of 19m of running costs, 9m capital charges and 3.0 m income. A list of our main locations is provided in Appendix A. Estates Strategy (updated January 2019) 7

98 Map of our locations 8 Sussex Partnership NHS Foundation Trust
99 Performance of Our Estate Performance Management of the NHS Estate In all our estates and facilities management activities we adhere to best practice and governance. There are a number of standard tools used across the NHS to support the effective management of the estate. This allows for a common set of measures that enable more effective performance management and benchmarking with peers. Over the past 5 years we have already made considerable progress in improving the performance of our estate. In particular we use the NHS Model Hospital, Estates Return Information Collection (ERIC) and the Patient Led Assessment of the Care Environment (PLACE) as well as the Premises Assurance Model (PAM) These can be summarised as follows: The NHS Model Hospital. The Model Hospital is a digital information service designed to help NHS providers improve their productivity and efficiency. The Model Hospital enables us to gain a better understanding of our running costs and to identify where potential savings are possible. ERIC collects information relating to the costs of providing, maintaining and servicing the NHS estate. This includes the costs of providing certain patient-focused services such as food and laundry. In addition, the collection includes a number of non-financial aspects of the operation of buildings such as information relating to fire safety and an organisation s progress in meeting carbon reduction targets. PLACE applies to NHS inpatient facilities with ten beds or more and an assessment is carried out by independent teams that have patient and professional representation. This focuses on the quality of estates and facilities services as they impact on the patient experience. PLACE looks at how well facilities meet standards on privacy and dignity, cleanliness, quality of meals, dementia friendly care environments and other aspects of estates performance that affect patient care. PAM measures the effectiveness of the management and governance of the estates and facilities management. This includes an assessment of how decisions are made; how resources are allocated; how estates information is reported to the Trust Board and Governors; how the Trust manages risk and responds to events; and how well the planning and management of estate is integrated with the leadership of the Trust as a whole. The Trust, like all health care providers in England, is regulated by the Care Quality Commission (CQC) and the CQC requires that the Trust provides its services from safe and suitable premises. Estates operational performance and benchmarking The Estates Returns Information Collection (ERIC) provides detailed information on the costs incurred in the provision of the NHS Estate used in the delivery of secondary care. In 2014/15 the responsibility for collating ERIC returns moved from the Department of Health to NHS Digital (the Health and Social Care Information Centre) and new performance dashboards are being set up to enable Trusts to monitor how their own performance may change over time, as well as allowing for better peer based benchmarking between similar Trusts. Estates Strategy (updated January 2019) 9
100 Some of the key benchmarks, showing our own comparative performance are summarised below: How our Estate is Performing The following data is taken from The Model Hospital data produced by NHSI and is based upon Estates Return Information Collection (ERIC) data submission for 2017/2018. This enables us to benchmark our performance Nationally against the average national benchmark as well as similar sized Trusts in our peer groups. SPFT running costs overall are 275m2 compared to a benchmark of 295 m2 and peer running costs of 335m2. The total estates and facilities running cost is the cost of running an NHS estate, including, staff and overhead costs. In-house and out-sourced costs, including PFI costs, will be included. Hard FM expenditure costs are 56m2 compared with 76m2 with peer Trusts. Hard FM costs are those directly related to the building and which are provided by its owner, if leased (e.g. electricity). 10 Sussex Partnership NHS Foundation Trust


101 We spend 3.85 per meal which is slightly under benchmark costs of 4.39 per meal and marginally above peer Trust costs of The gross cost of in-patient food services includes staff and provisions costs but, excludes treatment related food services such as nutritional supplements. An in-patient meal is defined as either breakfast, midday or evening meal order (or any substitute or alternative for any such meals) received by an in-patient (wards and departments). We spend 32m2 on maintenance compared to a benchmark cost of 35m2 but is roughly in line with peer expenditure at 31m2. All estates and property maintenance costs include: estates and property management revenue and costs relating to implementing and managing the trust's capital programme; equipment maintenance relating to the built environment; backlog maintenance monitoring, implementing and managing associated investment both in terms of in-house and outsourced monitoring where applicable; fire safety and health & safety compliance relating to the built environment - only revenue costs are included and capital compliance expenditure is excluded. Estates Strategy (updated January 2019) 11
102 We spend 93m2 on Soft FM costs which is above benchmark at 86m2 but below peer expenditure at 120m2. Soft FM costs are those costs that are not directly linked to the building owner and can be provided by the lessee or out-sourced separately by them (e.g. food laundry and cleaning). Our Trust cleaning costs are 47m2 which is slightly higher than benchmark costs of 38m2 and peer Trust costs at 45m2. This may be due to the very large geographical spread of sites which makes achieving economies of scale more difficult. The cleaning services costs include total pay and non-pay costs of cleaning services for the organisation, including deep cleans where applicable Benchmarking indicates a high degree of cost effectiveness in our FM service delivery, but there needs to be a focus on improving our utilisation and reviewing our approach to high cost of occupancy premises within our estate. Our PFI Estate (20% of total floor area) does affect our occupancy costs overall. Facilities Management Our Facilities Management services are assessed primarily through the PLACE (Patient Led Assessment of the Care Environment). This is a means for assessing the performance of all Trust inpatient units (our community hospitals) for the performance of soft Facilities Management Services as determined by independent assessment led by teams that comprise of FM experts accredited to carry out such assessments and patients and carer representatives. The 2017 scores for our hospitals are set out below (with comparison against our 2016 scores): 12 Sussex Partnership NHS Foundation Trust
103 PLACE scores 2016/17 comparison Amberstone Beechwood Chalkhill Chichester Centre Connolly House Crawley Road DOP Harold Kidd Unit Hellingly Centre Iris ward Langley Green Meadowfield Mill View Oaklands Centre Cleanliness Food & Hydration Privacy & Dignity Condition, appearance & maintenance Dementia Disability % % % % % % n/a n/a n/a n/a n/a n/a n/a n/a n/a n/a n/a n/a n/a n/a n/a Estates Strategy (updated January 2019) 13
104 Rutland Gardens Selden Centre Shepherd House St Anne's Woodlands n/a n/a n/a n/a n/a n/a The table below shows the overall scores for SPFT against the national average. Cleanliness Food and Hydration Privacy, Dignity and Wellbeing Condition Appearance and Maintenance Dementia Disability Overall Trust scores National average Cleanliness is slightly down on last year and falls just below the national average. The same applies to food and hydration, however whilst the quality of patient meals was complimented, we are focusing on patients nutritional and dietetic needs and choices in order to improve the score in The score for privacy and dignity is down slightly on last year, however there has been a slight improvement in the condition, appearance and maintenance of wards. We have a significant increase on last year s score for dementia friendliness and this element compares extremely well against the national average. Disability access shows a slight increase on last year and is just above the national average. Our aim is to improve consistency of overall service delivery achieving the standards in our best performing properties across the board. This will entail an understanding of all factors that may be behind the variations in scores, including age and condition of building, responsibility for FM service provision and other local factors that could influence the score. 14 Sussex Partnership NHS Foundation Trust
105 Strategic and operating context This Estate Strategy is written in the context of an NHS that is evolving in terms of policy and structure. The key drivers for change relate to both national policy and strategy as well as more local plans. These have been identified as: The NHS Long Term Plan Five Year Forward View for Mental Health Sustainability and Transformation Partnership Estates Strategy CCG Local Estate Strategies Trust local strategies, specifically: o 2020 vision o Clinical strategies o Care Delivery Service Plans National policies and priorities A combination of population growth, demographic change, the advent of new technologies and growing public expectations all put pressure on the NHS which is challenging to support in the context of prolonged financial restraint. There is growing consensus that the NHS needs to change the way it plans and delivers its services. On 7th January 2019, NHS England published the NHS Long-Term Plan, setting out its priorities for healthcare over the next ten years and showing how the NHS funding settlement will be used. For mental health the Long-Term plan includes: Better access for new parents (including fathers for the first time) who need mental health support during the period before and after the birth of their child New waiting time targets Extra funding for new mental health crisis services of up to 250 million a year by 2023/24 2.3bn to improve access to talking therapies for 350,000 children and young people and 380,000 adults Incentives for encouraging people to join or re-join the mental health workforce A commitment to improve the transition between young people and adult services Even within the area that our Trust operates it is likely that different models of collaboration will emerge. What is certain is that we will need to adapt our services to give greater emphasis on primary and preventative mental health interventions, working alongside our colleagues across health and social care. This will require greater use of IT and shared use of facilities, and these factors drive our estates related investment decision making. In addition to changes to the way we work there is greater emphasis on productivity as set out in the NHS Review of Productivity carried out by Lord Carter of Coles (The Carter Review), published in This sets out a number of productivity improvements which, taken together, could save 5bn. Specifically Carter sets out two estates measures relating to the amount of void space and the proportion of a Trust s footprint required for non-clinical functions. We benchmark our own performance against these Carter metrics and set out plan for improvement below. Regional and local plans There is increasing emphasis on identifying and reducing inefficiencies across the NHS as a whole, but it is also recognised that there is no one size fits all and partners within local health and care systems need to work together to develop the most appropriate solutions for their areas. The system-wide planning process creating Sustainability and Transformation Partnerships (NHS England, 2015) tells us that the journey toward organisational and structural integration is gathering pace. This approach will Estates Strategy (updated January 2019) 15
106 require NHS Trusts and other organisations delivering NHS and social care services, to prioritise partnership over competition (at least) within STP footprints. All parts of the health and care system are being asked to increase collaboration through the Sustainability and Transformation Partnerships (STPs). Our main STP footprint covers of all of Sussex, together with East Surrey, and taking in the health systems around 4 acute Trusts (Western Sussex Hospitals NHS Foundation Trust, Brighton and Sussex University Hospitals NHS Trust, East Sussex Healthcare NHS Trust, Surrey and Sussex Healthcare NHS Trust). We are active participants within the Sussex and East Surrey STP footprint, which covers the counties of West Sussex, East Sussex, the unitary authority of Brighton and Hove and the area served by East Surrey CCG. We also provide children and young people s service in Hampshire, although many of our sites are mandated in this area and our participation in the STP planning processes of relevant adjacent areas is of a lesser extent to our involvement within the Sussex and East Surrey STP. The STP plans are emergent, but they are likely to propose major changes to the health and care economies to ensure their ability to meet future need in the context of continued financial restraint. This could have far reaching implications for how services are delivered in the future. However, one certainty is that greater collaboration and coordination will be required and we expect that over time the boundary between physical and mental health services will become increasingly blurred. We know that there are strong associations between physical ill health and mental health, and we will be delivering more of our services from a wider range of care settings in order that care is organised around the needs of patients rather than patients having to travel to different care settings organised around specific disciplines and specialisms. Since the advent of the STP process collaborative relationships between Estates and Facilities Directors of all main NHS Trusts have matured and our Director of Estates and Facilities is Chair of the South East Estates and Facilities Forum. Work on the STP is complemented by CCG led local estates strategies, which are continuing to evolve. For the first time CCGs, as local health system leaders, have taken on responsibility for developing local estates strategies to reflect their commissioning intentions, improve integration with primary care development and align individual organisational plans within developing models of care. Whilst it is not possible to set out the detail of each Local Estates Strategy (there are 7 CCGs and 5 Local Estates Strategies for Sussex) there are number of common principles: There is a need to improve the coordination of care between different agencies Whilst the local needs and geographical requirements vary each CCG is setting out the organisation of patient centred care with a focus on localities or communities of practice each serving population clusters of between 30,000 and 50,000. There are number of common themes. Clinicians from across the health and care system will need to work more collaboratively and we expect the benefits of ICT and greater flexibility in how partners and the Trust use buildings to support the breaking down of artificial barriers. Our STP in Sussex and East Surrey has 24 partners all working together to meet the changing needs of all the people who live in our area. We want to offer better health, better care and to ensure we make the most efficient use of our resources. Through the STP, we are finding new ways for the NHS, local authorities and voluntary sector to work together to improve services and outcomes for people who experience mental ill health. Partnership in estates planning is also extending beyond health and social care. Through the One Public Estate initiative we are seeing increased collaboration across public sector bodies and agencies to improve strategic estates planning as a whole, looking at opportunities to consider how the property needs of public service providers (including government departments, local authorities, NHS and other 16 Sussex Partnership NHS Foundation Trust
107 public agencies) can provide further opportunities to improve value when looked at in the round. We are active participants in multi-agency One Public Estates groups covering West Sussex, Greater Brighton (Brighton and Hove unitary authority and adjacent districts) and SPACES (Strategic Property and Asset Collaborate in East Sussex). Irrespective of local collaboration arrangements and related projects, we are delivering populationfocused health and social care through individualised care focused around local communities of practice which naturally form around GP surgeries, Children and Families centres and schools We have long established relationships with health and social care commissioners and providers to ensure services work well for all our population affected by mental health. Partnership is in our name! Nevertheless, as we set out in our 2020 Vision there is more than we can do to improve coordination and collaboration, both in the planning of our services and in the delivery of care directly to our patients. Our aim is for care to be so well coordinated that where our service users depend on the services of multiple agencies that they do not notice organisational boundaries. Our investment in our estate enables more effective partnership working, as well as the deployment of modern ICT systems that support more remote and flexible working. This will allow our staff to work more in patients homes, collaboratively with colleagues from other agencies (through more co-locations and ICT enabled communication) as well as offer new ways to engage with patients, e.g. through Skype consultation. Whilst our primary focus is, rightly, on delivering high quality patient care, we recognise that without the right staff, it would not be possible for us to live up to our ambition of providing outstanding care and treatment you can be confident in. The best way to value our patients is to value our staff, and one way to value our staff is to provide a pleasant and supportive working environment. We are therefore focusing on how our estate can support our ambition to make Sussex Partnership NHS Trust an excellent place to work across all our services and locations, alongside the provision of a consistently high quality care environment throughout. Trust strategies and plans 2020 Vision We set out our overall vision for how we want to provide services in our 2020 Vision (now undergoing a planned update) which we published in Our vision sets out five strategic goals. These are: 1. Safe, effective, quality patient care 2. Local, joined up patient care 3. Put research, innovation and learning into practice 4. Be the provider, employer and partner of choice 5. Live within our means. How we deploy and manage our estate has a bearing on how well we can meet our strategic goals. For example: 1. Safe effective quality patient care requires that the environment is appropriate for all clinical activities, that our service users and staff can enjoy a comfortable and pleasant environment in all our facilities. Security requirements should be met in as unobtrusive way as possible, although in some of care environments security considerations may override others. 2. Local, joined up patient care requires facilities across our localities to deliver services according to need. Joined up care also requires our staff to work from premises outside of our estate. We have a responsibility to ensure their working environments are appropriate for their role, as we have reciprocal responsibilities towards colleagues from partner agencies who work from our facilities to provide joined up patient care. Clearly, it would not be possible to locate our more specialist services within each locality but when planning the location for more specialist facilities that serve larger populations, accessibility will be a key consideration. Estates Strategy (updated January 2019) 17
108 3. Put research, innovation and learning into practice. To support this we require appropriate meeting and educational facilities on our main sites, as well as the right IT connectivity to facilitate lifelong learning and collaboration into all our clinical service. From an estate point of view it also means keeping abreast of all the latest best practice knowledge on healthcare environments. For example, our knowledge of what constitutes a dementia friendly or an unobtrusive secure environment has advanced considerably in recent years. Furthermore, technological advances provide new opportunities to address the often competing needs of security (e.g. management of ligature risk) with the need for privacy and dignity, and we are at the forefront of applying new adaptations in the design and construction of the healthcare environment. Not only do we need to plan with the most up to date knowledge of therapeutic environments in mind, we need to contribute to this growing body of knowledge. 4. Be the provider, employer and partner of choice. Fundamentally this means delivering excellent health and care, and supporting our staff to do so. This is supported through a high quality clinical care and staff working environment throughout. 5. Live within our means. We face the challenge of improving the quality of our facilities whilst also reducing cost. We can make progress towards both, but this requires us to ensure we use our facilities well and, where appropriate, we need to vacate some premises and make our retained facilities more flexible and adaptable. Clinical Strategy and clinical service directorate plans Our clinical strategy, published in 2017, sets out how we are building on our aspirations set out in our 2020 vision to promote a more positive service user, carer and staff experience. Our clinical strategy reflects the fact that mental health trusts across the country are being required to save significant amounts of money year on year on top of the savings we have found in previous years. Staff are experiencing more pressure and we can find it difficult to recruit to some clinical posts. We cannot continue delivering services in the way that we do now and we need a new model of care that is focused on: Health promotion and early intervention Delivering evidence based outcomes Treating people in the community rather than hospital Working more effectively in partnership. What this requires is a series of detailed and ambitious plans. The key priorities are summarised as follows: Offering support to develop teams Implementing new roles such as non-medical prescribers, associate care coordinators, peer workers and graduate mental health workers to help us address recruitment difficulties and use resources more effectively Integrating community, crisis and acute services by joining up care pathways and enabling staff to accompany service users through their journeys Create capacity and move care upstream by creating more capacity in community teams so they can spend more time on the needs of people with more severe and acute mental health needs Developing new youth care pathways to address the needs of people aged Developing our crisis care pathways to improve our ability to provide crisis home treatment, working towards 24/7 mental health crisis care for everyone who needs it Reducing length of stay and standardise admissions working with our own community services and partner organisations Ensuring a single point of access to help people in crisis get help from us 24 hours a day. Developing ways of strengthening partnerships and working more effectively with communities Supporting our teams to collect and use clinical care intelligence (such as outcomes) to enable learning from best practice within the Trust and elsewhere and to support continuous improvement in our services. 18 Sussex Partnership NHS Foundation Trust
109 In order to develop and implement our Estate Strategy, we have organised our clinical service delivery into eight Care Delivery Services (CDSs). Each CDS is tasked with providing overarching leadership for a particular care group and/or geographical area. Overall leadership of each CDS is provided by a service director and a clinical director, with a multi-disciplinary leadership team (including different clinical professions and business, finance, HR, IT and Estates and Facilities support staff) providing additional leadership and governance oversight. The move towards a CDS structure has helped us: Move away from central command and control to more devolved and improved leadership Provide services that can flex to local needs Encourage clinical engagement within services Promote more local accountability Develop new partnerships with local third sector organisations Make more decisions taken closer to where patients are treated The CDS model has helped us continue to improve services for patients and carers. Providing consistently high quality services means: Working together in partnership with each other, the people who use our services and other organisations Pooling our expertise, experience and resources Embedding the learning from what we do well, and where we need to improve, across all our services Defining a commonly agreed set of strategic, clinical priorities. Each of the CDSs has prepared their own delivery plans to set out how they will support Trust operational efficiencies and develop services, along with plans to realign services to better support local need and the overall objectives of the clinical strategy. Each CDS is supported by the Estates and Facilities team, who works alongside clinical and service directors to develop the plans and establish options for investing in and, in some cases, divesting in the estate. Whilst the clinical strategy per se makes little direct reference to estates planning, it actually is the starting point for all estates planning as we look to align our facilities to the way that services need to change. Estates Strategy (updated January 2019) 19
110 Our Estate in the context of Trust Priorities We have identified five strategic goals which will steer us towards where we want to be in five years time. We will continue to review and refresh these, working in partnership with people who use our services and people who work here and work with us, including our commissioners. 1. Safe, effective, quality patient care 2. Local, joined up patient care 3. Put research, innovation and learning into practice 4. Be the provider, employer and partner of choice 5. Live within our means. These frame the priorities for the estate. Effectively we are committed to continuing to provide excellent patient care, to supporting our staff and achieving these in the context of a tough funding climate. Safe, secure and effective environments Right property in the right location Reduce overall cost Improve the appropriateness and quality of the environments for patients and staff Develop more environmentally sustainable buildings and services Generate income from property where possible Ensure operational services are optimal Tie in with our IT Digital Strategy Safe, secure and effective environments This means that our facilities need to be fit for purpose and meet current NHS guidelines for estates and facilities relative for use. Our patients, staff and visitors alike deserve an environment that protects their security, but in a way that is proportionate to the risks involved and is conducive to the therapeutic environment. Our patients have a range of needs. For example, people resident in our low and medium secure units would have a different profile of risk to, say, patients with advanced dementia. Yet, appropriate measures to protect patients, staff and visitors requires specialist intervention both in the way that care is managed and delivered and in the built environment itself. The key principle is that patients should be managed in the least restrictive environment possible in order to facilitate safe treatment and wherever there is the potential, rehabilitation and recovery should be promoted. Nevertheless, we do need to ensure that the design of the patient care environment has in place appropriate measures to ensure the safety and security of service users and all building users. This can often lead to trade-offs between the competing requirement for security balanced against the requirement to ensure that care environments are as homely and non-institutional as possible. The example below shows how the Trust works to find innovative ways to address often competing design requirements that address the needs and risks associated with our care groups. 20 Sussex Partnership NHS Foundation Trust

111 Ligature Reduction Programme Estates work with Clinical Services to assess environmental risks for suicide and self-harm in in-patient wards and adjacent clinical environments totalling sixty-one locations. The total Trust risk assessment data is used to formulate the annual Estates fixed ligature anchor point reduction programme, based on targeting the elimination or reduction in the highest identified risks as a priority. Estates meet monthly with Clinical Services and Risk & Safety to coordinate the ligature reduction anchor point programme, organising the on-going ward risk assessments, planning ligature reduction works and reviewing the latest anti-ligature products available within the industry, working with suppliers to develop new and innovative solutions to providing safer ward environments for patients. An example of this is a new ensuite shower door being fitted at many of our Adult Mental Health Wards The new ensuite shower door is constructed from lightweight 4kg soft foam then coated with a resilient antimicrobial, stain resistant vinyl material designed to withstand daily patient and client use in mental health environments. Harnessing the natural forces of short range magnetism for its fixing points means that this also has 100% fail-safe anti-ligature functionality. Right property in the right location Population need and service delivery models are always changing. Having the right property in the right location is essential to ensuring optimal delivery of our operational services. The way we deploy our estate requires that we adapt to the needs of services and this estate model follows the needs of our Care Delivery Services (CDSs). Reduce overall cost A growing and ageing population, coupled with technological advances in medicine and a constrained funding climate only serve to increase the need to look at productivity as a whole. After staffing, estates costs represent the highest cost to the NHS. At 25m per annum the Trust s expenditure on the estate is more than 10% of its total income. We are therefore looking to improve the productivity of the estate to help us achieve our goals. A review of the productivity of the NHS carried out by Lord Carter of Coles (the Carter Review) sets out 15 recommendations to improve productivity across the NHS. Two of these relate to the efficiency of the estate. These are: Estates Strategy (updated January 2019) 21
112 - That Trusts should operate with no more than 35% of the estate being non clinical - Trusts should have no more than 2.5% of their accommodation as void space. The Carter review requires Trusts to have a plan in place for achieving these in 2017, with a view to meeting or exceeding these targets by Whilst we are working towards these targets and aiming to better these where we can, the metrics themselves have been developed largely in the context of acute healthcare, and the nature of services provided in community and mental health settings may mean that different targets may be appropriate. We have met with the Carter team, who are developing equivalent metrics appropriate for the community and mental health estate. We will review these targets and where these stretch from the acute target we will develop plans to meet these. We strive to continuously improve on these measures to drive productivity from our estate. Percentage of non-clinical estate Our total calculation of non-clinical space is 23%. This is already an improvement on Carter benchmarks. The trust will continue to drive efficiencies, to ensure this figure does not increase. Percentage under-utilisation At present the amount of empty and under-utilised space is 4.3%. Our void reduction plan shows how we intend to reduce this figure to 0.6% by March 2020 by: Continuing to drive efficiencies across the estate. Ensuring better utilisation of space across the estate. Generate income from property where possible We are adopting an entrepreneurial approach to the management of our property portfolio to maximise the return from these assets. This is achieved through: - The roll out of service line reporting across the Trust so that all services have transparency in the cost of properties, and clear incentives to make best use of the value tied up in the estate. - Working collaboratively with our partners in the health and social care economy and more widely across the public sector through One Public Estate forums to generate opportunities to better space sharing, leasing estate to third parties, levering in commercial tenants where appropriate, as well as the re-investment of the proceeds of asset disposal to improve the quality of our retained estate. Improve the appropriateness and quality of the environments for patients and staff We have some excellent clinical facilities. However, the quality of our estate is not consistent across the board. We will use our knowledge from ERIC and PLACE, supported by our 6 facet surveys and audit programme to prioritise attention as follows: - Reduce instances of under-utilisation through a combination of site rationalisation, asset disposal and consolidation - Prioritise our capital programme to facilities that require refurbishment or modification to meet the high standards we aspire to for all our premises - Review the costs of all our premises and prioritise attention to reducing commitments to high cost to occupy premises, in order to release resources to invest in an estate that will have a lower footprint, but with capacity maintained through improved utilisation and with a higher quality patient care and staff working environment overall. 22 Sussex Partnership NHS Foundation Trust

113 How the Estates and Facilities engage with Art/ Design to create and transform our patient environment An example of is the community out-patients clinic, The Bedale Centre. The aim was to create a tranquil feeling throughout the facility, which in turn would help users of the centre to feel relaxed and comfortable during their visits. The décor was previously very plain and didn t engage any of the character from the nearby town, neither did it encompass any of the Trusts values. Inspiration was drawn from the seaside beach huts and architecture of the local Bognor Regis seafront. Using digital graphics of Bognor Beach huts we were able to re-create the fresh appeal and relaxing ambiance of the seafront within the centre. Another project was the Family Room at the Hellingly Centre. It was important to soften the feel of the Family Room; the room itself was aesthetically pleasing and had good ambience, however the secure perimeter fence in the courtyard was daunting and cold for visiting families of the patients. This was addressed by cladding the fence with a digital graphic of the nearby country side which has transformed the view and environment of the area where the patient and families meet. Estates Strategy (updated January 2019) 23

114 Above is the day room of our newly refurbished Brunswick Ward at Mill View Hospital. Care Without Carbon Improving Trust Sustainability One of our core objectives is to be a strong sustainable business, grounded in our communities and led by excellent staff. In 2017 the Trust reinforced its commitment to sustainability by developing a new Sustainable Development Management Plan (SDMP), Care Without Carbon (CWC). This plan establishes a set of principles and targeted interventions aimed at addressing one of the Trust s five strategic goals as defined by our 2020 Vision, which is to live within our means. As such, we are working with three key aims in mind: 1. Working towards long-term financial sustainability 2. Minimising our impact and having a positive impact on the environment 3. Supporting staff wellbeing to enable a happy, healthy and productive workforce CWC sets out how we will achieve this across seven key areas (see Figure 1). This ensures we are taking a co-ordinated approach, directly tackling the key challenges in delivering sustainability within the NHS and integrating into our core operational activities across the Trust. 24 Sussex Partnership NHS Foundation Trust

115 Figure 1. Care Without Carbon: our seven elements of sustainable healthcare at SPFT In October 2018 we reviewed our Care Without Carbon Strategy building on our SDMP of 2017 and launched our Dare to Care campaign. We have updated and agreed new Trust targets to 2025, replacing our previous 2020 targets. This change reflects the new, broader focus of the programme outside of the Estates department, as well as the longer term nature of some of our projects including the STP-wide Energy Performance Contract project (see below). In addition, our targets are in line with new global and NHS targets, showcasing our ambition to lead the way for sustainable healthcare policy and practice Estates Strategy (updated January 2019) 25
116 Sustainable healthcare across Sussex and East Surrey In order to further advance our sustainability goals and maximise the benefits we have broadened our scope to take a more coordinated approach to sustainability locally. Within Sussex and East Surrey, the annual carbon footprint of our healthcare system (including the seven main NHS provider trusts) is around 100,000 tonnes CO 2 e, which costs an estimated 32m per annum. As such, we are coming together with NHS provider partners in our STP area of Sussex and East Surrey to align our sustainability work through the Care Without Carbon framework, an approach originally developed by Sussex Community NHS Foundation Trust (SCFT). Three collaborative projects have been initiated to date: a joint Energy Performance Contract (EPC) procurement; a Courier Services Review and a joint waste tender with five of the STP trusts. We re also starting to explore the opportunity to roll out a staff engagement and behaviour change programme across the STP area. As well as creating economies of scale and delivering better value, these projects are about sharing best practice, encouraging innovation and improving system-wide planning and management of sustainability impacts. Our carbon footprint One of our key sustainability metrics is our carbon footprint, which reflects the environmental impact of the Trust. In delivering our services we consume a significant amount of energy and water and produce a large volume of waste. We also transport Trust staff, patients and goods, and purchase a large range of medical and other equipment and services. All of these activities generate carbon dioxide (CO 2 ) emissions, which are linked to climate change, and can be collectively summarised as our carbon footprint. The carbon footprint (measured in tonnes CO 2 e 1 ) associated with SPFT s services is illustrated in Figure 2 below. 1 CO2e is the standard unit for measuring carbon footprints. It reflects the impact of all six greenhouse gases that cause global warming including carbon dioxide and methane. This is important as some of the gases have a greater warming effect than carbon dioxide. 26 Sussex Partnership NHS Foundation Trust
117 Figure 2: SPFT carbon emissions Our target for 2025 is a 51% reduction in our carbon footprint, in line with Climate Change Act targets. Over the last three years we have seen a year-on-year reduction in our CO 2 emissions. This is partly due to a reduction in the Trust s energy use, but much of the decrease is a result of changes to the emissions factors used to calculate our carbon footprint, which are updated each year to reflect the current UK energy mix. Please note, figures do not currently include grey fleet emissions, and are based on sites where the Trust directly pays utility bills our PFI sites and some leased sites are excluded. A key focus for the coming year is to develop our carbon reporting mechanisms to enable us to fully reflect our impact and track progress towards our 2025 targets. The seven elements of Care Without Carbon overview and progress to date LEADERSHIP: leading the way for sustainable healthcare policy and practice KEY SUCCESS MEASURE FOR 2025: to integrate sustainable development principles into the Trust s 2025 Vision and Values Effective governance is critical to ensuring that we deliver on our SDMP, integrating and embedding its principles and processes throughout the Trust and engaging our staff, patients and wider stakeholders. The Trust s Sustainability Programme Board launched in September with representatives from each of the seven work streams of CWC. The Programme Board will coordinate the implementation of this SDMP and report to the Trust Board on progress. BUILDINGS: providing the workspace for low carbon care delivery with wellbeing in mind KEY SUCCESS MEASURE FOR 2025: 51% reduction in CO 2 e from our buildings The energy we use to heat, cool and power our buildings is the most significant contributor to our Trust s carbon footprint. Current and ongoing work streams include: Developing our energy and water reporting mechanisms to ensure we have a full understanding of our impact across all sites. Working with local trusts on the development of an EPC. This will enable us to focus new investment in our estate and help improve the energy efficiency of our hospitals, reducing operating costs and improving the patient environment. Developing a programme for improvement of our Building Management Systems including networking and upgrade of controls and the installation of an Automatic Meter Reading system. This will ensure we can monitor the performance of our buildings remotely to deliver a comfortable working environment for staff and patients, while saving money and improving our energy efficiency. Estates Strategy (updated January 2019) 27


118 JOURNEYS: maximising the health benefits of our travel and transport activity whilst minimising environmental impacts KEY SUCCESS MEASURE FOR 2025: 51% reduction in all measurable travel CO2e The NHS accounts for 5% of all road traffic in England and travel is responsible for 13% of the NHS carbon footprint. Travel is another area that has a significant impact on our environmental impact. Data availability is currently limited but we estimate that Trust staff travelled over 4 million miles this year, with associated cost and carbon impacts. Current and ongoing work streams include: Recruiting a Fleet Manager to be responsible for delivery of this work stream. Updating and relaunching the Trust s Sustainable Travel Plan. Utilise the electronic claims system to improve quality and consistency of data relating to travel claims so that this can be incorporated into the Trust s carbon footprint reporting. CIRCULAR ECONOMY: creating and supporting an ethical, resource-efficient supply chain KEY SUCCESS MEASURE FOR 2025: measurable reduction in overall waste volumes, 75% offensive waste, 75% recycling and zero waste to landfill 60% of the NHS carbon footprint sits within our supply chain. Our Circular Economy action plan takes a whole-life view of the goods and services we purchase, including the end-of-life implications (waste management). In 2017/18 our total waste increased, with 843 tonnes produced and a recycling rate of 22% (recycled waste expressed as a proportion of all non-healthcare waste by weight). Current and ongoing work streams include: Implementation of new waste contracts through the joint STP waste tender, incorporating new waste targets of 75% recycling and zero waste to landfill across all waste streams. Increasing our recycling rate across the Trust in line with our 2025 target. Introduction of the offensive waste stream across the Trust, delivering significant cost savings. CULTURE: informing, empowering and motivating people to take ownership of sustainable healthcare KEY SUCCESS MEASURE FOR 2025: 100% of Trust staff engaged in sustainability with measurable benefits In October 2018 we launched a new staff engagement campaign, Dare to Care, at SPFT. Based on the programme created at Sussex Community NHS Trust, this has been developed with the support from staff across the Trust. Dare to Care asks staff to take on a small dare, which is a pledge to do things differently in their working life to support Care Without Carbon. These dares will help us to reduce our impact on the environment, boost staff wellbeing and save money. The first three months of the programme has seen great uptake, with 122 members of staff signing up for over 670 dares. In 2019 we ll be developing further, to introduce team challenges and sustainability champions through our new Care Without Carbon Envoy programme. 28 Sussex Partnership NHS Foundation Trust

119 WELLBEING: creating a better working life for our people KEY SUCCESS MEASURE FOR 2025: reduce sickness rate to 3.5% and improve staff survey results relating to work place stress, action on health and wellbeing, staff engagement and staff recommending the Trust as a place to work or receive treatment The wellbeing of our staff plays a central role in achieving our sustainability strategy. By taking better care of ourselves, we can provide better care for our patients. Key areas of focus are to: Use this Estates Strategy as an opportunity to deliver enhanced staff health and wellbeing, with staff and service managers proactively engagement in the development of the estate. Support active, low carbon travel through our Healthy Workforce Group & Journeys work. Work with our partners across the STP to identify opportunities to collaborate on staff health and wellbeing, for example through coordinated campaigns or the development of new metrics for measuring wellbeing. FUTURE: working together to build a strong local health economy that serves our community now and in the future KEY SUCCESS MEASURE FOR 2025: to work with our NHS partners across our STP to reduce emissions from the system by 51% As part of an increasingly interconnected health and care system, we are working with our local NHS partners within our STP to share information and best practice and develop collaborative approaches to decarbonising our health economy. Three key projects have been developed to date, focussing on energy, courier services and waste as described earlier. A key element of this element going forward will be ensuring that our infrastructure, supply chain and logistics operations are resilient to changes in the climate and increased frequency of extreme weather events. Estates Strategy (updated January 2019) 29

120 Tie in with our IT Digital Strategy Our model of service is built around the needs of the patient and our infrastructure must support this. The ambition of our Estates Strategy is that our facilities do just that, but this cannot be achieved without a close alignment with our IT Digital strategy, the key components of which are illustrated graphically below: 30 Sussex Partnership NHS Foundation Trust
121 Accurate and timely information is required if our services are to ensure high levels of patient safety, clinical effectiveness and excellent patient and carer experiences. Information, like the estate, is a key enabler to the Trust s 2020 Vision document, our clinical strategy and CDS operational plans. Investment in both the estate and IT infrastructure must be planned in a coordinated way to deliver benefits. The Trust is committed to harnessing the benefits of Information through the deployment of Carenotes as the main electronic patient record. This will gradually supersede the paper record. On the whole our main sites and wards will have Wi-Fi connections, for the benefit of patients as well as staff. However, the nature of our service provision may mean that in our more secure environments security requirements may override the benefit of Wi-Fi access (e.g. in our low and medium secure units). A number of our premises already have COIN access to facilitate access across a number of NHS premises, but we are also looking at options that can extend such inter-operability across public sector buildings more generally, and since 2017 we have been working with partners in local government and independent providers within the health and care system to develop successor connecting networks that allow for secure communication on an as required basis across the health and care system. Our IT Digital strategy will enable smart clinic scheduling and the use of generic consultation and treatment spaces for the majority of our services. This will enable us to ensure that all our clinical facilities are used well and that many different services using the same room are supported in their own ICT needs. Our digital strategy will enable changed ways of working with the potential to support administrative functions across a number of sites, including within the premises of other organisations, as well as at home. ICT will also enable patients to engage with our services in new ways. Investment in modern estate and new ICT will not realise such benefits unless we take full advantage of the new ways of working that are enabled by such development. We will be supporting new models of working through training, communicating clearly our expectations with frontline staff about the deployment of ICT and agile working practices and using ICT to support the management of performance overall in the Trust. Through this approach we intend to reduce staff sickness and absence, improve recruitment and retention and make flexible working a genuine win-win, becoming more responsive to patient needs and allowing our staff to better balance their work commitments with carer and other responsibilities. Financing our capital investment requirements Given the continuing financial challenges facing the Trust and the wider NHS, the Trust made a decision a number of years ago to ensure that the capital programme was self-funding. The reasons for this are threefold; firstly, the Trust is no longer in a position to deliver significant annual surpluses; secondly, the Trust s borrowing capacity is constrained by the current PFI debt; and thirdly, the Trust wants to maintain its sound liquidity position to help support its overall financial rating with NHS Improvement. The table below sets out the funding and capital expenditure over the last 6 years. It should be noted that 56m has been made available through deprecation, asset sales and national funding. The Trust needs to continue this strategy into the future as the asset management review has identified that further investment would be needed to support our estate and service developments in line with our overarching strategies.. Estates Strategy (updated January 2019) 31
122 Year Depreciation Disposal Proceeds Funding National Funding Total Cash Available m m m m m Expenditure Capital Expenditure 2017/ / / / / / Total The 2018/19 Capital Programme budget was agreed at 10.7m within the Trust s financial plan to NHS Improvement (NHSI) at the start of the Financial year Following a review in November 2018 we have adjusted the programme and are now working to deliver an underspend of 1.7m to help counter the reduced Department of Health & Social Care (DHSC) on GDE IT Funding. We are currently planning our capital expenditure for 2018/2019 and anticipate this will be in the region of 10m. We have also created a five year capital programme that will enable us to plan future requirements for investment. Some of this will be self-funding but we also need to seek funding from either The Department or Health or utilise other private or public sector capital in a build and leaseback scenario. 32 Sussex Partnership NHS Foundation Trust
123 How our Estate is changing over the next five years The NHS is undergoing a period of transformative change in the way it commissions and delivers services. This is being driven by the STP and the CCG s local estates strategies. The first and foremost change is already underway, and this is to refocus strategic thinking away from the perspective of individual organisations to the needs of populations as a whole. Partnership working has always been central to the way the Trust operates, but there will be a stepchange in the level of collaboration between all NHS providers, primary care and local authority services, with an increase in multi-organisational service delivery models and multi-occupancy of buildings. It is no longer appropriate or effective to plan from the perspective of an individual organisation. We are a full participant in the planning processes led by the STP and the LES s led by CCGs as local system leaders. Furthermore, the Cabinet Office s One Public Estate initiative, where seed funding can be made available to support the development of projects that support the government s objectives for the public estate as a whole, is accelerating collaboration. Future iterations of the Trust s plans for the estate will increasingly focus on the local delivery and implementation of changes required to support change across a wider system. Our plans, therefore, will be taken forward through greater collaborative working through our partners. Given how the planning landscape may continue to change, and the development of strategic projects increasingly involves multiple partners, it is difficult to say for certain exactly how the Trust s estate will look 5 years from now, and any proposals set out here are also subject to further stakeholder engagement and public consultation. However, from work being carried out currently within the STP and LES s it is possible to make a prediction of the likely changes we will see over the next five years. We predict that we will: Further reduce our footprint Achieve greater co-location of staff, not only amongst our own services but with partner organisations as well Have fewer but better quality facilities Have reduced our footprint yet increased our capacity to provide services, using benchmarks for estates operational efficiency (such as Carter) to assess our progress on this journey Improve the patient care environment Continue to be at the forefront of research and best practice in the design and management of the healthcare environment including the incorporation of new technologies Provide non-clinical accommodation in non-clinical buildings and our non-clinical footprint will decrease as we realise the benefits of agile working, the proportion of non-clinical space as a total of our occupied space will decrease (in line with Carter efficiencies) Align the planning of the estate with the Trust s digital strategy to enable an ICT rich environment throughout. Achieve a high utilisation of estate (thereby improving both quality and value for money) and enable new ways of working that support the Trust s clinical strategy and vision. Specifically we have developed an Estates Modernisation programme comprising some 26 projects. Estates Strategy (updated January 2019) 33

124 The above is a five year programme of activity but in the past year we have had made good progress. We have: Launched our Sustainability Strategy Care Without Carbon Agreed a standard specification for our s136 suites and have a planned programme of upgrade works Have commenced or planned for the refurbishment of many of our community and inpatient facilities Relocated services from Springvale to Cantelupe House in East Grinstead Completed the refurbishment of New Brunswick Ward, Mill View Hospital Identified new accommodation for the relocation of Bluebell House Participated in the planning of a new primary care GP Practice in the centre of Brighton Commenced the Master Planning of many of our larger sites to ensure they will be used to their maximum potential in the future The above is being frequently reviewed and will be updated accordingly. 34 Sussex Partnership NHS Foundation Trust
125 How we will deploy our Estate to recruit, retain and support our staff We are committed to recruiting, retaining and supporting our staff to ensure they have productive, healthy and happy working lives, as well as recognising that our staff work best when there is a healthy work life balance. Each member of our staff is unique and requires different things from the Trust to ensure we can achieve working arrangements that support the needs of the organisation and our patients, as well as fitting around the needs of each member of staff. We are committed to supporting flexible working and to making this a win-win-win for our patients, our staff and the Trust. We have already described in the section above how informatics for example, can enable improvements in staff productivity, reduce unnecessary journeys, and offer greater flexibility to planning clinical rotas etc. How we develop and deploy our estate has the potential to make a marked impact on our success, not only on recruitment and retention, but on staff morale and well-being. How we will use our estate to improve health and wellbeing As a minimum all staff should have the right to be comfortable within the workplace. This means that staff should expect the following: Attractive work-places. This means that furniture is clean and comfortable, we follow our decorating schedules and, where necessary, we commit to the refurbishment of staff working environments. The attractiveness of staff working environments sends a strong signal about how we value our staff, and we want all our workplaces to demonstrate that we value and support all who work within our Trust Well-lit workplaces (ideally all working environments should afford good levels of natural lighting, but where this is not possible, e.g. in some clinical and FM environments, work patterns should limit the time staff are working in rooms without natural light). Environmental controls, including temperature and ventilation Work station assessments, including display screen equipment Staff amenities, with all staff having access to beverage and rest areas Fully compliance with all equalities legislation, including mobility access and reasonable access to enable the comfort and productivity of disabled staff Support for active travel, such as the provision of cycle storage and showers etc. for all our main sites. Making flexible working a win-win Work life balance means different things to different people. However, we are committed to supporting staff through: Flexible shift patterns and rostering reflecting the need for staff to build their own working lives around family, carer and other commitments Use of IM&T, including the deployment of Carenotes and accompanying agile working to reduce unnecessary journeys Building a network of flexible office hubs across our geography with touchdown facilities, to enable staff to have access to flexible office facilities within close range across our geography. Through our relationships with partners in the NHS and public sector more widely we intend to extend inter-operability to enable a greater range of flexible desking options to suit staff needs. We are working with partners through One Public Estate boards and other collaborative bodies such as SPACES (Strategic Property Asset Collaboration East Sussex) to extend this beyond NHS properties but across the public estate as a whole Estates Strategy (updated January 2019) 35

126 Active promotion of teleconferencing, to support meeting participation but reduce the number of journeys staff are required to make. Rolling out of Skype to support video/web conferencing and in some cases patient consultation. Travel light We are looking at ways we can reduce the impacts of CO 2 emissions further whilst also supporting staff. We recognise that for some staff (essential travellers) they must travel in order to fulfil their duties. Other staff may need to travel occasionally to fulfil their duties and other colleagues do not need to travel to fulfil their role. Our response must recognise that different staff groups have vastly differing travel requirements. These include: Extension of pool car provision and promotion of lease car options for essential travellers Looking at video/web conferencing options to support travel avoidance Use of pool cars and encourage public transport and active travel for shorter journeys Provide rebates on parking costs for staff who offer lift Consideration of travel requirements for all new sites being considered. We will ensure facilities for active travel across our sites, including cycle storage and showers. We will ensure we roll-out best practice in active travel policy and look for economies of scale. 36 Sussex Partnership NHS Foundation Trust
127 Conclusion We are well on our way to planning and implementing significant improvements in our Estate. These include major refurbishment projects, our Care without Carbon Strategy implementation and a rigorous focus on achieving high compliance standards. In the past two year s collaborative arrangements for the planning and delivery of health and care services have strengthened. Through the Strategic Transformation Partnerships (STPs) commissioners and providers of health and social care have been working closely to develop plans to make the NHS more sustainable in the context of rising demand and flat level funding. We are actively involved in this work. Within the remit of the STPs, commissioners have developed their local estates strategies, which set out the requirements for primary, community, acute and mental health services across the STP footprint. This will inform all major investments in the estate over the next few years, and will facilitate an approach to estates planning that encompasses not only health but other public bodies as well. The strategic planning and management of our own estate will evolve in the light of these closer collaborative arrangements, and further updates to this Estate Strategy will be influenced by this process. It is important that we see our accommodation and delivery of estates and facilities services in the context of One Collective Estate across our STP area and work with other providers and partners to deliver greater efficiency and effectiveness. As an Estates and Facilities Team we will continue to work across our areas of operation to develop specific plans for our estate to address service need. To do this we require Safe, secure and effective environments Right property in the right Location A reduction in overall cost Improvements to the appropriateness and quality of the environments for patients and staff More environmentally sustainable buildings and services Income generation from property where possible Optimal operational estates and facilities services Estate planning integrated with our IT Digital Strategy Looking to optimise value from the estate, getting out of high cost facilities and looking at ways to finance our capital investment needs as we run out of head room to invest in our estate through the proceeds of asset disposal Above all, we are on a continual journey to ensure that our estate continues to support our Trust in our ambition to deliver outstanding care and treatment you can be confident in. Estates Strategy (updated January 2019) 37
128 Appendix A. List of sites Building Town Post code Tenure Gross Internal Area (sqm) Farncombe Road Worthing BN11 2BB Freehold Stockbridge Road Chichester PO19 8QJ Leased Crawley Road Horsham RH12 4HN Freehold 1542 Acorn House, Prideaux Road Eastbourne BN21 2NW Freehold 372 Acre Day Hospital, 29 Wordsworth Road Worthing BN11 3NJ Freehold 192 Advertiser House, London Street Andover SP10 2PE Leased 307 Aldershot Centre for Health, Hospital Hill Aldershot GU11 1AY Leased 682 Aldrington House Annex, 35 New Church Road Hove BN3 4AG Freehold 911 Aldrington House, 35 New Church Road Hove BN3 4AG Freehold 1005 Aldrington Centre, 35 New Church Road Hove BN3 4AG Freehold 750 Allen Centre, 60 Sackville Gardens Hove BN3 4GH Freehold 670 Amberstone Hospital, Carters Corner Hailsham BN27 4HU Freehold Sussex Partnership NHS Foundation Trust
129 Arun House, 16 Liverpool Gardens Worthing BN11 1RY Leased 373 Ashurst Child and Family Centre, Lyndhurst Road Southampton SO40 7AR Leased 375 Avalon House, Chesil Street Winchester SO23 0HU Leased 250 Avenida Lodge, 3 Upper Avenue Eastbourne BN21 3UY Freehold 317 Badgers Corner, The Drive Hailsham BN27 4EP Freehold 72 Battle Health Centre, Station Approach Battle TN33 0BF Leased 370 Bedale Centre,1 Glencathara Road Bognor Regis PO21 2SF Freehold 809 Beechwood Unit, Level 1 Uckfield Hospital Uckfield TN22 5AW Leased 2783 Bellbrook Centre, Bell Lane Uckfield TN22 3PD Leased 200 Bexhill Health Centre, Holliers Hill Bexhill Sea on TN40 2DZ Leased 150 Bluebell House, Royal George Road Burgess Hill RH15 9NZ Leased 370 Bramblys Grange, Bramblys Drive Basingstoke RG21 8UN Leased 681 Bridge Centre, 2C Newton Road Eastleigh SO50 9DB Leased 191 Butterfly Nursery, Nevill Avenue Brighton BN3 7JW Freehold 266 Cantelupe House, Cantelupe Road East Grinstead RH19 3BZ Leased 121 Estates Strategy (updated January 2019) 39
130 Carters Lane House, 41 Brunswick Road Shoreham BN43 5WA Freehold 186 Cavendish House, Breeds Place Hastings TN34 3AA Leased 1615 Chalkhill, The Princess Royal Hospital, Lewes Road Haywards Heath RH16 4NQ Freehold 2356 Chanctonbury, Arundel Road Worthing BN13 3EP Freehold 586 Chapel Street Clinic, Chapel Street Chichester PO19 1BX PFI 1691 Chase Community Hospital, Conde Way Bordon GU35 0YZ Leased 25 Chichester Centre, Graylingwell Drive Chichester PO19 6GS PFI 4190 Children's Centre Worthing Hospital, Lyndhurst Road Worthing BN11 2DH Leased 353 Connolly House, Connolly Way Crowborough Hospital, Grove House, Southview Road Department of Psychiatry, Kings Drive East Brighton Community Mental Health Centre, Elm Grove Chichester PO19 6WD PFI 969 Crowborough TN6 1NY Leased 691 Eastbourne BN21 2UD Leased 3769 Brighton BN2 3EW Leased 1358 Firs, The Drive Hailsham BN27 4EP Freehold 585 Ford Prison Arundel BN18 0BX Leased Glebelands, Middle Road Shoreham BN43 6GA Leased Sussex Partnership NHS Foundation Trust
131 Gosport War Memorial Hospital, Bury Road Gosport PO12 3PR Leased Harold Kidd Unit, 9 College Lane Chichester PO19 6AU PFI 2309 Havant Health Centre, Civic Centre Way Havant PO9 2AX Leased 30 Hellingly Centre, The Drive Hellingly Hailsham BN27 4EP Freehold 3145 Highdown, Arundel Road Worthing BN13 3EP Freehold 326 Highmore, Western Road Hailsham BN27 3DY Freehold 710 Horder Healthcare Seaford, Sutton Road Seaford BN25 1SS Licence 28 Hove Polyclinic, Nevill Avenue Hove BN3 7HY Freehold Ifield Drive Crawley RH11 0EP Leased 200 Iris Ward, Horsham Hospital Horsham RH12 2DR Leased 750 Langley Green Hospital, Martyrs Avenue Crawley RH11 7EJ Freehold 5232 Laurels Day Centre, Sheep Fold Avenue Littlehampton BN16 3SQ Leased 30 Lewes Prison Lewes BN7 1EA Leased Lindridge, Laburnam Avenue Hove BN3 7JW Leased 2381 Linwood, Butlers Green Road Haywards Heath RH16 4BE Leased 724 Estates Strategy (updated January 2019) 41
132 Lodge, Arundel Road Worthing BN13 3EP Freehold 100 Mayfield Court, Lewes Road Eastbourne BN21 2BZ Freehold 544 Meadowfield Hospital, Arundel Road Worthing BN13 3EP Freehold 3905 Midhurst Community Hospital, Dodsley Lane Midhurst GU29 9AW PFI 1473 Mill View Hospital, Nevill Avenue Hove BN3 7HY Freehold 6707 Millwood Day Centre, Level 1 Uckfield Hospital Uckfield TN22 5AW Leased 344 New Park House, North Street Horsham RH12 1RJ Freehold 1515 Newhaven Rehabilitation Centre, Church Hill Newhaven BN9 9HH Leased 650 Northdown, Arundel Road Worthing BN13 3EP Freehold 549 Oak Park Children s Services, 8 Lavant Drive Havant PO9 2AW Leased 162 Oaklands Centre, Graylingwell Drive Chichester PO19 6GU PFI 727 Orchard House, Victoria Hospital Lewes BN7 1PE Leased 41 Osborn Centre, Osborn Road Peacehaven Children & Families Centre, Meridian Way Pepperville House, Fort Road Fareham PO16 7ES Leased 300 Peacehaven BN10 8NF Leased 100 Littlehampton BN17 7QU Leased Sussex Partnership NHS Foundation Trust
133 Psychology Department, The Princess Royal Hospital Haywards Heath RH16 4EX Leased Rutland Gardens Hove BN3 5PA Freehold Rutland Gardens Hove BN3 5PA Freehold Sackville Gardens Hove BN3 4GJ Freehold Sackville Gardens Hove BN3 4GJ Freehold 196 Salvington Lodge, Salvington Hill Worthing BN13 3BW Freehold 2941 Selden Centre, Salvington Hill Worthing BN13 3AT Freehold 774 Shepherd House, 129 Brighton Road Worthing BN11 2ET Freehold 636 Southdown, Swandean Arundel Road Worthing BN13 3EP Freehold 549 Southview, The Drive Hailsham BN27 4EP Freehold 1219 St Anne s Wards, Conquest Hospital St Leonards TN37 7PT Freehold 2725 St Francis Building, The Princess Royal Hospital Haywards Heath RH16 4EX Freehold 500 St Mary's House, 52 St Leonards Road Eastbourne BN21 3UU Leased 844 Sussex Education Centre, Nevill Avenue Hove BN3 7HY Freehold 756 Totton Health Centre, Testwood Lane Southampton SO40 3ZN Leased 117 Estates Strategy (updated January 2019) 43
134 Training Centre, Swandean Arundel Road Worthing BN13 3EP Freehold 168 Trust HQ, Swandean Arundel Road Uckfield Hospital Level 1 CAMHS, Level 1 Uckfield Hospital West Building, Swandean Arundel Road Worthing BN13 3EP Freehold 1489 Uckfield TN22 5AW Leased 1453 Worthing BN13 3EP Freehold Westbourne Gardens Hove BN3 5PP Freehold A Western Road Lewes BN7 1RL Leased 100 Woodlands, Conquest Hospital St Leonards TN37 7PT Freehold 2092 Woodside, The Drive Hailsham BN27 4ER Freehold 1275 Woodside Annexe, The Drive Hailsham BN27 4EP Freehold 1006 Workshop & Garages, Swandean Arundel Road Worthing BN13 3EP Freehold Sussex Partnership NHS Foundation Trust
135 Sussex Partnership NHS Foundation Trust Swandean Arundel Road Worthing West Sussex BN13 3EP Outstanding care and treatment you can be confident in
136 Report to Board of Directors Agenda item TBP30.1/19 Attachment F EHRIA code Date of meeting 30 January 2019 Format of Paper Title of paper Author Presenter Quality Committee Exceptions Report Theresa Dorey, Associate Director of Nursing Professor Gordon Ferns, Non Executive Director Committees/meetings where this item has been considered Purpose of report (tick all that apply) Written Oral Presentation To provide assurance For decision Regulatory requirement To highlight an emerging risk or issue To canvas opinion For information To highlight patient, carer or staff experience Strategic Goals (tick all that relate) 1. Safe, effective, quality patient care 2. Local, joined up care 3. Put research, innovation and learning into practice 4. Be the provider, employer and partner of choice 5. Living within our means Summary of Report The Quality Committee met on the 18 th December 2018 and was chaired by Professor Gordon Ferns, Non-Executive Director. In summary, the meeting considered the following Exceptions Reports: N/A Safety Committee Exceptions Report Effective Care and Treatment Committee Exceptions Report Well Led Committee Exceptions Report In addition, the following reports were received by the Committee: Q2 Trustwide Quality and Patient Safety Report CQC Thematic Review of Restraint, Prolonged Seclusion & Long Term Seclusion Quality & Safety Reviews CQC Improvement Plan Mental Health Act Committee Annual Report Quality Improvement Programme Update Serious Incidents Report N/A Recommendation The Board of Directors is asked to note the content of this report and raise any issues for clarification. Page 1 of 4
137 1. INTRODUCTION The purpose of the Quality Committee is to enable the Board to obtain assurance that high standards of care are provided by the Trust and in particular that adequate and appropriate governance structures, processes and controls are in place to: Promote safety and excellence in patient care Identify, prioritise and manage risk arising from clinical care Ensure the effective and efficient use of resources through evidence-based clinical practice Protect the health and safety of trust employees Ensure compliance with legal, regulatory and other obligations 2. REPORT The Exceptions report for the Quality Committee (QC) held on the 18 th December 2018: Safety Committee The purpose of the committee is to provide assurance that appropriate governance systems are in place to ensure that people are protected from abuse and avoidable harm to deliver the Trust s 2020 vision of providing the safest NHS mental health services in England in clean and safe environments. Safety Committee Exceptions Report was presented summarising the work of the Safety Committee held on 5 th November The main issue highlighted in the report focused on an investigation, which was completed by Niche on behalf of NHS England, into the care and treatment into Mr W. A robust action plan is in place which is monitored through the Safety Committee. Serious Incident Assurance Report was reviewed by the QC with discussion focusing on the SIs which occurred in November The paper provided an overview of the Serious Incidents (SI) reported by the Trust during November 2018 together with immediate actions taken. It also contained the learning from serious incidents, including SI action plans as a consequence of the incident/ review, in order to highlight any key themes. This included an update on the Trust s performance regarding the completion of Serious Incident Investigation Reports within the appropriate deadlines. The report reflected that of the 17 final SI reorts submitted in November 2018, 59% of these were submitted within the deadline.a discussion took place around Falls Management and the local Falls Workshops that are being progressed for Trust wide roll out. The Deputy Chief Nurse for Safeguarding & Physical Health has been asked to produce a paper for the next Quality Committee on the programme of work for the Falls Collaborative. Safer Staffing paper summarised the national requirement to report RMN fill rates. The Committee was briefed on the significant amount of work undertaken to recruit registered nurses. New national requirements will focus on care hours per day. Learning from Deaths first annual report was presented to the Quality Committee which summarised the process developed and implemented over the past year, key areas of learning and good practice. Actions agreed within the meeting to take this learning forward. Collaborative Review of Unexpected Inpatient Deaths report was presented to the Committee and provided an update that was presented to the Safety Committee summarising the key findings and recommendations. Next steps is to develop an action plan based on the 9 recommendations Page 2 of 4
138 Infection Control Annual Report was the second year Infection Control compliance audits have been completed in-house. The Physical Health Care team are currently reviewing the Infection and Prevention Control mandatory training to ensure it is relevant for a Mental Health Trust Q2 Quality and Patient Safety Report was presented with key issues raised relating to the continued focus of closing action plans on time, raising awareness of reporting no and low harm incidents. CQC Thematic Review of Restraint, Prolonged Seclusion & Long Term Seclusion. Paper was presented to the Committee which detailed the scope of the national review led by the CQC and requirements for the Trust to action. Quality Assurance Quality & Safety Review report was presented with key themes reported to the EAC CQC Improvement Plan report was presented to the Committee which outlined the focus of CQC Preparedness workshops for Inpatient, Crisis and Place of Safety and Community Services. Mental Health Act Committee Annual Report was presented and accepted by the committee. This committee now reports directly to the Quality Committee. Of note the annual report highlighted a decrease in incidences of DoLS and an increase in the use of Mental Health Places of Safety Section 136 suite and Section 2 of the Mental Health Act; the latter being in line with the national trend. The Trust and the Police are working together to achieve the best possible outcomes for service users. Quality Improvement Quality Improvement Programme Update was provided to the Committee which outlined the outcomes of clinical audits are being used to inform QI programmes which in turn are linked to the Clinical Strategy. The delivery of the QI training programme is now established. Consideration is also being given to building Bronze Level training into the Trust Induction. The area of focus over the next three months will continue to be the implementation of the QI programme and how service users and carers can become involved. Effective care and Treatment (ECAT) Committee report was presented to the Committee and its purpose is to make services more effective, providing evidenced based recovery orientated care and treatment supported by research and educational activity which includes the following: Assurance regarding work of the Drugs and Therapeutics Group It notes the timetable for production of remaining Menus of Care and Interventions from CAGs It notes presentation of Menus for Perinatal Mental Health and Dementia It notes the report from Brighton and Sussex Library and Knowledge Services The report also report is also focusing on mandatory training and the potential link to pay awards. Well Led Committee The Well Led Committee has now merged with the Workforce Committee. Well Led Committee Exceptions Report was presented which reported on proposals of Page 3 of 4
139 change to the Trust Induction and ensuring DBS Checks are completed before a member of staff commences in post. 3. NEXT STEPS The Board is asked to note this report for assurance. Page 4 of 4
140 Report to Board of Directors Agenda item TBP03.2/19 Attachment G EHRIA code N/A Date of meeting 30 January 2019 Format of Paper Title of paper Integrated Performance Report Written Author Dave West, Performance Director Oral Presenter Simone Button, Chief Operating Officer Presentation Committees/meetings where this item has been considered N/A Purpose of report (tick all that apply) To provide assurance For decision Regulatory requirement To highlight an emerging risk or issue To canvas opinion For information To highlight patient, carer or staff experience Strategic Goals (tick all that relate) 1. Safe, effective, quality patient care 2. Local, joined up care 3. Put research, innovation and learning into practice 4. Be the provider, employer and partner of choice 5. Living within our means Summary of Report The Trust Quality Improvement and Assurance report, attached, provides a summary of Trusts performance against agreed quality standards and priorities, workforce, finance and patient indicators. The framework includes key information used by NHS improvement to assess the Trust against operational quality standards and quality of care (safe, effective, responsive, caring and well led). This report provides an integrated (Finance, SI s, safer staff, HR, quality and performance) to reduce duplication and triangulate and link various element together as well as introducing statistical process control charts to enable better use of data and decision making. Recommendation The Board of Directors is asked to review the paper and ask any questions of the Chief Operating Officer. Page 1 of 5
141 1. INTRODUCTION The Trust Quality Improvement and Assurance report attached provides a summary of Trusts performance against agreed quality standards and priorities, workforce, finance and patient indicators. The framework includes key information used by NHS improvement to assess the Trust against operational quality standards and quality of care (Safety, Effective, Response, Caring and Well Led). 2. REPORT Report development The clinical care intelligence team have been working closely with the NHSI quality improvement team to learn how to best implement the SPC charts and to develop our reporting to be visually assessable. The team plan to roll out SPC charts to care delivery services. The plan is as follows September Updated report to Trust Board including SPC charts at Trust level. October CDS charts updated for 2 CDSs. November to January CDS charts updated for all CDSs and overall summary dashboard for Trust Board. An ICON dashboard was presented to EMC this month. CDS assurance process Each month the CDSs prepare a quality assurance report. These reports are informed by the charts and dashboard prepared by the clinical care intelligence team. The CDS quality assurance reports are reviewed by a panel which included the Chief Operating Officer, the Director of Performance, the senior finance manager, and the Head of HR / business partnering. This review panel checks that the appropriate level of assurance is provided, reviews areas of positive performance and acts as a means of communicating issues to other support services where required. The Chief Operating Officer formally writes to the CDS s after the review meeting to provide feedback (positive feedback, to ask for further assurance or to acknowledge where further support is requested by the CDS) Each quarter, each CDS attends their quarter review meeting. This is the opportunity to review the quality and performance, their finance position (including SIP schemes) and progress in meeting the annual objectives of the CDS in detail. The meeting is attended by the Chief Operating Officer, the Performance Director and/or the Chief Medical Officer and Chief Nurse as well as various support services representatives including finance and HR. Information from the above is used to the produce the assurance report for EMC and the Trust Board. Financial summary The Trust continues to make steady progress to deliver its financial plan for 2018/19; however there was a deterioration in the underlying run rate in December. Nevertheless despite operational pressures, the Trust s year to date position would be in line with plan if the Agenda for Change pay award was fully funded. Overall, the Trust reported a surplus in the month of 46k ( 47k under plan), taking the year to date position to a surplus to 422k ( 419k under plan). The pay award funding shortfall accounts for 46k of the adverse variance in the month and 419k year to date. Other areas of concern affecting the Trust s underlying deficit include:- Use of external placements - 1,430k year to date Page 2 of 5
142 Use of agency staff - 554k in month and 6,021k year to date (22.6% over the Agency Ceiling). Overspend on Adult in-patient units - 1,458k year to date Under achievement of Service Improvement Savings (SIP) - 1,974k year to date In order for the Trust to deliver its financial plan for 2018/19 it will need to secure full funding for the Agenda for Change pay award and to focus on the areas that are impacting on the underlying run rate. Key areas of concern and risk to quality Demand and capacity issues are impacting on the delivery of key indicators, particularly in Adult Community Services. Analysis of demand and capacity has taken place in each CDS. In North West Sussex, a specific demand and capacity group is in place. An Adult wide approach to reviewing demand and capacity is being taken through the Community work-stream of the Clinical Strategy programme, to bring together individual CDS actions and provide a consistent approach. A senior analyst has been recruited to the Clinical Care Intelligence team to support this work and initial analysis has been produced in January. In addition the CCI team is developing a team caseload report to support teams to review clinical caseloads and activity in supervision which is expected to be piloted in January. Lack of project management resources to support the planning and implementation of demand and capacity work across Adult services remains a key risk. Demand and capacity issues are impacting on waiting time performance in Adult Services. The process is exhibiting special cause variation (concern), being under target since January It was notable that the number of assessments reduced significantly in December below the lower process limit. Sussex CAMHS waiting time s performance in has been exhibiting special cause variation (concern) under target since December CHYPS services have a process in place to contact all patients on their waiting lists at least every six months, and provide patients with duty contact details should their presentation change. Adult services are discussing with CAMHS the use of similar systems to keep people safe whilst waiting. Risk Assessments performance remains under target. The last two months performance are slightly above the mean following a period of ten consecutive points below the mean. The variation is small showing little improvement to system performance overall against the 95% target. The new risk assessment form was added to Carenotes in December as planned. Inpatient flow resulting in an increased use of external placements and safety concerns where patient await the availability of an acute bed. This also has the potential to impact on A&E and is one of the risks for acute hospitals though winter pressures. Whilst improvements are still needed in this area to achieve our aspiration on no ECRs, it should be noted that ECR bed day performance is showing special cause variation (improvement) in relation to performance over the last 2 years. A number of short and longer term actions,detailed in the report, are in place to reduce length of stay and improve patient flow. Annual appraisals (55%) and regular supervision The evidence provided by the electronic system does not provide sufficient assurance that appraisals and supervision are carried out across all team. However, the feedback received by the COO and the HR Director has highlighted that not all information is being captured electronically. The supervision policy has been amended with clear guidance about how to record supervision. In addition to other actions, we are asking all business managers to have scrutiny of figures for each team. We are providing weekly reports for each CDS including teams doing well and those challenged. We are asking teams doing well to work collaboratively with teams struggling to share good practice and improve performance - not just in each CDS but across CDS'. Finally all SDs in each CDS have improvement of recording and performance in this area as a key priority. A Page 3 of 5
143 new report is being tested to provide accessible reporting for teams in relation to supervision and appraisals. Workforce challenges continue, particularly in relation to recruitment and retention. However there has been a period of special cause variation (improvement) in relation to agency expenditure. There has been a significant improvement over the last three months with agency spend between 505k and 554k a month which is around the agency ceiling set by NHSI. Year to date agency spend is 6,021k, which is 22.6% over the agency ceiling (improving the rating to 2). Clustering performance has demonstrated special cause variation (concern) with the last three points below the lower process limit. This is significantly under the performance target and currently at 69%. There is an annual consultation regarding the following year s payment reform process proposals which includes the national Mental Health Contracts. NHS England/NHSi is proposing a mandated approach based on a blended payment approach for adults and older people. This will consist of a fixed element based on a forecast activity and a variable element, also based on activity and linked to locally agreed quality and outcome measures. Cluster categorisation is likely to be a key element of this activity framework. Detailed plans to improve the volume and quality of clustering activity are detailed in the report. Complaints: Following a period of 11 consecutive points of special variation above the mean, the number of complaints in the period has fallen below the mean into common cause variation. The key themes for complaints are communication, values and behaviours of staff and patient care. Learning from complaints is incorporated into our learning lessons forums and included in the quarterly Quality and Safety report. Complaints training has been planned for January to March 2019 which will focus on high quality responses and how the process of responding to concerns and complaints can be improved. Key areas of improved performance and CDS Service Achievement Mixed Sex Accommodation breaches: The number of breaches has reduced in recent months and the process is exhibiting special cause variation (improvement) since January Physical Health Assessments: The performance has exhibited special cause variation (improvement) since February Further analysis is now taking place to look at whether each of the six parameters has been assessed in the physical health assessment. This shows that currently 65% of all eligible community and inpatients are being assessed for all, six parameters, with the main areas for improvements being blood tests. Work is underway with the CDSs to support areas of lower completeness. Essential training has exhibited special cause variation (improvement) since April Core training is at 91% and mandatory training is now at 88% for all courses. Fire evacuation training (81%) is an area of focus. Bookings are low (113 confirmed against 496 available places). Teams with less than 85% compliance are being followed up, and performance improvements will be reviewed at the beginning of February. Waiting times performance for Early Intervention services and IAPT services have remained on target over the year exhibiting common cause variation. The Early Intervention service is progressing work towards the agreed service development and improvement plan which includes the development of routine outcome measures and the capture of activity against SNOMED codes to demonstrate that NICE recommended interventions are being carried out. Page 4 of 5
144 CDS Achievements and Positive Developments Primary Care and Wellbeing IAPT 6 week waited time and recovery rates: Health in Mind performance in the month of December was well above the required target for both. West Sussex East Sussex A number of QI projects are underway including physical health, carers engagement, improving crisis and contingency plans, access to services and capacity and demand. One project in NW Sussex is looking at inappropriate referrals and DNAs which it is anticipated will release significant amount of demand for the teams. The turnover rate of staff is significantly below the Trust rate of 15.49% at 11.24% with steady recruitment and increased retention. Brighton &Hove The new Street triage service, helping to reduce S136 detentions and improve patient care, is now funded and operational on a pilot basis until March 2019 and is expected to be funded recurrently. Forensic Healthcare Good progress has been made in reduction of use of agency staff across all wards. Over December this year 29 agency shifts were used, compared to the same time period last year when agency shifts totalled 236. Learning Disability ChYPS Additional funding is now available from NHSE for Transforming Care to further enhance autism team, better resource CAMHS-LD in West Sussex and enhanced support for East Sussex. The Sussex CAMHS Website is being launched on 4 th February to coincide with Childrens Mental Health week. Its launch will involve a press and social media campaign. An internal launch of the website is happening w/c 21 st January involving young people who have been involved in the design of the site. A launch to partners will happen w/c 28 th January. Early Intervention in Psychosis Service The service has seen improvements in CPA review reporting (96%), risk assessments (97%) and clustering (93%) 3. NEXT STEPS The Integrated Performance Report (attached) describes the key actions being taken in relation the key quality indicators. 4. RECOMMENDATION The Board of Directors is asked to review the paper and ask any questions of the Chief Operating Officer. Page 5 of 5

145 Integrated Performance Report December 2018 Version
146 SAFETY 5 96% of patients There were 84% of patients were internal mixed sex subject to followed up within 7 accommodation CPA have had their days of their breaches in Month. care plan reviewed discharge from in the last 12 months. hospital to ensure their safety. EFFECTIVENESS 10 patients were accomodated in beds outside of the Trust due to capacity issues (ECRs). QUALITY PERFORMANCE 93 of Early Intervention patients were treated in 2 weeks. 89% of patients referred for IAPT psychological therapies were treated in 6 weeks, 100% in 18 weeks. 55% Staff turnover - 15% of staff left the of staff have had an Trust in the last 12 appraisal since the months. beginning of April patients had a delayed discharge at the end of December. RESPONSIVE WELL-LED Staff sickness was at 4.6%.
147 patients were referred to our services this month. The Trust is currently caring for 43,333 patients. incidents in the month related to violence and aggression. 6, There were 88% of staff completed the required essential training. THE MONTH OF DECEMBER 264 patients admitted to our beds this month. Acute mental health wards occupancy is at 103%. 852 patients had a mental health assessment in A&E liaison services. 79% of patients rated the Trust positively and would recommend it to friends and family. The Trust carried out 34,025 clinical appointments this month.

148 Reporting Month: Dec 18 Quality Indicators Safety 100% 95% 90% 85% 80% 100% 95% 90% Mean, 93.8% Change to system only reporting and tighter exception rules UPL, 100.3% LPL, 87.3% 7 Day Follow Up Apr 15 May 15 Jun 15 Jul 15 Aug 15 Sep 15 Oct 15 Nov 15 Dec 15 Jan 16 Feb 16 Mar 16 Apr 16 May 16 Jun 16 Jul 16 Aug 16 Sep 16 Oct 16 Nov 16 Dec 16 Jan 17 Feb 17 Mar 17 Apr 17 May 17 Jun 17 Jul 17 Aug 17 Sep 17 Oct 17 Nov 17 Dec 17 Jan 18 Feb 18 Mar 18 Apr 18 May 18 Jun 18 Jul 18 Aug 18 Sep 18 Oct 18 Nov 18 Dec 18 Brighton & Hove CDS North West Sussex CDS Coastal West Sussex CDS 85% UPL, 84.3% Mean, 82.1% 80% 75% Apr 17 Current compliance by CDS latest 3 months TRUST TOTAL East Sussex CDS LPL, 79.9% May 17 Jun 17 Jul 17 Aug % Sep % 94.6% Oct % 95.4% Nov 17 Current compliance by CDS latest 3 months Risk Assessments Dec 17 Jan 18 Feb 18 Mar 18 Apr 18 SPFT South East Mean National Mean National Benchmarking Q May 18 Jun 18 Jul 18 Aug 18 Sep % Oct % Current compliance by CDS latest 3 months 95.7% Nov 18 Dec 18 TARGET: 95% The SPC Chart for 7 Day Follow ups indicates that the level of variation in the process has increased since April 2016, when the Trust moved to system only reporting (no manual adjustments) and tighter criteria for allowing exceptions. There has been a recent period of improvement in performance between Oct 17 and Apr 18, however this has not been sustained. Whilst the Trust is reporting performance marginally over the target (96.3%) in the last month, the SPC chart indicates that with the current process it is likely that this indicator will continue to be frequently under target month on month. CDSs have been asked to review the process to ensure that appropriate actions are taken at the appropriate point in the care pathway (at admission, 1 week before discharge, the day before discharge and in the days following discharge). The themes for breaches are communication of discharge between the ward and community teams, patients being discharged whilst AWOL, patients being remanded in custody, patients of no fixed abode, and patients who are discharged and return overseas. CDSs report progress against these issues in their local quality assurance reports. TARGET: 95% From Apr 17 to date, risk assessment compliance has been showing very little variation around the mean level of 82.1% this is shown by how close the upper and lower process limits are on the SPC chart. This current compliance level is significantly below the target level of 95%. The performance has improved to be over the mean in the month, putting the process back into common cause varation. CDS's have reported a number of issues contributing to the risk assessment performance. These include: issues of demand and capacity, high caseloads and increases in referrals impacting on staff time. An agreement has been made that medical staff will complete their risk assessments on the GP letter, rather than the standard risk assessment, which creates a further administrative task in completing the standard risk assessment to provide assurance it has been done. In addition there are some high medical caseloads, particularly in areas such as West Sussex. NHSI Single Oversight Framework Indicator TRUST TOTAL East Sussex CDS Brighton & Hove CDS North West Sussex CDS Coastal West Sussex CDS 80.8% 71.1% 82.0% 72.5% 77.4% TRUST TOTAL Forensic Healthcare CDS Learning Disabilities CDS ChYPS CDS 65.9% 80.8% 90.0% 90.8% The new risk assessment form went live on Carenotes on 18th December. Clear guidance on the use of the new form was provided to staff through the Trust staff intranet. Whilst there is expected to be a short period of adjustment to the new form it is expected to have a positive impact on performance as it is easier to use. Key to Statistical process control charts: Target Mean Upper / Lower Process Control Limits (UPL/LPL) Special Cause Variation Improvement (7 or more consecutive data points better than the mean, or a single point outside the control limit) Special Cause Variation Concern (7 or more consecutive data points worse than the mean, or a single data point outside the control limit) Common Cause Variation 1 of 17
149 Reporting Month: Dec 18 Quality Indicators 100% 95% UPL, 96.6% Safer Staffing Fill Rate RMN The December Safer Staffing report illustrates that the Trust continues to be able to maintain a safe level of staffing in relation to HCAs (Health Care Assistants) with an overall fill rate of 110%; though we are still facing challenges to meet the qualified fill rate in 6 wards. Mean, 92% 90% LPL, 88.3% 85% 80% Apr 16 May 16 Jun 16 Jul 16 Aug 16 Sep 16 Oct 16 Nov 16 Dec 16 Jan 17 Feb 17 Mar 17 Apr 17 May 17 Jun 17 Jul 17 Aug 17 Sep 17 Oct 17 Nov 17 Dec 17 Jan 18 Feb 18 Mar 18 Apr 18 May 18 Jun 18 Jul 18 Aug 18 Sep 18 Oct 18 Nov 18 Dec 18 Overall RMN Day Fill Rates by Ward Dec 18 Overall RMN Night Fill Rates by Ward Dec 18 Forensic Healthcare CDS 6 2 Forensic Healthcare CDS Learning Disabilities CDS 1 Learning Disabilities CDS 1 The overall average qualified and non qualified nurses fill rate is 104%, whereas the overall fill rate for qualified nurses across the wards is above the compliance rate at 95%. The full details of each ward fill rate will be published in our Trust s website under Safe staffing Sussex Partnership NHS Foundation Trust. 3 wards (Ash, Larch and Oak) were unable to comply with their qualified day fill rate, mainly affected by high sickness rate and other absences (maternity and special leave). Similarly, both Jade and Pine wards were not able to comply with their RMN night fill rates due to sickness and maternity leave, while Orchard ward had two newly qualified nurses on preceptorship. Safety ChYPS CDS East Sussex CDS Brighton & Hove CDS North West Sussex CDS ChYPS CDS East Sussex CDS Brighton & Hove CDS North West Sussex CDS The wards monitor continuously safe staffing levels, and seek to address and manage any problems identified immediately. Unfilled RNs shifts were covered by HCAs and ward managers worked in the numbers to maintain safety, provide leadership and are actively involved in face to face patient care. Coastal West Sussex CDS Coastal West Sussex CDS Count of Wards Count of Wards >90% 80 90% <80% >90% 80 90% <80% Overall HCA Day Fill Rates by Ward Dec 18 Overall HCA Night Fill Rates by Ward Dec 18 Forensic Healthcare CDS 5 3 Forensic Healthcare CDS 8 Learning Disabilities CDS 1 Learning Disabilities CDS 1 ChYPS CDS 1 ChYPS CDS 1 East Sussex CDS 7 1 East Sussex CDS 8 Brighton & Hove CDS 6 Brighton & Hove CDS 6 North West Sussex CDS 4 North West Sussex CDS 4 Coastal West Sussex CDS 6 3 Coastal West Sussex CDS 9 Count of Wards Count of Wards >90% 80 90% <80% >90% 80 90% <80% Key to Statistical process control charts: Target Special Cause Variation Improvement (7 or more points better than the mean, or a single point outside the control limit) Mean Special Cause Variation Concern (7 or more points worse than the mean, or a single point outside the control limit) Upper / Lower Process Control Limits (UPL/LPL) Common Cause Variation 2 of 17
150 Reporting Month: Dec 18 Quality Indicators Safety Oct 16 UPL, 22 Mean, 13 LPL, 3 Nov 16 Dec 16 Jan 17 Feb 17 Mar 17 Apr 17 May 17 Jun 17 Jul 17 Serious Incidents by Category Current Month Violent Incident Unexpected Death UPL, 103 LPL, 41 UPL, 490 Mean, 388 LPL, 287 Self Harm Homicide Total Falls Mean, 72 Apr 15 Jun 15 Aug 15 Oct 15 Dec 15 Feb 16 Apr 16 Jun 16 Aug 16 Oct 16 Dec 16 Feb 17 Apr 17 Jun 17 Aug 17 Oct 17 Dec 17 Feb 18 Apr 18 Jun 18 Aug 18 Oct 18 Dec 18 Serious Incidents Aug 17 Sep 17 7 Oct 17 Nov Dec 17 Jan 18 UPL, 16 Mean, 9 LPL, 1 Feb 18 Patient Safety Incidents Mar 18 Apr 18 May 18 Jun 18 Apr 16 Jun 16 Aug 16 Oct 16 Dec 16 Feb 17 Apr 17 Jun 17 Aug 17 Oct 17 Dec 17 Feb 18 Apr 18 Jun 18 Aug 18 Oct 18 Dec 18 UPL, 234 Mean, 187 LPL, 140 Jul 18 Aug 18 Unexpected Deaths Apr 15 May 15 Jun 15 Jul 15 Aug 15 Sep 15 Oct 15 Nov 15 Dec 15 Jan 16 Feb 16 Mar 16 Apr 16 May 16 Jun 16 Jul 16 Aug 16 Sep 16 Oct 16 Nov 16 Dec 16 Jan 17 Feb 17 Mar 17 Apr 17 May 17 Jun 17 Jul 17 Aug 17 Sep 17 Oct 17 Nov 17 Dec 17 Jan 18 Feb 18 Mar 18 Apr 18 May 18 Jun 18 Jul 18 Aug 18 Sep 18 Oct 18 Nov 18 Dec 18 Violence Incidents Apr 15 Jun 15 Aug 15 Oct 15 Dec 15 Feb 16 Apr 16 Jun 16 Aug 16 Oct 16 Dec 16 Feb 17 Apr 17 Jun 17 Aug 17 Oct 17 Dec 17 Feb 18 Apr 18 Jun 18 Aug 18 Oct 18 Dec 18 Sep 18 Oct 18 Nov 18 Dec 18 The SPC Chart for Serious Incidents is showing common cause variation, around a mean value of 13 each month. With regards to patient safety incidents this will be subject to variation whilst we validate and quality check the data. Patient safety incidents are routinely uploaded to national reporting systems and reported in the Trusts Quality Committee report. Serious Incidents (SIs) and Fatalities During December 18 there were a total of 12 SIs reported which is an decrease on the previous month from 16 reported incidents. However, despite this decrease the total number continues to remain within the mean for the last two years. The main incident types reported for SIs during December 18 continues to be unexpected deaths. During this month 7 unexpected deaths were reported as SIs which is an decrease from the mean over the last two years. There was also one reported homicide which is being followed up according to standard trust policies and procedures. Patient safety incidents (PSIs) has continued to show growth in reporting over the last nine months. This is positive to demonstrate a learning and open reporting culture with the majority of the incidents reported having a no or low harm outcome for December. The most widely reported patient safety incident type continues to be self harm by ligature. This has been an on going issue, both for the trust and other trusts and remains a focus to progress this area of patient safety further. An internal event is being organised with nurses in February 19 to discuss feedback from an external collaborative on ligature incidents the trust held in October 2018 and to share any challenges and good practice being experienced on our own wards. Slips, Trips, Fall and Violence and Aggression Slips, trips and falls are just below the mean mark for December 18 for reported incidents. A slips trips and falls paper was presented at the Safety Committee to discuss data. The data presented showed a couple of potential areas for further discussion in terms of when medication rounds are completed and whether this equates to potential increased incidents of slips, trips and falls. In addition it is planned to hold a falls workshop to discuss and share good practice on falls management. With regards to violence and aggression there continues to be a slight decrease during December 18 in reported incidents and this will continue to be monitored to determine if this is a continuing trend. The domiciliary care agency (PDCA) SPFT who support people with complex learning disabilities in their own homes at Acorn and Mayfield Court feature in the top 10 highest reporting wards. The PMVA team now offer bespoke physical interventions training to this team which they have completed in addition to theory training provided by PBS (Positive Behavioural Support) Sussex. Data shows that there are higher levels of violence and aggression incidents on two of our dementia care wards (Brunswick and Beechwood). The introduction of the bespoke dementia care course aims to help equip staff with the skills, knowledge and competence to be able to work with people who have dementia and are in distress. Key to Statistical process control charts: Target Special Cause Variation Improvement (7 or more points better than the mean, or a single point outside the control limit) Mean Special Cause Variation Concern (7 or more points worse than the mean, or a single point outside the control limit) Upper / Lower Process Control Limits (UPL/LPL) Common Cause Variation 3 of 17

151 Reporting Month: Dec 18 Quality Indicators Mixed Sex Accommodation Breaches (internal) Mixed sex accommodation breaches have reduced in recent months with the most recent 8 months showing special cause variation below the mean. 0 Jul 17 Aug 17 Sep 17 Oct 17 Nov 17 Dec 17 Jan 18 Feb 18 Mar 18 Apr 18 May 18 Jun 18 Jul 18 Aug 18 Sep 18 Oct 18 Nov 18 Dec 18 Current Breaches by CDS latest 3 months East Sussex CDS 3 Brighton & Hove CDS 6 North West Sussex CDS 1 Safety Coastal West Sussex CDS 5 Key to Statistical process control charts: Target Special Cause Variation Improvement (7 or more points better than the mean, or a single point outside the control limit) Mean Special Cause Variation Concern (7 or more points worse than the mean, or a single point outside the control limit) Upper / Lower Process Control Limits (UPL/LPL) Common Cause Variation 4 of 17
152 Reporting Month: Dec 18 Quality Indicators 100% 95% 90% 85% 80% Mean, 87.7% CPA Reviews in 12 months UPL, 91.6% LPL, 83.7% Apr 15 May Jun 15 Jul 15 Aug 15 Sep 15 Oct 15 Nov 15 Dec 15 Jan 16 Feb 16 Mar 16 Apr 16 May Jun 16 Jul 16 Aug 16 Sep 16 Oct 16 Nov 16 Dec 16 Jan 17 Feb 17 Mar 17 Apr 17 May Jun 17 Jul 17 Aug 17 Sep 17 Oct 17 Nov 17 Dec 17 Jan 18 Feb 18 Mar 18 Apr 18 May Jun 18 Jul 18 Aug 18 Sep 18 Oct 18 Nov 18 Dec 18 TARGET: 95% The SPC Chart for CPA reviews indicates that there was a shift in performance in April 2016 when the Trust moved to system only reporting (no manual adjustments). Performance in December has shifted to special cause variation (deterioration), below the lower limits at 83% for thr Trust. Performance in North West Sussex has dropped to 69.9%. A focused meeting will take place with specific West Sussex teams where performance is low across a number of key indicators. This will support the development of improvement plans, learning from best practises across Adult Services. The approach is endorsed by the Chief Operating Officer. Effective 100% 90% 80% 70% 60% 50% 40% Current compliance by CDS month end snapshot TRUST TOTAL CAMHS EIS East Sussex CDS Brighton & Hove CDS North West Sussex CDS Coastal West Sussex CDS UPL, 68.2% Mean, 62.4% LPL, 56.5% Apr 17 May 17 Jun 17 TRUST TOTAL Learning Disabilities CDS ChYPS CDS East Sussex CDS Brighton & Hove CDS North West Sussex CDS Coastal West Sussex CDS Jul 17 Aug % Sep % 52.7% 59.1% Oct % 83.0% 85.4% Current compliance by CDS month end snapshot 69.1% 71.4% 90.4% 90.8% Nov 17 Dec % 83.5% Jan 18 Feb 18 Regional National All Patients with a Valid Care Plan Mar 18 National Benchmarking MHSDS Data May 18 SPFT Apr 18 May 18 Jun 18 Jul % Aug % Sep 18 Oct 18 Nov % Dec 18 TARGET: 95% The SPC chart for patients with valid care plans indicates that there has been a period of special cause improvement between September 2017 and October However, with the current process, the mean (61.7%) and the upper process limit (67.9%) the chart indicates that it is likely that this indicator will continue to be under target in the month. CDSs have reported a number of issues that are considered to be contibuting to the care plan performance. These include; issues of demand and capacity, high caseloads, additional presenting problems data being captured on a care plan form and increases in referrals; an agreement has been made that medical staff will complete their care plans on the GP letter, rather than a standard care plan which creates a further administrative burden in completing the care plan to provide assurance that it has been done. There are some high medical caseloads. The Trust is carrying out a review of the current Care Plan template to improve the time it takes to complete it, to enable it to be used across the patient pathway and to be more person centred. A group has been established, led by the Chief Medical Officer, to work towards a milestone at the end of March 2019 for the delivery of the care plan form. The CDSs continue to focus on local actions to maintain performance in the interim. Key to Statistical process control charts: Target Special Cause Variation Improvement (7 or more points better than the mean, or a single point outside the control limit) Mean Special Cause Variation Concern (7 or more points worse than the mean, or a single point outside the control limit) Upper / Lower Process Control Limits (UPL/LPL) Common Cause Variation 5 of 17
153 Reporting Month: Dec 18 Quality Indicators Effective 100% 80% 60% 40% 20% 0% UPL, 60.8% Mean, 50.3% LPL, 39.7% Jul 17 Aug 17 Brighton & Hove CDS North West Sussex CDS Coastal West Sussex CDS 100% Physical Health Assessments Inpatients and Community Clusters Sep 17 Oct 17 Nov 17 Dec 17 Current compliance by CDS month end snapshot 95% 90% 85% 80% 75% 70% 65% TRUST TOTAL East Sussex CDS Jan % Feb % 77.8% 77.5% 81.9% Mar 18 Apr 18 May 18 Jun 18 TRUST TOTAL Forensic Healthcare CDS ChYPS CDS Jul 18 Aug 18 Sep 18 Oct 18 Nov 18 Current compliance by CDS month end snapshot Mean, 72.8% Change to reporting definition UPL, 75.6% LPL, 70.1% Apr 15 May Jun 15 Jul 15 Aug 15 Sep 15 Oct 15 Nov 15 Dec 15 Jan 16 Feb 16 Mar Apr 16 May Jun 16 Jul 16 Aug 16 Sep 16 Oct 16 Nov 16 Dec 16 Jan 17 Feb 17 Mar Apr 17 May Jun 17 Jul 17 Aug 17 Sep 17 Oct 17 Nov 17 Dec 17 Jan 18 Feb 18 Mar Apr 18 May Jun 18 Jul 18 Aug 18 Sep 18 Oct 18 Nov 18 Dec 18 Current compliance by CDS month end snapshot TRUST TOTAL ChYPS CDS East Sussex CDS Brighton & Hove CDS North West Sussex CDS Coastal West Sussex CDS 58.6% 69.0% 64.4% 74.8% 73.4% Cluster Reviews 94.1% 77.5% 78.2% Dec % The NHSi / CQUIN indicators are now aligned, with the exception of an additional target for EIS this year. The chart represents the number of confirmed physical health assessments for patients in services aligned to the national CQUIN. There are now physical health leads in Brighton, East Sussex and West Sussex. The Physical Health CQUIN builds on the developments over the last 5 years to improve physical health care for people with severe mental illness (SMI) in order to reduce premature mortality in this patient group. The aim is to ensure that patients with SMI receive comprehensive cardio metabolic risk assessments and have access to the necessary treatments/interventions. The results are recorded in the patient s electronic care record. Patients with SMI for the purpose of this CQUIN are all patients with psychosis, including schizophrenia in all types of inpatient units and community settings commissioned from all sectors. The cardio metabolic parameters are as follows: Smoking status, Lifestyle; Body Mass Index, Blood pressure, Glucose regulation, Blood lipids. Further analysis now in place looks at whether each of these six parameters has been assessed in the confirmed physical health assessment. This shows that currently 65% of all eligible community and in patients are being assessed for all 6 parameters, with the main area for improvement being blood tests. Work is underway to support CDSs with lower levels of completeness. TARGET: 95% The SPC Chart for cluster reviews Indicates that process is exhibiting special cause variation (deterioration) in December, as performance is below the lower control limit. The current process is operating around a mean of 72.8%. The chart indicates that no improvement has been made since August 2017 towards the target of 95%. The gradual decline in Clustering is the result of a combination of factors including Clustering data not being used in a clinically meaningful way within operational services and high caseloads resulting in clinicians focussing on priority activities eg risk assessments The plan is to address this by: Ensuring that Clustering is identified as a priority within each adult CDS annual plan The roll out of a Team Dashboard by end Jan will provide greater visibility of key team metrics and will support systematic use of team data by Team Leaders. Focussing, as an immediate priority, on an acute ward from each CDS and ATS teams to identify and address any residual issues with clustering on these teams to reach 95% by end March Using a QI approach to take the learning from these teams and roll out learning to all teams. The development of simplified Clustering guidance and additional training by end Feb NHSI Single Oversight Framework Indicator Key to Statistical process control charts: Target Special Cause Variation Improvement (7 or more points better than the mean, or a single point outside the control limit) Mean Special Cause Variation Concern (7 or more points worse than the mean, or a single point outside the control limit) Upper / Lower Process Control Limits (UPL/LPL) Common Cause Variation 6 of 17
154 Reporting Month: Dec 18 Quality Indicators Effective 80% 75% 70% 65% Feb 18 UPL (Indicative), 74.6% Mean, 72.1% LPL (Indicative), 69.6% Mar 18 % Clients in Settled Accommodation (patients on CPA aged 18 69) Indicative upper and lower process limits shown, as too few points for reliable SPC calculations North West Sussex CDS Coastal West Sussex CDS 12% 11% 10% Brighton & Hove CDS 9% 8% Apr 18 May 18 Current % by CDS month end snapshot TRUST TOTAL ChYPS CDS East Sussex CDS Feb 18 UPL (Indicative), 10.3% Mean, 9.5% LPL (Indicative), 8.7% Mar 18 Apr % 70.1% 68.5% 69.1% 69.5% Jun % Jul 18 Aug 18 % Clients in Employment (patients on CPA aged 18 69) Indicative upper and lower process limits shown, as too few points for reliable SPC calculations May 18 Current % by CDS month end snapshot TRUST TOTAL ChYPS CDS East Sussex CDS Brighton & Hove CDS North West Sussex CDS Coastal West Sussex CDS 4.3% 6.6% 9.1% 8.0% 11.1% Jun % Jul 18 SPFT Regional National Aug 18 Regional National Sep 18 Sep 18 Oct 18 Oct 18 Nov 18 National Benchmarking MHSDS Data May % Nov % National Benchmarking MHSDS Data May 18 SPFT 8.2% Dec % Dec % 10.5% The SPC chart of the % of clients in settled accomodation shows indicative upper and lower process limits as there are currently too fewer points for reliable SPC calculations. However it should be noted that Sussex Partnership with a mean of 72.1% is showing a higher performance than the national benchmark (57%) and the regional benchmark (66%). TARGET: 95% The SPC chart of the % of clients in employment shows indicative upper and lower process limits as there are currenltly too fewer points for reliable SPC calculations. However it should be noted that Sussex Partnership with a mean of 9.5% is showing a higher performance than the latest national (8.2%) at the same period. NHSI Single Oversight Framework Indicator NHSI Single Oversight Framework Indicator Key to Statistical process control charts: Target Special Cause Variation Improvement (7 or more points better than the mean, or a single point outside the control limit) Mean Special Cause Variation Concern (7 or more points worse than the mean, or a single point outside the control limit) Upper / Lower Process Control Limits (UPL/LPL) Common Cause Variation 7 of 17
155 Reporting Month: Dec 18 Quality Indicators Effective 1,400 1,200 1, UPL, 1,197 Mean, 615 LPL, 32 Nov 16 Dec 16 Jan 17 Feb 17 Mar 17 Apr 17 May 17 Jun 17 Jul 17 Aug 17 Sep 17 Oct 17 Nov 17 Dec 17 Jan 18 Feb 18 Mar 18 Apr 18 May 18 Jun 18 Jul 18 Aug 18 Sep 18 Oct 18 Nov 18 Dec 18 OAP Bed Days by CDS latest 3 months TRUST TOTAL 1,038 East Sussex CDS 181 Brighton & Hove CDS 343 North West Sussex CDS 65 Coastal West Sussex CDS 's 400 UPL, Mean, LPL, Out of Area Placements (OAPs) / ECRs Bed Days Out of Area Placements (OAPs) / ECRs Cost ( '000s) Apr 17 May 17 Jun 17 Jul 17 Aug 17 Sep 17 Oct 17 Nov 17 Dec 17 Jan 18 Feb 18 Mar 18 Apr 18 May 18 Jun 18 Jul 18 Aug 18 Sep 18 Oct 18 Nov 18 Dec 18 The SPC chart shows that there has been a period of special cause variation (improvement) since March The following actions have contributed to this: Introduction of a Clinical Lead Nurse for bed management and Trust wide management of acute resources. Improved daily management of referrals for admissions and pan Sussex prioritization Weekly DTOC system calls attended by SPFT and each Sussex Local Authority Fortnight Executive DTOC escalation calls including CCG and Local Authority Introduction of Clinical Discharge Coordinator Introduction of the complex review panel processes The Establishment of a Specialist Assessment MDT (SAM) to maintain a reduction in specialist placements in place since October Planned actions include: Length of stay The Specialist Assessment MDT (SAM) will be refocused to provide robust in reach to support discharge pathways for patients with long LOS s Psychiatric Decision Unit. Implementation has commenced, planned to be operational by May 2019 STP Mental Health Programme has agreed 1.3M 24/7 CRHT investment for 19/20 model to be developed Additional acute capacity: Identified at Meadowfield (3 bedrooms expected from 4th February, a further 3 by July). An addition, 3 acute beds at Langley Green from July. Brighton Street Triage: Commenced December 2018, an evaluation has commenced. (Expected to be funded recurrently from April 2019) DTOC key task to develop pan Sussex Clinical Discharge Policy via task & finish group High impact actions monitored through overarching STP DTOC plan Continued provision and review of a length of stay dashboard to improve acute ward performance STP Patient Flow Niche modelling final report to be received January 2019 and needs to owned by the system NHSI Single Oversight Framework Indicator Key to Statistical process control charts: Target Special Cause Variation Improvement (7 or more points better than the mean, or a single point outside the control limit) Mean Special Cause Variation Concern (7 or more points worse than the mean, or a single point outside the control limit) Upper / Lower Process Control Limits (UPL/LPL) Common Cause Variation 8 of 17

156 Reporting Month: Dec 18 Quality Indicators 90% 85% 80% UPL, 85.5% Mean, 83.5% LPL, 81.5% Essential Training TARGET 85% Part 1 Essential Training: Core 9 Essential training continues to show a steady improvement in compliance and is currently at 90%. Areas of focus are fire evacuation training (81%) During January to March there are 496 available bookings for F2F courses however there are currently only 133 confirmed bookings. Teams with an average compliance score of less than 85% are being contacted and requested that all outstanding e learning is completed by the end of January. These teams will be revisited at the beginning of February and if there are still outstanding gaps, these teams will be escalated through the Executive Management Committee. 75% Apr 17 May 17 Jun 17 Jul 17 Aug 17 Sep 17 Oct 17 Current compliance by CDS month end snapshot TRUST TOTAL Nov 17 Dec % Jan 18 Feb 18 Mar 18 Apr 18 May 18 Jun 18 Jul 18 Aug 18 Sep 18 Oct 18 Current compliance by CDS month end snapshot TRUST TOTAL 88.1% Nov 18 Dec 18 Part 2 Essential Training: All mandatory training: The Trust overall mandatory training compliance is 88%. There are 25 teams with an overall compliance target of less than 65%; 91 teams compliance between 66% and 84% and 292 team with an overall compliance of 85% and above. Effective East Sussex CDS Brighton & Hove CDS North West Sussex CDS Coastal West Sussex CDS 87.1% 88.0% 89.1% Carehome Plus CDS Forensic Healthcare CDS Learning Disabilities CDS ChYPS CDS 84.2% 87.5% 87.4% 91.9% Courses on Safety remain an area of focus and in some areas concern (Basic Life Support 81%(+10% from last month); Immediate Life Support 68%; PMVA Physical Interventions 79% (+9% from last month). Resuscitation has had a great improvement this month, however it is also the course with the highest Did Not Attend (DNA) rates 52 in October. Training is currently being sourced from an external provider and will continue until the end of March. The new resuscitation trainers will be in post from Feb 19. There is an ongoing communication from the Chief Executive to all the Service and Clinical Directors to focus on Fire safety and Basic Life Support. Services are required to provide dates of when they expect to reach compliance. MyLearning is having a systems upgrade on the 1st February. Part of this upgrade will be a new compliance dashboard on the home page and managers will now have the ability to book their staff onto training sessions directly. Key to Statistical process control charts: Target Special Cause Variation Improvement (7 or more points better than the mean, or a single point outside the control limit) Mean Special Cause Variation Concern (7 or more points worse than the mean, or a single point outside the control limit) Upper / Lower Process Control Limits (UPL/LPL) Common Cause Variation 9 of 17
157 Reporting Month: Dec 18 Quality Indicators Responsive 100% 95% 90% 85% 80% 1,200 1,000 UPL, 96.8% Mean, 93.2% LPL, 89.5% Apr 15 May 15 Jun 15 Jul 15 Aug 15 Sep 15 Oct 15 Nov 15 Dec 15 Jan 16 Feb 16 Mar 16 Apr 16 May 16 Jun 16 Jul 16 Aug 16 Sep 16 Oct 16 Nov 16 Dec 16 Jan 17 Feb 17 Mar 17 Apr 17 May 17 Jun 17 Jul 17 Aug 17 Sep 17 Oct 17 Nov 17 Dec 17 Jan 18 Feb 18 Mar 18 Apr 18 May 18 Jun 18 Jul 18 Aug 18 Sep 18 Oct 18 Nov 18 Dec 18 ADULT SERVICES TOTAL North West Sussex CDS Coastal West Sussex CDS Mean, Current compliance by CDS latest 3 months East Sussex CDS Brighton & Hove CDS UPL, % Routine Assessment Waits < 4 Weeks 77.7% 84.1% 91.4% 92.3% Total Routine Assessments Adults Monthly Routine Assessments by CDS current month East Sussex CDS Brighton & Hove CDS North West Sussex CDS Coastal West Sussex CDS TARGET: 95% The SPC chart indicates that there has been a period of special cause variation (concern) since August The areas most impacted over the last three months are East Sussex (77%) and North West Sussex (74%) although Brighton performance has varied at (74%). The chart "total routine assessment" shows that the number of assessments carried out across Adult Services has remained within common cause variation, with the exception of December where there has been a reduction in assessment numbers. Further analysis is warranted to evidence the issues causing the decline. Each of the CDSs have actions in place. Brighton CDS has developed an informal action plan which has been through a number of iterations with the CCG. In East Sussex, a detailed action plan has been developed and shared with Commissioners. This includes a revised referral criteria, streamlining of the admin process for booking appointments, addiional support to triage, rubust management of unplanned leave and introduction of text reminders. In West Sussex, a local demand and capacity group has been established to develop analysis and actions that underpin patient flow in the community. The analysis has highlighted high referral rates in specific practices, issues relating to the shortage of third section provison in North West Sussex which is having a direct impact on the patient pathway in the area. There are particular groups of patients in the area where movement through the pathway is an issue. These include patients who have a full package of care with West Sussex County Council, patients on anti psychotic medication who attend deop clinics for medication including closapine and patients with ADHD who are subject to shared care arrangements. The local action plan for West Sussex remains under development. The Trust has recruited senior analytical capacity that started at the beginning of January. They will support the demand and capacity work under the leadership of the community workstream of the clinical strategy. 600 LPL, 704 Apr 15 May 15 Jun 15 Jul 15 Aug 15 Sep 15 Oct 15 Nov 15 Dec 15 Jan 16 Feb 16 Mar 16 Apr 16 May 16 Jun 16 Jul 16 Aug 16 Sep 16 Oct 16 Nov 16 Dec 16 Jan 17 Feb 17 Mar 17 Apr 17 May 17 Jun 17 Jul 17 Aug 17 Sep 17 Oct 17 Nov 17 Dec 17 Jan 18 Feb 18 Mar 18 Apr 18 May 18 Jun 18 Jul 18 Aug 18 Sep 18 Oct 18 Nov 18 Dec 18 Key to Statistical process control charts: Target Special Cause Variation Improvement (7 or more points better than the mean, or a single point outside the control limit) Mean Special Cause Variation Concern (7 or more points worse than the mean, or a single point outside the control limit) Upper / Lower Process Control Limits (UPL/LPL) Common Cause Variation 10 of 17
158 Reporting Month: Dec 18 Quality Indicators Responsive 100% 95% 90% 85% 80% 75% Mean, UPL, 98.3% Mean, 91.3% LPL, 84.4% Routine Assessment Waits < 4 Weeks Sussex CAMHS Apr 15 May 15 Jun 15 Jul 15 Aug 15 Sep 15 Oct 15 Nov 15 Dec 15 Jan 16 Feb 16 Mar 16 Apr 16 May 16 Jun 16 Jul 16 Aug 16 Sep 16 Oct 16 Nov 16 Dec 16 Jan 17 Feb 17 Mar 17 Apr 17 May 17 Jun 17 Jul 17 Aug 17 Sep 17 Oct 17 Nov 17 Dec 17 Jan 18 Feb 18 Mar 18 Apr 18 May 18 Jun 18 Jul 18 Aug 18 Sep 18 Oct 18 Nov 18 Dec % 90% 80% 70% 60% UPL, 49.5% 50% 40% Mean, 38.9% 30% LPL, 28.2% 20% UPL, 447 LPL, 226 Apr 15 May Jun 15 Jul 15 Aug Sep 15 Oct 15 Nov Dec 15 Jan 16 Feb 16 Mar Apr 16 May Jun 16 Jul 16 Aug Sep 16 Oct 16 Nov Dec 16 Jan 17 Feb 17 Mar Apr 17 May Jun 17 Jul 17 Aug Sep 17 Oct 17 Nov Dec 17 Jan 18 Feb 18 Mar Apr 18 May Jun 18 Jul 18 Aug Sep 18 Oct 18 Nov Dec 18 Routine Assessment Waits < 4 weeks Hampshire CAMHS Apr 15 May 15 Jun 15 Jul 15 Aug 15 Sep 15 Oct 15 Nov 15 Dec 15 Jan 16 Feb 16 Mar 16 Apr 16 May 16 Jun 16 Jul 16 Aug 16 Sep 16 Oct 16 Nov 16 Dec 16 Jan 17 Feb 17 Mar 17 Apr 17 May 17 Jun 17 Jul 17 Aug 17 Sep 17 Oct 17 Nov 17 Dec 17 Jan 18 Feb 18 Mar 18 Apr 18 May 18 Jun 18 Jul 18 Aug 18 Sep 18 Oct 18 Nov 18 Dec 18 UPL, 375 Mean, 295 LPL, 216 Total Routine Assessments Sussex CAMHS Total Routine Assessments Hampshire CAMHS Apr 15 May Jun 15 Jul 15 Aug 15 Sep 15 Oct 15 Nov Dec 15 Jan 16 Feb 16 Mar Apr 16 May Jun 16 Jul 16 Aug 16 Sep 16 Oct 16 Nov Dec 16 Jan 17 Feb 17 Mar Apr 17 May Jun 17 Jul 17 Aug 17 Sep 17 Oct 17 Nov Dec 17 Jan 18 Feb 18 Mar Apr 18 May Jun 18 Jul 18 Aug 18 Sep 18 Oct 18 Nov Dec 18 The SPC chart for 4 week waits Sussex CAMHS indicates that there has been a period of special cause variation (concern) or deterioration since November However the chart "total routine assessments Sussex CAMHS" shows that there the number of routine assessments exibits common cause variation and has not declined away from the mean of 336 per month. Further analysis is warranted to clarify the reason or reasons for the decline in performance over this period. The Brighton team has the largest number of breaches due to the provider of the front door. The new service model was predicated on a caseload of 600. A diagnostic paper about the waiting list was presented to Commissioners in early January. Conversations are ongoing. The SPC chart for 4 week routine waiting times for Hampshire shows the the response time has been in a period of special cause variation (concern) since January The following chart "total routine assessments Hampshire CAMHS" shows that there have been periods of common cause and special cause variation in relation to the numbers of assessments carried out each month by the service. Hampshire have agreed a joint action plan through a newly established improvement board which includes a peer review to look at model assumptions and look at quality service delivery. The CCG have requested moving staff to Winchester/ Test Valley and this will be jointly quality impact assessed on The CDS Leads have met with clinical leads in West Hants CCG in January and the Winchester/ Test Valley Plan is part of a QI project. The service is maintaining its focus on the reduction of numbers waiting and maintaining the slowing of waiting list increases. NHSI Single Oversight Framework Indicator Key to Statistical process control charts: Target Special Cause Variation Improvement (7 or more points better than the mean, or a single point outside the control limit) Mean Special Cause Variation Concern (7 or more points worse than the mean, or a single point outside the control limit) Upper / Lower Process Control Limits (UPL/LPL) Common Cause Variation 11 of 17
159 Reporting Month: Dec 18 Quality Indicators Responsive 120% 110% 100% 90% 80% 70% 60% 50% 40% 100% 80% 60% 40% 100% 90% 80% 70% 60% 50% 102% 100% 98% 96% 94% 92% UPL, 109.6% Mean, 84.9% LPL, 60.2% EIP 2 Week to Treatment Jan 16 Feb 16 Mar 16 Apr 16 May Jun 16 Jul 16 Aug 16 Sep 16 Oct 16 Nov 16 Dec 16 Jan 17 Feb 17 Mar 17 Apr 17 May Jun 17 Jul 17 Aug 17 Sep 17 Oct 17 Nov 17 Dec 17 Jan 18 Feb 18 Mar 18 Apr 18 May Jun 18 Jul 18 Aug 18 Sep 18 Oct 18 Nov 18 Dec 18 IAPT 6 week waits Mean, 89.2% UPL, 93.0% LPL, 85.4% Apr 15 Jun 15 Aug 15 Oct 15 Dec 15 Feb 16 Apr 16 Jun 16 Aug 16 Oct 16 Dec 16 Feb 17 Apr 17 Jun 17 Aug 17 Oct 17 Dec 17 Feb 18 Apr 18 Jun 18 Aug 18 Oct 18 Dec 18 IAPT 18 week waits Mean, 99.7% National Benchmarking: EIP 2 Week Dec 15 Jan 16 Feb 16 Mar 16 Apr 16 May 16 Jun 16 Jul 16 Aug 16 Sep 16 Oct 16 Nov 16 Dec 16 Jan 17 Feb 17 Mar 17 Apr 17 May 17 Jun 17 Jul 17 Aug 17 Sep 17 Oct 17 Nov 17 Dec 17 Jan 18 Feb 18 Mar 18 Apr 18 May 18 Jun 18 Jul 18 Aug 18 UPL, 100.4% LPL, 98.9% 99.7% SPFT National Mean National Benchmarking 6 Wk Waits Q SPFT Regional STPs National Average 85% National Benchmarking 18 Wk Waits Q SPFT Regional STPs 99% 89% 90% 100% TARGET: 50% The SPC Chart for EIP 2 weeks to treatment Indicates that the level of variation in the process is of common cause, except for the period between April 2017 and October 2017 where a period of special cause variation improvement was indicated. Given that the lower process limit is 60.2%, the mean is 84.9% and the target is 53%, it is likely that the service will continue to acheive the 2 week waiting times target. The benchmarking information indicates that the Trust is consistently performing in the upper quartile. TARGET: 75% 6 Weeks; 95% 18 Weeks The IAPT SPC charts indicate that the service is operating within a narrow variance for both targets, and performing consistently above the target. The IAPT SPC chart for 6 week wait shows that, since December 2016 the service has been operating about a mean of 89.2% and a lower limit of 85.4% against a target of 75%. There was also a period of special cause improvement between August 2017 and April The IAPT SPC chart for 18 week waits shows that since December 2016 there service has been operating to a mean 99.7% and a lower process limit of 98.9% against a target of 95%. The process exhibits common cause variation during this period. NHSI Single Oversight Framework Indicator NHSI Single Oversight Framework Indicator 90% Apr 15 Jun 15 Aug 15 Oct 15 Dec 15 Feb 16 Apr 16 Jun 16 Aug 16 Oct 16 Dec 16 Feb 17 Apr 17 Jun 17 Aug 17 Oct 17 Dec 17 Feb 18 Apr 18 Jun 18 Aug 18 Oct 18 Dec 18 National Average 99% Key to Statistical process control charts: Target Special Cause Variation Improvement (7 or more points better than the mean, or a single point outside the control limit) Mean Special Cause Variation Concern (7 or more points worse than the mean, or a single point outside the control limit) Upper / Lower Process Control Limits (UPL/LPL) Common Cause Variation 12 of 17
160 Reporting Month: Dec 18 Quality Indicators Responsive 12% 10% 8% 6% 4% 2% 0% Mean, 6.9% LPL, 4.7% UPL, 9.1% Apr 15 May 15 Jun 15 Jul 15 Aug 15 Sep 15 Oct 15 Nov 15 Dec 15 Jan 16 Feb 16 Mar 16 Apr 16 May 16 Jun 16 Jul 16 Aug 16 Sep 16 Oct 16 Nov 16 Dec 16 Jan 17 Feb 17 Mar 17 Apr 17 May 17 Jun 17 Jul 17 Aug 17 Sep 17 Oct 17 Nov 17 Dec 17 Jan 18 Feb 18 Mar 18 Apr 18 May 18 Jun 18 Jul 18 Aug 18 Sep 18 Oct 18 Nov 18 Dec 18 ADULT SERVICES TOTAL East Sussex CDS Brighton & Hove CDS North West Sussex CDS Coastal West Sussex CDS Forensic Healthcare CDS Learning Disabilities CDS Delayed Transfers of Care Last 6 months DToC as a proportion by reason code (Adult CDS only) A Awaiting Completion of Assessment B Awaiting Public Funding C Awaiting Further NHS Care Di Awaiting Residential Home Placement or Availability Dii Awaiting Nursing Home Placement or Availability E Awaiting Care Package in Own Home F Awaiting Community Equipment and Adaptations G Patient or Family Choice H Disputes SSD I Housing O Other % DTCs by CDS latest 3 months 2.7% 4.4% % DTCs by CDS latest 3 months TRUST TOTAL ChYPS CDS 0.0% 5.9% 0.9% 6.5% 7.9% 9.7% NHS SSD Both 73.1% East Sussex CDS Brighton & Hove CDS North West Sussex CDS Coastal West Sussex CDS Forensic Healthcare CDS Learning Disabilities CDS Days Delayed by CDS latest 3 months Days Delayed by CDS latest 3 months ChYPS CDS The SPC Chart indicates a period of special cause concern from September 17, until May From June 2018, the process is showing special cause improvement. The Trust has been working towards achieving 3.5% for Adult, older people and rehab acute mental health services by the end of March The charts also show the key reasons for delayed transfers of care over the last 6 months, the availability of residential home placements and housing having the greatest impact on the days patients are delayed in hospital. Over the last 6 month, the highest number of days delayed has been in Coastal West Sussex. A weekly Executive level system call is being used fortnightly to identify what support and actions all partners can take to expedite this process. Operational system calls are also taking place twice weekly. These have focused attention on all delayed transfers of care within the trust s dementia, adult acute and rehabilitation wards. West Sussex CDS have been asked to review the process of escalation given the number of patients days delayed in the CDS. A series of high impact actions have been agreed with the wider system and a comprehensive action plan developed. We are mapping performance against high impact actions to ensure a meaningful trajectory. Key actions include: 1) A multi agency STP discharge policy is being developed 2) A "Lets get you home policy" is being developed 3) A Clinically led bed management team is being introduced 4) Review of social worker resources 5) STP Mental Health Delivery Plan review of accommodation and housing strategies 6) Review of SPFT discharge resources 7) SPFT attendance and engagement in local systems and escalation calls to ensure access to spot purchasing and funding for Mental Health without prejudice Internally, progress has been made towards capturing delayed transfers of care on the electronic systems. Once fully implemented, this will remove the need for time consuming manual processes and enable to delivery of automated daily reporting which will enable actions to be more responsive. Key to Statistical process control charts: Target Special Cause Variation Improvement (7 or more points better than the mean, or a single point outside the control limit) Mean Special Cause Variation Concern (7 or more points worse than the mean, or a single point outside the control limit) Upper / Lower Process Control Limits (UPL/LPL) Common Cause Variation 13 of 17
161 Reporting Month: Dec 18 Quality Indicators 100% UPL, 96.2% Friends & Family Positive Response Rate The SPC chart for friends and family indicates common cause variation since May The Trust is reporting an average of 78% positive response rates over the period. 90% Mean, 84.1% 80% 70% LPL, 71.9% 60% Apr 15 May 15 Jun 15 Jul 15 Aug 15 Sep 15 Oct 15 Nov 15 Dec 15 Jan 16 Feb 16 Mar 16 Apr 16 May 16 Jun 16 Jul 16 Aug 16 Sep 16 Oct 16 Nov 16 Dec 16 Jan 17 Feb 17 Mar 17 Apr 17 May 17 Jun 17 Jul 17 Aug 17 Sep 17 Oct 17 Nov 17 Dec 17 Jan 18 Feb 18 Mar 18 Apr 18 May 18 Jun 18 Jul 18 Aug 18 Sep 18 Oct 18 Nov 18 Dec 18 Positive response rate by CDS latest 3 months Positive response rate by CDS latest 3 months TRUST TOTAL East Sussex CDS 84.1% 81.1% TRUST TOTAL Forensic Healthcare CDS 84.1% 87.5% Brighton & Hove CDS 90.4% Learning Disabilities CDS 100.0% Caring 2% 1% 0% North West Sussex CDS Coastal West Sussex CDS Feb % 83.9% ChYPS CDS Primary Care & Wellbeing 72.7% Friends & Family Responses as a proportion of patients accessing services Mar 18 Apr 18 May 18 Response rate by CDS latest 3 months TRUST TOTAL East Sussex CDS 1.0% 1.4% Jun 18 Jul 18 Aug 18 Sep 18 Oct 18 Nov 18 Response rate by CDS latest 3 months TRUST TOTAL Forensic Healthcare CDS 1.0% Dec % 100.0% The Trust has agreed an improvement target for response rates for friends and family, due to the Trust reporting below average response rates, compared to the national benchmark. There are insufficient data points to prepare an SPC chart at this stage. NHSI Single Oversight Framework Indicator Brighton & Hove CDS 0.8% Learning Disabilities CDS 0.5% North West Sussex CDS Coastal West Sussex CDS 0.9% 2.3% ChYPS CDS Primary Care & Wellbeing CDS 0.1% 0.8% Key to Statistical process control charts: Target Special Cause Variation Improvement (7 or more points better than the mean, or a single point outside the control limit) Mean Special Cause Variation Concern (7 or more points worse than the mean, or a single point outside the control limit) Upper / Lower Process Control Limits (UPL/LPL) Common Cause Variation 14 of 17
162 Reporting Month: Dec 18 Quality Indicators UPL, 103 Mean, 73 LPL, 43 Complaints Received Apr 15 May 15 Jun 15 Jul 15 Aug 15 Sep 15 Oct 15 Nov 15 Dec 15 Jan 16 Feb 16 Mar 16 Apr 16 May 16 Jun 16 Jul 16 Aug 16 Sep 16 Oct 16 Nov 16 Dec 16 Jan 17 Feb 17 Mar 17 Apr 17 May 17 Jun 17 Jul 17 Aug 17 Sep 17 Oct 17 Nov 17 Dec 17 Jan 18 Feb 18 Mar 18 Apr 18 May 18 Jun 18 Jul 18 Aug 18 Sep 18 Oct 18 Nov 18 Dec 18 TARGET Response rate: 85% The SPC chart indicates that there is a period of special cause variation (concern) from January 2018 to October 2018 in relation to the number of complaints received and from February for the response rates. The number of complaints received has reduced in the month to 63. The key themes for complaints are communication, values and behaviours of staff and patient care. Learning from complaints is incorporated into our learning lessons forums and included in the quarterly Quality and Safety report. Complaints training has been planned for January to March 2019 which will focus on high quality responses and how the process of responding to concerns and complaints can be improved. Caring Complaint themes last 3 months Admissions/Discharges/Transfers Waiting Times Appointment Delays/Cancellations Access To Treatment Or Drugs Prescribing Errors Clinical Treatment Patient Care Privacy, Wellbeing & Dignity Values & Behaviour (Staff) Trust Admin/Policies/Procedures Communications Facilities Services Transport (Ambulance Only) Staffing Numbers Restraint Consent Commissioning Services Other Complaints Responded to on time by CDS latest 3 months TRUST TOTAL Carehome Plus CDS Forensic Healthcare CDS Learning Disabilities CDS ChYPS CDS Primary Care & Wellbeing CDS East Sussex CDS Brighton & Hove CDS North West Sussex CDS Coastal West Sussex CDS #N/A 35.7% 50.0% 51.1% 62.7% 66.7% 68.8% 65.6% 80.6% 100.0% Learning from complaints is incorporated into our learning lessons forums and a complaints scrutiny group is led by Sam Allen CEO The complaints response rates have followed special cause variation (concern) since January, at under the target levels. The drop in response rates is due to a significant improvement in the proactive management of overdue complaints as the response delays are calculated at the point of closure. This has been actioned by a redesign in complaints process, allocation of Complaints Lead per CDS and daily team meetings. The Complaints team continues to proactively work with the CDS s to ensure a timely response to complaints is achieved 100% 90% 80% 70% UPL, 93.4% Mean, 75.8% Complaints responded to within agreed timescale 60% 50% LPL, 58.2% Apr 15 May 15 Jun 15 Jul 15 Aug 15 Sep 15 Oct 15 Nov 15 Dec 15 Jan 16 Feb 16 Mar 16 Apr 16 May 16 Jun 16 Jul 16 Aug 16 Sep 16 Oct 16 Nov 16 Dec 16 Jan 17 Feb 17 Mar 17 Apr 17 May 17 Jun 17 Jul 17 Aug 17 Sep 17 Oct 17 Nov 17 Dec 17 Jan 18 Feb 18 Mar 18 Apr 18 May 18 Jun 18 Jul 18 Aug 18 Sep 18 Oct 18 Nov 18 Dec 18 Key to Statistical process control charts: Target Special Cause Variation Improvement (7 or more points better than the mean, or a single point outside the control limit) Mean Special Cause Variation Concern (7 or more points worse than the mean, or a single point outside the control limit) Upper / Lower Process Control Limits (UPL/LPL) Common Cause Variation 15 of 17
163 Reporting Month: Dec 18 Quality Indicators 6% 5% UPL, 5.1% Mean, 4.4% Sickness Absence TARGET: 3.5% Sickness absence has been consistently over the Trust target. The chart indicates common cause variation at 4.6% in the month. However it should be noted that the Trust mean is below the National Average sickness rate for Mental Health Trusts for 17/18 which is 4.81% Well Led 4% 3% Mar % 90% 80% 70% 60% 50% 40% 30% 20% 10% 0% LPL, 3.7% May 15 Jul 15 Sep 15 Nov 15 Jan 16 Mar 16 May 16 Sickness rate by CDS latest 3 months TRUST TOTAL East Sussex CDS Brighton & Hove CDS North West Sussex CDS Coastal West Sussex CDS Apr 18 May 18 Jun 18 Jul 18 Jul 16 Sep % 6.2% 5.5% 5.3% 5.4% Aug 18 Nov 16 Sep 18 Jan 17 Mar 17 May 17 Jul 17 Sep 17 TRUST TOTAL Carehome Plus CDS Forensic Healthcare CDS Learning Disabilities CDS ChYPS CDS Primary Care & Wellbeing Staff Appraisals Oct 18 Nov % Jan 18 Mar 18 May 18 Sickness rate by CDS latest 3 months Nov 18 Dec 18 Jan 19 Feb 19 Jul 18 Sep % 4.3% 4.2% 4.2% 4.6% Mar 19 Nov 18 HR continue to work in partnership with CDS management to reduce sickness absence and tackle the causes, particularly in those areas showing the highest levels of sickness which this month include Brighton and Hove CDS, North West Sussex, Forensic Healthcare and Learning Disabilities. Additional interventions to tackle sickness in these areas, include regular Health and Wellbeing events for staff; planned team away days; improvements in the working environment in response to staff survey feedback; earlier intervention by occupational health; resilience management and flexing the HR adviser support to target services within CDS s with high rates of sickness. An SPC chart for staff appraisals has not been completed as there is insufficient historic data available. The Trust currently reporting 55% of staff with an appraisal through the MyLearning system. The supervision policy has been amended with clear guidance on how to record supervision on MyLearning and the standards for completion. A letter has been sent to all staff from the Executive Professional leads and the Chief Officer Operator. This reminds staff of their responsibility to evidence supervision. Reported supervision and appraisal rates captured through My Learning continue to be reviewed. The evidence presented during the Quality and Safety Reviews indicates a much higher rate of compliance and an established culture of supervision. Appraisals compliance by CDS Current Month TRUST TOTAL 54.9% East Sussex CDS 63.7% Brighton & Hove CDS 51.1% North West Sussex CDS 44.3% Coastal West Sussex CDS 56.4% Appraisals compliance by CDS Current Month TRUST TOTAL Forensic Healthcare CDS Learning Disabilities CDS ChYPS CDS Primary Care & Wellbeing CDS New reporting is being tested to provide accessible reporting to teams in relation to appraisals and supervision. Key to Statistical process control charts: Target Special Cause Variation Improvement (7 or more points better than the mean, or a single point outside the control limit) Mean Special Cause Variation Concern (7 or more points worse than the mean, or a single point outside the control limit) Upper / Lower Process Control Limits (UPL/LPL) Common Cause Variation 16 of 17
164 Reporting Month: Dec 18 Quality Indicators Well Led 12% 10% '000s '000s 8% 6% 4% 2% 0% UPL, 8.2% Mean, 6.0% LPL, 3.8% Agency Cost as a Proportion of Paybill Apr 15 May 15 Jun 15 Jul 15 Aug 15 Sep 15 Oct 15 Nov 15 Dec 15 Jan 16 Feb 16 Mar 16 Apr 16 May 16 Jun 16 Jul 16 Aug 16 Sep 16 Oct 16 Nov 16 Dec 16 Jan 17 Feb 17 Mar 17 Apr 17 May 17 Jun 17 Jul 17 Aug 17 Sep 17 Oct 17 Nov 17 Dec 17 Jan 18 Feb 18 Mar 18 Apr 18 May 18 Jun 18 Jul 18 Aug 18 Sep 18 Oct 18 Nov 18 Dec 18 Primary Care & Wellbeing CDS 1,400 1,200 1,000 Forensic Healthcare CDS Learning Disabilities CDS Coastal West Sussex CDS Agency Cost as % Paybill by CDS latest 3 months TRUST TOTAL Carehome Plus CDS ChYPS CDS East Sussex CDS Brighton & Hove CDS North West Sussex CDS Apr 17 Apr 17 UPL, 1111 Mean, 816 LPL, 521 Jun 17 UPL, 634 Mean, 339 LPL, 45 Jun % 3.8% 2.6% 2.2% 2.2% 3.1% 3.0% 7.8% 5.1% Agency Total Spend Aug 17 Oct 17 Dec 17 Feb 18 Apr 18 Agency Qualified Nursing Aug 17 Oct 17 Dec 17 Feb 18 Apr 18 Jun 18 Jun 18 Aug 18 Aug 18 Oct 18 Oct % Dec 18 Dec 18 '000s '000s Total Agency Spend by CDS ( '000) latest 3 months Carehome Plus CDS Forensic Healthcare CDS Learning Disabilities CDS ChYPS CDS Primary Care & Wellbeing CDS East Sussex CDS Brighton & Hove CDS North West Sussex CDS Coastal West Sussex CDS UPL, 606 Mean, 312 Apr 17 LPL, 17 Jun 17 Aug 17 Oct 17 0 Dec Feb Agency Medical Apr Jun 18 Agency Unqualified Nursing UPL, 405 Mean, 110 Apr 17 LPL, 185 Jun 17 Aug 17 Oct 17 Dec 17 Feb 18 Apr 18 Jun Aug 18 Aug 18 Oct 18 Oct Dec 18 Dec 18 TARGET: 3.5% The SPC chart for Agency expenditure indicates that the Trust has had a recent period of special cause variation (improvement) sinnce November Over the last two years steady progress has been made to reduce the use of agency staff, from 12.9m in 2016/17, to 10.9m in 2017/18 (a monthly average of 916k). In 2018/19 the year to date average monthly spend is 669k. However, there has been a significant improvement over the last three months with agency spend between 505k and 554k a month which is around the Agency Ceiling set by NHSI. Year to date agency spend is 6,021k, which is 22.6% over the agency ceiling (improving the rating to 2). The main areas contributing to the year to date position are: Coastal West Sussex 1,700k North West Sussex 1,015k Lindridge Nursing Home 916k Good progress is being made to reduce the use of agency staff. The Trust was set an Agency Ceiling of 6,546k by NHSI for 2018/19. However given the previous use of agency the Trust set itself an annual plan of 7,735k. Based on the current forecast the agency spend is estimated to be in line with the plan. Actions being undertaken to meet the plan are set out below: Medical Agency Investment in the Medical Staffing Team Regular slots for consultant interviews and steady stream of candidates and appointments made Escalation process to Chief Medical Officer and Chief Executive when hourly agency rate exceeds the agency pay cap Monthly report on use of agency doctors by service and providing details of each agency doctor and cost Nurse Agency Continued focus on nurse recruitment Investment in the recruitment and bank teams Recruitment to nurse bank Roster management with roster surgeries Weekly agency reports Chief Nurse review of ward establishments. NHSI Single Oversight Framework Indicator Key to Statistical process control charts: Target Special Cause Variation Improvement (7 or more points better than the mean, or a single point outside the control limit) Mean Special Cause Variation Concern (7 or more points worse than the mean, or a single point outside the control limit) Upper / Lower Process Control Limits (UPL/LPL) Common Cause Variation 17 of 17
165 Report to Board of Directors Agenda item TBP03.4/19 Attachment H EHRIA code N/A Date of meeting 30 January 2019 Format of Paper Title of paper Safe Staffing Exception Report 6 month update Written Author Lindy Montandon Lead Nurse for Safer Staffing (erostering) Oral Presenter Acosia Nyanin, Chief Nurse Presentation Committees/meetings where this item has been considered Safety Committee Purpose of report (tick all that apply) To provide assurance For decision Regulatory requirement To highlight an emerging risk or issue To canvas opinion For information To highlight patient, carer or staff experience Strategic Goals (tick all that relate) 1. Safe, effective, quality patient care 2. Local, joined up care 3. Put research, innovation and learning into practice 4. Be the provider, employer and partner of choice 5. Living within our means Summary of Report This paper provides an overview of the Safer Staffing Level reported by the Trust between June and November It shows the Trust s average overall fill rate for both qualified and nonqualified nurses over the previous six months (June to November 2018). It provides data and analysis relating to vacancies, particularly on qualified nurses, and the challenges to recruit and retain nurses; an issue not unique to SPFT, but national. It also includes update on bank/agency usage, and recruitment and retention. Overall this report provides assurance to the Trust Board that any exceptions were managed and safety maintained on the inpatient wards. Recommendation The Board of Directors is asked to receive the paper for information and note exception reporting for June to November Page 1 of 10
166 1. INTRODUCTION All trusts are required to publish their monthly staffing level information on the NHS Choices, UNIFY2 and Sussex Partnership s internal internet from April 2014 in order to provide greater transparency and openness. This report includes safe staffing levels in all the 37 inpatient wards across the Trust between June and August One exception is Burrowes ward, (mixed dementia ward in Worthing) has been closed from 1 September for refurbishments. It is due to be reopened by early autumn The trust continues to be able to maintain a safe level of staffing, in relation to HCA (Health Care Assistant), however we are still facing challenges to meet the RMN (Registered Mental Nurse) fill rate in some wards. The wards compensate any unfilled RMN shifts by utilising experienced HCAs who are familiar with the wards and patients. The ward managers are also included in the numbers to maintain safety, provide leadership and are actively involved in face to face patient care. The wards monitor continuously safe staffing levels, and seek to address and manage any problems identified immediately. In addition, an update on the vacancies, starters, recruitment and retention is provided. There are no recommended changes to the current inpatient staffing establishment at this time. 2. REPORT 2.1 The Trust Average Fill Rate Chart 1 Average Overall fill rate 108% Average Overall Fill rate 107% 106% 104% 102% 100% 98% 103% 100% 100% 102% 103% 104% 100% 104% 104% 96% Chart 1 shows that in the last six months, the Trust is compliant with the overall fill rate (a combination of Qualified and HCA) and averaged around 103%. Page 2 of 10
167 Apr-16 May-16 Jun-16 Jul-16 Aug-16 Sep-16 Oct-16 Nov-16 Dec-16 Jan-17 Feb-17 Mar-17 Apr-17 May-17 Jun-17 Jul-17 Aug-17 Sep-17 Oct-17 Nov-17 Dec-17 Jan-18 Feb-18 Mar-18 Apr-18 May-18 Jun-18 Jul-18 Aug-18 Sep-18 Oct-18 Nov-18 Chart 2 Average HCA Fill Rate 120% Average HCA Fill Rate 119% 118% 116% 114% 112% 112% 112% 113% 112% 110% 108% 110% 110% 111% 106% 104% 102% Chart 2 shows the average fill rate for HCA exceeds the compliance rate of 100%, and averaged from 110% to 113% in the last six months. A combination of factors account for the high usage of HCA, to cover outstanding qualified shifts, acuity of the ward and patients care such as enhanced observation and escorts. Chart 3 RMN Fill Rate Safer Staffing - Fill Rate RMN 100% UPL, 96.7% 96.0% 95% 92.0% 93.0% 90% Mean, 92% 90.0% 92.0% 85% 87.0% 80% Chart 3 indicates the fill rate for RMNs across the wards ranged between 87% (Aug) and 96% (Nov). The rise in the fill rate between September and November are attributed to the recruitment of 49 newly qualified nurses, which accounts for 25% of the Trust nursing vacancies. The full details of each ward fill rate will be published in our Trust s website under Safe staffing Sussex Partnership NHS Foundation Trust CHPPD Care hours per patient day Following Lord Carter s review of efficiency/productivity within NHS Mental Health Services commissioned by the NHS Improvement, SPFT was part of a cohort of 24 trusts which participated in the Mental Health and Community e-rostering improvement collaborative in June One of the key elements was improving productivity and efficiency of e-rostering and the development of CHPPD. As such, from April 2018 all mental health trusts are required to collect monthly CHPPD for their inpatient wards. To calculate CHPPD, the monthly returns for safe staffing and the daily patient count at midnight (total number of patients on the ward at 23.59) are aggregated for the month. And the total hours Page 3 of 10
168 worked by both registered nurses and support staff are divided by the total for the month (logged daily) will give the CHPPD rate. It is essential to note that by itself, CHPPD does not reflect the total amount of care provided on a ward nor does it show directly whether care is safe, effective or responsive. Therefore it should be considered alongside measures of quality and safety. In order to recognise the multidisciplinary contribution to care, commencing December, NHSI has requested all mental health and community trusts to report all professionals rostered within the inpatient wards. Therefore from November, the return for the monthly fill rate or CHPPD includes all rostered AHP (Allied Health Professional). The aim is to enable wards of similar size, speciality and patient group to be benchmarked nationally. NHS Improvement has indicated they will advise on the best practice ranges early in The SPFT CHPPD data can be accessed here. 2.2 Vacancies Chart 4 Qualified WTE Vacancies (excluding Headroom 25%) Chart RMN WTE Actual Vacancies Jul-17 Aug-17 Sep-17 Oct-17 Nov-17 Dec-17 Jan-18 Feb-18 Mar-18 Apr-18 May-18 Jun-18 Jul-18 Aug-18 Sep-18 Oct-18 Nov-18 Chart 4 indicates the progress made by our trust recruitment strategy looking at the vacancy rate for this year (July to November) compared to same last year. 2.3 Recruitment and Retention It is vital that we recruit the right staff, with the appropriate skills to our nursing posts. However recruitment to qualified nursing posts is not solely a SPFT s challenge, it is a national and global issue. There is current concern that the impact and uncertainty of Brexit, is having an impact on recruitment from the EU and those who are working here. Recent changes in education commissioning are illustrating that there is a drop in the applications to Nursing courses in Universities. In addition, NHS Digital has evidenced that increasing numbers of nurses are leaving the profession in recent years. It is crucial that part of our recruitment strategy looks at how we grow our own nurses. As such the trust has seconded staff to do the Open University Mental Health nursing course (see 2.3.1) as well as Nursing Associates course (see 2.3.2) with the University of Brighton. Between September 18 and January 2019, we had 23 RMNs and 38 newly qualified nurses have started or are due to start with the trust. In terms of retention, we had 17% less qualified nurses leaving between June and November this year (25), compared to same period last year (30). The Recruitment Strategy continues with senior nursing staff attending career fairs and meeting with mental health students in Universities throughout the UK as follows: Page 4 of 10
169 3 rd September at Brighton University (3 rd Year Students) 15 th September at Eastbourne AGM 25 th September at Crawley Careers Fair 3 rd October at University of Surrey (2 nd and 3 rd Years Students) 3 rd October at UEA Norwich 17 th October at University of Cumbria (Lancaster) 26 th October at Queen University Belfast 31 st October at UWL Brentford 1 st November at Southampton University 6 th November at Canterbury Christchurch 7 th November Brighton & Sussex University 7 th November UWL Reading 14 th November at Brighton University Two further events have been booked for January and April Open University Students The first cohort of 14 health care assistants started their Mental Health Nursing training in September 2016 with 1 dropout. The second cohort (now transferred to Apprenticeship) of 3 staff started in September This is a 4 year degree distance learning course Trainee Nursing Associates The Nursing Associate role helps address the skill gap between health/care assistants and registered nurses; and in additional supports the current nursing workforce to provide care for our patients. This role provides a progression route into graduate level nursing and is regulated by the NMC (Nursing Midwifery Council). The first cohort started 12 March 2018 with 11 trainees, and the second cohort started 23 September 2018 with 9 trainees. Preparation is in place with University of Brighton for the third cohort in Preceptorship Academy To support safe care, we must ensure we have the right staff with the right skills; particularly with newly qualified nurses. The Preceptorship Academy was launched to provide our nurses with high quality professional training, development and support. First Cohort started in Oct 2017 with 36 newly qualified nurses and 32 completed June Second cohort start in April 2018 with 10 newly qualified nurses and all completed in November Third cohort started in November 2018 with 50 newly qualified nurses and will complete in September The next cohort is expected to start in March 2019 and beside newly qualified nurses, will include AHP (Allied Health Professional), EBE (expert by experience) and RTP (return to Page 5 of 10
170 practice) nurses. 2.4 Updates on Bank recruitment. Between June and November 2018, the bank team recruited 23 RMN Bank workers. 2.5 Temporary staffing usage (Bank and Agency) A total of temporary staffing 286, hrs were booked between June and November Table 1 shows a breakdown of the hours booked for Bank and Agency, Qualified and HCA in each month. Table 1 (hours) Agency June July August September October November Grand Total HCA Qualified Bank HCA Qualified Grand Total Chart 4 Chart 5 Booking Reasons by % No' of Shift Requests Bank Qualified 18% Agency HCA 1% Agency Qualified 14% 2.02% 1.23% 18.53% 2.28% 0.11% 0.01% 0.19% Escorts Enhanced Observations Initiative Maternity Paternity 55.45% 12.24% Phased Return Planned Leave Bank HCA 67% 9.71% 0.85% 0.08% Deep Clean Sickness UP/Special Leave Vacancy Chart 4 shows high usage of Bank HCAs, who were booked to fill any outstanding qualified shifts, as well as for enhanced observation and escort duties. Recruitment for both qualified and healthcare assistant bank workers is ongoing so as to reduce the reliant on agency workers. Chart 5 indicates that vacancies is given as the major reason for booking replacement staff followed by enhanced observations, and planned leave. Effective monitoring of annual leave and efficient use of the roster by ward managers need to Page 6 of 10
, falls,")
 which was a decreased of 13 incidences compared to similar period reported (228 incidences)")


171 ensure that proportionate annual leave allocation supports safer staffing, better care and minimises the use of agency workers. 3. Safety reports Medication Errors and Patient Safety Incidences The following charts show the number of drug errors and patient safety incidences (absence without leave (AWOL), falls, self-harm, violent incident and fatality) by month and CDS. Drug Errors A total of 215 drug errors were recorded in the last six months (June to November 2018) which was a decreased of 13 incidences compared to similar period reported (228 incidences) in Of these 215 drug errors reported, 207 were no harm and 8 were low harm. In August the overall RMN fill rates was 87% with the reported drug errors being lower in this month than September when RMN fill rates were higher at 92%. Patient Safety Incidents A total of 1752 incidences were recorded over the six months (June to November 2018) which saw a decreased of 135 incidences compared to same period in Of these 1752 incidences, 2 were not reported, 1133 reported no harm, 596 reported low harm, 13 moderate harm requiring further investigation, 3 reported severe harm and 5 unexpected deaths. There was not much variation in the number of incidences reported between each month. 4. RMN fill rate by Care Delivery Service (June to November 2018) Fill rates are RAG rated, with >90% rated as green, 80% to 89% as amber and any noncompliance <80% rated as red. The fill rates for RMNs across the wards ranged between 87% (Aug) and 96% (Nov). Page 7 of 10
172 Table 2 illustrate the fill rates for days and Table 3 for nights. Where there were outstanding qualified shifts, these were covered by HCA to ensure safe staffing level is maintained. Detailed performance KPIs dashboard (June to November) for each ward can be access here. 4.1 Qualified Day Fill Rate Table 2 CW Sussex CDS 1 Count of wards with Qualified Day fill rate >80% NW Sussex CDS Brighton & Hove East Sussex CDS Jun-18 Jul-18 Aug-18 ChYPS CDS Sep-18 Learning Oct-18 Forensic Health Nov-18 Costal West CDS Orchard had 2.3 wte (whole time equivalent) vacancies which affected their day fill rate in June and July. Larch was unable to fill their day fill rate in November due to vacancies, high sickness and maternity leave. Joint working has been commenced to ensure that RMN are utilised throughout the 24 hour period as there have been too many RMN allocated to the night shifts. Burrowes has a high vacancy factor (2.42 wte), in additional to annual leave, study leave and sickness rates affecting their day fill rate in July and August. They were closed for refurbishment from 1 September Iris s day fill rate in July was due to vacancies and releasing staff for study days. Although vacancy rate has improved for Grove ward in the last six months, but high levels of sickness, annual leave and study days meant they were unable to comply with their day fill rate. North West CDS Jade s inability to fulfil their day fill rate was affected by a high level of sickness, annual leave and releasing staff for study days throughout the six months. Amber experienced a high level of sickness, annual leave, other absences as well as vacancies (3.53 wte) in August which meant they were not able to comply with the day fill rate. Brighton and Hove CDS Caburn and Regency wards were unable to comply with their day fill rate in August due to a combination of vacancy, annual leave, sickness and other absences. Ward managers worked in the numbers to support staffing levels. East Sussex CDS In November, vacancies, sickness (one RMN on long term sick) and study days attributed to Abbey ward being unable to fulfil their day rate. The ward manager supported the ward by working in the numbers where required. Page 8 of 10
173 FHS (Forensic Healthcare Services) CDS Forensic Healthcare wards have always included a qualified OT in their day numbers which is not reflected in the current fill rate which report on nursing staff only. From November all rostered AHPs are expected to be reported to NHSI monthly CHPPD returns. 4.2 Qualified Night Fill Rate Table 3 Count of wards with Qualified Night fill rate >80% CW Sussex CDS NW Sussex CDS Jun-18 Brighton & Hove CDS Jul-18 East Sussex CDS ChYPS CDS Learning Disabilities CDS Forensic Health Care CDS Aug-18 Sep-18 Oct-18 Nov-18 Coastal West CDS Orchard was affected by vacancies and annual leave to comply with the night fill rate and utilised HCAs for the outstanding qualified shifts. Grove a combination of high sickness rates among the qualified nurses, annual leave and study leave affected their night fill rate throughout June to November. Burrowes was unable to comply with their night fill rate due to vacancy (2.42 wte) and high annual leave allocation to their qualified nurses in August. North West CDS Jade struggled to comply with their night fill rate throughout the last six months due to high sickness and study leave rate. The long term sickness is being managed with the support of HR. Coral faces a challenge to fill their night rate affected by vacancies (2.32 wte), along with high degrees of study and maternity leave between June and November. To ensure the safety of the ward and patients, both wards have utilised HCAs who are familiar with the wards and patients to cover the unfilled qualified shifts. East Sussex CDS A combination of high vacancy, sickness, annual leave and study days affected Bodiam, Abbey and Amberley night fill rates in July, August, October and November. ChYPS CDS Chalkhill was unable to comply with their RMN night fill rates in August due to over allocation of annual leave. The service is monitoring the management of annual leave and is organising training to support relevant staff. FHS CDS Pine and Oak (vacancy 3.04 wte) shift pattern has two RMNs allocated to night shifts but they Page 9 of 10
174 were unable to facilitate the second RMN, they have compensated by utilising HCAs for the unfilled shifts. Hellingly Centre have recruited a Band 6 Duty Senior Nurse (DSN) to cover the second RMN post on Oak ward and are in the process of recruiting another DSN to ensure the 4 wards will have a fifth RMN to cover the ward/s as required. In summary, the wards reporting exception were deemed safe. That said both Jade and Grove wards reported consecutive exception in the last six months, plan is in place to support Jade and Grove wards in term of roster efficiency to improve their qualified fill rate. 3. NEXT STEPS It is evident that vacancies, sickness and proportionate allocation of annual leave continue to impact on some of our inpatient wards RMN fill rate, specifically on night shifts. The interim HR workforce strategy is focusing on the following: Building on our approach to effective recruitment and retention Developing new ways of working to support our current and future workforce Our approach to staff welling Cultivating our desired culture Improving workforce performance and development This will enhance our nursing recruitment and retention strategy, improve management of sickness and staff well-being and support our compliance with the RMN fill rate. Roster efficiency is another factor which affects how the managers plan their safe staffing levels. The contract for our current e-rostering system expires in May 2019 and the Trust has approved the procurement of a new system, Allocate. Allocate is used by over 220 NHS Trusts across the UK and by the medical workforce within this Trust. The new system will be considerably easier to navigate and bring with it many benefits including:- mobile access that enable staff to directly book shifts and annual leave enabling improvements to patient safety improving clinical quality plus safer staffing and patient care. The trust is in the process of identifying a project team to help with the roll out of the new system and is working closely with Allocate to agree a project plan for implementation, including timescales. More detailed update on the system will be cascaded in the New Year. 4. RECOMMENDATION The Trust Board is asked to receive the paper for information and note exception reporting for June to November Page 10 of 10
175 Report to Board of Directors Agenda item TBP 04.1/19 Attachment I EHRIA code Date of meeting 30 January 2019 Format of Paper Title of paper Author Presenter Finance & Investment Committee Summary Sally Flint, Chief Finance Officer and Deputy CEO Martin Richards, Non- Executive Director and Interim Chair of the Finance & Investment Committee Committees/meetings where this item has been considered Purpose of report (tick all that apply) Written Oral Presentation N/A Finance & Investment Committee To provide assurance For decision Regulatory requirement To highlight an emerging risk or issue To canvas opinion For information To highlight patient, carer or staff experience Strategic Goals (tick all that relate) 1. Safe, effective, quality patient care 2. Local, joined up care 3. Put research, innovation and learning into practice 4. Be the provider, employer and partner of choice 5. Living within our means Summary of Report This paper provides a summary of the Finance & Investment Committee meeting held on the 23 rd November The agenda for the meeting covered a number of areas including:- the Month 7 financial position and delivery of the service improvement plan an overview of the financial plan for 2019/20 businesses cases for an e-rostering system and psychiatric decision unit an application for an LED lighting grant from NHS Improvement an update on the Trust s capital programme including an update of the Information Technology Global Digital Exemplar (GDE) Fast Follower Programme. The agenda also included the regular reports on Contracting and Commercial Activities and the annual review of the Committee s terms of reference. Recommendation The Board is asked to note this report. Page 1 of 4
176 1. INTRODUCTION The purpose of the Finance & Investment Committee is to drive excellent financial performance and ensure that the Trust has an investment strategy that supports the business and is financially deliverable. The Committee is responsible for ensuring that robust scrutiny is in place, taking action to commission further work as required in the achievement of this objective. This paper provides a summary of the Finance & Investment Committee meeting held on 23 rd November It should be noted that a summary of the Finance and Investment Committee is reported to the Board on a regular basis and the paper is in the public part of the Board and therefore the paper is available on the Trust s website. It should also be noted that the full minutes of the meeting are circulated to all members of the Board for information. 2. REPORT The November Committee meeting covered a number of areas. A brief summary of the reports discussed is set out below. Month 7 Financial Position The Committee received the financial report for month 7, noting that the Trust reported a surplus in the month of 87k, taking the year to date position to a surplus of 327k, which is 327k under plan. It was noted that following a successful first quarter of the financial year, the second quarter of the year had been more challenging and this continued into October. The main challenges are around the high number of external placements and payment of the Agenda for Change pay award which has not been fully funded. The Committee noted and discussed the key risks to the delivering the Trust s financial plan for 2018/19, as follows:- Use of external placements The Committee discussed the work that was being undertaken on the Patient Flow work stream that has been developed to help reduce pressure on in-patient services, noting that the use of external placements had peaked in October with at one time 27 people placed outside of Sussex. The Committee was informed of the additional measures that were being introduced to reduce the use of external placements, including enhanced clinical bed management and opening additional beds. Use of agency staff The Committee recognised the good progress being made to reduce the use of agency staff, with expenditure in October reducing to 543k. Year to date agency spend is 4,964k, which is 30.0% over the ceiling (compared to 7,640k for same period last year). Overspend on Adult In-patient Services The Committee noted that this was one of the Trust s overarching savings programmes for the year and although good work has been undertaken across a number of areas, considerable overspends are emerging across the wards in the Brighton and Coastal Care Delivery Services. The financial position of Coast West Sussex, Brighton & Hove and the Nursing Home Care Delivery Services The Committee noted that these three Care Delivery Services were significantly overspent at the end of Month 7. The Committee discussed the areas contributing to the Page 2 of 4
177 Forecast overspend and reviewed the actions being taken to address these issues The Committee noted the range of scenarios for the year end forecast as follows:- Best Case Forecast 1,122k surplus Mid Case Forecast 560k surplus Worst Case Forecast Breakeven It was noted that the main risks between the best and worst case forecast are around securing the funding for the Agenda for Changing Pay Deal and use of external placements. It was also noted that the Trust will forego the opportunity to secure an additional 1,771k Provider Sustainability Funding (PSF) if it does not deliver its financial plan for 2018/19. Delivery of the Service Improvement Plan The Committee received and discussed a paper on the delivery of the Service Improvement Plan reporting that year to date 4,872k has been saved against a target of 6,469k, The Committee noted the key reasons for the shortfall and the work that was being undertaken to maximise the savings in order to deliver the financial plan for 2018/19. Review of Business Cases The Committee reviewed two business cases as follows:- E-rostering The Trust is currently using two rostering systems for medical and non-medical staff. As the contract for both systems comes to an end in May 2019, this provides the opportunity for the Trust to procure a new rostering system to cover both groups of staff. On the recommendation of the Operational Management Board the Committee considered and approved the preferred option to procure a single system through the Direct Award Scheme. The Committee supported this approach. Psychiatric Decision Unit (PDU) The Committee discussed the business case to develop a psychiatric decision unit (PDU) in Brighton to help alleviate the pressures on beds. The paper set out the work of the Patient Flow Group that has been reviewing similar models across the country where PDUs have been developed offering extended crisis assessment and an alternative to attendance at A&E to reduce the rate of admissions to in-patient services. The paper included the revenue and capital costs of the development and national examples setting out the evaluation of similar units and their role in the urgent care pathway. The Committee agreed to support the business case. Update on Capital Programme The Committee received an update on the delivery of the 2018/19 capital programme, noting the slow start to the delivery of the programme with only 2m of the 10.7m of the programme delivery year to date. A detailed assessment of the individual schemes had been undertaken and the year end forecast revised to 9m. The Committee had a detailed discussion on two specific areas:- Global Digital Exemplar (GDE) the Committee received an update on the GDE Programme noting that the Trust had been successful in its application to be a GDE Fast Follower to Oxford Health Foundation Trust. The report provided detailed the five workstreams, funding available and the mechanism for drawing down the funding. The Committee noted the report. LED Lighting Grant Funding the Committee were informed that national funding was available to expand the use of LED lighting across the NHS. The Trust s Estates and Facilities team had undertaken a survey to determine the potential scope of LED Page 3 of 4
178 replacement works and the cost of the scheme. The Committee supported the bid for funding noting that if successful the bid would need to be match funded by the Trust. Contracts Update The Committee received an update on the Trust s contracting position, which covered a number of areas including the Sussex contract for Specialist Placements, the s75 contract with West Sussex County Council, the healthcare contract with Lewes Prison, the review of provider to provider contracts and delivery of the Commissioning for Quality and Innovation (CQUIN) programmes for 2018/19. The paper was well received providing an update on a number of areas. Commercial Report The Committee received the Commercial Report which provided an update on current tenders and business development opportunities. The Committee noted that the Trust was still awaiting the outcome of its bid for the Police Custody Liaison and Diversion Service. The Committee were also notified that the procurement process for the West Sussex Integrated Child Psychology Service had commenced and the tender for the Brighton Memory Assessment Service is due out in December. The Committee also noted the Business Case Development tracker. As a post meeting noted, it should be noted that the Trust has been success with its bid to retain the Police Custody Liaison and Diversion Service. Terms of Reference The Committee undertook its annual review of its Terms of Reference and requested that they should reference the requirement to produce a summary of the meeting to the Board and undertake an annual self-assessment review to be included in the Committee s Annual Report. 3. RECOMMENDATION The Board is asked to note this report. 4. NEXT STEPS The next formal Finance & Investment Committee is due to be held on the 25 th January Page 4 of 4
179 Report to Board of Directors Agenda item TBP04.2/19 Attachment J EHRIA code Date of meeting 30 January 2019 Format of Paper Title of paper Finance Report Month 9 Written Author Presenter Sally Flint, Chief Finance Officer and Deputy CEO Sally Flint, Chief Finance Officer and Deputy CEO Committees/meetings where this item has been considered Purpose of report (tick all that apply) Oral Presentation To provide assurance For decision Regulatory requirement To highlight an emerging risk or issue To canvas opinion For information To provide assurance To highlight patient, carer or staff experience Strategic Goals (tick all that relate) 1. Safe, effective, quality patient care 2. Local, joined up care 3. Put research, innovation and learning into practice 4. Be the provider, employer and partner of choice 5. Living within our means Summary of Report The Trust continues to make steady progress to deliver its financial plan for 2018/19; however there was a deterioration in the underlying run rate in December. Nevertheless despite operational pressures, the Trust s year to date position would be in line with plan if the Agenda for Change pay award was fully funded. Overall, the Trust reported a surplus in the month of 46k ( 47k under plan), taking the year to date position to a surplus to 422k ( 419k under plan). The pay award funding shortfall accounts for 46k of the adverse variance in the month and 419k year to date. Other areas of concern affecting the Trust s underlying deficit include:- Use of external placements - 1,430k year to date Use of agency staff - 554k in month and 6,021k year to date (22.6% over the Agency Ceiling). Overspend on Adult in-patient units - 1,458k year to date Under achievement of Service Improvement Savings (SIP) - 1,974k year to date In order for the Trust to deliver its financial plan for 2018/19 it will need to secure full funding for the Agenda for Change pay award and to focus on the areas that are impacting on the underlying run rate. Recommendation N/A The Board is asked to note the performance for Month 9 and note the work that is continuing to ensure that the Trust delivers its Financial Plan for 2018/19. Page 1 of 5
180 1. INTRODUCTION The Finance Report sets out the Trust s financial position for Month OVERVIEW The Trust continues to make steady progress to deliver its financial plan for 2018/19; however there was a deterioration in the underlying run rate in December. Nevertheless despite operational pressures, the Trust s year to date position would be in line with plan if the Agenda for Change pay award was fully funded. Overall, the Trust reported a surplus in the month of 46k ( 47k under plan), taking the year to date position to a surplus to 422k ( 419k under plan). The pay award funding shortfall accounts for 46k of the adverse variance in the month and 419k year to date. In Month 9 there was deterioration in the underlying run rate, reporting an underlying deficit in the month of 544k, compared to the average monthly underlying deficit of 347k to the end of November. The main areas contributing to the underlying deficit in December were Brighton and Hove ( 229k), Coastal West Sussex ( 192k) and the Lindridge Nursing Home ( 165k). Work therefore continues to improve the Trust s underlying run rate by focusing on a number of key areas to ensure that the Trust delivers its financial plan for 2018/19 in order to maximise its opportunity for Provider Sustainability Funding (PSF). Discussions are still ongoing with NHS Improvement to secure full funding the Agenda for Change pay award. 3. KEY RISKS Given the emerging challenges to the financial position, it is important that focused attention is given to the areas that are driving the underlying deficit run rate. The key issues that are contributing to the underlying position and actions being taken to address these are set out below, with more details in the Appendix attached to this report. Pressure on beds, and use of out of area placements. Following the peak in external placements in October ( 354k), additional measures have been put into place including enhanced clinical bed management and opening additional beds which has reduced the use of external beds. Expenditure in December was 140k (November; 192k), with the year to date spend on external placements totalling 1,430k, of which 50% is funded by commissioners. The forecast year end position requires a further reduction in the use of external placements to an average of 6 per day in January, 4 in February and 2 in March. However, the demand in early January is already exceeding this forecast. To ensure a more sustainable position regarding inpatient services the Trust and commissioners have undertaken a joint review of bed capacity. The report is currently being finalised, but indicates that without significant interventions it is likely that the Trust will continue to use external placements. Work is also underway to establish a Psychiatric Decision Unit in Brighton planned to open in 2019/20 to help alleviate system pressures. In addition, the Trust has secured 1.3m additional funding for 2019/20 to support 24/7 crisis teams. The main areas contributing to the year to date position are:- Coastal West Sussex 913k Brighton & Hove 517k Use of agency staff. The Trust continues to make good progress in reducing the use of agency staff. Although, there was a small increase in agency usage in December 554k compared to 505k in November, the monthly run rate continues to be around the Agency Ceiling of 545k a month. Year to date agency spend is 6,021k, which is 22.6% over the ceiling, and has therefore improved the Trust s rating for this metric. The Trust is on track to deliver against its agency plan Page 2 of 5
181 for 2018/19. However, it should be noted that there may be an emerging risk in Children and Young People s Services as difficulties in recruitment to address waiting times may result in the need to use agency staff. The main areas contributing to the year to date position are:- Coastal West Sussex 1,700k North West Sussex 1,015k Lindridge Nursing Home 916k Overspend on in-patient services year to date Adult in-patient services are overspent by 1,458k. This is one of the Trust s overarching savings programmes and good work has been done across a number of areas to reduce the overspend. The Finance Team have recently undertaken a deep dive into the in-patient spend, which has highlighted that 11 wards are contributing to the overspend. The report is being developed further in discussion with the respective Care Delivery Services and will be presented to the Finance & Investment Committee in January. The Trust s Chief Nurse will also be reviewing the establishment of each ward taking account of the bed numbers and acuity. The main areas of overspend are in the following CDSs:- Brighton & Hove 724k Coastal West Sussex 429k Overspend on Support Services as forecast Support Services, including Estates & Facilities have turned around their position and are now reporting a year to date underspend of 137k. Although, performance varies across the services, the underspend on IT and profit arising from an asset disposal means that overall Support Services are expected to deliver within plan. However, focused attention will be given to individual services to ensure that this is achieved. Slippage on service improvement plans (SIP) - 1,974k year to date. The Trust is performing well against the overarching Trust wide cost reduction schemes, but less well in specific schemes in both operational and support services, with the main shortfall in the Coastal Care Delivery Service ( 1,148k). The Trust is currently forecasting that it will deliver 88% of its SIP target, but will have a shortfall of 1,463k against plan at the end of the year. Funding for the Agenda for Change Pay Award - the Trust continues to pursue its 559k shortfall in funding for the Agenda for Change pay award. Further detailed calculations have been submitted to NHSI to support the Trust s request for additional funding and it is understood that a decision will be made after the national reporting of the Month 9 position. Emerging Risks as the Trust moves into the final quarter of the year it has undertaken a stocktake of emerging risks and mitigations as follows:- NHS Property Services increases in rents and service charges are being disputed with NHS Property Services as increases have been invoiced in year without any prior notification East Sussex MSK increase in secondary care activity, however this will be off-set by the inflationary uplift for 2018/19 if agreed by commissioners New Care Models (Forensic Services) although good progress is being made on discharging patients to less restrictive environments, there has been an increase in admissions. Work is underway to improve the interface with prisons and an event is being held with early February with the Ministry of Justice (MoJ) and prison providers to better understand the reason for increased admissions from the prison service. s75 Agreement in West Sussex, discussions continue to reach an agreement on this contract Valuation given the uncertainty over Brexit, it is difficult to predict the impact on property prices Page 3 of 5
182 and therefore the impact on the valuation of the Trust s estate at the end of March and the level of impairment (if any). These risks are currently being quantified and will be tracked in detailed and any concerns discussed with the Finance & Investment Committee and reported to the Board. 4. FORECAST At this stage of the financial year the Trust is still forecasting that it will deliver its annual plan of a surplus of 1,122k, making it eligible for Provider Sustainability Funding (PSF) of 2,084k. Detailed work on the forecast has highlighted a range of scenarios, as follows:- Best Case Forecast 1,122k surplus Mid Case Forecast 560k surplus Worst Case Forecast Breakeven The main risks between the best and worst case forecast are around funding of the Agenda for Changing Pay Award and level underlying deficit driven mainly by use of external placements and overspend on in-patient services. It should be noted that if the Trust is not able to deliver its plan will forego the opportunity to secure an additional 1,771k Provider Sustainability Funding (PSF). 5. OTHER AREAS Capital Programme expenditure against the capital programme stepped up in Month 9 with a spend of 2,205k in month (Month 8, 690k), due to the acquisition of a property in Worthing. The Trust also disposed of a property in the month with disposals proceeds of 750k. Year to date expenditure is now 4,984k, which is 3,026k under plan, with a forecast for the year end of 9m. Cash flow at the end of December the Trust s cash balance was 37.5m which is 0.5m under plan. However, the forecast position of 38.0m is in line with plan. 6. RECOMMENDATION The Board is asked to note the performance for Month 9 and the work that is continuing to ensure that the Trust delivers its Financial Plan for 2018/19. Page 4 of 5
 YTD 22.")
183 Finance Report Month 9 Overall Position Finance & Use of Resources Year to Date Dec 2018 Year End Plan 2018/19 Capital Service Cover Rating 3 2 Liquidity Rating 1 1 I&E Margin Rating 2 1 I & E Margin Variance to Plan Rating 2 1 Agency Spend Rating 2 2 Finance and Use of Resources Metrics Overall Rating 2 1 Workforce Agency Month 9 554k (Month 8 505k) YTD 22.6% Over Ceiling Bank Month 9 1,294k (Month 8 1,259k) Total Temporary Staff Month 9 1,848k 10.9% Month 8 1,764k 10.2% Service Performance Year to Date - December 2018 Variance YTD Over/(Under) Variance 000's % - Brighton Division 1,601 10% - East Division (37) 0% - Coastal Division 2,001 8% - North West Division (84) -1% - Primary Care and Wellbeing (701) -154% - Children & Young Peoples Services (782) -4% - Forensic Healthcare (75) -1% - Learning Disabilities (205) -5% - Nursing Home Services 1,039 99% - MSK (12) -2% - Estates & Facilities 496 4% - Support Services (633) -3% Total 2, % Other Areas Cash 37.5m 0.5m under plan Capital Programme 2,205k spend in the month, YTD spend 4,984k, an underspend of 3,026k. Capital programme forecast 9m, 1.7m under plan due to slippage of GDE IT programme Page 5 of 5
184 '000 KEY FINANCIAL PRESSURES EFFECTING RUN RATE Area Key points and underlying issues Action taken Total Agency Spend Over the last two years steady progress has been made to reduce the use of agency staff, from 12.9m in 2016/17, to 10.9m in 2017/18 (a monthly average of 916k). In 2018/19 the year to date average monthly spend is 669k. However, there has been a significant improvement over the last three months with agency spend between 505k and 554k a month which is around the Agency Ceiling set by NHSI. Year to date agency spend is 6,021k, which is 22.6% over the agency ceiling (improving the rating to 2). The main areas contributing to the year to date position are:- Coastal West Sussex 1,700k North West Sussex 1,015k Lindridge Nursing Home 916k Of the agency spend medical and nursing agency accounts for 43.1% and 51.6% of the expenditure respectively. The trend for agency expenditure for the last 18 months is set out in the chart below. 1,400 1,200 1, Total Agency vs Agency Ceiling Total Agency Agency Ceiling Good progress is being made to reduce the use of agency staff. The Trust was set an Agency Ceiling of 6,546k by NHSI for 2018/19. However given the previous use of agency the Trust set itself an annual plan of 7,735k. Based on the current forecast the agency spend is estimated to be in line with the plan. Actions being undertaken to meet the plan are set out below:- Medical Agency Investment in the Medical Staffing Team Regular slots for consultant interviews and steady stream of candidates and appointments made Escalation process to Chief Medical Officer and Chief Executive when hourly agency rate exceeds the agency pay cap Monthly report on use of agency doctors by service and providing details of each agency doctor and cost Nurse Agency Continued focus on nurse recruitment Investment in the recruitment and bank teams Recruitment to nurse bank Roster management with roster surgeries Weekly agency reports Chief Nurse review of ward establishments. Page 1 of 7
185 '000 KEY FINANCIAL PRESSURES EFFECTING RUN RATE Area Key points and underlying issues Action taken Use of External Placements Over the last two years the Trust has faced unprecedented pressure on its Adult in-patient services resulting in increased use of external placement. In 2017/18 the Trust spent 1.96m on external placements. A number of measures were introduced to better manage patient flow to reduce the pressure on in-patient services resulting in a marked reduction in external placements over the first two months of 2018/19. However, year to date (Month 9) the Trust has incurred 1,430k. Following the introduction of additional measures use of placements has started to reduce, with spends of 182k and 140k in months 8 and 9. The main areas of high usage are Coastal 913k and Brighton 517k year to date. The trend for expenditure for the last 18 months and forecast for the remainder of 2018/19 is set out in the chart below Expenditure on Out of Area Placements Month 2017/ /19 Actual 2018/19 Forecast Actions undertaken to address the pressure on inpatient services, include:- Establishment of a patient flow team Daily Acute In-patient Dataset Daily bed calls Weekly Systems call to review delayed transfers of care Implementation of the Clinical Strategy and STP Mental Health Case for Change, particularly focusing on the crisis pathway and community services Independent review jointly commissioned with CCGs to determine number of beds required. The report is currently being finalised, but indicated that without significant interventions it is likely that the Trust will continue to use external placements. Out of Area Workshop held on 18 th September with NHSE and local partners 50:50 risk share in place with CCGs to fund cost of external placements. Business case for Psychiatric Decision Unit Agreement by commissioners for funding 24/7 crisis services from 2019/20. Page 2 of 7
186 '000 KEY FINANCIAL PRESSURES EFFECTING RUN RATE Area Key points and underlying issues Action taken Shortfall on Service Improvement Plans The Trust s Service Improvement Programme (SIP) for 2018/19 of 12m (4.8%) is required to deliver the Trust s Control Total of 1.1m ( 3.2m after taking account of Provider Sustainability Funding (PSF)). It is recognised that a savings programme of 4.8% is challenging to deliver in order not to impact on the quality of care. Year to date (Month 9) the Trust has delivered 6.8m savings (78%), which is 1.9m under plan. Detailed work has been undertaken to determine the year end, currently the Trust is forecasting that it will deliver 10.5m savings which is 1.5m under plan. The forecast position is set out the table and graph below. Target YTD Month 9 k SIP Delivered YTD k SIP Gap Month 9 k Clinical Services 6,456 4,806 (1,650) Support Services 2,329 2,005 (324) TOTAL 8,785 6,811 (1,974) Delivery of Service Improvement Plan Apr-18 May-18 Jun-18 Jul-18 Aug-18 Sep-18 Oct-18 Nov-18 Dec /19 SIP Plan SIP Actual A number of actions are being undertaken to ensure that the Trust delivers it s SIP programme for 2018/19, including:- SIP plans have been built bottom up in discussion with the Care Delivery and Support Services. Each scheme has a detailed project plan, setting out actions, time times and responsibilities Progress is overseen by the Programme Management Office (PMO). Quality Impact Assessment (QIA) has been undertaken for each scheme, which have been signed off by Chief Medical Officer and Chief Nurse and an updated provided to the Quality Committee in October Delivery of the SIP Programme is overseen by the Finance & Investment Committee, with a monthly updated provide to the Committee and a summary of progress against the SIP Programme included in the monthly Finance Report to the Executive Assurance Committee and the Board Detailed forecasting was undertaken at the end of Month 4 to determine the year end position and are updated on a monthly basis and discussed at the new Day 7 meeting with the Finance Team. Planning for SIP schemes for 2019/20 is underway. Page 3 of 7
187 KEY FINANCIAL PRESSURES EFFECTING RUN RATE Area Key points and underlying issues Action taken Overspend on Inpatient Units At the end of December the in-patients Units are currently overspent by 1,458k. It can be seen from the graph below that the variance fluctuates between months. However, we are now starting to see a reduction in the monthly overspend. The average year to date overspend is 162k per month, with November being 132k, a further 10k reduction on the previous month. The reason for the dip in August is that budget pressures were funded by the trust and backdated to April There are 2 main areas that are contributing to the year to date overspend, Brighton ( 724k) and Coastal ( 429k) Total In-Patients Total In-Patients The Finance Department continues to monitor and report on the performance of the wards on a weekly basis. This is to ensure that each Ward Manager, Matron, General Manager and Service Director is aware of the performance of each ward every Wednesday for the previous week. The Finance Team have recently undertaken a deep dive into the in-patient spend, which has highlighted that 11 wards are contributing the overspend. The report is being developed further in discussion with the respective Care Delivery Services and will be presented to the Finance & Investment Committee in January. The team is also working with the Chief Nurse to review the establishments for these wards to ensure that the budget is correct for the bed numbers and acuity of the ward. The use of agency has reduced since this time last year; however the use of Qualified Agency still remains an issue in Adult Services. It is still averaging around 1,400 to 1,500 hours per week, but reduced to less than 1,300 hours in the middle of November. However, this increased again to an average of 1,411 hours per week in December. Page 4 of 7
188 KEY FINANCIAL PRESSURES EFFECTING RUN RATE Area Key points and underlying issues Action taken Brighton Care Delivery Service Brighton Care Delivery Service (CDS) is responsible for providing the Adult Mental Health Service for Brighton and Hove. It provides community services from two sites across East and West Brighton, in-patient services from wards at Mill View Hospital in Hove, which includes a psychiatric intensive care unit and dementia ward and rehabilitation services from Rutland Gardens in Hove. The service has a budget of 21,022k and an establishment of 483 staff (whole time equivalent wtes). Year to date (Month 9) the CDS is overspent by 1,601k, of which 974k relates to pay and 642k to non-pay, which is off-set in part by a favorable variance for income of 16k. The key areas driving the overspend for Brighton are as follows:- Overspend on in-patient wards - 724k External placements - 517k Shortfall in delivery of service improvement plans - 218k The CDS has experienced some staffing issues in its inpatient services, which are in the process of being addressed. The CDS is currently using 14.7% of temporary staffing (of which 3.6% is agency staff). The CDS is also currently activity recruiting to 29 vacancies across both in-patient and community services. Brighton currently has 26 vacancies on its in-patient units and a number of staffing issues across Pavilion and Caburn wards, which are due for resolution in January. The deep dive into the in-patient spend has highlighted that in-patient overspend in Brighton is mainly across 3 wards, Pavilion, Caburn and Brunswick. The overspend on Pavilion and Caburn Wards are 293k and 128k respectively, of which a significant proportion relates to the staffing issues. Work is underway to resolve these issues earlier in the new year. Extra support is being given to ensure roster completion is as accurate and informative as possible and additional HR support is in place to help resolve the sickness levels. The move of West Sussex patients to Brunswick Ward due to the refurbishment of the Burrows has caused staffing pressures on the ward, which is 193k overspent year to date. It has been agreed to transfer 10k per month out of the Burrows savings to resolve the additional staffing required to cover the West Sussex patients on a short term basis. However, the overspend in this area is improving as the ward adjust to the increased bed capacity. Page 5 of 7
189 KEY FINANCIAL PRESSURES EFFECTING RUN RATE Area Key points and underlying issues Action taken Coastal Care Delivery Service Coastal Care Delivery Service (CDS) is responsible for providing the Adult Mental Health Service across Coastal West Sussex. It provides community services from three sites across Bognor Regis, Chichester and Worthing, in-patient services from wards at Chichester and Meadowfield Hospital in Worthing, including a dementia ward and rehabilitation services from Connelly House in Chichester and Shepherd House in Worthing. The service has a budget of 34,658k and an establishment of 766 staff (whole time equivalent wtes). Year to date (Month 9) the CDS is overspent by 2,001k, of which 1,078k relates to pay and 990k to non-pay, which is off-set by a favorable variance on income of 66k. The key areas driving the overspend for Coastal are as follows:- Shortfall in delivery of service improvement plans (SIP) - 1,148k External placements - 913k Overspend on in-patient wards - 429k The SIP shortfall is mainly due to slippage in the delivery of the CDSs Service Redesign Programme to configure its inpatient services to address issues of poor accommodation and to eliminate mixed sexed accommodation. The CDS is also currently using 13.8% of temporary staffing (of which 5.7% is agency staff). The CDS is also currently activity recruiting to 55 vacancies. The CDS schedule daily patient flow calls involving community teams in order to reduce external placements in addition to Trust wide initiatives. The in-patient overspend is mainly due to the overspend on 3 wards, Maple, Rowan Wards at Meadowfield and Grove, in Chichester. The overspend in Meadowfield is mainly due to a high number of vacancies and sickness levels. The situation is starting to improve, with a number of posts being recruited to. Project work to standardise all inpatients services in West Sussex is underway as part of the redesign programme, which should bring improvement in quality but also cost improvements. A daily safety huddle have also been introduced to identify pressures and considers staff sharing across Meadowfield. Regular staff meetings also contributed to improved staff morale. The overspend on Grove Ward is mainly due to high sickness level, with up to 9 staff being off sick at one time. This position is now improving, with the monthly overspend halved in December. There has also been improved communication with the Bank team to eliminate use of Non Framework Agencies across all wards. The SIP shortfall is mainly due to the West Sussex redesign programme which is progressing well but will not release savings until 2019/20. Page 6 of 7
190 KEY FINANCIAL PRESSURES EFFECTING RUN RATE Area Key points and underlying issues Action taken Nursing Home Care Delivery Service The Nursing Home Service is delivered out of the Lindridge care home in Hove. The service provides nursing home beds for people with dementia and end of life care. The care home has 75 ensuite bedrooms. The service has an income target of 4,769k and an operating budget of 3,417k and an establishment of 124 staff (whole time equivalent wtes). Year to date (Month 9) the CDS has an income shortfall of 1,124k, off-set by an underspend on operating costs of 85k. Performance is therefore 1,039k under plan. The main area driving the underperformance is low occupancy levels. Although the service has maintained its average weekly fee, occupancy rates have fallen significantly to 50.8% in the month and 63.9% year to date. Following a CQC inspection the service are focused on addressing their quality issues, as well as recruiting to vacancies before increasing occupancy levels. The service is currently using 14.9% of temporary staffing (all of which is agency staff), which is a significant improvement compared to earlier months of the year, when up to 50% of staff where temporary staff. The service continues with its recruitment and is activity recruiting to 44 vacancies. Following a CQC inspection the service has focused on addressing their quality issues. One of the Trust s Deputy Chief Nurses has been seconded to the unit to help implement the action plan arising from the CQC inspection. The service received an unannounced visit from the CQC on the 23 rd October and it is pleasing to report that the feedback from the visit was positive and the rating has now been lifted from Requires Improvement to Good. Work over the past few months has focused on recruitment of staff and addressing quality issues. Now that good progress has been made, the unit can now focus on improving occupancy levels. A new Clinical Manager has also been recruited. The management team is also working with the wider system to determine whether the additional bed capacity can be used to alleviate pressures for the acute trusts. These discussions also include the use of the old Brunswick Ward now that this service has moved to the newly refurbished ward on the Mill View site. The service is also undertaking a review of the longer term strategy for Lindridge. Page 7 of 7
191 Report to Board of Directors Agenda item TBP05.1/19 Attachment K EHRIA code N/A Date of meeting 30 January 2019 Format of Paper Title of paper Board Assurance Framework (Q3) Written Author Adam Churcher, Head of Corporate Governance Oral Presenter Dominic Ford, Director of Corporate Affairs Presentation Committees/meetings where this item has been considered Purpose of report (tick all that apply) Executive Management Committee, Board Committees (relevant to each risk), Audit Committee To provide assurance For decision Regulatory requirement To highlight an emerging risk or issue To canvas opinion For information To highlight patient, carer or staff experience Strategic Goals (tick all that relate) 1. Safe, effective, quality patient care 2. Local, joined up care 3. Put research, innovation and learning into practice 4. Be the provider, employer and partner of choice 5. Living within our means Summary of Report The Board Assurance Framework (BAF) sets out the principal risks to the achievement of the annual objectives, which themselves align to each of the goals set out in Our 2020 Vision. The BAF is therefore a key mechanism which the Board uses to reinforce strategic focus and better manage risk. It is a dynamic tool, which reflects the extent to which risks change and risk treatment is effective. Recommendation The Board of Directors is asked to consider the BAF (Quarter 3) and the principal risks to achieving the trust s objectives for 2018/19 and satisfy itself in relation to the controls and actions currently in place. Page 1 of 5
192 1. INTRODUCTION The Trusts Board Assurance Framework (BAF) is considered in full by the Board of Directors quarterly. 2. REPORT The Board has overall responsibility for ensuring systems and controls are in place, sufficient to mitigate any significant risks which may threaten the achievement of the annual objectives. Evidence may be gained from a wide range of sources, but it should be systematic, supported by evidence, independently verified and incorporated within a robust governance process. The board achieves this primarily through the work of its committees, through use of Audit, independent inspections and by systematic collection and scrutiny of performance data. The BAF forms part of the Trusts risk management strategy and provides detail on key activities underway to achieving the Trusts annual objectives; progress as it currently stands; risks to achievement; actions and controls in place to mitigate those risks; and internal and external sources of assurance to ensure the risks are being mitigated appropriately. Each risk is reviewed by an Executive sponsor to ensure the controls, assurance, gaps and risk score reflect the work undertaken since the BAF was last reported to the Board. A risk rating is then assigned in accordance with the grading matrix (Appendix 1). Assurance Chaired by the Chief Executive, the Executive Management Committee (EMC) meets monthly and helps management seek assurance that the Trust maintains robust systems of risk management. The Committee reviews the Board Assurance Framework (BAF) prior to submission to the Board and ensures appropriate action is taken to manage the risks. EMC received the BAF in January and were satisfied that the risk ratings were appropriate. Internal Audit An audit of the Board Assurance Framework (BAF) has been undertaken as part of the approved internal audit periodic review for 2018/19. The audit provides reasonable assurance and identified eight issues (six medium and two low) with the design and application of the control framework. A formal management response has been provided and full implementation of the recommendations will be complete by April and evidenced in the BAF for 2019/20. Arising Risk The Clinical Strategy is referred to as a key control and line of assurance across a number of Trust objectives. Whilst the strategy has been approved by the Board, the benefits are yet to be fully realised across operational services and this is a substantial risk. Objective 1.2 remains the highest risk within the BAF and this reflects the challenges around demand and capacity as highlighted in the integrated performance report. Delivery of the 2018/19 Objectives Q3 Key points Objective 1.1 To ensure participation and engagement, particularly of those who have lived experience, is central to everything we do Service User engagement where we are now at 29 Peer Workers employed within the trust and with plans to recruit more in the Forensic Assertive transitions Team, Hastings Page 2 of 5
193 Inpatient and Urgent Care services, Langley Green and Meadowfield. Recovery and Discovery Colleges. The target was to secure funding for these services but investment in this area was not prioritised by the STP. Triangle of Care where 91% of inpatient services have now completed self-assessments against a target of 80% Objective 1.3 To promote a zero tolerance to suicide Suicide prevention has had mixed progress. Good progress in developing formal partnerships but has not delivered training to all staff in the current year as set out in the objectives. Training is being procured and will be available to staff from April Objective 2.1 To enable acute and community services to work more effectively together for patients and families 24/7 Crisis and Urgent Care Services has moved from amber to green. The target was to secure funding for these services and it has now been confirmed that 1.4M will be available for these services in 2019/20 as a Part Year Effect. A key area of concern is the demand for inpatient beds with occupancy rates of 101.5% YTD and 102.8% in Q3. This has driven the use of 2,204 ECR bed days YTD and 1,043 in Q3. This is linked to the issues set out above in securing additional resources for developing alternatives to hospital admission and comprehensive 24/7 Crisis and Urgent Care Services. The output of our patient flow analysis has set out a number of opportunities to reduce occupancy rates in inpatient services. The next stage of that work will agree the priorities for action. Objective 3.2 To improve the quality of older peoples mental health services Older People s Mental Health and Dementia. No appointment was made to the Clinical Director role however considerable progress has been made in delivering the review recommendations. A working party is pulled together to consider the scope of the Clinical Director role and programme of work. The STP dementia workstream Clinical Lead will report on progress to the STP mental Health Delivery Group in Q4. Objective 4.1 To improve the recruitment and retention of staff so that our workforce is well and healthy There has been good progress in relation to recruitment and retention but this area remains an ongoing challenge. As at the end of Q3 there were Consultant Psychiatrist starters but leavers. Overall staff turnover reduced from 16.18% in 2017/18 to 15.21% at the end of Q3 2018/19. This is very close to the rate of 15% which considered healthy for an organisation of our size and type but higher than the 14.5% target that the trust had set itself. Objective 3.1 To embed a Quality Improvement culture across clinical and corporate services QI where 4 outputs of QI projects have been presented to the Quality Committee. These projects are Towards Zero Suicide; Care Planning; Specialist Placements and Patient Flow. Objective 5.1 To deliver the agreed financial control target Financial performance at the end of Q3 is behind schedule but is still strong and well managed. At the end of Q3, the Trust had a surplus of 422k against a plan of 841k. This Page 3 of 5
194 should be recognised as a considerable achievement given the scale of the task in delivering a 4.9% efficiency saving for the year. 3. NEXT STEPS To update the Board Assurance Framework to reflect the findings of the internal audit and embed the use of the BAF to drive effective challenge and decision making at Board level. 4. RECOMMENDATION The Board of Directors is asked to consider the BAF (Quarter 3) and the principal risks to achieving the trust s objectives for 2018/19 and satisfy itself in relation to the controls and actions currently in place. Page 4 of 5
195 LIKELIHOOD Appendix 1 LIKELIHOOD RISK RATING Likelihood Rating is a matter of personal judgement; the table below provides some structure to aid thinking. Likelihood Descriptor Score Certain This type of event will happen or certain to occur in the future, (and frequently) 5 High probability This type of event may happen or there is a 50/50 chance of it happening again 4 Possible This type of event may happen again, or it is possible for this event to happen (occasionally) Unlikely This type of event is unlikely occur or it is unlikely to happen again (remote chance) 2 3 Rare Cannot believe this type of event will occur or happen again (in the foreseeable future) 1 Table LIKELIHOOD X CONSEQUENCE/IMPACT = RISK RATING Assess the likelihood of the occurrence and multiply by the likely impact to arrive at a rating CONSEQUENCES / IMPACT Insignificant Minor Moderate Major Catastrophic (1) (2) (3) (4) (5) Certain (5) High probability (4) Possible (3) Unlikely (2) Rare (1) Low Moderate High Extreme Page 5 of 5
196 Board Assurance Framework 2018/19 Risk Radar Quarter 3 5. Living within our means 5.1 To deliver the agreed financial control target Safe, Effective Quality Care 1.1 To ensure participation & engagement, particularly of those who have loved experience is central to everything we do. 1.2 To make it easier to access our services 1.3 To promote a just culture towards zero suicide Provider, Employer & Partner of Choice 4.1 To improve the recruitment and retention of staff so that our workforce is well and healthy 4.2 To develop the quality of Digital technologies that enables services to provide the best possible care Local, joined up care 2.1 To enable acute and community services to work more effectively together for patients and family 2.2 To improve the quality and access to physical healthcare across services 3.1 KEY: Shows movement from last version. 3. Research, innovation & learning into practice 3.1 To embed a Quality Improvement culture across clinical and corporate services 3.2 To improve the quality of older peoples mental health services Indicates risks with an severity of 4-severe and 5-catastrophic
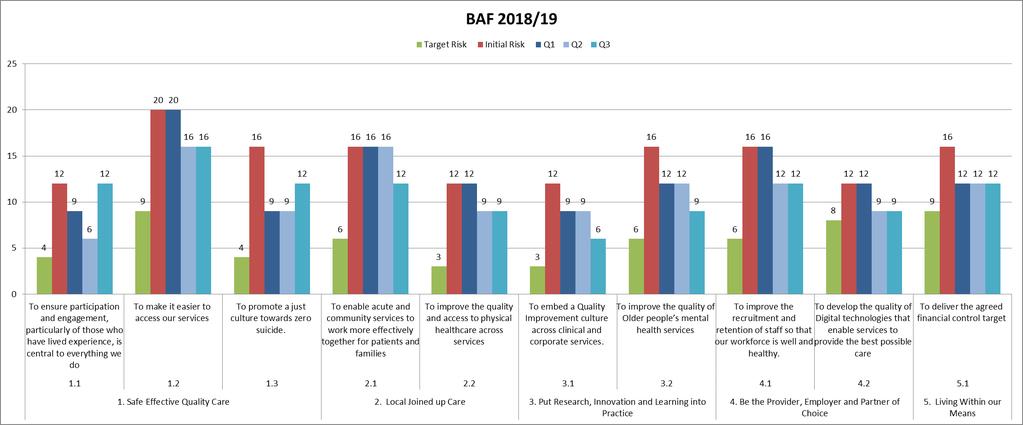
197
Chief Digital and Information
 Chief Digital and Information Officer @withoutstigma www.sussexpartnership.nhs.uk Join our team Over the last three years we ve been trying to change the way we work to promote more positive staff, service
Patient Experience Strategy
 Patient Experience Strategy 2013 2018 V1.0 May 2013 Graham Nice Chief Nurse Putting excellent community care at the heart of the NHS Page 1 of 26 CONTENTS INTRODUCTION 3 PURPOSE, BACKGROUND AND NATIONAL
Intensive Psychiatric Care Units
 NHS Lothian St John s Hospital, Livingston Intensive Psychiatric Care Units Service Profile Exercise ~ November 2009 NHS Quality Improvement Scotland (NHS QIS) is committed to equality and diversity. We
Summary and Highlights
 Meeting: Trust Board Date: 23 November 2017 Agenda Item: TB/17-18/114 Boardpad ref:14 Agenda item Nursing Strategy Item from Attachments Summary and Highlights Mary Mumvuri Nursing Strategy This agenda
Sussex and East Surrey STP narrative
 Sussex and East Surrey STP narrative What is the STP? The Sussex and East Surrey Sustainability and Transformation Partnership (STP) outlines how the NHS and social care will work together to improve and
SCOTTISH BORDERS HEALTH & SOCIAL CARE INTEGRATED JOINT BOARD UPDATE ON THE DRAFT COMMISSIONING & IMPLEMENTATION PLAN
 Appendix-2016-59 Borders NHS Board SCOTTISH BORDERS HEALTH & SOCIAL CARE INTEGRATED JOINT BOARD UPDATE ON THE DRAFT COMMISSIONING & IMPLEMENTATION PLAN Aim To bring to the Board s attention the Scottish
1st Class Care Solutions Limited Support Service Care at Home Argyll House Quarrywood Court Livingston EH54 6AX Telephone:
 1st Class Care Solutions Limited Support Service Care at Home Argyll House Quarrywood Court Livingston EH54 6AX Telephone: 01506 412698 Type of inspection: Unannounced Inspection completed on: 13 March
Vision 3. The Strategy 6. Contracts 12. Governance and Reporting 12. Conclusion 14. BCCG 2020 Strategy 15
 Bedfordshire Clinical Commissioning Group Quality Strategy 2014-2016 Contents SECTION 1: Vision 3 1.1 Vision for Quality 3 1.2 What is Quality? 3 1.3 The NHS Outcomes Framework 3 1.4 Other National Drivers
Direct Commissioning Assurance Framework. England
 Direct Commissioning Assurance Framework England NHS England INFORMATION READER BOX Directorate Medical Operations Patients and Information Nursing Policy Commissioning Development Finance Human Resources
Halton. Local system review report Health and Wellbeing Board. Background and scope of the local system review. The review team
 Halton Local system review report Health and Wellbeing Board Date of review: 21-25 August 2017 Background and scope of the local system review This review has been carried out following a request from
FT Keogh Plans. Medway NHS Foundation Trust
 FT Keogh Plans Medway NHS Foundation Trust July 2014 KEY Delivered On Track to deliver Some issues narrative disclosure Not on track to deliver Medway - Our improvement plan & our progress What are we
Inpatient and Community Mental Health Patient Surveys Report written by:
 2.2 Report to: Board of Directors Date of Meeting: 30 September 2014 Section: Patient Experience and Quality Report title: Inpatient and Community Mental Health Patient Surveys Report written by: Jane
Status: Information Discussion Assurance Approval. Claire Gorzanski, Head of Clinical Effectiveness
 Report to: Trust Board Agenda item: Date of Meeting: 2 October 2017 SFT3934 Report Title: Annual quality governance report 2016-2017 Status: Information Discussion Assurance Approval X Prepared by: Executive
Overall rating for this trust Good. Inspection report. Ratings. Are services safe? Good. Are services effective? Good. Are services caring?
 Sussex Partnership NHS Foundation Trust Inspection report Trust Headquarters Worthing West Sussex BN13 3EP Tel: 01903843000 www.sussexpartnership.nhs.uk Date of inspection visit: 2 Oct to 7 Dec 2017 Date
NHS Somerset CCG OFFICIAL. Overview of site and work
 NHS Somerset CCG Overview of site and work NHS Somerset CCG comprises 400 GPs (310 whole time equivalents) based in 72 practices and has responsibility for commissioning services for a dispersed rural
Norfolk and Suffolk NHS Foundation Trust mental health services in Norfolk
 Norfolk Health Overview and Scrutiny Committee 7 December 2017 Item no 6 Norfolk and Suffolk NHS Foundation Trust mental health services in Norfolk Suggested approach by Maureen Orr, Democratic Support
York Teaching Hospital NHS Foundation Trust. Caring with pride. The Nursing and Midwifery Strategy
 York Teaching Hospital NHS Foundation Trust Caring with pride The Nursing and Midwifery Strategy 2017-2020 1 To be a nurse, a midwife or member of care staff is an extraordinary role. What we do every
21 March NHS Providers ON THE DAY BRIEFING Page 1
 21 March 2018 NHS Providers ON THE DAY BRIEFING Page 1 2016-17 (Revised) 2017-18 (Revised) 2018-19 2019-20 (Indicative budget) 2020-21 (Indicative budget) Total revenue budget ( m) 106,528 110,002 114,269
MERTON CLINICAL COMMISSIONING GROUP GOVERNING BODY
 MERTON CLINICAL COMMISSIONING GROUP GOVERNING BODY Date of Meeting: 25 th January 2018 Agenda No: 7.2 Attachment: 7 Title of Document: Acute Sustainability at Epsom & St Helier University Hospitals NHS
CLINICAL AND CARE GOVERNANCE STRATEGY
 CLINICAL AND CARE GOVERNANCE STRATEGY Clinical and Care Governance is the corporate responsibility for the quality of care Date: April 2016 2020 Next Formal Review: April 2020 Draft version: April 2016
End of Life Care Strategy
 End of Life Care Strategy 2016-2020 Foreword Southern Health NHS Foundation Trust is committed to providing the highest quality care for patients, their families and carers. Therefore, I am pleased to
QUALITY STRATEGY
 NHS Nene and NHS Corby Clinical Commissioning Groups QUALITY STRATEGY 2017-2021 Approved: By the Joint Quality Committee on 11 April 2017 Ratified: By the NHS Corby Clinical Commissioning Group on 25 April
Performance and Delivery/ Chief Nurse
 Governing Body 26th May 2017 Quality and Performance Report 22nd May 2017 Author: Other contributors: Executive Lead Audience Eileen Clark - Acting Director of Clinical Performance and Delivery/ Chief
Surrey Downs Clinical Commissioning Group Governing Body Part 1 Paper Acute Sustainability at Epsom & St Helier University Hospitals NHS Trust
 Surrey Downs Clinical Commissioning Group Governing Body Part 1 Paper Acute Sustainability at Epsom & St Helier University Hospitals NHS Trust 1. Strategic Context 1.1. It has long been recognised that
KEY AREAS OF LEARNING FROM THE FRANCIS REPORT
 KEY AREAS OF LEARNING FROM THE FRANCIS REPORT The public inquiry provided detailed and systematic analysis of what contributed to the failings in care at Mid Staffordshire NHS Foundation Trust. It identified
2017/ /19. Summary Operational Plan
 2017/18 2018/19 Summary Operational Plan Introduction This is the summary Operational Plan for Central Manchester University Hospitals NHS Foundation Trust (CMFT) for 2017/18 2018/19. It sets out how we
Quality Strategy (Refreshed March 2015)
") Quality Strategy 2012-2017 (Refreshed March 2015) 1 Table of Contents 1. Executive Summary... 3 2. Drivers for improvement... 4 2.1 The Trust s ambition - vision and mission... 4 2.2 Corporate Strategy...
Quality Strategy 2012-2017 (Refreshed March 2015) 1 Table of Contents 1. Executive Summary... 3 2. Drivers for improvement... 4 2.1 The Trust s ambition - vision and mission... 4 2.2 Corporate Strategy...
TITLE OF REPORT: Looked After Children Annual Report
 NHS BOLTON CLINICAL COMMISSIONING GROUP Public Board Meeting AGENDA ITEM NO: 13 Date of Meeting:..27 th October 2017.. TITLE OF REPORT: Looked After Children Annual Report 2016-2017 AUTHOR: Christine Dixon,
Annual Review and Evaluation of Performance 2012/2013. Torfaen County Borough Council
 Annual Review and Evaluation of Performance 2012/2013 Local Authority Name: Torfaen County Borough Council This report sets out the key areas of progress in Torfaen Social Services Department for the year
Northumberland, Tyne and Wear NHS Foundation Trust. Board of Directors Meeting
 Agenda item 7 iv) Northumberland, Tyne and Wear NHS Foundation Trust Meeting Date: 22 February 2017 Board of Directors Meeting Title and Author of Paper: Safer Staffing Quarter 3 Report (October December,
EMPLOYEE HEALTH AND WELLBEING STRATEGY
 EMPLOYEE HEALTH AND WELLBEING STRATEGY 2015-2018 Our community, we care, you matter... Document prepared by: Head of HR Services Version Number: Review Date: September 2018 Employee Health and Wellbeing
NHS Grampian. Intensive Psychiatric Care Units
 NHS Grampian Intensive Psychiatric Care Units Service Profile Exercise ~ November 2009 NHS Quality Improvement Scotland (NHS QIS) is committed to equality and diversity. We have assessed the performance
ESHT Our ambition to be outstanding by 2020
 ESHT 2020 Our ambition to be outstanding by 2020 June 2018 1 Contents Page 3 Page 4 Page 6 Page 8 Background 2017/18 progress Vision, values and objectives CQC ratings Page 10 What we will have achieved
Date of publication:june Date of inspection visit:18 March 2014
 Jubilee House Quality Report Medina Road, Portsmouth PO63NH Tel: 02392324034 Date of publication:june 2014 www.solent.nhs.uk Date of inspection visit:18 March 2014 This report describes our judgement of
Northumberland, Tyne and Wear NHS Foundation Trust. Board of Directors Meeting. Meeting Date: 25 October Executive Lead: Rajesh Nadkarni
 Agenda item 9 ii) Northumberland, Tyne and Wear NHS Foundation Trust Board of Directors Meeting Meeting Date: 25 October 2017 Title and Author of Paper: Clinical Effectiveness (CE) Strategy update Simon
CLINICAL STRATEGY IMPLEMENTATION - HEALTH IN YOUR HANDS
 CLINICAL STRATEGY IMPLEMENTATION - HEALTH IN YOUR HANDS Background People across the UK are living longer and life expectancy in the Borders is the longest in Scotland. The fact of having an increasing
Performance Evaluation Report Pembrokeshire County Council Social Services
 Performance Evaluation Report 2013 14 Pembrokeshire County Council Social Services October 2014 This report sets out the key areas of progress and areas for improvement in Pembrokeshire County Council
Quality Accounts: Corroborative Statements from Commissioning Groups. Nottingham NHS Treatment Centre - Corroborative Statement
 Quality Accounts: Corroborative Statements from Commissioning Groups Quality Accounts are annual reports to the public from providers of NHS healthcare about the quality of services they deliver. The primary
NHS Bradford Districts CCG Commissioning Intentions 2016/17
 NHS Bradford Districts CCG Commissioning Intentions 2016/17 Introduction This document sets out the high level commissioning intentions of NHS Bradford Districts Clinical Commissioning Group (BDCCG) for
Briefing: Quality governance for housing associations
 25 March 2014 Briefing: Quality governance for housing associations Quality and clinical governance in housing, care and support services Summary of key points: This paper is designed to support housing
Independent Mental Health Advocacy. Guidance for Commissioners
 Independent Mental Health Advocacy Guidance for Commissioners DH INFORMATION READER BOX Policy HR / Workforce Management Planning / Performance Clinical Estates Commissioning IM&T Finance Social Care /
NHS and independent ambulance services
 How CQC regulates: NHS and independent ambulance services Provider handbook March 2015 The Care Quality Commission is the independent regulator of health and adult social care in England. Our purpose We
Agenda Item No. 9. Key Information
 Key Information Name of footprint and no: Sussex and East Surrey (33) Region: NHSE South Nominated lead of the footprint including organisation/function: Michael Wilson, Chief Executive, Surrey and Sussex
NHS DUMFRIES AND GALLOWAY ANNUAL REVIEW 2015/16 SELF ASSESSMENT
 NHS DUMFRIES AND GALLOWAY ANNUAL REVIEW 2015/16 SELF ASSESSMENT Chapter 1 Introduction This self assessment sets out the performance of NHS Dumfries and Galloway for the year April 2015 to March 2016.
Re-designing Adult Mental Health Secondary Care Services through co-production and consultation. 1 Adult Mental Health Secondary Care Services
 2016 Re-designing Adult Mental Health Secondary Care Services through co-production and consultation 1 Adult Mental Health Secondary Care Services Contents Forward Vision & Values Introduction Adult Mental
Report on actions you plan to take to meet CQC essential standards
 R10.2 Report on actions you plan to take to meet CQC essential standards Please see the covering letter for the date by which you must send your report to us and where to send it. Failure to send a report
You said We did. Care Closer to home Acute and Community Care services. Commissioning Intentions Engagement for 2017/18
 Commissioning Intentions Engagement for 2017/18 You said We did Care Closer to home Acute and Community Care services Top three priorities were: Shifting hospital services into the community Community
Improving Mental Health Services in Bath & North East Somerset
 Improving Mental Health Services in Bath & North East Somerset Andy Sylvester Executive Director of Operations Welcome & Introductions Housekeeping Format of the day Presentations Questions and answers
IMPROVING QUALITY. Clinical Governance Strategy & Framework
 IMPROVING QUALITY Clinical Governance Strategy & Framework NHS GREATER GLASGOW & CLYDE Approval: Quality & Performance Committee Responsible Director: Medical Director Custodian: Head of Clinical Governance
GOVERNING BODY REPORT
 GOVERNING BODY REPORT 1. Date of Governing Body Meeting: 2. Title of Report: Finance, Performance and Commissioning Committee Report 3. Key Messages: At the end of March 2017 the clinical commissioning
Integrated Performance Committee Assurance Reports, January 2016 and December 2015 Crishni Waring, Chair, IPC Committee
 EPB53/825 Title of Report: Prepared By: Sponsor: Action Required: Integrated Performance Committee Assurance Reports, January 2016 and December 2015 Crishni Waring, Chair, IPC Committee Gale Hart, Director
NHS GRAMPIAN. Local Delivery Plan - Mental Health and Learning Disability Services
 NHS GRAMPIAN Board Meeting 01.06.17 Open Session Item 8 Local Delivery Plan - Mental Health and Learning Disability Services 1. Actions Recommended The Board is asked to: Note the context regarding the
NHS Equality and Diversity Council Annual Report 2016/17
 NHS Equality and Diversity Council Annual Report 2016/17 Providing national leadership to shape and improve healthcare for all NHS Equality and Diversity Council Annual Report 2016/17 First published:
ADULT MENTAL HEALTH NHS MANAGEMENT ARRANGEMENTS. To approve. This paper supports the standards
 BOARD MEETING 25 FEBRUARY 2015 AGENDA ITEM 2.1 ADULT MENTAL HEALTH NHS MANAGEMENT ARRANGEMENTS Report of Paper prepared by Purpose of Paper Action/Decision required Link to Doing Well, Doing Better: Standards
Clinical Strategy
 Clinical Strategy 2014-2018 Contents About the clinical strategy Page 2 About our Trust Page 3 What we stand for Page 6 Our clinical services Page 9 Supporting our staff Page 12 The five year plan Page
Trust Board Meeting: Wednesday 13 May 2015 TB
 Trust Board Meeting: Wednesday 13 May 2015 Title Update on Quality Governance Framework Status History For information, discussion and decision This paper has been presented to Quality Committee in April
Intensive Psychiatric Care Units
 NHS Tayside Carseview Centre, Dundee Intensive Psychiatric Care Units Service Profile Exercise ~ November 2009 NHS Quality Improvement Scotland (NHS QIS) is committed to equality and diversity. We have
Patient Experience Strategy
 Patient Experience Strategy Published: June 2017 Find us online at cornwallft 1.Introduction At Cornwall Partnership NHS Foundation Trust (CFT) we believe in delivering high quality care. We care deeply
Quality, Safety & Experience (QSE) Committee. Minutes of the Meeting Held on Wednesday 29 th March 2017 in the Boardroom, Carlton Court, St Asaph
 Committee. Minutes of the Meeting Held on Wednesday 29 th March 2017 in the Boardroom, Carlton Court, St Asaph") 1 Minutes QSE Public 29.3.17 V1.0 Present: Quality, Safety & Experience (QSE) Committee Minutes of the Meeting Held on Wednesday 29 th March 2017 in the Boardroom, Carlton Court, St Asaph Mrs Margaret
1 Minutes QSE Public 29.3.17 V1.0 Present: Quality, Safety & Experience (QSE) Committee Minutes of the Meeting Held on Wednesday 29 th March 2017 in the Boardroom, Carlton Court, St Asaph Mrs Margaret
EAST KENT HOSPITALS UNIVERSITY NHS FOUNDATION TRUST
 EAST KENT HOSPITALS UNIVERSITY NHS FOUNDATION TRUST REPORT TO: BOARD OF DIRECTORS DATE: 7 AUGUST 2015 SUBJECT: REPORT FROM: PURPOSE: CHIEF EXECUTIVE S REPORT CHIEF EXECUTIVE Decision CONTEXT / REVIEW HISTORY
Health and wellbeing board Date of review: 4 8 September Background and scope of the local system review
 Stoke-on-Trent Local system review report Health and wellbeing board Date of review: 4 8 September 2017 Background and scope of the local system review This review has been carried out following a request
Clinical Strategy
 Clinical Strategy 2012-2017 www.hacw.nhs.uk CLINICAL STRATEGY 2012-2017 Our Clinical Strategy describes how we are going to deliver high quality care in response to patient and carer feedback and commissioner
Driving and Supporting Improvement in Primary Care
 Driving and Supporting Improvement in Primary Care 2016 2020 www.healthcareimprovementscotland.org Healthcare Improvement Scotland 2016 First published December 2016 The publication is copyright to Healthcare
Report on actions you plan to take to meet CQC essential standards
 R2.1 Report on actions you plan to take to meet CQC essential standards Please see the covering letter for the date by which you must send your report to us and where to send it. Failure to send a report
Welsh Government Response to the Report of the National Assembly for Wales Public Accounts Committee Report on Unscheduled Care: Committee Report
 Welsh Government Response to the Report of the National Assembly for Wales Public Accounts Committee Report on Unscheduled Care: Committee Report We welcome the findings of the report and offer the following
NHS Borders. Local Report ~ November Clinical Governance & Risk Management: Achieving safe, effective, patient-focused care and services
 NHS Borders Local Report ~ November 2009 Clinical Governance & Risk Management: Achieving safe, effective, patient-focused care and services NHS Borders Local Report ~ November 2009 Clinical Governance
Visit to Hull & East Yorkshire Hospitals NHS Trust
 Yorkshire and the Humber regional review 2014 15 Visit to Hull & East Yorkshire Hospitals NHS Trust This visit is part of a regional review and uses a risk-based approach. For more information on this
Education and Training Interventions to Improve Patient Safety
 Health Education England Education and Training Interventions to Improve Patient Safety Health Education England Implementation Plan 2016 2018 Developing people for health and healthcare www.hee.nhs.uk
Overall rating for this trust Requires improvement. Inspection report. Ratings. Are services safe? Requires improvement
 Bradford District Care NHS Foundation Trust Inspection report SBS New Mill Victoria Road, Saltaire Shipley West Yorkshire BD18 3LD Tel: 01274228300 www.bdct.nhs.uk Date of inspection visit: October 4th
2020 Objectives July 2016
 ... 2020 Objectives July 2016 1 About NHS Improvement NHS Improvement is responsible for overseeing NHS foundation trusts, NHS trusts and independent providers. We offer the support these providers need
Community Mental Health Patient Survey Report written by: Director of Operations / Compliance Manager Lead officer:
 2.1 Report to: Board of Directors Date of meeting: 24 November 2016 Section: Patient Experience & Quality Report title: Community Mental Health Patient Survey Report written by: Ian Jerams and Suzanne
South Gloucestershire Clinical Commissioning Group Improving the Patient Experience Forum Meeting
 South Gloucestershire Clinical Commissioning Group Improving the Patient Experience Forum Meeting Date: 8 th February 2017 Time: 10am-12:30pm Location: The Batch, Warmley, Bristol MINUTES IPEF members
OUR COMMITMENTS TO CARE A STRATEGY FOR NURSES & ALLIED HEALTH PROFESSIONALS
 OUR COMMITMENTS TO CARE A STRATEGY FOR NURSES & ALLIED HEALTH PROFESSIONALS Version: 2 Ratified by: Trust Board Date ratified: January 2014 Name of originator/author: Acting Head of Nursing Nursing & AHP
THE NEWCASTLE UPON TYNE HOSPITALS NHS FOUNDATION TRUST EXECUTIVE REPORT - CURRENT ISSUES
 THE NEWCASTLE UPON TYNE HOSPITALS NHS FOUNDATION TRUST EXECUTIVE REPORT - CURRENT ISSUES Agenda item A4(i) 1. Executive Team Particular attention is drawn to: i) Executive arrangements during the period
GOVERNING BODY REPORT
 GOVERNING BODY REPORT Date of Governing Body Meeting: Title of Report: Key Messages: Finance, Performance and Commissioning Committee Report At the end of September 2017 we have reported an inyear deficit
RESPONSE TO RECOMMENDATIONS FROM THE HEALTH & SOCIAL CARE COMMITTEE: INQUIRY INTO ACCESS TO MEDICAL TECHNOLOGIES IN WALES
 Recommendations 1, 2, 3 1. That the Minister for Health and Social Services should, as a matter of priority, identify means by which a more strategic, coordinated and streamlined approach to medical technology
Joint framework: Commissioning and regulating together
 With support from NHS Clinical Commissioners Regulation of General Practice Programme Board Joint framework: Commissioning and regulating together A practical guide for staff January 2018 Publications
Responding to a risk or priority in an area 1. London Borough of Sutton
 Responding to a risk or priority in an area 1 London Borough of Sutton October 2017 Contents Contents... 2 Introduction... 3 Scope and activity... 4 What did we do?... 5 Framework... 6 Key findings...
1. This letter summarises the mairi points discussed and actions arising from the Annual Review and associated meetings in Glasgow on 20 August.
 Cabinet Secretary for Health, Wellbeing and Sport ShonaRobisonMSP T: 0300 244 4000 E:scottish.ministers@gov.scot Andrew Robertson OBE Chairman NHS Greater Glasgow and Clyde JB Russell House Gartnavel Royal
Strategic Risk Report 1 March 2018
 Strategic Report 1 March 2018 Haringey CCG Register Introduction The Strategic Report (historically known as the Board Assurance Framework) evidences Haringey Clinical Commissioning Group s control over
The Care Values Framework
 The Care Values Framework 2017-2020 1 States of Guernsey An electronic version of the framework can be found at gov.gg/carevaluesframework Contents Foreword from the Chief Secretary Page 05 Chief Nurse
Modernising Learning Disabilities Nursing Review Strengthening the Commitment. Northern Ireland Action Plan
 Modernising Learning Disabilities Nursing Review Strengthening the Commitment Northern Ireland Action Plan March 2014 INDEX Page A MESSAGE FROM THE MINISTER 2 FOREWORD FROM CHIEF NURSING OFFICER 3 INTRODUCTION
Response to recommendations made in the Independent review into Liverpool Community Health NHS Trust
 To: The Board For meeting on: 22 March 2018 Agenda item: 8 Report by: Ian Dalton, Chief Executive Officer Report on: Response to recommendations made in the Independent review into Liverpool Community
DRAFT BUSINESS PLAN AND CORPORATE OBJECTIVES 2017/8
 DRAFT BUSINESS PLAN AND CORPORATE OBJECTIVES 2017/8 West London Clinical Commissioning Group This document sets out a clear set of plans and priorities for 2017/18 reflecting West London CCGs ambition
PATIENT EXPERIENCE AND INVOLVEMENT STRATEGY
 Affiliated Teaching Hospital PATIENT EXPERIENCE AND INVOLVEMENT STRATEGY 2015 2018 Building on our We Will Together and I Will campaigns FOREWORD Patient Experience is the responsibility of everyone at
Best Care Clinical Strategy Principles for the next 10 years of Best Care. Dr Caroline Allum, Executive Medical Director
 Best Care Clinical Strategy 2017 2027 Principles for the next 10 years of Best Care Produced By: Produced For: Dr Caroline Allum, Executive Medical Director NELFT Board Date Produced: 17 th July 2017 Version:
Quality Strategy and Improvement Plan
 Quality Strategy and Improvement Plan 2015-2018 STRATEGY DOCUMENT DETAILS Status: FINAL Originating Date: October 2015 Date Ratified: Next Review Date: April 2018 Accountable Director: Strategy Authors:
Our five year plan to improve health and wellbeing in Portsmouth
 Our five year plan to improve health and wellbeing in Portsmouth Contents Page 3 Page 4 Page 5 A Message from Dr Jim Hogan Who we are What we do Page 6 Page 7 Page 10 Who we work with Why do we need a
Perth & Kinross Council - Fostering Services Fostering Service Colonsay Resource Centre Colonsay Street Perth PH1 3TU Telephone:
 Perth & Kinross Council - Fostering Services Fostering Service Colonsay Resource Centre 37-39 Colonsay Street Perth PH1 3TU Telephone: 01738 783492 Inspected by: Lorna Black Pauline Cochrane Type of inspection:
MEETING OF THE GOVERNING BODY IN PUBLIC 7 January 2014
 MEETING OF THE GOVERNING BODY IN PUBLIC 7 January 2014 Title: Bedfordshire and Milton Keynes Healthcare Review: The way forward Agenda Item: 4 From: Jane Meggitt, Director of Communications and Engagement
NHS Cumbria CCG Transforming Care Programme Learning Disabilities
 NHS Cumbria CCG Governing Body Agenda Item 07 December 2016 8 NHS Cumbria CCG Transforming Care Programme Learning Disabilities Purpose of the Report To update the Governing Body on local progress with
Homecare Support Support Service Care at Home 152a Lower Granton Road Edinburgh EH5 1EY
 Homecare Support Support Service Care at Home 152a Lower Granton Road Edinburgh EH5 1EY Type of inspection: Unannounced Inspection completed on: 19 December 2014 Contents Page No Summary 3 1 About the
DELIVERING THE LEFT SHIFT IN ACUTE ACTIVITY THE COMMUNITY MODEL
 DELIVERING THE LEFT SHIFT IN ACUTE ACTIVITY THE COMMUNITY MODEL 1. Introduction The Strategic Outline Case (SOC) and subsequent developing Outline Business Case (OBC) for the reconfiguration of acute hospital
JOB DESCRIPTION. Higher Speciality Trainee (ST4-ST6) in Assertive Outreach Team and Community Forensic Psychiatry
 in Assertive Outreach Team and Community Forensic Psychiatry") JOB DESCRIPTION _ Job title: Hours: On Call: Disclosure Required: Service: Location: Reports to: Accountable to: Job Outline: Higher ity Trainee (ST4-ST6) in Assertive Outreach Team and Community Psychiatry
JOB DESCRIPTION _ Job title: Hours: On Call: Disclosure Required: Service: Location: Reports to: Accountable to: Job Outline: Higher ity Trainee (ST4-ST6) in Assertive Outreach Team and Community Psychiatry
Members Position Voting Rights Alison Lewis-Smith Chair, Lay member, Quality and Safety
 Minutes (confirmed) Subject Quality Committee Date 4 April 2017 Time 10.00am 12.30pm Venue Goodwood Room Chair Alison Lewis-Smith Members Position Voting Rights Alison Lewis-Smith Chair, Lay member, Quality
LEARNING FROM THE VANGUARDS:
 LEARNING FROM THE VANGUARDS: STAFF AT THE HEART OF NEW CARE MODELS This briefing looks at what the vanguards set out to achieve when it comes to involving and engaging staff in the new care models. It
In response to a question from Healthwatch Cornwall, it was agreed that the minutes once agreed by the Board would then be made public.
 Minutes Meeting Title: STP Transformation Board Date: 17 March 2017 Time: Location: Attendees: 9am 11am 2N.03, New County Hall, Truro Kate Kennally (Chair) (CExec Cornwall Council), Trevor Doughty (Strategic
Supervision of Trainee Doctors
 Appendix 13 Supervision of Trainee Doctors Good Medical Practice Supervision of Trainee Doctors Teaching, training, appraising and assessing doctors and students are important for the care of patients
Welcome. PPG Conference North and South Norfolk CCGs June 14 th 2018
 Welcome PPG Conference North and South Norfolk CCGs June 14 th 2018 Housekeeping Packed Agenda! Quick feedback on the national patient participation conference Primary care general update and importance
TEES, ESK & WEAR VALLEYS NHS FOUNDATION TRUST: DEVELOPING A MODEL LINE FOR RECOVERY- FOCUSED CARE
 TEES, ESK & WEAR VALLEYS NHS FOUNDATION TRUST: DEVELOPING A MODEL LINE FOR RECOVERY- FOCUSED CARE Summary Tees, Esk and Wear Valleys NHS Foundation Trust (TEWV) adapted the model line concept from industry