The Impact of U.S. R&D Expenditures on U.S. Exports: Does R&D Tax Credit Policy Matter? 1
|
|
|
- Karen Thomas
- 5 years ago
- Views:
Transcription
1 The Impact of U.S. R&D Expenditures on U.S. Exports: Does R&D Tax Credit Policy Matter? 1 Maksim Belenkiy, Wendy Li, and Susan Xu 2 December, 2016 PRELIMINARY: DO NOT CITE Abstract R&D tax credits have generally led to increases in R&D investments, which in turn can explain the positive link between U.S. exports and productivity growth. Previous research has focused on the impact of R&D tax credit on domestic R&D investments rather than on U.S. exports. This paper examines the effect of the R&D tax credit policy on U.S. exports by industry during the period of 2006 to We consider two U.S. R&D tax credit provisions: regular research credit (RRC) and alternative simplified credit (ASC). They differ in the qualification requirements and stipulated rates. We empirically determine whether a firm file for RRC or ASC in each industry and year. Given these qualifications we estimate augmented for R&D firm-level total factor productivity (TFP). We construct the user cost of R&D by using heterogeneous industry-level R&D depreciation rates, federal and state R&D tax credits. We estimate predicted R&D expenditure based on the user cost of R&D, which we use as an instrument in estimating TFP. Finally, we estimate elasticities of U.S. exports with the respect to trade barriers controlling for firm-level heterogeneity by the R&D credit type. There are several key findings, which matter for policy implications. First, we identify main characteristics of firms favored in the ASC over RRC. Second, firms that choose to file for ASC are more productive than firms that choose to file for RRC both within and across industries. Consequently, the implied firm-level heterogeneity has differential impact of trade barriers on U.S. exports that depends on the type of R&D credit. This finding implies that an R&D tax credit policy should be industry-specific to strengthen the U.S. competitiveness internationally. 1 The views expressed are those of the author and do not necessarily reflect those of the U.S. Department of Commerce, the Secretary of Commerce, the International Trade Administration (ITA), the Bureau of Economic Analysis (BEA), or the Under Secretary for International Trade. 2 Maksim Belenkiy, U.S. Department of Commerce, ITA, maksim.belenkiy@trade.gov (corresponding author); Wendy Li, U.S. Department of Commerce, BEA, wendy.li@bea.gov; Susan Xu,, U.S. Department of Commerce, ITA, susan.xu@trade.gov 1
2 I. Introduction Research and Development (R&D) tax credits are a prominent part of the industrial policy for many countries. The motivation for instituting the R&D subsidy is well micro founded and based on the idea that private investment in R&D is a public good with the presence of positive externalities. These externalities lead to underinvestment into R&D relative to what is socially optimal (Arrow (1962) and Jones and Williams (1999)). In the United States, the R&D subsidy began following the passage of 'The Economic Recovery Tax Act' in 1981 that contained a provision called the Credit for Increasing Research Activities (the Credit). The Credit was tailored to reverse the decline in U.S. research spending by providing an incentive that was premised on benefiting increases in (as opposed to total) year- over- year research spending. Since then, Congress has extended the credit repeatedly due to bipartisan support. However, policymakers and academics criticized this moving average base method because this mechanism allowed the marginal incentive effect in the first year significantly offset in the following years. In the Omnibus Budget Reconciliation Act of 1989, the US Congress amended R&D tax credit policy by redefining the base amount as a fixed-base percentage equal to the ratio of a firm s research to its gross sales receipts for , which is used to calculate the qualified incremental R&D expenditures to determine the amount of an R&D credit. The structural change of effects R&D tax credit provided mixed results empirical results (Swenson, 1992; Hall, 1993; Klassen, Pittman, and Reed 2004) Following federal R&D tax credit provisions, U.S. states established similar credits. As of 2015, 34 states provided a tax credit for company-funded R&D with on average toptier rate of roughly half of regular research credit (RRC) rate of 20%. While some research indicated that the structural change to R&D tax credit in 1989 decreased overall firm eligibility, the incentive effect of R&D tax credit remained unexplored and resulted in repeated improvement. Thereafter, US Congress enacted Alternative Simplified Credit (ASC) in 2009 to allow companies which cannot substantiate its claim for the regular R&D credit (RRC) to elect for an alternative calculation method. 2
3 Lower than RRC, the ASC provides a R&D credit of 14% of the QRE (Qualified Research Expenditure) in the current year that exceed 50% of the average QRE for the three preceding taxable years. The combined federal and state R&D tax credit rate system is fairly complex. To take advantage of an R&D tax credit provisions, a firm has to carefully determine the part of R&D expenditure that qualifies for a credit, the so-called qualified research expense (QRE), decide which R&D credit to file for, and calculate user cost of R&D capital. This user cost accounts for discounted by R&D credits federal and state corporate taxes liability for firm. While there is substantial literature that explores the effect of R&D tax credit policy on R&D expenditure and intensity (the ratio of R&D expenditures to sales), much less is known to what extent this policy affects exports. Research has been done to explore the impact of R&D investment on the change in productivity to change in exports link. The exposure to trade will stimulate the more productive firms to enter the export market while the less productive firms continue with domestic production (Melitz, 2003). In this selfselection process, evidence has been found that exporting has a direct effect on further productivity improvement (Greenaway and Kneller, 2004). Recent empirical trade literature has explored the role of R&D investment as a potentially important factor of the productivity-export link. Lileeva and Trefler (2007) argue that exporting is associated with firm s R&D investment and technology innovation and adoption, which suggests productivity gains. Criscuolo, Haskel, and Slaughter (2005) point out that firms with global operation devote more resources to generate innovations and absorb and assimilate innovative knowledge worldwide. Aw, Roberts, and Xu (2009) note that R&D investment and exporting are interdependent factors, both of which have a positive, direct effect on productivity and that the high productivity reinforces a firm s self-selection into export market and R&D investment. While many studies have been done on the impact of R&D investment on exports and productivity, in this paper we look beyond the R&D investment by studying the impact of the R&D tax credit policy (especially the newly-enacted ASC policy) on merchandize exports through the estimate of total factor productivity (TFP). We estimate that the R&D tax credit policy and change of policy provision would induce R&D investment through the policy impact on the user cost of R&D capital and increase productivity gains, and in turn, the 3
4 policy facilitates exports when more productive firms opt to export due to lessen impact of trade barriers on trade flows. Specifically, we empirically analyze the effect of RRC and ASC R&D tax credit policies on the U.S. exports between 2006 and The intuition for the link between R&D tax credits and exports is fairly obvious from the stand point of the new trade models which were pioneered by Melitz (2003). From, the standard trade theory with heterogeneous firms, we know that only most relatively productive firms are profitable enough to select into exporting. Furthermore, as shown by Chaney (2008), firm-level heterogeneity distorts gravity, in the sense that in industries with larger and more productive firms trade barriers have relatively mild effect on trade flows. By identifying firm-level total factor productivity (TFP) distributions depending on the R&D tax credit, we quantify the firm-level heterogeneity effect on trade barriers within and across industries. The firm-level heterogeneity distortion is the channel through which R&D tax credit affects U.S. exports. With a use of Compustat North America database, our empirical analysis proceeds in two stages. In the first stage, which we call a policy stage, we use various R&D tax credit conditions to probabilistically determine whether a firm choose to file for RRC or ASC with given firm-level balance sheet characteristics. Depending on the type of tax credit that a firm chooses to file for, we calculate the user cost of R&D capital. The user cost of R&D capital has both federal and state components of corporate tax rates and R&D tax credits. Furthermore, one of the innovations in our paper, is to calculate the user cost of R&D capital based on the newly estimated industry-level R&D depreciation rates (Li, 2015). The standard assumption adopts a constant rate, 15%, across industries (Wilson, 2007), which is against the conclusion from recent R&D research that the rate should be higher than 15% and varies across industries (Li and Hall, 2016). Hence, relative to the existing approaches, we have two additional sources of variation in the user cost of R&D capital. For a given US state and year, our measure varies by type of firm-level R&D tax credit, and by industry-level R&D depreciation rates. In the export performance (second) stage, we estimate gravity model of trade that accounts for firm-level heterogeneity by the R&D credit type. The degree of firm-level heterogeneity is estimated from firm-level R&D augmented TFP distributions by industry. 4
5 Recognizing endogeneity of R&D capital stock in estimating TFP, we follow Bloom et al. (2013) and use R&D tax credit policy as an instrument for the R&D stock. 3 We estimate R&D expenditure cost using dynamic panel methods that take into account that current R&D investment decisions depend on the previous levels of R&D expenditure. Since, our user cost of R&D varies by the type of the tax credit, we are able to estimate elasticity of R&D expenditures with respect to ASC relative to RRC. In other words, we are able to calculate the direct effect of R&D tax credit policy for given corporate tax rates. The predicted R&D expenditures from estimating the cost of conducting R&D are converted into R&D stock using the perpetual inventory method. We extend Olley and Pakes, (OP) (1996) methodology to estimate R&D augmented TFP. Our paper contributes to two strands of literature. First, the ample empirical evidence shows that R&D tax credits play a significant role in the R&D investment decisions. This argument, dated back to 1962, has been widely discussed and acknowledged that the R&D tax credit is positively associated with the R&D spending, which has positive impact on economic growth through technology spillover. Following Wilson (2007) we treat R&D as an input into a firm s production function. The price for this factor is the user cost after taxes. According to Rao, 2014, a 10% reduction in the user cost of R&D capital leads to an increase of R&D intensity in the short term and increase R&D spending in the long term. To accurately measure the R&D user cost, we improve Wilson s calculation by using federal corporate tax income brackets, which allows a more precise calculation of effective corporate tax rates. Second, significant amount of work has researched the effectiveness of the federal R&D tax credit, the regular R&D tax credit (RRC), among which are Wilson s (2007) and others. Initially, some researchers questioned the effectiveness of R&D tax credit policy by looking into the budget loss comparing to R&D spending induced by this tax credit policy (Corde, 1989). Others added the leak of technology into the equation to study the effectiveness of R&D tax credit (Mansfield, 1986). More recent research combined the two countervailing spillovers the technology spillovers and a negative business stealing effects together and concluded that technology spillovers quantitatively dominate the impact of R&D on economic growth (Bloom, 2013). Another recent study shows that a 10% reduction 3 This analysis in presently incomplete and will serve as a robustness check for our findings. 5
6 in the user cost of R&D capital leads to an increase of R&D intensity in the short term and increase R&D spending in the long term (Rao, 2015) The recent introduction of ASC into the R&D tax credit mechanism has brought challenges to the existing RRC. A significant portion of the eligible R&D firms opt to file for ASC. The availability of ASC has been factored in at firm-level decision regarding their R&D spending. Yet, current R&D tax credit research, focusing only on the RRC, has not given sufficient consideration and study on the newly-enacted ASC. This paper contributes to the classic R&D tax credit and empirical trade literature by considering how two available R&D tax credit provisions affect firms decisions to invest in R&D and its subsequent impact on their export participation. To the best of our knowledge this is the first study to quantify these links. This paper is organized as follows. In the next section we discuss our data sources and provide descriptive statistics; section III is devoted to the policy stage of our estimation; section IV presents estimates of R&D tax credits on U.S. exports and discuses policy implications; and section V concludes II. Data A. Data and Sample Selection Our estimation strategy involves two stages. In the first stage, we determine how introduction of Alternative Simplified Credit (ASC) in 2009 affected R&D expenditures of firms who chose to file for ASC relative to firms filing for Regular R&D tax credit (RRC). We use R&D tax credit policy as an instrument for endogenous R&D expenditure in the production function to estimate total factor productivity (TFP). In the second stage, we estimate an international trade model to shed light on how R&D tax credit policy affects U.S. exports through its effect on firms productivity. For the first stage estimation we collect a sample of all listed firms on the Compustat Industrial North America between 2006 and Our year range covers three years before ASC went into effect and three years after to set up difference-in-difference type regression analysis. 4 Compustat data is notoriously difficult to directly use in the estimation due to inconsistent coverage, missing data for some firms and duplicate data for others. After cleaning 4 Under IRS provision, ASC is allowed to carry back three years. 6
7 data from duplicates; selecting firms with reported R&D expenditure in at least one year in our sample; and dropping the highest and lowest 1 percent of the observations for each firm-year to remove the effects of outliers, our sample is an unbalanced panel that consists of 11,882 firmyear observations representing 3,007 firms. In order to determine whether a firm is eligible and qualified to receive an R&D tax credit, we need to obtain the value for Qualified Research Expenditure (QRE). QRE is available from the IRS Statistics of Income database, which we do not have access for. For a firm to be eligible to receive an R&D tax credit, its QRE in a given year must be greater than a base year spending amount. We use formula (1) established by Congress after 1989 to calculate the base spending amount for each year t in our sample period. 4 Base t = max {( 1 4 Sales t k) min (0.16, 2012 j=2006 Sales j 2012 )}, 0.50 QRE QRE t (1) j t=1 j=2006 In formula (1) Sales represents value of total sales for each firm-year reported in Compustat. Following the related literature, we assume that QRE equals 50% of the reported R&D expense. As discussed by Gupta et al. (2011), to be qualified, a firm must only be eligible, but also have a sufficient tax liability against which to use the credit. We use Gupta s et al. (2011) conditions to determine whether a firm is qualified to receive an R&D tax credit. In order to conduct our calculation for user cost of R&D capital, we collect data of state R&D tax credit rate. Since Minnesota became the first state to enact a R&D tax incentive in 1981, nearly all states have enacted some kind of incentive for R&D. They also have modified, expanded the incentive, and sometimes repealed and sunset it. Most states offer some version of an R&D tax credit to supplement the federal R&D tax credit incentive except the District of Columbia and six states: Alabama, Arkansas, Hawaii, Nevada, Wyoming, and Missouri, whose R&D tax credit sunset in In most cases the state credit is generally patterned after the Federal R&D tax credit in that it uses the same definitions such as qualified research expenses, base amount, and is incremental and nonrefundable in nature. For example, a majority of states use the federal definition of qualified research expense (QRE) from the internal Revenue code, Section 41, with a modification to include only expenses incurred within the state. 7
8 We survey the specifics of the R&D tax credits of the 50 states and the District of Columbia. 5 The information for each state has been gathered primarily from websites of state governments and from state tax codes. For some states with no sufficient online information, we have initiated phone and conversations with state officials for the data collection. Attempts and great efforts have been made to verify the information for each state, especially those of R&D tax credit differing from the typical QRE model. By direct communication with state tax and/or economic development officials, we correct a number of mistakes of the lists of state R&D tax credit currently available in this arena. For example, after consulting New York state officials, we realize that R&D tax credit of New York City has been widely used in relevant research and replace it by the correct New York state R&D tax credit. In very few cases, we make references to other reports. The R&D tax credit references we collected reflect the current practice of each state at the time of this paper. However, states tax credit mechanisms vary greatly in their design. Our understanding of this mechanism across states would be limited if the attention is only paid to the tax credit rate. In very few states, R&D credit is non-incremental in nature, for example in Kentucky. A few states allow taxpayers to claim some percentage of their federal credit, for example, in Nebraska. A number of states offer small businesses R&D tax credit with higher percentage of the research expense, such as Connecticut and North Carolina. Some states make some portion of their credit refundable, like Iowa. A few states choose to depart from the typical QRE model of business tax incentives. Different from most states R&D tax incentive, Mississippi offers a $1000 tax credit per employee hired by R&D companies from corporate income tax for the first five years. Sales tax exemptions are another type of incentive departing from the typical QRE model. Tennessee extends tax credits to machinery, apparatus and equipment, etc. if it is purchased primarily for the purpose of R&D. Complicated as this R&D tax credit mechanism gets, we carefully select state R&D tax credit rate, including the effective rate, lower bracket rate, and higher bracket rate for the calculation for user cost of R&D stock. Also for the purpose of calculating user cost of R&D capital, we select and compile state corporate income tax rates for the period of 2006 to 2015 from the data base of the Tax Foundation. Since many states have multiple statutory tax rates, the stepwise increase of which 5 The complete table with R&D tax credit provision for each state is available upon request from the authors. 8
9 depends on the corporate income, we follow the way of data selection by Wilson (2009) using the top marginal tax rate. In doing so, we collect state corporate income tax rate of the highest bracket from 2006 to 2014 and compile it with the state corporate income tax rates of the highest bracket of 2015 to complete the calculation of user cost of R&D stock. B. Descriptive Statistics Based on the described criteria for eligibility and qualification for R&D tax credit, we find that in our sample of the total of 11,862 firm-years 8,746 (73.7%) are eligible for any R&D tax credit; and among eligible 8,746 firm-years, 5,502 (62.9 %) are qualified for any R&D tax credit. Furthermore, using our methodology for determining whether a firm chooses to file for RRC or ASC, we find that among eligible firm-years 67.4% filed for RRC, and 32.5% filed for ASC. In Table D1 and D2 we report the descriptive statistics for characteristics of firms that chose to file for RRC and ASC respectively in our sample. Since Compustat contains data on publicly traded firms, it is not surprising that largest share of firms (33.1%) are eligible and qualified (E&Q) for RRC. Among the firms that chose to file for RRC, those that are E&Q have on average spend significantly more on R&D, have significantly larger revenues and sales, and have significantly higher tax liability relative to firms who are not eligible and not qualified (NE&NQ). Comparing these statistics to ones for firms choosing to file for ASC, we find that that the latter group of firms has notably higher R&D expenditure and significantly lower R&D intensity compared to firms that choose to file for RRC. Since R&D intensity is defined as a ratio of R&D expenditures to sales, this difference indicates that firms that choose to file for ASC undertake considerably larger R&D expenditure relative to sales. This finding is important for two reasons. First, it validates the intent of filing for ASC. Second, more importantly, it gives us confidence in our approach in determining which R&D tax credit a firm choose to file in a given year. In Table D3 we report top 10 share of eligible (E) and E&Q firms filing for RRC and ASC by state. First, find that eligibility and qualification of firms for an R&D tax credit is heterogeneous by states. Even though we report only top 10 states by share only very few states had no firms filing for R&D tax credits. Second, the share of firms that choose to file for RRC is 9
10 significantly higher compared to that of for ASC. For the top three states, all of the eligible firms chose to file for RRC, but slightly more than 30% filed for ASC. In Tables D4 and D5 we report shares of E and E&Q firms choosing to file for RRC and ASC 4-digit NAICS industries. Similar, to variation in shares by states, we find industry heterogeneity in filing for R&D tax credits. Firms that choose to file for RRC are in relatively less R&D intensive industries. For example, the average R&D intensity in fifth ranked Cement and Concrete products manufacturing for firms filing for RRC is 0.005, while the average R&D intensity similarly ranked Chemical Products and Preparation for firms choosing to file for ASC is This result suggests that there may be a differential impact of R&D tax credits on exports by industry provided that our hypothesized channel in firm-level heterogeneous changes in productivity induced in part through these credits. Furthermore, this analysis gives another way to look at validity of our R&D tax credit firm-level selection methodology that we turn to in the next section. C. Industry-level R&D Depreciation Rates Given the fact that most industries have R&D depreciation rates higher than 15% and the rate should vary across industries, U.S. Bureau of Economic Analysis has published industrylevel R&D depreciation rates for all high-tech industries (Li, 2012, Li, 2015, Li and Hall, 2016). In this research, contrary to existing research on R&D tax credit, we calculate user cost of R&D capital stock based on industry-level R&D depreciation rates. Table xx list the industry-level R&D depreciation rates (Li, 2012, 2015) that we use for each industry. III. First Stage: R&D Credit Policy A. Background In 1981, the Economic Recovery Tax Act established Section 41, which allows a nonrefundable research and development regular R&D tax credit (RRC) designed to benefit taxpayers incurring research activities. Expenses for salaries and wages, supplies, and contract research conducted on the taxpayer s behalf are considered when calculating the R&D credit. Such expenditures are known as qualified research expenditures ( QRE.) Current IRS 10
11 enforcement policies have forced tax departments and R&D functions to focus on whether they have the documentation needed to determine, as well as to sustain, R&D tax credits. This is due, in part, to the fact that the research credit is an incremental credit computed on the increase of research spending over the amount the company would be expected to spend on research (called the base amount ). Determining the base amount for the traditional credit requires companies to substantiate the amount of research spending during the years from , or for the initial years of operation (if not in existence during ). Recognizing the difficulty taxpayers faced in substantiating research spending occurring years ago, led to the enactment of the Alternative Simplified Credit (ASC) which eliminates the need to substantiate research spending occurring many years ago. On June 10, 2011 the IRS issued final regulations relating to the ASC. The final regulations generally adopt the proposed regulations issued in 2008, with minor revisions that came into effect in The ASC provides companies the opportunity to claim a credit without having to compute the historical base amount by simply quantifying their QRE for the current tax year and the previous three tax years. The base amount is 50% of the average prior three years of qualifying R&D expenditures. Taxpayers then get a credit equal to 12% (7.8% after the Section 280C(c) reduced credit adjustment) of the excess R&D spending over this base amount. This credit amount increases to 14% (net 9.1%) for tax years ending in So unless a taxpayer's R&D spending is down significantly, they would virtually be assured of getting a credit under the ASC, but may not be able to get over the traditional base amount. The specific conditions to elect filing for ASC instead of RRC are summarized in Table A1. B. Estimation With two available R&D tax credit provisions (RRC and ASC) the accurate measurement of the user cost of R&D requires determining which provision a company filed for. Importantly, once the ASC is elected for the tax year it is irrevocable, but only for that tax year, i.e., a taxpayer could not elect the ASC and then elect an amended return reporting the regular credit for the same tax year. In our data, we do not observe which credit type a firm filed for. Accordingly, we use ASC conditions in Table 1 to probabilistically determine the likelihood of filing for either ASC or RRC. We extend Gupta et al. (2011) and estimate the logistic specification (2). 11
12 STATUS it = β 0 + β 1 ln (RGDP) t + β 2 ln (SalesGrowth) it + β 3 ln(rdgrowth) it + β 4 ln(size) it + β 5 ln(mrt) it + β 6 ASC t + β 7 ASC_Cond it + β 8 (ASC t ln(size) it ) + β 9 (ASC t ASC_Cond it ) + φ j + ε it (2) In specification (2) STATUS takes the value of one if a firm (i)-year (t) is either eligible or qualified for the R&D tax credit zero otherwise; RGDP is real GDP in year (t); SalesGrowth is annual sales growth, defined as the change in sales divided by prior sales; RDGrowth is annual R&D expense growth, defined as the change in R&D expenditure divided by prior R&D expenditure; Size is firm size, measured as total assets; MRT is one-year lagged, after-financing marginal tax rate; ASC takes the value of one if a firm files for an R&D credit after 2009 and zero otherwise; ASC_Cond takes value of one if one of the ASC filing conditions holds and zero otherwise; the interactions between ASC with Size, and ASC with ASC Condition are capturing differential effect ASC introduction had on firms of various size, and ASC filing conditions respectively; φ is 4-dgit NAICS industry j fixed effect; ε is an idiosyncratic error term. Let ρ it be the predicted probability of eligibility or qualification for each firm-year observation using the Logit estimates from (1), and let ρ x be marginal post ASC introduction eligibility/qualification industry z probability evaluated at averages of observed variables in (2) such that one of the ASC filing conditions hold 6. Then a firm i is predicted to file for ASC in year t if ρ it > ρ x, and it files for RRC otherwise. 7 We report the estimation results for the specification (2) in Table R1 for the unbalanced sample. 8 In columns [1] and [4] we report eligibility and qualification probabilities without ASC filing condition respectively. We find that the coefficient on ASC is positive, but not significant for eligibility, and negative and significant for qualification. Using the odds ratios these estimates indicate that post-asc eligibility for an R&D credit (ASC or RRC) are 1.1 times pre- ASC estimated odds. Similarly, these odds are 0.9 times for qualified firms. We then interact ASC with firm size. The interaction coefficient is negative and significant, indicating that post- 6 In general, this marginal probability estimation yields four outcomes: pre ASC introduction ASC filing condition does not hold; post ASC introduction ASC filing condition does not hold; pre ASC introduction ASC filing condition holds; post ASC introduction ASC filing condition holds. We are interested in the latter combination. 7 Even though ASC was passed in 2009, IRS allowed an eligible/qualified firm to back file for ASC up to 4 years. 8 The results for balanced sample, which includes firms with observations in each year in our sample, gives similar results. 12
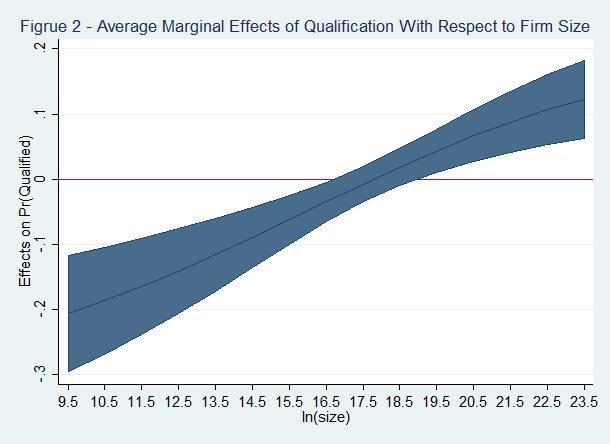
13 ASC eligibility for an R&D credit (ASC or RRC) are 0.02 times pre-asc estimated odds for larger firms. This result indicates that while introduction of ASC had no overall effect on eligibility, it met intended goal of increasing eligibility for relatively smaller firms. We illustrate the marginal effect of the change in firms size with the respect to the eligibility probability in Figure 1. The probability of qualification post-asc increases with firm size, but significantly so only for relatively large firms as illustrated in Figure 2. Since we do not specifically know the qualification conditions to apply for ASC, we focus on eligibility to probabilistically determine whether a firm chose to file for ASC or RRC. Consider the first ASC filing condition. This condition implies that firm s sales grow faster than R&D spending growth. Accordingly, we assign ASC_Cond to take value of one if a firm s sales grow faster than R&D expenditures and zero otherwise. We re-estimate specification 1, where we interact ASC introduction with the first ASC filing condition. We find that post-asc eligibility odds for firms that meet this ASC filing condition is 1.5 times pre-asc estimated odds for these firms. This result indicates that ASC introduction raised eligibility of an R&D credit for firms which are presumably ineligible for RRC. Similarly, we find that odds of post-asc qualification are also higher for firms that meet this ASC filing condition, but they are not significant. 9 The second ASC filing condition implies that the firms are more likely to apply for ASC when R&D spending growth is positive. We first confirm that firms with positive R&D growth have higher odds of eligibility and qualification for an R&D credit in columns [3] and [6] of Table R1 respectively. These eligibility and qualification odds for an R&D credit are 3.6 times, and 1.1 times higher for these firms respectively. Next, we estimate whether these odds are higher post-asc introduction. The coefficient on the interaction term ASC ASC_Cond is negative and significant for the eligibility regression. This result is surprising, as it implies that post-asc eligibility for an R&D credit are 0.5 times pre-asc estimated odds for firms with positive year-over-year R&D growth. In other words, introduction of ASC did not raise filing eligibility of R&D credit firms with increasing year-over-year R&D expenditures. We estimate the likelihood of a firm to applying for ASC as opposed to RRC using the decision rule based on the two ASC filing conditions discussed above. Using these conditions, we find that the fraction of firms filing for ASC are 64.2% and 47.3% respectively. Since ex-ante 9 We verified that these results hold for the balanced sample as well. 13
14 there is no baseline we can compare our results against, we rely on private tax consulting firms that find that the former share represents a realistic estimate of the share of firms filing for ASC in the United States. Accordingly, we select first ASC filing condition to be most likely predictor of fraction of firms choosing to select ASC in favor of RRC. C. User Cost of R&D Capital Standard economic theory assumes that R&D is an input into a firm s production function. The price of R&D can be measured using the classical Hall and Jorgensen (1967) formula for the user cost of R&D capital (per dollar of investment). Following Wilson (2009), we incorporate federal and state level R&D credits and tax levels into this formula. We also account for a specific R&D credit type that a firm in our sample is most likely to file for (i.e. RRC or ASC). The R&D user cost formula is given in (3). ρ cr it = 1 s(k st e + k ecr ft ) z t (τ e st + τ ft 1 (τ e st + τ e ft ) e ) [r t + δ z ] (3) e ecr In formula (3) the user cost for R&D for a firm (i)-year (t) depends on k st and k ft which are state R&D effective credit rates specific to state s and federal rate f that, in turn 1 if i files for ASC depends on type of the R&D credit I cr (i) = { 0 if i files for RRC filed by a firm (i); τ st e and e τ ft are effective state s and federal f effective corporate tax rates; s is the share of R&D that qualifies for preferential tax treatment or QRE which we assume to be equal s = ; z t is the present value of depreciation allowances for R&D expenditures, which we assume to be equal to z t = ; r t is long-run average rate of return, which following the related literature we assume to equal to 0.024; and δ z is the depreciation rate of R&D capital, which we use the rates based on the published BEA high-tech industry R&D depreciation rates and the rates for nonhigh-tech industries from Li (2015). In the United States the effective federal corporate tax rates is lower than actual statutory rate because the taxes a firm pay to its state are deductible from its federal tax liability. In our data, we observe firms with significant dispersion in income levels. This implies that firms tax 10 This share is consistent with evidence from IRS Statistics in Income 11 The depreciation value is taken from Wilson (2009) 14
15 liability may fall in various income tax brackets, which we considered in calculating the effective corporate federal tax rate more precisely. Furthermore, as discussed by Wilson (2009), the effective corporate state tax rates vary based on their partial or full deductibility from federal tax liability. If a state has multiple statutory tax rates, we use top marginal tax rate. Similarly, the state effective R&D tax credit rate depends on whether credit applies to all R&D expenditures (non-incremental credit) or only R&D expenditures above a designated base level (incremental credit); whether credit is recaptured (part of the credit itself is considered taxable); whether a state has a multi-tiered schedule of R&D tax credit rates. We adopt Wilson s (2009) assumptions in calculating effective state R&D tax credit. At the federal level, the effective R&D tax rate depends for a firm depends on whether it chooses to file for RRC, which is incremental since it was introduced in 1981 or ASC, which we described earlier. The rate for the former is 20%, while the rates for the latter have increased from 12% between 2006 and 2008 to 14% after For firms with no prior history of R&D expenditure, ASC rate is 6% for a year during which they conducted R&D. Our contribution to the literature that considers user cost of R&D capital effects on R&D expenditure is two-fold. First, unlike earlier studies which adopt a constant R&D depreciation rate for all industries, we calculate the user cost based on industry-level R&D depreciation rates. As shown in Table A1, these rates are heterogeneous and most are higher than 15%. This implies that the common assumption of this rate to equal 0.15 can often result in underestimating the user cost of R&D capital for most industries. Second, the approach with two different R&D tax credit types for a given total corporate tax liability allows us to isolate the impact of R&D tax credits on R&D expenditures. According to the user cost of R&D formula (3) the higher total R&D credit results in lower user cost of R&D. More precisely, consider the marginal change of R&D expenditures with respect to user of R&D for two R&D credit types as shown in (4). RD ASC ρ ASC = ε ASC RD ρ RD = εrrc ρrrc ρ ASC ; RDRRC RRC (4) In expressions (4) ε ASC is the elasticity of R&D expenditure with the respect to user cost of R&D, which we estimate in the next sub-section. Taking ratio of the marginal changes and user costs (see formula (3)) for each R&D credit type we obtain an expression (5). 15
16 RD ASC ρ ASC RD RRC ρ RRC = ε ASC ε ASC ρrrc ε tk RRC RRC ρasc ε RRC tk ASC ln ( ε ASC tk RRC ) ln (ε RRC tk ASC ) (5) In the expression (5) tk RRC = k e st errc + k ft and tk ASC = k e easc st + k ft are total effective R&D credit rates. According to the expression (5) the relative marginal change in R&D expenditure for each R&D credit type approximately equals to the log difference in R&D user cost elasticities inflated by the of total effective R&D credit rates. D. R&D Augmented TFP Estimation A. Set-up We investigate whether R&D tax credit policy increases total factor productivity (TFP) by estimating firm level production function (6), which takes into account that the current R&D investment decisions depend on the past R&D expenditures net of depreciation. Y it = f t (L it, K it, R t ) + φ it + ε it (6) In the production function (5) a firm s i-year t output Y it, is determined by the labor L it, capital stock K it, stock of R&D capital R t in period t, unobserved and to be estimated TFP φ it and idiosyncratic error term ε it. Together φ it and ε it forms the Hick s neutral productivity shock ν it. The goal of empirically estimating production function (6) is to identify the joint distribution of productivity φ it + ε it = Y it f t (L it, K it, R it ) We extend Olley and Pakes, (OP) (1996) methodology to estimate R&D augmented TFP. The related approaches by Levinsohn and Petrin, (2003) and Ghandi et. al (2013) are not suitable given the limitations of the Compustat in the lack of data on materials and intermediate inputs. Following OP approach, we assume that at the beginning of each period t + 1 a firm decides whether to continue production or exit based on the realized productivity φ it in period t. Labor L it is the only variable input, while physical capital K it, and R&D capital R it are fixed in period t, and their values are affected by the distribution of φ it in the period t. In other words, the expected productivity is a function of current productivity, physical and R&D capital stocks E[φ it+1 φ it, K it, R it ]. Since the realized productivity is observed by the firm before it makes variable factor input decisions, the estimated elasticities would be biased due to the simultaneity between output and these variable inputs. Furthermore, not accounting for the exit of nonproductive firms, gives rise to the selection bias. 16
17 To address these biases, and following OP, we estimate production function (6) in three stages. First, to control for simultaneity, we assume the inverse of investment decision rule is given in (7). φ it = I 1 (I it, K it, R it, a it ) = h(i it, K it, R it, a it ) (7) In (7), function h( ) is strictly increasing in I it and a it it the age of capital. We calculate the average age of capital by dividing the accumulated depreciation by current depreciation. 12 Following, Imrohorglu and Tuzel (2013), we smooth age by taking 3-year moving average. Substituting (7) into production function (6) gives the specification (8). This specification accounts for the simultaneity bias because we account the approximated productivity given the observed fixed factors of production at time t. Consequently, the labor elasticity β l is consistently estimated. y it = β l l it + φ(i it, k it, r it, a it ) + η it (8) In specification (8) all variables are expressed in natural logs; φ(i it, k it, r it, a it ) = β 0 +β k k it +β rd rd it + β a a it + h(i it, k it, r it, a it ), where φ( ) is a second order polynomial series in investments, capital, R&D, and age. 13 Second, to control for selection of firms into continuing serving the market, we estimate the probability that a firm i that was active in our sample in year t remains as such in year t + 1 conditional on the second order polynomial approximation series in investment, capital, R&D, and age. Third, with the predicted probability (P it ) of firms survival we use nonlinear least squares to estimate the elasticities of capital (β k ) and R&D (β rd ) in specification (9). y it β ll it = β k k it + β rd rd it + g(φ t 1 β k k it 1 β rd rd it 1, P it ) + η it (9) Similar to the earlier steps, g ( ) is approximated by the second order polynomial in φ t 1 β k k it 1 β rd rd it 1 and P it. 12 In Compustat the accumulated depreciation is measured using a variable DPACT; the current depreciation is DP. 13 Approximating with a higher order polynomial instead does not significantly change the results. 17
18 Finally, the estimated augmented for R&D TFP is given in expression (10). TFP it = exp(y it β ll it β kk it β rd rd it ) (10) B. Potential Endogeneity of R&D Investment We are concerned that the unobserved productivity shock may simultaneously impact output and R&D expenditure in the production function (6). In this case E[ν it, R it 1 ] 0, and OLS is inconsistent. Furthermore, since current R&D investment decisions depend on the past R&D expenditures R&D expenditures are characterized with a dynamic model, and usual within fixed effects estimators are biased. Accordingly, we apply dynamic panel difference generalized method of moments (GMM) estimator that uses R&D user cost as an instrument for R&D specific supply side shock to consistently estimate R&D expenditure specification in (11). We then use the policy predicted R&D expenditure as input into the production function (6) by applying perpetual inventory method to obtain R&D capital stock. r it = β 0 + β 1 r it 1 + β 2 ρ cr it + γf it + φ j + ζ t + ε it (11) In specification (11) each variable is natural logs, R&D expenditure and state s GDP deflated by GDP deflator; F it is a vector of firm specific balance sheet characteristics that include internal funds, leverage, Tobin s Q, and sales; φ is 4-dgit NAICS industry j fixed effect; ζ is the year t fixed effect; and ε is an idiosyncratic error term. 14 We report the estimates for specification (11) in Table R2. In column [1] we estimate (11) with OLS to establish the baseline. As we discussed OLS estimates are biased and inconsistent because of autoregressive change in R&D expenditure. As expected, we find that previous R&D expenditure positively affect the current level of R&D, higher user cost of R&D negatively affects R&D, and higher firm sales are positively associated with R&D expenditures. In column [2] we estimate (6) using Arellano and Bond (1991) difference two-step GMM estimator that was further developed by Arellano and Bover (1995), and Blundell and Bond (1998). We find that the R&D process is AR(1), and Sargan test for over identifying restrictions 14 See Gupta et al. (2011) on how firm level variables F it are calculated using Compustat 18
19 implies that our instruments are valid. The previous R&D expenditure positively affects current R&D, but its magnitude is roughly half that of OLS estimate. It matches the same estimate found by Wilson (2009). The user cost of R&D estimate implies that all else equal 1% increase in R&D user cost reduces R&D expenditure by 2.6%. This estimate is substantially higher than a finding by Wilson (2009). 15 However, Wilson (2009) does not estimate the relationship between R&D expenditure and user cost of R&D at the firm level, nor he differentiate depreciation rates of R&D capital between industries. Interestingly, state GDP has no significant effect on the change in R&D expenditure. The effect of firm sales on R&D expenditure is positive and almost double in magnitude as compared to the OLS estimate. To shed light on how a specific R&D tax credit policy affects R&D expenditure, we separately estimate (6) for firms that apply for ASC and RRC according to our ASC filing conditions. In column [3], we report GMM estimates for firms that choose to apply for ASC. Recall that ASC was introduced for firms without long history of R&D expenditure, which allows eliminating calculation of the base QRE. Reassuring with this policy provision, we find that previous R&D history of R&D expenditure has no effect on the current R&D expenditure for this set of firms. The user cost of R&D elasticity is roughly Turning to firms that choose to file for RRC in column [4], we find that for these firms previous R&D expenditure significantly affects current R&D expenditure. Importantly, the user cost of R&D elasticity is -1.5, which is in the range of user cost elasticities estimated by Wilson (2009), who only considers RRC. Based on the expression (4), we calculate that for a marginal firm filing for RRC the relative user cost of R&D capital is 2% lower than for a firm filing for ASC. Finally, we generate predicted R&D expenditures for each firm that are induced by R&D tax credit policy through its effect on the user cost of R&D. As discussed by Bloom et. al. (2013), a potential concern is that R&D tax credit may be endogenous is not borne out in data. Moreover, since state-level R&D tax credits have been growing at differential rates and levels across states, these state-by-year differences in generosity are seemingly uncorrelated with lagged economic or political variables. C. R&D Tax Credit Policy and TFP Our preliminary results on the effects of R&D tax credit policy showed that firms choosing to file RRC are in relatively less R&D intensive industries as compared to firms that file for ASC. 15 Wilson (2009) finds that the internal user cost elasticity of
20 We hypothesized that there may be a differential impact of R&D tax credits on exports by industry provided that our hypothesized channel in firm-level heterogeneous changes in productivity induced in part through these credits. To estimate whether there is a differential impact of RRC and ASC R&D tax credits on TFP, in specification (12) we extend specification (9) to include an interaction term with R&D capital and the R&D credit type that a firm i choose to file for in year t. y it β ll it = β k k it + β rd rd it + β rdcr rd it ASC it + g(φ t 1 β k k it 1 β rd rd it 1 β rdcr rd it 1 ASC it 1, P it ) + η it (12) In specification (12) ASC it takes value of 1 if a firm i choose to file for ASC in year t and zero otherwise; and the rest of the variables are as defined before, with second order polynomial series expansion φ( ) including the R&D tax credit interaction term. Accordingly, the estimated TFP for firms choosing to file for RRC and ASC is given in expression (13). exp(y it β ll it β kk it β rd rd it ) if ASC = 0 TFP it = { exp(y it β ll it β kk it β rd rd it β rdcr rd it ASC it ) if ASC = 1 (13) Table R3 reports the estimates for elasticities of labor (β l), physical capital (β k), and R&D capital (β rd ) after estimating 3-step OP model for Since we estimate the model using non-linear least squares, we are able to obtain these elasticities for each year in our sample. In column [3] we report elasticities from the full specification with R&D tax credit interaction term. In line with literature, we find that labor and capital elasticities of 0.8 and 0.3 respectively. The R&D elasticity is This estimate represents a lower bound, as our estimation does not take into account spillover effects of R&D. For firms that choose to file for ASC R&D elasticity increases by 0.01 on average between 2007 and Estimates for other years are similar. 20
21 Second Stage: Export Performance A. Empirical Specifications In this section we develop an empirical model of trade to test whether R&D tax credit policy affects U.S. exports. We hypothesize that R&D tax credits affect exports through its effect on productivity. Since R&D investment is a dynamic decision we expect that R&D tax credit provides enough incentive for a firm increase future R&D and thereby increase its productivity. In turn, based on the trade theory with heterogeneous firms (Melitz (2003)), more productive firms are more likely to become exporters. Among exporters, relatively more productive firms are able to export more, as they face relatively lower effects of trade barriers. Given these ideas, we predict that there are heterogeneous effects of R&D tax credits on export volumes within and between industries. To test this prediction, we set up the gravity model of trade that follows Chaney (2008). We test whether R&D tax credits distort gravity through its differential impact of TFP distributions by industries. Formally, we assume that TFP (x) shocks in industry j are distributed as Pareto with cumulative distribution function (CDF) that is given in (14). F j (x) = 1 x α j ; df j (x) = α j x α j 1 for x 1 (14) The inverse of the shape parameter α j measures the degree of heterogeneity with α j > 2 and α j > σ j 1, where σ j is elasticity of substitution between varieties in the industry j. Industries with high α are more homogeneous, in the sense that the output is concentrated among small and least productive firms. We use rank-size regressions to estimate the shape parameters α j for each 2-digit NAICS industry j. 17 Considering distribution of sales, the probability that firm i has a value of sales above a firm of a certain size falls with a rank. Thus, the firm that ranked first in terms of value of its sales will be in the tail of the distribution. It follows that there exists negative relationship 17 While we estimate our trade model at the 4-digit NAICS level of disaggregation, we do not have enough firmlevel observations within each 4-digit NAICS industry to have sufficient predictive power for the rank-size regressions. Consequently, we estimate these regressions at 2-digit NAICS level. 21
22 between rank and sales. Furthermore, the trade theory with heterogeneous firms predicts that more productive firms capture larger demand, by charging lower prices and through access to more markets. Consequently, there is exists negative relationship between sales rank and TFP. Since most productive firms have access to multiple foreign markets, there may be a difficulty in measuring the firm size. However, in the case of the United States being large and relatively closed economy, the firm size is almost entirely determined by the sales in the domestic market. Accordingly, we rank U.S. firm sales (i to N) with largest firm first in each 2-digit NAICS industry j and estimate the specification (15). ln [(Rank j i 1 2 ) /N j,rdc j] = β 0 β j TFP it + ζt + ε j with RDC {RRC, ASC} (15) In specification (15) β j is the estimate of the shape parameter for the TFP distribution of firms in the industry j that choose to file for either RRC or ASC R&D credits; the estimated TFP values (TFP it ) are obtained from the expression (11); and ζ t denotes time fixed effects that account for unobserved within industry shocks in each year t. In the industries, where firm size has lower variance (β j ) is larger, and degree of heterogeneity is lower), trade barriers should have larger negative impact on bilateral trade flows. With the estimated shape parameters of the TFP distributions by industries and R&D tax credit types, we test whether the degree of firm level heterogeneity affects the sensitivity of trade flows with the respect to trade barriers using specification (16). Each industry is comprised of firms that choose to file for either RRC or ASC R&D tax credits in any given year. Our methodology identifies such firms within each industry, and allows estimating TFP distribution shape parameters for them. Consequently, we are able to estimate marginal effects of the firm heterogeneity sensitivity between and within industries. ln(x cjt ) = Υ jt + Υ 1 B ct + Υ 2 (B ct δ j ) + ε cjt (16) In the gravity specification (14), X cjt is exports from United States to a country c by industry j in year t; Υ jt is the vector of industry j and year t fixed effects; B ct is the vector of trade barriers that includes distance, market size (as measured by real GDP in PPP terms), common language, 22
23 and border; B ct δ j is the interaction between the vector of trade barriers and the degree of firmlevel heterogeneity in each industry j; and ε cjt is the error term that is assumed to be normally distributed and orthogonal to the explanatory variables in the model. The degree of firm-level heterogeneity δ j by industry j is estimated using (15). The large δ j corresponds to a more homogeneous industry which corresponds to thinner tail of the TFP distribution. The industry and time fixed effects control for relative price on trade flows by industry and unobserved yearly trade shocks respectively. The robust standard errors are clustered by country-industry pairs to allow for shocks that affecting trade flows differ by each country within each industry. In line with standard trade theory, we expect that firm-level heterogeneity dampens the effect of trade barriers on trade flows, such that industries where the output is concentrated among few and most productive/larger firms. The converse should hold for industries with less concentrated output of firms. Finally, we expect that the firm-level heterogeneity to have similar effect on trade flows within industries. B. Results. We report the estimated shape parameters and corresponding measures of industry heterogeneity (the inverse of the shape parameters) in Table R4. Comparing our estimated parameters for two R&D credit types, we find that in industries where firms choose to file for RRC, the degree of heterogeneity is relatively lower than that for industries where firms choose to file for ASC. In other words, it appears that firms filing for ASC are more productive in these industries. Furthermore, the TFP distribution of firms that choose to file for RRC second order stochastically dominates (SSD) that for firms that choose to file for ASC. 18 Recall, that our descriptive statistics showed that firms in relatively more R&D intensive industries choose to file for ASC. Since R&D investment is associated with substantial risk taking, this result is consistent with substantial strand of literature that studies the relationship between managerial 18 A distribution with CDF F(x) second order stochastically dominates (SSD) a distribution with CDF G(x) if x F 2 (x) G 2 (x) for x [0, + ], where F 0 (x) = f(x) F 2 (x) = F 1 (x)dx. In the context of two TFP Pareto distributions we are considering, the SSD condition is satisfied when 1 (α RRC + 1) 1 (α, where α ASC + 1) RRC and α ASC are estimated shape parameter for Pareto distribution respectively. 0 23
24 incentives and R&D investment in firms. 19 This result also suggests that higher R&D tax credit rate (20%) under RRC is given to relatively small and most productive fraction of firms that likely don t benefit from these provisions as compared to less productive firms that only qualify for ASC rate of 14%. We use U.S. bilateral exports data between 2006 and 2012 to estimate the gravity specification (16). In Table R5 we report the estimated elasticities of U.S. exports with respect to the vector of trade barriers in specification (14). In column (1) we estimate this model without controlling for firm-level heterogeneity. Consistent, with standard empirical trade literature we find that U.S. exports fall with distance, rise with market size, common language and border. In columns (2) and (3) we introduce an interaction between trade barriers and firm-level heterogeneity parameters for each industry. Consistent with our prediction, we find that on average for firms filing for ASC the effect of market size (as measured by GDP) and common language is dampened, while these effects are non-significantly magnified for firms filing for RRC. Conversely, and somewhat surprising, the distance and border elasticities are nonsignificantly dampened for industries where firms file for RRC, and are magnified for firms filing for ASC. To gain better understanding of how implied firm-level heterogeneity dampens the effect of variable trade barriers on U.S. exports by industry, we estimate marginal effects over each industry in our sample. We report this estimates in Table R6. We find non-uniform marginal effects of firm-level heterogeneity distortions within and across industries induced by TFP under RRC and ASC. For example, within Computer and Electronic Products (NAICS 334) the distance reduces U.S. exports by 0.6% and by 0.7% for firms that file for ASC and RRC respectively. For firms that files for RRC across industries distance reduces U.S. exports between 0.7 and 1 percent. For firms that files for ASC across industries distance reduces U.S. exports between 0.6 and 1 percent Therefore, our analysis suggests the need for a variable R&D tax credit rate for firms even within industries insofar this credit boosts productivity and consequently dampening negative effect of trade barriers on trade flows. 19 For example, Hoskisson et al. (1993) finds negative relationship between managerial risk aversion and R&D intensity. 24
25 IV. Concluding Remarks This paper develops an empirical methodology to analyze the impact of R&D tax credits on U.S. merchandize exports. We consider two U.S. R&D tax credit provisions: regular research credit (RRC) and alternative simplified credit (ASC). They differ in the qualification requirements and stipulated rates. We empirically determine whether a firm file for RRC or ASC in a given industry and year. Given these qualifications we estimate TFP for each firm. We hypothesize that R&D tax credit act as demand shifter that induces R&D investment. In turn, R&D investment increases firm-level productivity. Based on the trade theory with firm-level heterogeneity, larger/more productive firms export in higher volume/more destinations as they face relatively dampened effect of trade barriers. While the impact of the firm-level heterogeneity on trade barriers has been studied in the trade literature across industries, our contribution is the analysis of the firm-level heterogeneity effect on trade barriers within industries. Our findings largely match our hypothesized channel of the impact of R&D tax credits on the U.S, exports. First, we find firms that choose to file for ASC are relatively more heterogeneous than firms that file for RRC both within and across industries. Second, firms that file for ASC are relatively riskier in R&D investment despite receiving lower R&D tax credit rate. Third, the effect of trade barriers on U.S. exports is dampened relatively more for firms filing for ASC as compared to firms that file for RRC within industries. It also ranges across industries that vary by the credit type. These findings indicate that the current policy of providing the same R&D tax credit rate to a firm regardless of the industry may provide insufficient incentive in boosting TFP through the additional R&D investment. While, there are still additional robustness checks remain to be conducted to strengthen the validity of our results, it is our preliminary conclusion that a more targeted R&D tax credit policy may additionally raise U.S. exports by increasing firm competitiveness through lowering trade barrier costs. 25
26 References Arrow, Kenneth. "Economic welfare and the allocation of resources for invention." In The rate and direction of inventive activity: Economic and social factors, pp Princeton University Press, Arellano, Manuel, and Stephen Bond. "Some tests of specification for panel data: Monte Carlo evidence and an application to employment equations." The review of economic studies 58, no. 2 (1991): Arellano, Manuel, and Olympia Bover. "Another look at the instrumental variable estimation of error-components models." Journal of econometrics68, no. 1 (1995): Aw, Bee Yan, Mark J. Roberts, and Daniel Yi Xu. R&D investment, exporting, and productivity dynamics. No. w National Bureau of Economic Research, Bloom, Nicholas, Mark Schankerman, and John Van Reenen. "Identifying technology spillovers and product market rivalry." Econometrica 81, no. 4 (2013): Chaney, Thomas. "Distorted gravity: the intensive and extensive margins of international trade." The American Economic Review 98.4 (2008): Cordes, Joseph J. "Tax incentives and R&D spending: A review of the evidence." Research Policy 18, no. 3 (1989): Criscuolo, Chiara, Jonathan E. Haskel, and Matthew J. Slaughter. "Global engagement and the innovation activities of firms." International Journal of Industrial Organization 28, no. 2 (2010): Feenstra, Robert C., Robert Inklaar, and Marcel P. Timmer. "The next generation of the Penn World Table." The American Economic Review (2015):
27 Gandhi, Amit, Salvador Navarro, and David Rivers. On the identification of production functions: How heterogeneous is productivity? No CIBC Working Paper, Griffith, Rachel, Stephen Redding, and John Van Reenen. "Mapping the two faces of R&D: Productivity growth in a panel of OECD industries." Review of economics and statistics 86, no. 4 (2004): Gupta, Sanjay, Yuhchang Hwang, and Andrew P. Schmidt. "Structural change in the research and experimentation tax credit: Success or failure?" National Tax Journal 64, no. 2 (2011): Hall, Bronwyn H. "R&D tax policy during the 1980s: success or failure?" In Tax Policy and the Economy, Volume 7, pp MIT Press, Hall, Bronwyn, and John Van Reenen. "How effective are fiscal incentives for R&D? A review of the evidence." Research Policy 29, no. 4 (2000): Hoskisson, Robert E., Michael A. Hitt, and Charles WL Hill. "Managerial incentives and investment in R&D in large multiproduct firms." Organization Science 4.2 (1993): Helpman, Elhanan, Oleg Itskhoki, and Stephen Redding. Wages, unemployment and inequality with heterogeneous firms and workers. No. w National Bureau of Economic Research, Helpman, Elhanan, Marc Melitz, and Yona Rubinstein. Estimating trade flows: Trading partners and trading volumes. No. w National Bureau of Economic Research, Imrohoroglu, Ayse, and Selale Tüzel. "Firm-level productivity, risk, and return." Management Science 60.8 (2014): Jones, Charles I., and John C. Williams. "Measuring the social return to R & D." Quarterly Journal of Economics (1998):
28 Jones, Charles I., and John C. Williams. "Too much of a good thing? The economics of investment in R&D." Journal of Economic Growth 5, no. 1 (2000): Klassen, Kenneth J., Jeffrey A. Pittman, Margaret P. Reed, and STEVE FORTIN. "A Crossnational Comparison of R&D Expenditure Decisions: Tax Incentives and Financial Constraints*." Contemporary Accounting Research21, no. 3 (2004): Levinsohn, James, and Amil Petrin. "Estimating production functions using inputs to control for unobservables." The Review of Economic Studies 70, no. 2 (2003): Lileeva, Alla, and Daniel Trefler. Improved access to foreign markets raises plant-level productivity... for some plants. No. w National Bureau of Economic Research, Mansfield, Edwin. "The R&D tax credit and other technology policy issues."the American Economic Review 76, no. 2 (1986): Melitz, Marc J. "The impact of trade on intra industry reallocations and aggregate industry productivity." Econometrica 71, no. 6 (2003): Olley, G. Steven, and Ariel Pakes. "The Dynamics of Productivity in the Telecommunications Equipment Industry, Econometrica 64." n1297(1996): Rao, Nirupama. "Do tax credits stimulate R&D spending? The effect of the R&D tax credit in its first decade." The Effect of the R&D Tax Credit in Its First Decade (March 8, 2015). NYU Wagner Research Paper (2015). Swenson, Charles W. "Some tests of the incentive effects of the research and experimentation tax credit." Journal of Public Economics 49, no. 2 (1992): Wilson, Daniel J. "Beggar thy neighbor? The in-state, out-of-state, and aggregate effects of R&D tax credits." The Review of Economics and Statistics 91, no. 2 (2009):
29 Appendix Condition 1. R&D spending relative to gross receipts has not kept pace with the ratio set in the "base period" that governs eligibility for the regular credit. Table A1 ASC Filing Conditions Notes (1) a company's sales increase significantly in the intervening years (2) a company enters into an additional line of business that generates additional gross receipts but performs little R&D (3) a company spends less to perform the same amount of R&D because it becomes more efficient in its R&D processes. 2. The effective rate is higher for those with increasing R&D spending from year to year, and lower for those with declining R&D spending (even though the latter holds higher total R&D spending) 3. A start-up firm with no R&D expenses in the three preceding years or one of these three years 4. High base amount under the RRC 5. Incomplete records to determine the startup base period (from the mid- 1980s) The R&D credit rate is 6% 6. A complex history of organizational activity (mergers, acquisitions and dispositions 29
30 Table A2: Depreciation Rates of R&D Assets for 35 Industries Industry NAICS Group or single NAICS 1 Agriculture, Hunting, Forestry and Fishing 1111, 1112,1113, 1114, Mining and Quarrying 2111, 2121, 2122, 2123, Food, Beverages and Tobacco 3111, 3112, 3113, 3114, 3115, 3116, 3117, 3118, 3119, Textiles and Textile Products 3131, 3132, 3133, 3141, Leather, Leather and Footwear 3161, 3162, Wood and Products of Wood and Cork 3211, 3212, , 3372, _RD [%] N/A 20 N/A N/A N/A N/A N/A Pulp, Paper, Paper, Printing and Publishing 3221, 3222 N/A 3231 N/A 5111 N/A 8 Coke, Refined Petroleum and Nuclear Fuel 3241 N/A 9 Chemicals and Chemical Products 3251, 3252, , 3255, 3256, Rubber and Plastics 3261, 3262 N/A Other Non-Metallic Mineral 3271, 3272, 3273, 3274, 3279 N/A 20 N/A indicates no R&D stock, no data or data are insufficient for calculating the R&D stock and OC stock. If you have R&D investments data for those industries, we can temporarily use 15%. 30
31 12 Basic Metals and Fabricated Metal 3311, 3312, N/A 3313, 3314, , 3322, , 3324, 3325, 3326, 3327, 3328, Machinery, Nec 3331, 3332, , 3334, 3335, 3336, Electrical and Optical Equipment , 3344, , , 3352, , Transport Equipment 3361, A A N/A 16 Manufacturing, Nec; Recycling 3391, Electricity, Gas and Water Supply 2211, 2212, N/A Construction 2361, 2362, , 2372, 2373, 2379, 2381, 2382, 2383, Sale, Maintenance and Repair of Motor Vehicles and 4411, 4412, N/A Motorcycles; Retail Sale of Fuel Wholesale Trade and Commission Trade, Except of 4231, 4232, N/A Motor Vehicles and Motorcycles 4233, 4234, 4235, 4236, 4237, 4238, 4239, 4241, 4242, 4243, 4244, 4245, 4246, 4247, 4248, 4249, Retail Trade, Except of Motor Vehicles and 4421, 4422, N/A 31
32 Motorcycles; Repair of Household Goods 4431, 4441, 4442, 4451, 4452, 4453, 4461, 4471, 4481, 4482, Hotels and Restaurants 7211 N/A 7223 N/A Inland, Water, and AirTransport, and other Supporting and Auxiliary Transport Activities; Activities of Travel Agencies 4811, 4812, 4821, 4831, 4832, 4841, 4842, 4851, 4852, 4853, 4854, 4855, 4859, 4861, 4862, 4869, 4871, 4872, 4879, 4881, 4882, 4883, 4884, 4885, Post and Telecommunications 5111, 5112, 5121, 5122, 5151, 5152, 5171, 5172, 5174, 5179, 5182, 5191 N/A 28 Financial Intermediation 5221, N/A , 5232, N/A , 5242 N/A 5251, 5259 N/A 29 Real Estate Activities 5311, 5312, N/A Renting of M&Eq and Other Business Activities , 5322, 5323, 5324, 5331 N/A N/A , 5412, , 5414, 5415, 5416, 5417, 5418, 32
33 , 5612, N/A 5613, 5614, 5615, 5616, 5617, Public Admin and Defense; Compulsory Social N/A Security 32 Education N/A 33 Health and Social Work 6211, 6212, N/A 6213, 6214, 6215, 6216, , 6222, N/A , 6232, 6233, Other Community, Social and Personal Services 5121, , 5622, N/A , 7112, N/A 7113, 7114, , 7132, N/A Private Households with Employed Persons N/A Source: Li (2012, 2015) 33
34 Firm Characteristics R&D Expense R&D Intensity Revenue Leverage Tobin's Q Sales Size Marginal Tax Rate Firm-Years Table D1 - Descriptive Statistics for Firms Choosing to File for RRC Eligible Eligible & Non- Statistic &Qualified Qualified Non Eligible & Non-Qualified Mean Std Dev Median Mean Std Dev Median Mean Std Dev Median Mean Std Dev Median Mean Std Dev Median Mean Std Dev Median Mean Std Dev Median Mean Std Dev Median Total 3,931 1, Share (%)
35 Table D2 - Descriptive Statistics for Firms Choosing to File for ASC Firm Characteristics Statistic Eligible &Qualified Eligible & Non- Qualified Non Eligible & Non-Qualified Mean R&D Expense Std Dev Median Mean R&D Intensity Std Dev Median Mean Revenue Std Dev Median Mean Leverage Std Dev Median Mean Tobin's Q Std Dev Median Mean Sales Std Dev Median Mean Size Std Dev Median Mean Marginal Tax Rate Firm-Years Std Dev Median Total Share (%)
36 Eligible & Qualified (Top 10) Eligible (Top 10) Table D3 - Share of Firms Filing for an R&D Tax Credit by State (Top 10) RRC ASC R&D Credit Condition State Share (%) State Share (%) Alaska % Maryland 31.94% West Virginia % Rhode Island 31.82% Wyoming % Oregon 31.30% Kentucky 87.27% Massachusetts 30.18% Louisiana 77.27% South Dakota 29.41% Tennessee 76.43% Connecticut 29.24% District of Columbia 73.33% North Carolina 28.16% Vermont 70.00% California 27.78% Oklahoma 68.18% New Jersey 27.74% Idaho 65.38% Washington 26.56% Kentucky 78.18% Rhode Island 27.27% Vermont 70.00% South Dakota 23.53% Oklahoma 63.64% Nebraska 21.74% Tennessee 60.51% Vermont 20.00% Louisiana 54.55% Oregon 19.85% Alabama 54.05% Connecticut 18.64% Idaho 53.85% Maryland 18.52% West Virginia 50.00% Minnesota 17.26% District of Columbia 46.67% Montana 16.67% Rhode Island 43.18% Massachusetts 16.37% 36
37 Eligible & Qualified (Top 10) Eligible (Top 10) Table D4 - Share of Manufacturing Firms Filling for RRC by Industry RRC R&D Credit Condition Industry Naics4 Share (%) Fiber, Yarn, and Thread Mills % Cut and Sew Apparel % Lime and Gypsum Products % Leather and Allied Products % Cement and Concrete Products % Fruit and Vegetable Preserving % Household Appliances % Footwear % Sugar and Confectionery Products % Animal Slaughtering % Lime and Gypsum Products % Cut and Sew Apparel % Leather and Allied Product % Sugar and Confectionery Products % Footwear % Cement and Concrete Products % Household Appliances % Furniture Related Products % Fruit and Vegetable Preserving % Motor Vehicle Body and Trailer % Notes: Industries with less than 2 firms are excluded. 37
38 Eligible & Qualified (Top 10) Eligible (Top 10) Table D5 - Share of Manufacturing Firms Filling for ASC by Industry ASC R&D Credit Condition Industry Naics4 Share (%) Cut and Sew Apparel % Bakeries and Tortilla % Steel Products % Boiler, Tank, and Shipping Container % Chemical Product and Preparation % Alumina and Aluminum Production % Reproducing Magnetic and Optical Media % Pharmaceutical and Medicine % Other Food % Railroad Rolling Stock % Bakeries and Tortilla % Alumina and Aluminum Production % Boiler, Tank, and Shipping Container % Cut and Sew Apparel % Animal Slaughtering and Processing % Textile Furnishings Mills % Steel Products % Spring and Wire Products % Railroad Rolling Stock % Iron and Steel Mills % Notes: Industries with less than 2 firms are excluded. 38
39 Table R1 - Policy Stage Logistic Estimates For Full Sample Eligible Qualified [1] [2] [3] [4] [5] [6] Real GDP ** *** *** *** (1.342) (1.334) (1.339) (1.881) (1.883) (1.888) Sales Growth 0.189*** 0.308*** 0.169*** (0.0718) (0.116) (0.0622) (0.001) (0.0007) (0.0007) R&D Growth 0.482*** 0.313*** 0.195*** (0.117) (0.0890) (0.0495) (0.0133) (0.0101) (0.0104) Size *** *** ** *** *** *** (0.0209) (0.0209) (0.0213) (0.0225) (0.0227) (0.0227) Tax Rate 0.548** *** 6.272*** 6.330*** (0.257) (0.257) (0.261) (0.334) (0.337) (0.336) ASC *** *** *** *** *** *** (0.103) (0.119) (0.110) (0.543) (0.143) (0.146) [0.292] [0.293] [0.489] [0.092] [0.578] [0.554] Tax Credit Condition *** ** (0.103) (0.0796) [0.477] [0.840] Tax Credit Condition *** (0.0891) (0.0854) [3.602] [1.041] ASCxSize *** *** * 0.134*** 0.133*** 0.129*** (0.0231) (0.0232) (0.0239) (0.0306) (0.0303) (0.0305) [0.925] [0.925] [ 1.144] [1.142] [1.137] ASCxTax Credit Condition *** (0.101) (0.123) [1.464] [1.028] ASCxTax Credit Condition *** (0.104) (0.129) [0.473] [1.150] Industry Fixed Effects (NAICS 4) Yes Yes Yes Yes Yes Yes Wald χ *** *** *** *** *** *** Pseudo R-Squared Number of Observations 9,307 9,307 9,307 6,086 6,086 6,086 Underlying Observations 14,705 14,705 14,705 11,471 11,471 11,471 Notes: Robust standard errors are in parenthesis; odds ratios in square brackets 39
40 Table R2 -R&D User Cost Estimates [1] [2] [3] [4] Full Full ASC RRC Variables OLS GMM GMM GMM R&D Expenditure Lagged 0.901*** 0.452** * (0.008) (0.233) (0.340) (0.170) R&D User Cost *** ** * * (0.453) (1.245) (1.285) (0.844) Internal Funds *** (0.0001) (0.0004) (0.002) (0.0002) Leverage * (0.002) (0.005) (0.005) (0.003) Tobin's Q (0.0005) (0.0007) (0.001) (0.0009) Marginal Tax Rate Lagged * 1.156*** (0.067) (0.163) (0.319) (0.172) Sales 0.079*** 0.139*** 0.250*** 0.112*** (0.007) (0.035) (0.063) (0.039) Industry Fixed Effects (NAICS 4) Yes No No No Year Fixed Effects Yes Yes Yes Yes R-Squared Wald χ *** 82.53*** *** Arellano-Bond test for AR(1) * Arellano-Bond test for AR(2) Sargan Test χ Number of Observations 7,182 3,094 1,599 1,495 Number of Underlying Observations 11,862 11,862 11,862 11,862 Notes: All variables are measured in natural logs. Dependent variable is natural log of R&D expenditures in all specifications Robust standard errors are in parenthesis clustered by a firm identifier 40
41 Table R3 -Production Function Estimates [1] [2] [3] Variables Labor 0.794*** 0.789*** 0.788*** (0.026) (0.026) (0.026) Capital 0.275*** 0.231*** 0.236*** (0.035) (0.054) (0.050) R&D (0.048) (0.047) R&D Tax Credit (ASC) 0.012** (0.006) Exit (0.585) (0.572) (0.575) Averages ( ) ( ) ( ) Labor Capital R&D R&D Tax Credit (ASC) Effect of R&D Tax Credit (ASC) Industry Fixed Effects (NAICS 4)x Year Effects Yes Yes Yes R-Squared (second stage) R-Squared (third stage) Number of Observations (second stage) 1,303 1,303 1,303 Number of Observations (third stage) Notes: All variables are measured in natural logs. Dependent variable is natural log of value added in the second stage Robust standard errors are in parenthesis Significance: *** (1%); ** (5%) 41
42 Table R4 - Estimated Shape Parameters and Heterogeneity Measures RRC ASC NAICS Shape Parameter Implied Heterogeneity Shape Parameter Implied Heterogeneity *** *** ** Average Notes: number of observations for each estimation varies depending on the observable number of firms in each industry and credit type Time fixed effects are included. Significance: *** (1%); **(5%) 42
43 Variables Table R5 - Gravity Distortion Estimates Induced by Firm Heterogeneity [1] [2] [3] Benchmark RRC ASC Distance (in logs) * ** *** (0.083) (0.083) (0.083) Distance*δ j ** (0.645) (0.016) Real GDP (in logs) 0.365*** 0.365*** 0.365*** (0.017) (0.018) (0.017) GDP*δ j *** (0.143) (0.003) Language 1.113*** 1.113*** 1.116*** (0.119) (0.119) (0.119) Language*δ j * (0.934) (0.024) Border 3.985*** 3.995*** 3.998*** (0.252) (0.408) (0.255) Border*δ j ** (2.214) (0.048) Fixed Effects Industry (NAICS 4) Yes Yes Yes Year Yes Yes Yes R-Squared (overall) Number of Underlying Observations 21,340 21,340 21,340 Notes: Dependent variable is natural log of Exports in all specifications δ j is the inverse of the shape parameter estimated using rank-size TFP regressions Robust standard errors are in parenthesis clustered by the importer-industry pairs Significance: ***(1%); **(5%); *(10%) 43
44 Industry Table R6 - Marginal Effects of Variable Trade Barriers on Exports by Industry No Credit RRC ASC Distance GDP Distance GDP Distance GDP 325- Chemical Manufacturing *** 0.366*** ** 0.371*** *** 0.427*** (0.083) (0.017) (0.098) (0.020) (0.129) (0.025) Computer and Electronic Products *** 0.366*** *** 0.360*** *** 0.320*** (0.083) (0.017) (0.105) (0.023) (0.112) (0.024) Transportation Equipment *** 0.366*** *** 0.360*** *** 0.320*** (0.083) (0.017) (0.105) (0.023) *** (0.024) Publishing Industries *** 0.366*** *** 0.388*** ** 0.394*** (0.083) (0.017) (0.246) (0.053) (0.096) (0.018) Notes: Standard errors are calculated using delta method Significance: **(5%); ***(1%) 44

45 45
Globalization and Inequality in Innovation: A Perspective from U.S. R&D Tax Credit Policy 1
 Globalization and Inequality in Innovation: A Perspective from U.S. R&D Tax Credit Policy 1 Maksim Belenkiy, Wendy Li, and Susan Xu 2 Date: December 22, 2017 Abstract Many OECD countries, including the
Fertility Response to the Tax Treatment of Children
 Fertility Response to the Tax Treatment of Children Kevin J. Mumford Purdue University Paul Thomas Purdue University April 2016 Abstract This paper uses variation in the child tax subsidy implicit in US
Are R&D subsidies effective? The effect of industry competition
 Discussion Paper No. 2018-37 May 9, 2018 http://www.economics-ejournal.org/economics/discussionpapers/2018-37 Are R&D subsidies effective? The effect of industry competition Xiang Xin Abstract This study
TENNESSEE TEXAS UTAH VERMONT VIRGINIA WASHINGTON WEST VIRGINIA WISCONSIN WYOMING ALABAMA ALASKA ARIZONA ARKANSAS
 ALABAMA ALASKA ARIZONA ARKANSAS CALIFORNIA COLORADO CONNECTICUT DELAWARE DISTRICT OF COLUMBIA FLORIDA GEORGIA GUAM MISSOURI MONTANA NEBRASKA NEVADA NEW HAMPSHIRE NEW JERSEY NEW MEXICO NEW YORK NORTH CAROLINA
Entrepreneurship & Growth
 Entrepreneurship & Growth David Audretsch Indiana University & CEPR Max Keilbach ZEW, Mannheim The Entrepreneur is the single most important player in a modern economy Edward Lazear (2002, p.1) 1 The Traditional
The Internet as a General-Purpose Technology
 Public Disclosure Authorized Public Disclosure Authorized Public Disclosure Authorized Public Disclosure Authorized Policy Research Working Paper 7192 The Internet as a General-Purpose Technology Firm-Level
Working Paper Series
 The Financial Benefits of Critical Access Hospital Conversion for FY 1999 and FY 2000 Converters Working Paper Series Jeffrey Stensland, Ph.D. Project HOPE (and currently MedPAC) Gestur Davidson, Ph.D.
Estimating the Economic Contributions of the Utah Science Technology and Research Initiative (USTAR) to the Utah Economy
 to the Utah Economy") Estimating the Economic Contributions of the Utah Science Technology and Research Initiative (USTAR) to the Utah Economy Prepared for The Utah Science and Research Governing Authority Prepared by Jan Elise
Estimating the Economic Contributions of the Utah Science Technology and Research Initiative (USTAR) to the Utah Economy Prepared for The Utah Science and Research Governing Authority Prepared by Jan Elise
The Life-Cycle Profile of Time Spent on Job Search
 The Life-Cycle Profile of Time Spent on Job Search By Mark Aguiar, Erik Hurst and Loukas Karabarbounis How do unemployed individuals allocate their time spent on job search over their life-cycle? While
New technologies and productivity in the euro area
 New technologies and productivity in the euro area This article provides an overview of the currently available evidence on the importance of information and communication technologies (ICT) for developments
Free to Choose? Reform and Demand Response in the British National Health Service
 Free to Choose? Reform and Demand Response in the British National Health Service Martin Gaynor Carol Propper Stephan Seiler Carnegie Mellon University, University of Bristol and NBER Imperial College,
Grants 101: An Introduction to Federal Grants for State and Local Governments
 Grants 101: An Introduction to Federal Grants for State and Local Governments Introduction FFIS has been in the federal grant reporting business for a long time about 30 years. The main thing we ve learned
Impacts of Trade liberalization on Labor allocation in Vietnam
 Trade in the Asian Century: Delivering on the Promise of Economic Prosperity Bangkok, 22-23 September, 2014 Impacts of Trade liberalization on Labor allocation in Vietnam Vu Hoang Dat The Centre for Analysis
Forecasts of the Registered Nurse Workforce in California. June 7, 2005
 Forecasts of the Registered Nurse Workforce in California June 7, 2005 Conducted for the California Board of Registered Nursing Joanne Spetz, PhD Wendy Dyer, MS Center for California Health Workforce Studies
Temporary Workers, Permanent Workers, and International Trade: Evidence from the Japanese Firm-level Data
 Temporary Workers, Permanent Workers, and International Trade: Evidence from the Japanese Firm-level Data Toshiyuki Matsuura 1 Hitoshi Sato 2 Ryuhei Wakasugi 3 1 Keio University 2 Research Institute of
time to replace adjusted discharges
 REPRINT May 2014 William O. Cleverley healthcare financial management association hfma.org time to replace adjusted discharges A new metric for measuring total hospital volume correlates significantly
BOARD OF TRUSTEES MINNESOTA STATE COLLEGES AND UNIVERSITIES BOARD ACTION. FY2006 Operating Budget and FY2007 Outlook
 BOARD OF TRUSTEES MINNESOTA STATE COLLEGES AND UNIVERSITIES BOARD ACTION FY2006 Operating Budget and FY2007 Outlook BACKGROUND The development of the FY2006 operating budget began a year ago as Minnesota
IMPACTS OF R&D TAX INCENTIVES RESULTS FROM AN OECD SURVEY AND ANALYSIS
 IMPACTS OF R&D TAX INCENTIVES RESULTS FROM AN OECD SURVEY AND ANALYSIS Fteval workshop on R&D tax incentives, Vienna, 14 Nov 2017 Silvia Appelt Economic Analysis and Statistics Division OECD Directorate
Impact of Financial and Operational Interventions Funded by the Flex Program
 Impact of Financial and Operational Interventions Funded by the Flex Program KEY FINDINGS Flex Monitoring Team Policy Brief #41 Rebecca Garr Whitaker, MSPH; George H. Pink, PhD; G. Mark Holmes, PhD University
Making the Business Case
 Making the Business Case for Payment and Delivery Reform Harold D. Miller Center for Healthcare Quality and Payment Reform To learn more about RWJFsupported payment reform activities, visit RWJF s Payment
Differences in employment histories between employed and unemployed job seekers
 8 Differences in employment histories between employed and unemployed job seekers Simonetta Longhi Mark Taylor Institute for Social and Economic Research University of Essex No. 2010-32 21 September 2010
Annex A: State Level Analysis: Selection of Indicators, Frontier Estimation, Setting of Xmin, Xp, and Yp Values, and Data Sources
 Annex A: State Level Analysis: Selection of Indicators, Frontier Estimation, Setting of Xmin, Xp, and Yp Values, and Data Sources Right to Food: Whereas in the international assessment the percentage of
GAO MILITARY BASE CLOSURES. DOD's Updated Net Savings Estimate Remains Substantial. Report to the Honorable Vic Snyder House of Representatives
 GAO United States General Accounting Office Report to the Honorable Vic Snyder House of Representatives July 2001 MILITARY BASE CLOSURES DOD's Updated Net Savings Estimate Remains Substantial GAO-01-971
Florida s Financially-Based Economic Development Tools & Return on Investment
 Florida s Financially-Based Economic Development Tools & Return on Investment January 11, 2017 Presented by: The Florida Legislature Office of Economic and Demographic Research 850.487.1402 http://edr.state.fl.us
State of Kansas Department of Social and Rehabilitation Services Department on Aging Kansas Health Policy Authority
 State of Kansas Department of Social and Rehabilitation Services Department on Aging Kansas Health Policy Authority Notice of Proposed Nursing Facility Medicaid Rates for State Fiscal Year 2010; Methodology
Rankings of the States 2017 and Estimates of School Statistics 2018
 Rankings of the States 2017 and Estimates of School Statistics 2018 NEA RESEARCH April 2018 Reproduction: No part of this report may be reproduced in any form without permission from NEA Research, except
The Tide Ahead: Upcoming Changes to Financial Aid. Midwestern Regional Forum February 2012
 The Tide Ahead: Upcoming Changes to Financial Aid Midwestern Regional Forum February 2012 Current Federal and State Issues Pell Grant expenditures have doubled since 2008-09 Increases not sustainable Federal
The Economic Impacts of the New Economy Initiative in Southeast Michigan
 pwc.com/us/nes The Economic Impacts of the New Economy Initiative in Southeast Michigan The Economic Impacts of the New Economy Initiative in Southeast Michigan June 2016 Prepared for The Community Foundation
Does Outsourcing to Central and Eastern Europe really threaten manual workers jobs in Germany?
 Does Outsourcing to Central and Eastern Europe really threaten manual workers jobs in Germany? Ingo Geishecker copyright with the author (Free University Berlin and University of Nottingham) June Kommentar
Report on the Pilot Survey on Obtaining Occupational Exposure Data in Interventional Cardiology
 Report on the Pilot Survey on Obtaining Occupational Exposure Data in Interventional Cardiology Working Group on Interventional Cardiology (WGIC) Information System on Occupational Exposure in Medicine,
The Interactive Effect of Medicare Inpatient and Outpatient Reimbursement
 The Interactive Effect of Medicare Inpatient and Outpatient Reimbursement JOB MARKET PAPER Andrew Elzinga November 12, 2015 Abstract Hospital care is characterized by inpatient and outpatient departments;
INDUSTRY STUDIES ASSOCATION WORKING PAPER SERIES
 INDUSTRY STUDIES ASSOCATION WORKING PAPER SERIES Proximity and Software Programming: IT Outsourcing and the Local Market By Ashish Arora Software Industry School Heinz School Carnegie Mellon University
Healthcare exceptionalism in a non-market system: hospitals performance, labor supply, and allocation in Denmark
 Healthcare exceptionalism in a non-market system: hospitals performance, labor supply, and allocation in Denmark Anne-Line Helsø, Nicola Pierri, and Adelina Wang Copenhagen University, Stanford University
THE ROLE OF HOSPITAL HETEROGENEITY IN MEASURING MARGINAL RETURNS TO MEDICAL CARE: A REPLY TO BARRECA, GULDI, LINDO, AND WADDELL
 THE ROLE OF HOSPITAL HETEROGENEITY IN MEASURING MARGINAL RETURNS TO MEDICAL CARE: A REPLY TO BARRECA, GULDI, LINDO, AND WADDELL DOUGLAS ALMOND JOSEPH J. DOYLE, JR. AMANDA E. KOWALSKI HEIDI WILLIAMS In
INCENTIVES AND SUPPORT SYSTEMS TO FOSTER PRIVATE SECTOR INNOVATION. Jerry Sheehan. Introduction
 INCENTIVES AND SUPPORT SYSTEMS TO FOSTER PRIVATE SECTOR INNOVATION Jerry Sheehan Introduction Governments in many countries are devoting increased attention to bolstering business innovation capabilities.
REGIONAL AND STATE EMPLOYMENT AND UNEMPLOYMENT JUNE 2010
 For release 10:00 a.m. (EDT) Tuesday, July 20, USDL-10-0992 Technical information: Employment: Unemployment: Media contact: (202) 691-6559 sminfo@bls.gov www.bls.gov/sae (202) 691-6392 lausinfo@bls.gov
how competition can improve management quality and save lives
 NHS hospitals in England are rarely closed in constituencies where the governing party has a slender majority. This means that for near random reasons, those parts of the country have more competition
Palomar College ADN Model Prerequisite Validation Study. Summary. Prepared by the Office of Institutional Research & Planning August 2005
 Palomar College ADN Model Prerequisite Validation Study Summary Prepared by the Office of Institutional Research & Planning August 2005 During summer 2004, Dr. Judith Eckhart, Department Chair for the
Follow this and additional works at: Part of the Business Commons
 University of South Florida Scholar Commons College of Business Publications College of Business 3-1-2004 The economic contributions of Florida's small business development centers to the state economy
Services offshoring and wages: Evidence from micro data. by Ingo Geishecker and Holger Görg
 Services offshoring and wages: Evidence from micro data by Ingo Geishecker and Holger Görg No. 1434 July 2008 Kiel Institute for the World Economy, Düsternbrooker Weg 120, 24105 Kiel, Germany Kiel Working
Nowcasting and Placecasting Growth Entrepreneurship. Jorge Guzman, MIT Scott Stern, MIT and NBER
 Nowcasting and Placecasting Growth Entrepreneurship Jorge Guzman, MIT Scott Stern, MIT and NBER MIT Industrial Liaison Program, September 2014 The future is already here it s just not evenly distributed
MEASURING R&D TAX INCENTIVES
 General notes OECD time-series estimates of implied marginal R&D tax subidy rates (1 minus B-index) This is an experimental indicator based on quantitative and qualitative information representing a notional
The effectiveness of R&D tax incentives
 The effectiveness of R&D tax incentives Pierre Mohnen Workshop on the revision of state aid rules for research and development and innovation (R&D&I) Indirect government support through R&D tax incentives
R H W. October 2016 Research Study
 National Center for Rural Health Works www.ruralhealthworks.org October 2016 Research Study Estimate the Economic Impact of a Rural Primary Care Physician Fred C. Eilrich, Gerald A. Doeksen, and Cheryl
Food Stamp Program State Options Report
 United States Department of Agriculture Food and Nutrition Service Fifth Edition Food Stamp Program State s Report August 2005 vember 2002 Program Development Division Food Stamp Program State s Report
Fiscal Research Center
 January 2016 Georgia s Rankings Among the States: Budget, Taxes and Other Indicators ABOUT THE FISCAL RESEARCH CENTER Established in 1995, the (FRC) provides nonpartisan research, technical assistance
Q4 & Annual 2017 HIGHER EDUCATION. Employment Report. Published by
 Q4 & Annual 2017 HIGHER EDUCATION Employment Report Published by ACE FELLOWS ENHANCE AND ADVANCE FELLOWS PROGRAM American Council on Education HIGHER EDUCATION. With over five decades of success, the ACE
EXECUTIVE SUMMARY. Global value chains and globalisation. International sourcing
 EXECUTIVE SUMMARY 7 EXECUTIVE SUMMARY Global value chains and globalisation The pace and scale of today s globalisation is without precedent and is associated with the rapid emergence of global value chains
EC International Trade Multinational Firms: an Introduction
 EC 791 - International Trade Multinational Firms: an Stefania Garetto 1 / 19 Classification Multinational firms are firms that have operations in multiple countries. A multinational firm is composed by
Settling for Academia? H-1B Visas and the Career Choices of International Students in the United States
 Supplementary material to: Settling for Academia? H-1B Visas and the Career Choices of International Students in the United States Appendix A. Additional Tables Catalina Amuedo-Dorantes and Delia Furtado
What is the Research & Development (R&D) Tax Incentive?
 Tax Incentive?") R&D TAX INCENTIVE What is the Research & Development (R&D) Tax Incentive? The R&D Tax Incentive program is the Australian Government s principle measure to enhance and increase the amount of research and
R&D TAX INCENTIVE What is the Research & Development (R&D) Tax Incentive? The R&D Tax Incentive program is the Australian Government s principle measure to enhance and increase the amount of research and
75th OREGON LEGISLATIVE ASSEMBLY Regular Session. House Bill 2933 SUMMARY
 Sponsored by Representative SHIELDS th OREGON LEGISLATIVE ASSEMBLY--00 Regular Session House Bill SUMMARY The following summary is not prepared by the sponsors of the measure and is not a part of the body
THE SPILLOVER EFFECTS OF OUTWARD FOREIGN DIRECT INVESTMENT ON HOME COUNTRIES: EVIDENCE FROM THE UNITED STATES
 Draft: Comments welcome THE SPILLOVER EFFECTS OF OUTWARD FOREIGN DIRECT INVESTMENT ON HOME COUNTRIES: EVIDENCE FROM THE UNITED STATES by Jitao Tang Quantitative Economics and Statistics Ernst&Young LLP
ICT SECTOR REGIONAL REPORT
 ICT SECTOR REGIONAL REPORT 1997-2004 (August 2006) Information & Communications Technology Sector Regional Report Definitions (by North American Industrial Classification System, NAICS 2002) The data reported
The Economics of Offshoring: Theory and Evidence with Applications to Asia. Devashish Mitra Syracuse University, NBER and IZA
 The Economics of Offshoring: Theory and Evidence with Applications to Asia Devashish Mitra Syracuse University, NBER and IZA Priya Ranjan University of California Irvine Terminology Outsourcing usually
University of Florida Foundation, Inc. Financial and Compliance Report June 30, 2016
 University of Florida Foundation, Inc. Financial and Compliance Report Contents Independent auditor s report 1-2 Financial statements Statement of financial position 3 Statement of activities 4 Statement
HEALTH WORKFORCE SUPPLY AND REQUIREMENTS PROJECTION MODELS. World Health Organization Div. of Health Systems 1211 Geneva 27, Switzerland
 HEALTH WORKFORCE SUPPLY AND REQUIREMENTS PROJECTION MODELS World Health Organization Div. of Health Systems 1211 Geneva 27, Switzerland The World Health Organization has long given priority to the careful
Food Stamp Program State Options Report
 United States Department of Agriculture Food and Nutrition Service Fourth Edition Food Stamp Program State s Report September 2004 vember 2002 Program Development Division Program Design Branch Food Stamp
SOCIO-ECONOMIC EFFECT OF TELECOMMUNICATION GROWTH IN NIGERIA: AN EXPLORATORY STUDY
 SOCIO-ECONOMIC EFFECT OF TELECOMMUNICATION GROWTH IN NIGERIA: AN EXPLORATORY STUDY AWOLEYE O.M 1, OKOGUN O. A 1, OJULOGE B.A 1, ATOYEBI M. K 1, OJO B. F 1 National Centre for Technology Management, an
Table 1 Elementary and Secondary Education. (in millions)
") Revised February 22, 2005 WHERE WOULD THE CUTS BE MADE UNDER THE PRESIDENT S BUDGET? Data Table 1 Elementary and Secondary Education Includes Education for the Disadvantaged, Impact Aid, School Improvement
Revised February 22, 2005 WHERE WOULD THE CUTS BE MADE UNDER THE PRESIDENT S BUDGET? Data Table 1 Elementary and Secondary Education Includes Education for the Disadvantaged, Impact Aid, School Improvement
Guidance for Developing Payment Models for COMPASS Collaborative Care Management for Depression and Diabetes and/or Cardiovascular Disease
 Guidance for Developing Payment Models for COMPASS Collaborative Care Management for Depression and Diabetes and/or Cardiovascular Disease Introduction Within the COMPASS (Care Of Mental, Physical, And
New Joints: Private providers and rising demand in the English National Health Service
 1/30 New Joints: Private providers and rising demand in the English National Health Service Elaine Kelly & George Stoye 3rd April 2017 2/30 Motivation In recent years, many governments have sought to increase
Service offshoring and wages: worker-level evidence from Italy
 Service offshoring and wages: worker-level evidence from Italy Elisa Borghi Università Carlo Cattaneo - LIUC Rosario Crinò Centro de Estudios Monetarios y Financieros (CEMFI) Final Workshop MIUR-PRIN Project
Asset Transfer and Nursing Home Use: Empirical Evidence and Policy Significance
 April 2006 Asset Transfer and Nursing Home Use: Empirical Evidence and Policy Significance Timothy Waidmann and Korbin Liu The Urban Institute The perception that many well-to-do elderly Americans transfer
Accounting for Government Grants
 175 Accounting Standard (AS) 12 (issued 1991) Accounting for Government Grants Contents INTRODUCTION Paragraphs 1-3 Definitions 3 EXPLANATION 4-12 Accounting Treatment of Government Grants 5-11 Capital
Fiscal Policies for Innovation and Growth
 Fiscal Policies for Innovation and Growth Chapter 2 of the April 2016 Fiscal Monitor Peterson Institute March 31, 2016 1 Growth at the frontier United States Real GDP per Capita, 1929-2030 (2009 dollars,
The Budget: Maximizing Federal Reimbursement For Parolee Mental Health Care Summary
 The 2013-14 Budget: Maximizing Federal Reimbursement For Parolee Mental Health Care MAC Taylor Legislative Analyst MAY 6, 2013 Summary Historically, the state has spent tens of millions of dollars annually
The Economic Incidence of Federal Student Grant Aid
 The Economic Incidence of Federal Student Grant Aid Web Appendices - Not for Publication January 217 Appendix A: RD Estimation with a Multidimensional Treatment This appendix provides a general example
INFOBRIEF SRS TOP R&D-PERFORMING STATES DISPLAY DIVERSE R&D PATTERNS IN 2000
 INFOBRIEF SRS Science Resources Statistics National Science Foundation NSF 03-303 Directorate for Social, Behavioral, and Economic Sciences November 2002 TOP R&D-PERFORMING STATES DISPLAY DIVERSE R&D PATTERNS
Understanding Charitable Giving and Charity Revenues
 MELBOURNE INSTITUTE Applied Economic & Social Research Understanding Charitable Giving and Charity Revenues A. Abigail Payne Director & Ronald Henderson Professor Page 1 Page 2 Why study charitable giving?
Should the Housing Choice Voucher Program Be Converted to a Block Grant?
 Should the Housing Choice Voucher Program Be Converted to a Block Grant? Edgar O. Olsen Department of Economics University of Virginia P.O. Box 400182 Charlottesville, VA 22904-4182 434-924-3443(W) 434-924-7659(F)
Federal Funding for Health Insurance Exchanges
 Federal Funding for Health Insurance Exchanges Annie L. Mach Analyst in Health Care Financing C. Stephen Redhead Specialist in Health Policy June 11, 2014 Congressional Research Service 7-5700 www.crs.gov
REGIONAL AND STATE EMPLOYMENT AND UNEMPLOYMENT MAY 2013
 For release 10:00 a.m. (EDT) Friday, June 21, USDL-13-1180 Technical information: Employment: Unemployment: Media contact: (202) 691-6559 sminfo@bls.gov www.bls.gov/sae (202) 691-6392 lausinfo@bls.gov
Department of Economics Working Paper Series. Kaitlyn R. Harger. Amanda Ross. Heather M. Stephens. Working Paper No
 Department of Economics Working Paper Series What Matters More for Economic Development, the Amount of Funding or the Number of Projects Funded? Evidence from the Community Development Financial Investment
The Effects of Medicare Home Health Outlier Payment. Policy Changes on Older Adults with Type 1 Diabetes. Hyunjee Kim
 The Effects of Medicare Home Health Outlier Payment Policy Changes on Older Adults with Type 1 Diabetes Hyunjee Kim 1 Abstract There have been struggles to find a reimbursement system that achieves a seemingly
Q:\COMP\ENVIR2\PPA90 POLLUTION PREVENTION ACT OF 1990
 POLLUTION PREVENTION ACT OF 1990 177 POLLUTION PREVENTION ACT OF 1990 (Omnibus Budget Reconciliation Act of 1990, Public Law 101 508, 104 Stat. 1388 321 et seq.) [As Amended Through P.L. 107 377, ] SEC.
REPORT ON THE ECONOMIC IMPACT OF DEFENSE-RELATED SPENDING IN ILLINOIS
 FEBRUARY 27, 2018 REPORT ON THE ECONOMIC IMPACT OF DEFENSE-RELATED SPENDING IN ILLINOIS www.illinoisdefense.org 1 About Us The Illinois Defense Network (IDN) provides resources and expertise to businesses,
Offshoring, Productivity and Export Performance
 Offshoring, Productivity and Export Performance Roger Bandick Aarhus University, Business and Social Sciences, AU Herning, Denmark and Swedish Business School, Örebro University, Sweden Abstract This paper
Do R&D Subsidies Stimulate or Displace Private R&D? Evidence from Israel saul lach
 Do R&D Subsidies Stimulate or Displace Private R&D? Evidence from Israel saul lach Do R&D Subsidies Stimulate or Displace Private R&D? Evidence from Israel 12 Saul Lach The Hebrew University and NBER July,
THE STATE OF THE MILITARY
 THE STATE OF THE MILITARY What impact has military downsizing had on Hampton Roads? From the sprawling Naval Station Norfolk, home port of the Atlantic Fleet, to Fort Eustis, the Peninsula s largest military
STATE OF MINNESOTA CAPITAL GRANTS MANUAL. A step-by-step guide that describes what grantees need to do to receive state capital grant payments
 STATE OF MINNESOTA CAPITAL GRANTS MANUAL A step-by-step guide that describes what grantees need to do to receive state capital grant payments Revised March 2010 The State of Minnesota Capital Grants Manual
An evaluation of ALMP: the case of Spain
 MPRA Munich Personal RePEc Archive An evaluation of ALMP: the case of Spain Ainhoa Herrarte and Felipe Sáez Fernández Universidad Autónoma de Madrid March 2008 Online at http://mpra.ub.uni-muenchen.de/55387/
Arizona State Funding Project: Addressing the Teacher Labor Market Challenge Executive Summary. Research conducted by Education Resource Strategies
 Arizona State Funding Project: Addressing the Teacher Labor Market Challenge Executive Summary Research conducted by Education Resource Strategies Key findings 1. Student outcomes in Arizona lag behind
GUIDELINES FOR OPERATION AND IMPLEMENTATION OF ONE NORTH CAROLINA FUND GRANT PROGRAM ( the Program )
") GUIDELINES FOR OPERATION AND IMPLEMENTATION OF ONE NORTH CAROLINA FUND GRANT PROGRAM ( the Program ) The following Guidelines for the Program are submitted for publication and comment by the Department
GUIDELINES FOR OPERATION AND IMPLEMENTATION OF ONE NORTH CAROLINA FUND GRANT PROGRAM ( the Program ) The following Guidelines for the Program are submitted for publication and comment by the Department
Do Hiring Credits Work in Recessions? Evidence from France
 Do Hiring Credits Work in Recessions? Evidence from France Pierre Cahuc Stéphane Carcillo Thomas Le Barbanchon (CREST, Polytechnique, ZA) (OECD, ZA) (CREST) February 2014 1 / 49 4 December 2008 The French
Guidelines for the Major Eligible Employer Grant Program
 Guidelines for the Major Eligible Employer Grant Program Purpose: The Major Eligible Employer Grant Program ( MEE ) is used to encourage major basic employers to invest in Virginia and to provide a significant
Employed and Unemployed Job Seekers: Are They Substitutes?
 DISCUSSION PAPER SERIES IZA DP No. 5827 Employed and Unemployed Job Seekers: Are They Substitutes? Simonetta Longhi Mark Taylor June 2011 Forschungsinstitut zur Zukunft der Arbeit Institute for the Study
Phase I 2017 NMTC Review Form. Business Strategy
 Business Strategy Products, Services and Investment Criteria (Qs. 14-16). 1. Does the Applicant clearly explain the rates, terms, and flexible features for each financial product it intends to offer in
Supplementary Material Economies of Scale and Scope in Hospitals
 Supplementary Material Economies of Scale and Scope in Hospitals Michael Freeman Judge Business School, University of Cambridge, Cambridge CB2 1AG, United Kingdom mef35@cam.ac.uk Nicos Savva London Business
RESEARCH & DEVELOPMENT TAX CREDITS FOR ASSOCIATED BUILDERS & CONTRACTORS
 RESEARCH & DEVELOPMENT TAX CREDITS FOR ASSOCIATED BUILDERS & CONTRACTORS 1 TAX POINT ADVISORS is a National Tax Consulting Firm. has 30 years of collective R&D tax incentive expertise. works closely with
WIA STATE ALLOCATION REPORT
 ALABAMA ALASKA ARIZONA ARKANSAS CALIFORNIA COLORADO CONNECTICUT DELAWARE DISTRICT OF COLUMBIA FLORIDA GEORGIA GUAM HAWAII IDAHO ILLINOIS INDIANA IOWA NATIONAL KANSAS ASSOCIATION KENTUCKY LOUISIANA OF STATE
Guidelines for the Virginia Investment Partnership Grant Program
 Guidelines for the Virginia Investment Partnership Grant Program Purpose: The Virginia Investment Partnership Grant Program ( VIP ) is used to encourage existing Virginia manufacturers or research and
The Contribution of Office, Industrial and Retail Development and Construction to the U.S. Economy
 The Contribution of Office, Industrial and Retail Development and Construction to the U.S. Economy 2008 Edition Stephen S. Fuller, PhD Dwight Schar Faculty Chair and University Professor Director, Center
Enhancing Sustainability: Building Modeling Through Text Analytics. Jessica N. Terman, George Mason University
 Enhancing Sustainability: Building Modeling Through Text Analytics Tony Kassekert, The George Washington University Jessica N. Terman, George Mason University Research Background Recent work by Terman
research paper series
 research paper series Globalisation, Productivity and Technology Research Paper 2008/20 Market Thickness, Sunk Entry Costs, Firm Heterogeneity and the Outsourcing Decision: Empirical Evidence of Manufacturing
Date: 5/25/2012. To: Chuck Wyatt, DCR, Virginia. From: Christos Siderelis
 1 Date: 5/25/2012 To: Chuck Wyatt, DCR, Virginia From: Christos Siderelis Chuck Wyatt with the DCR in Virginia inquired about the classification of state parks having resort type characteristics and, if
STATE ENTREPRENEURSHIP INDEX
 University of Nebraska - Lincoln DigitalCommons@University of Nebraska - Lincoln Business in Nebraska Bureau of Business Research 12-2013 STATE ENTREPRENEURSHIP INDEX Eric Thompson University of Nebraska-Lincoln,
Lean Options for Walk-In, Open Access, and Traditional Appointment Scheduling in Outpatient Health Care Clinics
 Lean Options for Walk-In, Open Access, and Traditional Appointment Scheduling in Outpatient Health Care Clinics Mayo Clinic Conference on Systems Engineering & Operations Research in Health Care Rochester,
NBER WORKING PAPER SERIES HOUSEHOLD RESPONSES TO PUBLIC HOME CARE PROGRAMS. Peter C. Coyte Mark Stabile
 NBER WORKING PAPER SERIES HOUSEHOLD RESPONSES TO PUBLIC HOME CARE PROGRAMS Peter C. Coyte Mark Stabile Working Paper 8523 http://www.nber.org/papers/w8523 NATIONAL BUREAU OF ECONOMIC RESEARCH 1050 Massachusetts
The U.S. Economic Crisis and a Revised New Jobs Tax Credit
 Upjohn Institute Policy Papers Upjohn Research home page 2008 The U.S. Economic Crisis and a Revised New Jobs Tax Credit Timothy J. Bartik W.E. Upjohn Institute, bartik@upjohn.org Policy Paper No. 2008-003