Consolidated Annual Performance & Evaluation Report (CAPER)
|
|
|
- Candace Burke
- 6 years ago
- Views:
Transcription
")

1 STATE OF SOUTH CAROLINA CONSOLIDATED PLAN FOR HOUSING AND COMMUNITY DEVELOPMENT Consolidated Annual Performance & Evaluation Report (CAPER) Program Year April 1, 2011 March 31, 2012 Community Development Block Grants HOME Investment Partnerships Emergency Solutions Grants Housing Opportunities for Persons with AIDS
2 STATE OF SOUTH CAROLINA CONSOLIDATED ANNUAL PERFORMANCE AND EVALUATION REPORT -- Prepared for -- United States Department of Housing and Urban Development -- Prepared by -- Grants Administration South Carolina Department of Commerce 1201 Main Street, Suite 1600 Columbia, South Carolina (803) Fax (803) TDD (803) In cooperation with -- South Carolina Department of Commerce, Grants Administration South Carolina State Housing Finance and Development Authority Office of the Governor, Office of Economic Opportunity South Carolina Department of Health and Environmental Control, STD / HIV Division June 28, 2012 POLICY OF NON-DISCRIMINATION The State of South Carolina does not discriminate on the basis of age, race, color, religion, sex, national origin, disability or familial status in the admission or access to, or treatment or employment in, its federally assisted programs or activities. Dick Scott, Department of Commerce, Grants Administration, 1201 Main Street, Suite 1600, Columbia, South Carolina 29201, telephone number (803) (Voice) or (803) (TDD), has been designated to coordinate compliance with the non-discrimination requirements of the CDBG program.
3 TABLE OF CONTENTS EXECUTIVE SUMMARY... i SECTION I - SUMMARY OF RESOURCES AND DISTRIBUTION... 1 Community Development Block Grant Program... 1 HOME Investment Partnerships Program... 7 Housing Opportunities for Persons with AIDS... 9 Emergency Shelter Grants Program SECTION II - GENERAL PERFORMANCE NARRATIVE A. Assessment of Annual Goals and Objectives Resource Constraints Table 3A Summary of Specific Annual Objectives Table 3A Summary of Specific Annual Objectives Table 3A Summary of Specific Annual Objectives Breakdown of Funds Spent in Attaining Goals and Objectives B. Affirmatively Furthering Fair Housing Actions to Address Impediments to Fair Housing Choice Accomplishments Addressing Impediments to Fair Housing Choice Affirmatively Further Fair Housing C. Affordable Housing Table 3B - State Annual Housing Completion Goals Comparison of Proposed and Actual Accomplishments Section 215 Households Served Efforts to Address Worst Case Needs Efforts to Address Accessibility Needs of Persons with Disabilities D. Continuum of Care Actions Taken to Address the Needs of Homeless Persons and Persons with Special Needs Who Require Supportive Housing Actions Taken to Prevent Homelessness and Help Homeless Persons Transition to Permanent Housing and Independent Living New Federal Resources Obtained From the Homeless SuperNOFA E. Other Actions Actions to Address Underserved Needs Actions to Foster and Maintain Affordable Housing Actions to Eliminate Barriers to Affordable Housing Actions to Overcome Gaps in Institutional Structure and Enhance Coordination Actions to Improve Public Housing and Resident Initiatives Actions to Evaluate and Reduce Lead-Based Paint Hazards Actions to Ensure Compliance with Program and Comprehensive Planning Requirements Actions to Reduce the Number of Persons Living Below the Poverty Level F. Leveraging Resources Other Public and Private Resources for Addressing Needs Identified in the Consolidated Plan Use of HUD Resources to Leverage Other Public and Private Resources Satisfaction of Matching Requirements G. Citizen Comments Received in Preparing the Performance Report H. Self-Evaluation Evaluation of Accomplishments Impact on Identified Needs Barriers to Implementing Strategies Needed Adjustments or Improvements I. Monitoring Manner and Frequency of Monitoring Activities... 91
4 SECTION III - CDBG PROGRAM NARRATIVE Use of CDBG Funds During the Program Year and Assessment of Relationship of CDBG Funds to Goals and Objectives Housing Economic Development Suitable Living Environment CDBG Progress Toward Achieving Affordable Housing Objectives CDBG Funding Benefiting Low to Moderate Income Persons Families and Persons Assisted by CDBG Funding (Civil Rights Compliance) Changes in Program Objectives Community Development Strategy Areas CDBG Program Narrative Attachments Activities not in IDIS Attachment 1 IDIS CDBG Financial Summaries Attachment 2 IDIS Activity Summary (see Addendum) SECTION IV - HOME PROGRAM NARRATIVE SECTION V - HOPWA PROGRAM NARRATIVE SECTION VI - ESG PROGRAM NARRATIVE ADDENDUM IDIS CDBG Activity Summary
5 State of South Carolina Consolidated Annual Performance and Evaluation Report Program Year 2011 EXECUTIVE SUMMARY This Annual Performance and Evaluation Report describes the State of South Carolina s affordable housing and community development achievements during program year The report covers activities and accomplishments for each of the four formula grant programs that receive funding from the U.S. Department of Housing and Urban Development (HUD) and participate in the consolidated planning process. The four HUD programs are: Community Development Block Grant (CDBG) administered by the SC Department of Commerce, HOME Investment Partnerships (HOME) administered by the SC Housing Finance and Development Authority, Housing Opportunities for Persons with AIDS (HOPWA) administered by the SC Department of Health and Environmental Control, and Emergency Shelter Grant (ESG) administered by the Governor s Office of Economic Opportunity. Combined, the four programs committed a total of $37.1 million in HUD funds to program recipients. More detail on the resources available for each program and the amounts committed and expended during the program year can be found in Section I Summary of Resources and Distribution of Funds. CDBG, HOME, HOPWA and ESG funds were awarded during the year for activities consistent with the State s five year plan for housing and community development, or the Consolidated Plan. The Consolidated Plan identifies the highest priority needs in South Carolina as: availability, affordability and sustainability of decent housing, availability and sustainability of economic opportunity, and availability and sustainability of a suitable living environment for all state residents. The Plan also identifies specific strategies and goals for addressing these needs. Projects that received funding in 2011 represent measurable progress toward accomplishing annual PY 2011 goals. Section II addresses performance by the four programs in detail, including actual accomplishments compared with goals, actions taken relative to fair housing and affordable housing, and actions taken to maintain the Continuum of Care for homeless persons and persons in need of supportive housing. Section II also discusses other funds available to the state and actions by the State as a whole which are pertinent to the Consolidated Plan. Major 2011 initiatives undertaken by CDBG and HOME will primarily benefit the State s low and moderate income (LMI) residents. Projects will develop new affordable housing for owners and renters, make existing affordable housing more sustainable by connecting them to public infrastructure, and make rental and homeownership affordable through down payment and closing cost assistance. Projects funded by CDBG will also result in new economic opportunity in the form of new jobs, as well as stronger and more economically competitive communities as a result of revitalizing commercial centers, eliminating obstacles to economic development, and developing or improving workforce development resources. Finally, CDBG funds in 2011 continued to be focused on building viable, safer and more sustainable living environments and communities as a result of public infrastructure, comprehensive neighborhood improvements implementing earlier funded plans to address a variety of public facilities, services and safety needs, and planning State of South Carolina Consolidated Annual Performance & Evaluation Report Executive Summary Program Year: April 1, 2011 March 31, 2012 Page i
6 EXECUTIVE SUMMARY ESG initiatives during the year provided support for existing emergency shelters in the State, benefiting homeless persons and persons at risk of being homeless. ESG assistance allowed facilities to continue operating, sheltering the homeless and providing needed services such as food pantries, soup kitchens and meal distribution, mental health and alcohol/drug programs, health and child care, and outreach. Homeless prevention was a secondary initiative aimed at maintaining a permanent residence for those at risk of becoming homeless. Another major initiative was to prepare for implementation of the new Emergency Solutions Grant program in HOPWA initiatives focused on addressing the housing needs of people living with HIV/AIDS, through the provision of tenant based and short-term emergency rental assistance and supportive services to promote independent living, which can include case management, employment services and transportation. Under a second initiative, HOPWA continued to support community based, transitional and supportive housing facilities to ensure housing options for people living with HIV/AIDS. Significant accomplishments were achieved by each program. These are summarized on Table 3A which can be found in Section II A Assessment of Annual Goals and Objectives, beginning on page 15. Highlights include: Affordable rent or home purchase for 452 LMI households 148 new affordable homes or rental units for LMI households New or improved transitional or supportive housing for 104 special needs households More sustainable, existing affordable housing for 559 LMI households as a result of exterior repairs and/or connection to safe and reliable public water and sewer Better living conditions for residents of 39 rural communities as a result of new or upgraded public infrastructure or flood and drainage improvements Safer, more viable and sustainable neighborhoods as a result of revitalization projects in 11 neighborhoods and development of plans for such improvements in 5 additional communities, to benefit 3,771 (69%) LMI residents 15 new jobs primarily for LMI residents and support for 29 programs and services that improve access to jobs for LMI persons Improved economic competitiveness for 23,306 residents of 6 rural communities where an existing industry will expand, obstacles to economic development will be removed, in town commercial centers revitalized, and resources for workforce skills training and education improved by expanding or renovating libraries Emergency or longer term rental assistance to ensure decent housing for 461 people living with HIV/AIDS Supportive services for 1,040 people living with HIV/AIDS Emergency shelter and services for 20,403 homeless persons and prevention of homelessness for 648persons at risk of becoming homeless Use of HUD resources to leverage an additional $28.1 million in other federal, state, local and private investment. CDBG leveraged funding equal to 36.5% of grants awarded and three and a half times the match program requirement Greater detail is provided in Section II and in the program specific sections: Section III CDBG Program Narrative, Section IV HOME Program Narrative, Section V HOPWA Program Narrative and Section VI ESG Program Narrative State of South Carolina Consolidated Annual Performance & Evaluation Report Executive Summary Program Year: April 1, 2011 March 31, 2012 Page ii
7 SECTION I - SUMMARY OF RESOURCES AND DISTRIBUTION COMMUNITY DEVELOPMENT BLOCK GRANT PROGRAM Program: Administering Agency: Community Development Block Grant (CDBG) SC Department of Commerce, Grants Administration Funds Available: $20,178,730 Funds Committed: $24,704,244 Funds Expended: $20,942,265 Geographic Distribution: Statewide Total Funds Available CDBG funds available for awards during program year 2011 included $20,112,730 available from the 2011 allocation, which represents a substantial reduction from 2010 funding, plus program income. These funds, along with recaptured funds, were made available through a largely competitive awards process, as described below in the Geographic Distribution section, for projects that would further the objectives of the State of South Carolina Consolidated Plan. The State has 15 months from the time of award to obligate its 2011 allocation. Total Funds Committed During program year 2011, a total of $24,497,639 in CDBG funds was awarded for 72 new grants. Awards were made from the 2011 allocation, as well as other open allocations where recaptured funds were available. Funds were also awarded to open grants where additional project activities were required or cost overruns necessitated additional funds, resulting in a total amount committed of $24,704,244. Total Funds Expended A total of $20,942,265 was expended during the program year for open grants and program administration. Grants open during 2011 included grants funded out of the current allocation, as well as earlier open fund allocations. Funds expended included both program income and CDBG funds. Geographic Distribution The South Carolina CDBG program does not allocate funds to specific geographic areas. Instead, the State seeks to fund projects that will have the greatest impact and best contribute toward meeting the objectives outlined in the State s Consolidated Plan. During 2011, CDBG funds were awarded for projects eligible under program categories described in the State s 2011 Program Description. Grant funds were awarded on a non-competitive basis for Regional Planning, Ready to Go and Economic Development projects. The Community Development Program is competitive and two funding rounds were held in All units of general local government in South Carolina were eligible to apply for CDBG Community Development, Planning and Economic Development program funds, with the 2011 State of South Carolina Consolidated Annual Performance & Evaluation Report Section I Program Year: April 1, 2011 March 31, 2012 Page 1

8 SECTION I SUMMARY OF RESOURCES AND DISTRIBUTION exception of: a) communities that participate in the CDBG Entitlement program and receive their CDBG funds directly from HUD; and b) qualifying urban counties that receive CDBG funds directly from HUD for unincorporated areas and communities that have elected to participate with the county. In 2011, those not eligible to apply included the nine largest urban cities in the state and six urban counties. Not all eligible local governments can apply every year, however. Threshold requirements under the competitive programs generally allow no more than two open grants per local government, and local governments are encouraged to complete projects in a timely manner prior to reapplying. As a result, geographic distribution can be measured only at the end of the program year after all competitive funding rounds are complete and all Economic Development applications have been awarded. In 2011, new CDBG grant awards were distributed throughout the state to 59 different local governments. One or more local governments in 34 of the 44 South Carolina eligible, nonentitlement counties received funding for Community Development, Economic Development and/or Planning projects. The majority of all funds, or 84%, went to local governments in counties designated as lesser developed by the South Carolina Department of Revenue. The most developed Tier 1 counties represented only 16% of all grants awarded. County rankings for 2011 are shown on the map below. Counties are ranked each year and assigned a development designation based on per capita income and unemployment rankings, as well as other factors affecting a county s distress and 2011 State of South Carolina Consolidated Annual Performance & Evaluation Report Section I Program Year: April 1, 2011 March 31, 2012 Page 2
9 SECTION I SUMMARY OF RESOURCES AND DISTRIBUTION development status. Total CDBG funds awarded to local governments in each development tier, for new grant awards in 2011, are summarized below. Distribution of 2011 New CDBG Grant Awards By County Development Designation Number of Total Amount Awarded Development Designation Projects Percent by Grouped Status Tier 4 (least developed) 17 $4,939,379 Tier 3 31 $9,930,658 84% Tier 2 16 $5,610,327 Tier 1 (most developed) 8 $4,017,275 16% Totals 72 $24,497,639 The chart below and on the following pages lists each new CDBG grant awarded in 2011 by locality and county, and these localities are illustrated on a map that follows the table. Community Development Block Grant Program New Grant Awards from April 1, 2011 through March 31, 2012 From 2011 and Other Open Allocations Map # Locality County Activity Amount 1 Town of Andrews Georgetown Infrastructure 500,000 2 Town of Aynor Horry Clearance 89,482 4 Beaufort County Beaufort Infrastructure 422,500 5 City of Bennettsville Marlboro Planning 25,000 6 City of Bennettsville Marlboro Infrastructure 497,500 7 Berkeley County Berkeley Planning 70,000 8 Berkeley County Berkeley Public Facilities 500,000 9 City of Bishopville Lee Neighborhood Revitalization 427, Town of Blacksburg Cherokee Infrastructure 500, Town of Blackville Barnwell Planning 24, Town of Blackville Barnwell Infrastructure 495, City of Camden Kershaw Neighborhood Revitalization 500, City of Camden Kershaw Infrastructure 500, Cherokee County Cherokee Planning 50, Cherokee County Cherokee Infrastructure 500, City of Chester Chester Neighborhood Revitalization 359, City of Clemson Pickens Infrastructure 305, State of South Carolina Consolidated Annual Performance & Evaluation Report Section I Program Year: April 1, 2011 March 31, 2012 Page 3
10 SECTION I SUMMARY OF RESOURCES AND DISTRIBUTION Map # Locality County Activity Amount 19 City of Darlington Darlington Neighborhood Revitalization 496, City of Denmark Bamberg Infrastructure 495, Dillon County Dillon Planning 50, Town of Elloree Orangeburg Infrastructure 484, Town of Estill Hampton Infrastructure 422, City of Gaffney Cherokee Neighborhood Revitalization 500, Georgetown County Georgetown Planning 50, Georgetown County Georgetown Infrastructure 500, City of Greenwood Greenwood Clearance 500, City of Greenwood Greenwood Infrastructure 231, Greenwood County Greenwood Planning 50, Greenwood County Greenwood Infrastructure 500, Hampton County Hampton ED 165, Hampton County Hampton Planning 50, City of Hardeeville Jasper Drainage 500, Town of Harleyville Dorchester Infrastructure 500, City of Hartsville Darlington Neighborhood Revitalization 500, City of Hartsville Darlington Infrastructure 241, Town of Heath Springs Lancaster Infrastructure 461, Town of Hemingway Williamsburg Infrastructure 283, Town of Iva Anderson Infrastructure 443, Town of Jonesville Union Infrastructure 500, City of Lancaster Lancaster Downtown revitalization 500, Lancaster County Lancaster Planning 59, Laurens County Laurens Infrastructure 500, City of Liberty Pickens Infrastructure 500, Town of Lockhart Union Infrastructure 500, McCormick County McCormick Infrastructure 110, Town of Moncks Corner Berkeley Planning 25, Newberry County Newberry Planning 50, Orangeburg County Orangeburg Planning 77, Town of Perry Aiken Infrastructure 499, City of Pickens Pickens Neighborhood Revitalization 500, Town of Ridgeland Jasper Infrastructure 429, Town of Saluda Saluda Infrastructure 500, State of South Carolina Consolidated Annual Performance & Evaluation Report Section I Program Year: April 1, 2011 March 31, 2012 Page 4
11 SECTION I SUMMARY OF RESOURCES AND DISTRIBUTION Map # Locality County Activity Amount 54 Town of Sellers Marion Public Facilities 50, Town of St. Matthews Calhoun Infrastructure 321, Town of St. Stephen Berkeley Infrastructure 500, Town of Stuckey Williamsburg Infrastructure 494, Town of Summerton Clarendon Neighborhood Revitalization 495, Sumter County Sumter Planning 50, Town of Timmonsville Florence Infrastructure 500, Town of Turbeville Clarendon Neighborhood Revitalization 470, City of Union Union Neighborhood Revitalization 500, City of Union Union Infrastructure 243, Union County Union Planning 25, Union County Union Infrastructure 500, Town of Varnville Hampton Infrastructure 190, City of Walterboro Colleton Neighborhood Revitalization 500, City of Walterboro Colleton Infrastructure 340, Town of Ware Shoals Greenwood Infrastructure 450, Town of West Pelzer Anderson Infrastructure 447, Town of Whitmire Newberry Planning 25, Town of Williamston Anderson Infrastructure 447,611 Total 24,497, State of South Carolina Consolidated Annual Performance & Evaluation Report Section I Program Year: April 1, 2011 March 31, 2012 Page 5
12 SECTION I SUMMARY OF RESOURCES AND DISTRIBUTION Location Map of CDBG Grants Awarded April 1, 2011 through March 31, 2012 Note 1 Shaded Areas: Shading on the map above indicates entitlement counties and municipalities that receive funds directly from HUD and are not eligible for the State CDBG Program. Charleston, Greenville and Horry Counties, and all municipalities within those counties, are ineligible. Other ineligible municipalities include Aiken, Anderson, Cayce, Columbia, Conway, Florence, Myrtle Beach, Rock Hill, Spartanburg, Sumter and West Columbia. Note 2 Darker Outlined Counties: Unincorporated areas in these counties, as well as some cities, also receive funds directly from HUD and are not eligible for the State CDBG Program. Only incorporated areas in these counties are eligible, generally with the exception of those listed in Note 1 and shaded on the map above. Note 3 County Recipients indicated by darker shaded dots, with the location corresponding to the county seat State of South Carolina Consolidated Annual Performance & Evaluation Report Section I Program Year: April 1, 2011 March 31, 2012 Page 6
13 SECTION I SUMMARY OF RESOURCES AND DISTRIBUTION HOME INVESTMENT PARTNERSHIPS PROGRAM Program: Administering Agency: HOME Investment Partnerships (HOME) SC State Housing and Finance Development Authority (SHFDA) Funds Available*: $11,922,241 Funds Committed: $8,826,403 Funds Expended: $15,386,007 Geographic Distribution: Statewide Funds Available During the program year, funds available included $6,922,241 from the 2011 allocation, which represents a significant reduction over the 2010 allocation, funds carried forward or recaptured from prior year allocations and program income, which includes money earned through HOME activities including monthly payments from previous low interest loans awarded. Program income is added to the HUD allocation annually, and the total amount is then divided among the HOME eligible activities. All activities are consistent with priority needs and objectives identified in the State s Consolidated Plan for addressing those needs. *The figure shown in funds available above corresponds to the 2011 HOME allocation plus the amount shown on IDIS PR01 for program year 2011 program income ($5,512,220.39). Funds Committed SHFDA committed a total of $8,826,403in HOME funds and program income funds during the program year, as follows: $899,200, including 694,132 in HOME program income, was allocated to down payment and closing cost assistance to help make homeownership affordable. An additional $312,000 was awarded from regular HOME funds for three homeownership projects involving new construction, acquisition and/or down payment and closing cost assistance. $7,005,976 million was awarded for 14 rental projects that will result in 129 new affordable rental units. Funds were awarded during the regular competitive cycle and the combined funding cycle for HOME and the Low Income Housing Tax Credit (LIHTC) program. This funding leveraged LIHTC and State Housing Trust Fund investments that will result in an additional 484 rental units, bringing the total number of new rental units to 613. $271,905 was awarded to two Public Housing Authorities through the noncompetitive Tenant Based Rental Assistance program, and an additional $940,022was allocated to the Rental Assistance Division s security deposit and TBRA programs. Funds Expended According to IDIS reports as of March 31, 2012, HOME funds and program income expended during the program year totaled $15,386, State of South Carolina Consolidated Annual Performance & Evaluation Report Section I Program Year: April 1, 2011 March 31, 2012 Page 7
14 SECTION I SUMMARY OF RESOURCES AND DISTRIBUTION Geographic Distribution Recipients of HOME funds in 2011 included nonprofits, for profits, CHDO s and Housing Authorities and were distributed throughout the state, as shown on the chart below. Applicant 2011 HOME Awards County Type of Applicant Project Type Award Amount Arcadia Park Apartments (CDG of SC, LP) Richland For Profit Rental $800,000 Charleston Housing Authority Berkeley & Charleston PHA TBRA $96,905 Chestnut Pointe Sumter For Profit Rental $650,000 Clarendon County CDC Clarendon Nonprofit Homeownership $90,000 Clarendon County CDC Clarendon Nonprofit CHDO Operating $45,000 Cloverfield Estates Greenville For Profit Rental $600,000 Community Assistance Provider Newberry CHDO Homeownership $180,000 Community Assistance Provider Newberry CHDO CHDO Operating $40,000 Cypress Lane Apartments Georgetown For Profit Rental $390,000 Ft. Mill Housing Authority Lancaster & York PHA TBRA $175,000 Genesis Homes Greenville Nonprofit Rental $237,003 Genesis Homes Greenville Nonprofit CHDO Operating $50,000 Greenville Housing Futures Greenville Nonprofit Rental $126,190 Greenville Housing Futures Greenville Nonprofit CHDO Operating $50,000 Homes of Hope Anderson Nonprofit CHDO Operating $50,000 Homes of Hope Anderson Nonprofit Rental $337,378 Homes of Hope Lora Lake Greenville Nonprofit Rental $287,510 Lowcountry Housing & Redevelopment Corp. Beaufort Nonprofit Rental $247,895 Merrimack Heights Berkeley For Profit Rental $750,000 Pelham Village Greenville For Profit Rental $360,000 Pickens County Habitat for Humanity Pickens Nonprofit Homeownership $42,000 Pickens County Habitat for Humanity Pickens Nonprofit CHDO Operating $21,000 Summerville Garden Berkeley For Profit Rental $800,000 Wecott Place Lexington For Profit Rental $800,000 Wellington Estates Aiken For Profit Rental $620, State of South Carolina Consolidated Annual Performance & Evaluation Report Section I Program Year: April 1, 2011 March 31, 2012 Page 8
15 SECTION I SUMMARY OF RESOURCES AND DISTRIBUTION HOUSING OPPORTUNITIES FOR PERSONS WITH AIDS Program: Housing Opportunities for Persons with AIDS (HOPWA) Administering Agency: SC Department of Health and Environmental Control STD/HIV Division (DHEC) Funds Available: $1,728,286 Funds Committed: $1,781,253 Funds Expended: $1,736,380 Geographic Distribution: Statewide Funds Available A total of $1,728,286 was available for distribution during the 2011 program year from the 2011 HOPWA allocation. No program income was received by DHEC. Funds Committed Funds committed during program year 2011 totaled $1,781,253 and included both the 2011 allocation and funds carried forward from prior years.. All funds were committed to regional Ryan White Care Providers and/or eligible non-profit organizations that collaborate closely with Ryan White Care Providers and assist persons with HIV/AIDS. Funds Expended The HOPWA Program expended a total of $1,736,380during the year for eligible program activities and administration. Geographic Distribution The state HOPWA program serves all areas of South Carolina with the exception of Columbia and Charleston, which receive HOPWA funding directly from HUD. The state program has sponsors in all other areas of the state. These HOPWA project sponsors, and the counties and activities they serve, are listed below: HOPWA Funded Activities Project/ Sponsor Counties Served STRMU Supportive Services TBRA Housing Amount AID Upstate Anderson, Greenville, X X X $198,335 Oconee and Pickens AID Upstate Statewide Community X X X $120,000 Care Facility Piedmont Care Cherokee, Spartanburg X X X $77,797 and Union Cooperative Ministry Clarendon, Lee, X X X $42,174 Newberry and Sumter University of South Newberry X $75,559 Carolina Dept. of Medicine Hope Health Chesterfield, Darlington, Dillon, Florence, Marion and Marlboro X X X $159, State of South Carolina Consolidated Annual Performance & Evaluation Report Section I Program Year: April 1, 2011 March 31, 2012 Page 9
16 SECTION I SUMMARY OF RESOURCES AND DISTRIBUTION Project/ Sponsor Counties Served STRMU Supportive Services TBRA Housing Amount Lowcountry Care Beaufort, Colleton, X X X $79,340 Consortium - ACCESS Hampton and Jasper, HopeHealth Lower Allendale and Barnwell X X X $23,013 Savannah Catawba Care Chester and Lancaster X X X $23,800 Coalition HopeHealth Edisto Bamberg and X X X $76,405 Orangeburg Upper Savannah Abbeville, Greenwood, X X X $49,632 Care Services Laurens, and McCormick CARETEAM Georgetown, Horry and X X X $129,684 Williamsburg Region 4 Clarendon, Kershaw, Lee X $46,619 and Sumter Sumter Family Health Clarendon, Kershaw, Lee X $21,780 Center Fort Mill Housing Services, Inc. and Sumter All SC counties except Richland, Lexington, Aiken, York, Fairfield, Edgefield, Kershaw, Calhoun, Saluda X X $600, State of South Carolina Consolidated Annual Performance & Evaluation Report Section I Program Year: April 1, 2011 March 31, 2012 Page 10
17 SECTION I SUMMARY OF RESOURCES AND DISTRIBUTION EMERGENCY SHELTER GRANTS PROGRAM Program: Administering Agency: Emergency Shelter Grants (ESG) Program Office of the Governor, Office of Economic Opportunity Funds Available: $1,542,347 Funds Committed: $1,467,072 Funds Expended: $1,153,541 Geographic Distribution: Statewide Funds Available ESG funds available during the program year included $1,542,347 from the 2011 allocation plus funds remaining from the 2010 allocation. Additional 2011 funds for the Emergency Solutions Grant Program were announced but not allocated to the state until after the end of the program year. All ESG funds were made available through a competitive awards process for projects that would help achieve the objectives outlined in the State s Consolidated Plan. Funds Committed In 2011, the ESG program committed a total of $1,467,072 to 31 eligible nonprofit, homeless shelter and homeless service organizations. Funds Expended The ESG program year and the Consolidated Plan program year do not coincide. The ESG program year runs from July 1 through June 15, and for the current 2011 program year, ESG grant awards were issued to subgrantees on July 1, All funds are to be expended by June 15, As of the end of the Consolidated Plan program year, or March 31, 2012, $1,153,541 in ESG funds had been expended. Geographic Distribution ESG is a competitive program. Therefore, geographic distribution is based on applications received and the results of the project selection process. The 2011 competitive cycle resulted in awards to 31 subgrantees located throughout the state. The locality, agency, project type and amount of each grant award are shown on the following page(s) State of South Carolina Consolidated Annual Performance & Evaluation Report Section I Program Year: April 1, 2011 March 31, 2012 Page 11
18 SECTION I SUMMARY OF RESOURCES AND DISTRIBUTION EMERGENCY SHELTER GRANTS PROGRAM 2011 Sub-Grantees Homeless Prevention PROJECT TYPE Supportive Services Operational Assistance HMIS LOCALITY AGENCY AMOUNT Aiken Cumbee Center X X $45,000 Aiken Salvation Army Aiken X X $30,000 Anderson Anderson Interfaith Ministries X $65,000 Anderson Anderson Sunshine House X X $10,000 Beaufort Citizens Opposed to Domestic Abuse X X $48,188 Charleston Crisis Ministries X X $110,000 Columbia Cooperative Ministry X X $55,000 Columbia Family Shelter X X $50,000 Columbia Salvation Army Midlands X $50,000 Columbia St. Lawrence Place/Trinity Housing X $25,000 Columbia The Women s Shelter X $60,000 Florence House of Hope of the Pee Dee X X X $40,000 Florence Pee Dee CAA X X X $50,000 Florence Pee Dee Coalition ADSA X X $55,000 Greenville Safe Harbor, Inc. X $45,000 Greenville Salvation Army - Greenville X $50,000 Greenville SHARE, Inc. X X $55,000 Greenville Upstate Homeless Coalition X X X $87,832 Greenwood MEG s House X X $50,000 Hartsville Darlington County CAA X $45,000 Lancaster Family Promise of Lancaster X $24,214 Laurens Laurens County SAFE Home X $40,000 Orangeburg Samaritan House X X X $40,000 Rock Hill Family Promise of Rock Hill X $35,000 Rock Hill The Haven Men s Shelter X X $20,000 Rock Hill Safe Passage X X $15,000 Spartanburg Spartanburg Interfaith Hospitality X X X $30,000 Network SPIHN Spartanburg Safe Homes-Rape Crisis X X $50,000 Coalition Spartanburg The Haven, Inc. X X X $40,000 Walterboro Lowcountry CAA-Safe Haven X $55,000 West Columbia Sistercare, Inc. X X X $91,838 Note: ESG is a competitive program and geographic distribution is based on applications received and the results of the project selection process State of South Carolina Consolidated Annual Performance & Evaluation Report Section I Program Year: April 1, 2011 March 31, 2012 Page 12
19 SECTION II - GENERAL PERFORMANCE NARRATIVE A. Assessment of Annual Goals and Objectives The South Carolina Consolidated Plan for Housing and Community Development was developed after citizen input and interagency consultation. In the plan, the state identified three broad priority needs related primarily to low and moderate income residents in South Carolina, which are consistent with HUD s three key objectives: Provide decent housing, Create suitable living environments, and Expand economic opportunities The state also identified specific objectives to address these priority needs over the five-year period covered by the Consolidated Plan. These objectives were developed within the HUD Performance Measurement System framework, which was implemented to comply with the mandate that all federal agencies measure the outcomes of their programs. The Performance Measurement System allows HUD to aggregate local and regional accomplishments to convey the impact of CDBG, HOME, HOPWA and ESG investments across the country, and it also provides for a common set of general outcomes. The State s objectives therefore not only address priority needs in South Carolina, but also the three HUD outcomes, as follows: Availability/accessibility making new or improved infrastructure, services, public facilities, housing, shelter, other basics of daily living, jobs or economic opportunity available or accessible, or more available or accessible, to low and moderate income people, including those with disabilities, in the areas where they live. Affordability improving the affordability or lowering the cost to obtain or maintain housing, a suitable living environment or economic opportunity through a variety of means, such as: making basic infrastructure more affordable by lowering the cost, providing assistance to develop or finance more affordable housing choices or to lower the cost of housing, reduce the cost of community services like fire protection by improving ISO ratings and lowering insurance costs, etc. Sustainability preserving existing housing, infrastructure and community facilities that directly contribute to quality of life and making them more sustainable, through activities such as owner and renter housing rehabilitation, repairs or energy efficiency improvements, upgrading deteriorated, dilapidated and/or inadequate infrastructure and facilities and improving their ability to support a suitable living environment, as well as businesses and jobs necessary to create economic opportunity, revitalizing and improving communities and neighborhoods, eliminating obstacles to economic growth and competitiveness, and overall making communities and neighborhoods more livable, more viable, more economically diverse and more sustainable, especially for low and moderate income persons. To ensure measurable progress toward these outcomes, a five-year Strategic Plan was developed as part of the Consolidated Plan. The plan outlines a variety of strategies that may be undertaken during the planning period, and each year s Annual Action Plan then identifies the 2011 State of South Carolina Consolidated Annual Performance & Evaluation Report Section II-A Program Year: April 1, 2011 March 31, 2012 Page 13
20 SECTION II GENERAL PERFORMANCE NARRATIVE A Assessment of Annual Goals and Objectives particular strategies and actions to be undertaken during the year, as well as quantifiable goals or expected outcomes. Resource Constraints An important note in the Strategic Plan is that resource constraints, shifting priorities and uncertainty about funding commitments may limit the state s ability to undertake all of the strategies described in the Consolidated Plan, and in some cases result in accomplishments below anticipated levels. Another important note involves timing. Because the state s program year starts on April 1 each year, the plan must be completed almost 90 days earlier to accommodate the required HUD review period of 45 days, the required 30-day public comment period which must precede submission to HUD, and time to incorporate citizen comments into the final plan before it is submitted. Specific goals and objectives must therefore be established before federal budgets and HUD program funding levels are known, as well as before the prior year s accomplishments have been fully measured. Funding levels for competitive programs must also be established at this time, and goals set based on anticipated demand from potential applicants for competitive funds. Maximum and minimum funding levels are set, and each program can estimate, based on historical averages, how many applications may be received and how many could be funded. But estimating how many applicants will meet eligibility and capacity requirements and how many of the received applications will represent high quality, competitive and fundable projects is much more difficult. Finally, programs like CDBG and HOME which run multiple competitive funding rounds face additional uncertainty due to decisions on the part of potential applicants regarding which of their identified needs to focus on for each funding round. As a result, in terms of accomplishments for 2011, the state met many of its goals and made healthy progress towards others. Each program made funds available for projects that would help achieve each of the objectives shown on Table 3A. Proposed (or expected) and actual accomplishments for the 2011 program year are shown on Table 3A, which begins on the next page. The discussion which follows the table elaborates on any objectives where accomplishments for the year were less than anticipated State of South Carolina Consolidated Annual Performance & Evaluation Report Section II-A Program Year: April 1, 2011 March 31, 2012 Page 14
21 SECTION II GENERAL PERFORMANCE NARRATIVE A Assessment of Annual Goals and Objectives Table 3A Summary of Specific Annual Objectives Specific Obj# Outcome/Objective Specific Annual Objectives Sources of Funds Performance Indicators Program Year Expected Number Actual Number % of Goal Complete DH-1 Availability/Accessibility of Decent Housing DH-1.1 Increase the supply of affordable rental units HOME New affordable rental units % for LMI households Plan period total % DH-1.2 Increase the supply of homeowner units HOME New affordable % affordable for LMI households homeowner units Plan period total % DH-1.3 Support transitional and supportive housing HOPWA Number of housing units % facilities for people with special needs HOME assisted Plan period total % DH-2 Affordability of Decent Housing DH-2.1 Improve affordability of owner and rental HOME Households assisted % housing for LMI families Plan period total % DH-2.2 Provide tenant-based rental assistance to make HOPWA Households assisted % housing for persons with HIV/AIDs more affordable Plan period total % DH-2.3 Prevent homelessness and/or assist with rapid ESG Persons assisted % re-housing or transition to permanent housing Plan period total % DH-2.4 Address short-term housing instability by HOPWA Households assisted % providing emergency assistance for people living with HIV/AIDS Plan period total % DH-3 Sustainability of Decent Housing DH-3.1 Make existing affordable housing more CDBG Households assisted % sustainable and preserve affordable housing stock HOME Plan period total % State of South Carolina Consolidated Annual Performance & Evaluation Report Section II-A Program Year: April 1, 2011 March 31, 2012 Page 15
22 SECTION II GENERAL PERFORMANCE NARRATIVE A Assessment of Annual Goals and Objectives Table 3A Summary of Specific Annual Objectives Specific Obj# Outcome/Objective Specific Annual Objectives Sources of Funds Performance Indicators Program Year Expected Number Actual Number % of Goal Complete SL-1 Availability/Accessibility of Suitable Living Environment SL-1.1 Provide funding for new or improved CDBG Number of predominantly % infrastructure, facilities or services LMI communities assisted Plan period total % SL-1.2 Support organizations that provide essential ESG Number of entities assisted % services to homeless individuals and families, both sheltered and unsheltered Plan period total % SL-1.3 Provide shelter and services for sheltered and ESG Persons assisted ,000 24,403 81% unsheltered homeless persons Plan period total 30,000 24,403 81% SL-1.4 Provide supportive services to persons with HOPWA Households assisted , % special needs to promote independent living Plan period total 850 1, % SL-2 Affordability of Suitable Living Environment SL SL-3 Sustainability of Suitable Living Environment SL-3.1 Support community and regional planning and CDBG Number of predominantly % coordination initiatives LMI communities assisted Plan period total % SL-3.2 Preserve neighborhoods through revitalization, CDBG Number of predominantly % development or elimination of blight LMI communities assisted Plan period total % 2011 State of South Carolina Consolidated Annual Performance & Evaluation Report Section II-A Program Year: April 1, 2011 March 31, 2012 Page 16
23 SECTION II GENERAL PERFORMANCE NARRATIVE A Assessment of Annual Goals and Objectives Table 3A Summary of Specific Annual Objectives Specific Obj# Outcome/Objective Specific Annual Objectives Sources of Funds Performance Indicators Program Year Expected Number Actual Number % of Goal Complete EO-1 Availability/Accessibility of Economic Opportunity EO-1.1 Support the creation or retention of jobs for CDBG Jobs created or retained % LMI persons Plan period total % EO-1.2 Support programs or services that improve ESG Number of programs or % availability of or access to jobs for LMI persons HOPWA providers supported Plan period total % EO-2 Affordability of Economic Opportunity EO EO-3 Sustainability of Economic Opportunity EO-3.1 Improve community economic CDBG Number of communities % competitiveness and ability to support sustainable economic opportunity assisted Plan period total % 2011 State of South Carolina Consolidated Annual Performance & Evaluation Report Section II-A Program Year: April 1, 2011 March 31, 2012 Page 17
24 SECTION II GENERAL PERFORMANCE NARRATIVE A Assessment of Annual Goals and Objectives Decent Housing The State s Decent Housing objectives encompass the following: Availability Affordability Sustainability o Increasing supply by supporting or assisting development of new affordable rental and owner-occupied housing, for low and moderate income households (DH-1.1, DH-1.2), as well as supporting transitional and supportive housing facilities for people with special needs (DH-1.3) o Improving affordability of housing for low and moderate income households through tenant based rental assistance or downpayment and closing cost assistance (DH-2.1) o Providing short-term emergency assistance and longer term tenant-based rental assistance for persons with HIV/AIDs (DH-2.2 and DH-2.4) o Preventing homelessness for households at risk (DH-2.3). o Making existing affordable housing more sustainable and preserving existing affordable housing stock (DH-3.1) Affordable housing in general is one of the highest priority needs in this state, and HUD funds are used in conjunction with State Housing Trust Fund and other state and federal funding resources to address this need. Of the four HUD programs, HOME is targeted exclusively toward affordable housing and is administered by the State Housing Finance and Development Authority (SHFDA), which also manages state and other resources for affordable housing. Please see Section II C Affordable Housing and Section II E Other Actions, Actions to Foster and Maintain Affordable Housing for additional accomplishments in this arena. In 2011, six out of eight goals were met or exceeded, including the HOPWA-funded availability and affordability goals, the joint HOPWA and HOME goal of supporting special needs housing and making it more available, the ESG-funded goal of preventing homelessness and the CDBGfunded goal of making existing affordable housing more sustainable, in spite of a steep reduction in available HOME funding and absence of any HOME sustainability accomplishments for Details include: 104 special needs housing units were supported by HOME and HOPWA, well above the 20 unit goal. HOME funding will be used to develop 19 new affordable owner-occupant units (goal 15) and 129 new affordable rental units (goal 170). HOME funding helped make owner and rental housing affordable for 452 low and moderate income households (goal 900). HOPWA funding provided tenant-based rental assistance to making housing more affordable for 142 HIV/AIDs households (goal 110) and short-term housing instability was addressed for an additional 319 HIV/AIDs households (goal 300). ESG funding helped prevent homelessness for 648 at risk households (goal of 600) State of South Carolina Consolidated Annual Performance & Evaluation Report Section II-A Program Year: April 1, 2011 March 31, 2012 Page 18
25 SECTION II GENERAL PERFORMANCE NARRATIVE A Assessment of Annual Goals and Objectives CDBG funding will make 559 existing affordable housing units more sustainable either by connecting them to public water and/or sewer or exterior improvement/repair. This substantially exceeds the goal of 200 units and 100% are occupied by low and moderate income households. The two goals not 100% met still reflect significant accomplishments, with 129 new affordable rental units developed and 452 low and moderate income households provided direct assistance to make renting or owning homes more affordable. Although short of the goals, the state s accomplishments are considerable given the substantial reduction in HOME funding for Plus, additional rental housing accomplishments are related to HOME funding for projects also funded with Low Income Housing Tax Credits. These projects will create 364 rental units in addition to the 108 units in these projects directly funded by HOME. This brings the total new rental units for HOME-funded projects to 472. Other projects received HOME funding in conjunction with funding from the State Housing Trust Fund, which generated an additional 12 units of primarily special need housing. Suitable Living Environment The State s Suitable Living Environment objectives include: Availability o Providing funding for new or improved community infrastructure, facilities or services (SL-1.1) o Supporting organizations that provide essential services to the homeless and providing emergency shelter for the homeless (SL-1.2 and SL-1.3) o Providing supportive services to persons with special needs to promote independent living (SL-1.4) Sustainability o Supporting community and regional planning and coordination initiatives and preserving neighborhoods through revitalization, development and elimination of blight (SL-3.1 and SL-3.2) Infrastructure and public facilities represent the most significant non-housing needs in South Carolina other than economic development, and CDBG is a key source of funding for addressing these needs and creating more vibrant and sustainable communities. Similarly, of the four Consolidated Plan programs, only ESG and HOPWA provide funds specifically to assist special needs households. ESG assists homeless households and those at risk of becoming homeless and HOPWA assists persons with HIV/AIDs and their families. HOME is sometimes coupled with State Housing Trust Funds to create supportive, transitional, elderly and other special needs housing, but HOME funding is not directly targeted at special needs populations. HOME s target population is more broadly low and moderate income households. In 2011, five out of six goals were met and exceeded, and accomplishments for the other objective were 81% of the goal. Goals met included the three CDBG-funded availability and sustainability goals, the HOPWA-funded supportive services goal and the ESG funded goal of supporting service providers. Specific accomplishments include: 2011 State of South Carolina Consolidated Annual Performance & Evaluation Report Section II-A Program Year: April 1, 2011 March 31, 2012 Page 19
26 SECTION II GENERAL PERFORMANCE NARRATIVE A Assessment of Annual Goals and Objectives ESG supported 31 providers of essential homeless services (goal 25) and homeless shelter for 24,403 persons (goal 30,000). HOPWA funding helped make independent living possible or sustainable for 1,040 HIV/AIDs households, well above the goal of 850. CDBG funding will result in new or improved infrastructure, facilities or services in 39 predominantly LMI communities, which is more than three times the goal of assisting 10 communities and will benefit a total of 26,674 people. CDBG funding also supported community and regional planning for 44 communities (goal 40) and will directly assist in preserving and revitalizing 16 LMI neighborhoods (goal 12) through a combination of planning and implementing water, sewer, roads, drainage, housing repair, clearance of dilapidated housing and/or vacant lots, and other public safety and public facility improvements needed to make the communities more vibrant and sustainable. 5,453 residents will benefit from neighborhood planning or revitalization. The only goal not met in 2011 is the ESG goal of providing emergency shelter, and this is actually a positive as the lower number of sheltered homeless appears to reflect a continuing gradual reduction in homelessness in South Carolina. ESG-funded shelters reported 24,403 homeless persons assisted, compared with the goal of 30,000, which continues the downward trend reported last planning period. In 2006, 68,292 homeless were sheltered and by 2010 the number had dropped by 50% to 31,833. If accurate, the reduction in the need for homeless assistance is perhaps the result of greater emphasis on homeless prevention and availability of funding in recent years through the Homeless Prevention and Rapid Re-housing Program (HPRP), as well as higher levels of ESG funding dedicated to prevention. The 24,403 homeless sheltered throughout the year can be compared to the results of the point-in-time 2011 Homeless Count, which indicated 2,888 sheltered in January The count also indicated a reduction in homelessness since the 2009 count, and together these two sets of data appear to indicate a trend toward a lower rate of homelessness. These efforts have positively impacted the state s goal to reduce and eventually eliminate homelessness. Economic Opportunity The State s Economic Opportunity objectives include: Availability o Supporting the creation or retention of jobs for LMI persons (EO-1.1) o Supporting programs and services that improve the availability of or access to jobs for LMI persons (EO-1.2) Sustainability o Improving community economic competitiveness and regional planning and coordination initiatives and preserving neighborhoods through revitalization, development and elimination of blight (EO-3.1) CDBG is the primary source of HUD funds for implementing the state s economic development objectives, although HOPWA and ESG are also an important source of funding for employment training, lifeskills training and other employment and employability assistance programs for 2011 State of South Carolina Consolidated Annual Performance & Evaluation Report Section II-A Program Year: April 1, 2011 March 31, 2012 Page 20
27 SECTION II GENERAL PERFORMANCE NARRATIVE A Assessment of Annual Goals and Objectives special needs households. Economic objectives include job creation, particularly in the state s most economically challenged areas, but also the increasingly important objective of creating more economically competitive communities. In order for business growth and job creation to occur, communities must first be capable of generating and sustaining new business start-ups, existing business expansions and new business locations. These in turn require a capable and appropriately trained workforce with skills needed now and in the future, resources to support workforce development and address skill shortages, vital and sustainable commercial town centers, public infrastructure and services adequate and capable of supporting both business and residential needs, and removal of obstacles to economic growth like dilapidated and abandoned buildings and sites, poor public safety or inadequate basic services like fire protection and health services, and even shortages of workforce housing. CDBG funding is directly helping to address these elements of community economic competitiveness, in addition to continuing to provide assistance where it can be effective to support new business locations or expansions and related job creation. In 2011, accomplishments were achieved for each of the state s objectives, with the greatest efforts this program year involving support for programs that improve access to jobs and employment. Actual accomplishments were below goal levels and reflect the slow economic recovery, but nonetheless represent improved economic opportunity in South Carolina. Fifteen new jobs will be available as a result of CDBG assistance to help an existing rural employer expand (goal 75). HOPWA and ESG supported 29 providers of programs to assist people with special needs and the greatest economic challenges and help make employment and jobs more accessible to them (goal 30). CDBG funding will directly assist in making six communities more economically competitive (goal 10) and better able to support economic opportunity for their 23,306 predominantly LMI residents. CDBG funds are set-aside each year for assistance to projects that will create jobs for primarily LMI residents of the state, but requests for these funds is variable, depending on the economy, the number of projects considering locating or expanding in the state, how fast related project decisions are made by the business, whether or not CDBG funds can be used to meet the needs of new or expanding businesses, location within the state and whether or not the local government is even eligible for CDBG funds, and finally, whether or not the project needs can be met more effectively and with fewer constraints on the business by using other funding sources. In 2011, CDBG assisted one existing industry in Hampton County which anticipates creating 15 new jobs as a result of infrastructure assistance. In addition to these anticipated jobs, several CDBG projects funded in prior years completed hiring and provided the actual number of jobs created during the program year. Three projects in Clarendon County, the City of Johnsonville and Florence County received $1.2 million in CDBG funding and reported a total of 254 jobs created, including 212 or 83% held by low and moderate income individuals. In total, these exceeded the proposed job creation of 176, with 57% LMI, and each of the companies individually exceeded their proposed levels as well. Improving economic competitiveness is a key strategy for preparing communities to attract jobs and investment in the future. These projects by nature typically address long standing barriers 2011 State of South Carolina Consolidated Annual Performance & Evaluation Report Section II-A Program Year: April 1, 2011 March 31, 2012 Page 21
28 SECTION II GENERAL PERFORMANCE NARRATIVE A Assessment of Annual Goals and Objectives and are thus complex, requiring considerable up front effort, coordination and planning. This year, more applicants chose to focus efforts where they already had momentum as a result of prior CDBG-funded revitalization plans, and fewer applicants submitted quality projects that would effectively address underlying barriers to economic competitiveness and provide a high degree of impact on the community. As a result, fewer projects than expected were funded, and the state made five awards for projects that will address workforce development, downtown revitalization and elimination of blight. Communities as a whole also benefit from projects that provide new jobs for low and moderate income residents, in that demand is created for additional local goods and services to support the new or expanding industry, related businesses often locate in downtown areas and help revitalize them and the entire local economy becomes more diversified and sustainable. One community will benefit from expansion of an existing local industry. Also in 2011, a number of previously funded workforce development projects were completed and a much larger than expected number of low and moderate income residents trained. New QuickJobs Development workforce centers or programs in eight counties reported that a total of 3,902 people, including 2,605 or 84% LMI, received training aimed at addressing skill shortages identified by local businesses, vastly increasing their chances of getting new or better paying jobs. This is almost twice the proposed number of people to be trained, which was 1,339, and reflects a much higher percentage of LMI benefiting at 84% versus 54%. Examples of accomplishments include: The QuickJobs Development Center in Calhoun County expected to serve 200 people, including 51% LMI. In March 2011, the facility had trained 1,952 people including 1,616 or 83% who are LMI. In Pickens and Oconee Counties, actual numbers were 658 compared with 100 proposed and 360 compared with 150 proposed, respectively. Percentages of LMI were well above proposed, with Oconee reporting 87% LMI and Pickens County reporting 84% LMI. A distance learning center at the Kershaw-Heath Springs campus of York Technical College received CDBG funding to assist a new medical training program developed in response to local employer needs. The center reported a total of 130 people trained through March 31, 2011, including 97% LMI. This compares with 65 proposed and only 51% LMI. In Fairfield County, where the QuickJobs Development Center began training in January 2011, 134 people received training in the first year, including 73% who are LMI. Enrollment in Adult Education tripled since the facility opened and began offering QuickJobs courses for under and unemployed individuals. This has enabled adults to participate in GED and other high school equivalency training, while also providing training to meet local industry hiring requirements. From prior experience, we also know that CDBG-funded downtown revitalization projects, when complete, will result in growth and retention of jobs as well as new investment. Like workforce development centers, downtown revitalization projects must track business activity for one year following construction completion in order to measure impact. Two downtown revitalization projects were completed during program year 2011 and are in the process of tracking accomplishments. In addition, two projects were completed just after the close of the program 2011 State of South Carolina Consolidated Annual Performance & Evaluation Report Section II-A Program Year: April 1, 2011 March 31, 2012 Page 22
29 SECTION II GENERAL PERFORMANCE NARRATIVE A Assessment of Annual Goals and Objectives year in April 2012, and a number of others are underway. Examples of related business and job growth for projects completed during the year include: In the City of Greenwood, CDBG has funded a number of downtown redevelopment projects that have catalyzed business activity in town. The most recently funded project extended existing streetscape efforts along Court Avenue and was completed toward the end of the program year. Already, the City has reported two new businesses and one expansion resulting in seven new or retained jobs. Additional results are expected over the next year as Greenwood continues to track economic impact resulting from this CDBG project. Though final reporting has not yet been submitted, other projects in downtown Abbeville and York have also generated new business growth. Four new businesses have opened in downtown Abbeville and the town center now hosts live music performances on the Square. Local real estate companies have created events to show off the new downtown to prospective commercial and retail tenants. In York, new small retail businesses have also opened and Bluestar Silicones USA chose York as the site of a new 190,000 square foot manufacturing plant and warehouse. The company is converting a former textile plant for its use and expects to create 60 new jobs. Breakdown of Funds Spent in Attaining Goals and Objectives Table 3A, above, outlines the State s Consolidated Plan objectives and the sources of funding available to assist with each. In general, CDBG is flexible enough to address all objectives and most outcomes, whereas HOME, HOPWA and ESG are more narrowly targeted. All HOME funding each year is directed toward decent housing. HOPWA and ESG funds are applied toward both decent housing and suitable living environment objectives and outcomes. Targeting of program year 2011 funding and the total amount of funding for each objective and outcome are summarized below and on the following page. Objective/Outcome Outcome and Objective Sources of Funding Decent Housing Suitable Living Environment Economic Opportunity Availability/Accessibility HOME, HOPWA CDBG, HOPWA, ESG CDBG, HOPWA, ESG Affordability HOME, HOPWA, ESG N/A N/A Sustainability CDBG CDBG CDBG 2011 State of South Carolina Consolidated Annual Performance & Evaluation Report Section II-A Program Year: April 1, 2011 March 31, 2012 Page 23
30 SECTION II GENERAL PERFORMANCE NARRATIVE A Assessment of Annual Goals and Objectives Funding By Objective and Outcome Decent Housing Suitable Living Environment Economic Opportunity Availability/Accessibility $8,017,637 $18,521,453 $165,000* Affordability $1,943,399 N/A N/A Sustainability $840,312 $5,931,242 $1,639,482 Total $10,801,348 $24,452,695 $8,826,403 * Note that HOPWA and ESG funding specifically for employment related supportive services is included in the amount shown under Suitable Living Environment/Availability for these programs. Please see Table 3A for the specific objectives, outcomes, performance indicators, goals and accomplishments that correspond to the funding shown above State of South Carolina Consolidated Annual Performance & Evaluation Report Section II-A Program Year: April 1, 2011 March 31, 2012 Page 24
31 B. Affirmatively Furthering Fair Housing This section summarizes actions taken by the State and its Local Government funding recipients to affirmatively further fair housing and to mitigate identified impediments to fair housing choice. CDBG civil rights compliance information can be found in Section III CDBG Program Narrative, Families and Persons Assisted by CDBG Funding (Civil Rights Compliance). Actions to Address Impediments to Fair Housing Choice As an entity that receives funding directly from HUD, which also distributes Community Development Block Grant (CDBG) funding annually to local governments, the State of South Carolina has a dual responsibility with respect to fair housing, as defined by HUD in its Fair Housing Planning Guide, and as defined by law governing the CDBG Program. The State must certify that it will undertake fair housing planning at the state level by conducting an analysis of impediments to fair housing choice, taking appropriate actions to mitigate and eventually overcome the effects of impediments identified through the analysis, and assuring that units of local government funded by the State comply with their certifications to affirmatively further fair housing. The State certifications and actions planned to affirmatively further fair housing and address impediments to fair housing for the 2011 Program Year can be found in the Consolidated Plan in the Annual Action Plan section. The Consolidated Plan can be found on the state s website at All actions identified in the Plan have corresponding accomplishments described below. In addition, other actions were undertaken. Actions related to the state s Analysis of Impediments and identified in the state s 2011 Action Plan included: Action 1 Finalize and evaluate current research Action 2 Review 2010 Fair Housing actions based on new Analysis of Impediments Action 3 Review and evaluate regional/local Analyses of Impediments Action 4 Continue to make funding available for local AI s Additional planned actions included: Action 5 - Work with federal, state and local partners to further improve fair housing education for local government officials, community development planners and housing and housing service providers Action 6 Include a segment on fair housing and fair housing best practices in the electronic CDBG Update newsletter, to coincide with Fair Housing Month (not undertaken due to restricted funding) Action 7 Use the SHFDA website as a vehicle for promoting fair housing Action 8 Continue to develop a broader range of materials, including materials targeted at LEP persons, that can be provided to and used by local governments and housing and services providers to help increase public awareness of fair housing Action 9 Use the annual Affordable Housing Forum as a vehicle for communicating information about developing housing 2011 State of South Carolina Consolidated Annual Performance & Evaluation Report Section II-B Program Year: April 1, 2011 March 31, 2012 Page 25
32 SECTION II GENERAL PERFORMANCE NARRATIVE B Affirmatively Furthering Fair Housing With severe funding constraints and the limited scope of responsibility of the Consolidated Plan partners relative to the entire state, the state targeted actions aimed at addressing fair access to housing and fairness of housing choices for residents, particularly areas where CDBG and other program funding has been awarded. Related accomplishments are summarized in the section below. Accomplishments Addressing Impediments to Fair Housing Choice Actions 1 & 2 - Finalized New Analysis of Impediments to Fair Housing Choice The state s most significant accomplishment this year was completion of a new Analysis of Impediments, using research conducted for development of the Consolidated Plan for , as well as extensive new research into fair housing in South Carolina. Research for the Consolidated Plan included an analysis of housing market conditions, fair housing complaints submitted to HUD, special needs housing issues, and statewide housing trends and needs. Beginning with the Consolidated Plan and extending into the current program year, a third party consultant was used for research into barriers to housing for protected classes and potential sources of discrimination, such as zoning laws and practices, existing state laws pertaining to fair housing and lending, etc. And public input obtained for the Consolidated Plan from a series of regional public forums and an online survey were re-analyzed for the purposes of the AI. New research during the program year focused on fair housing complaints, including new complaint data from HUD FHEO since completion of the Consolidated Plan, as well as new data obtained from the SC Human Affairs Commission (HAC). During the Consolidated Plan development, lack of planning and ability to readily report SC HAC data in different formats was identified as a shortcoming and addressed during the 2011 program year. As a result, plans were developed to upgrade the HAC fair housing complaint data system and add a new query and reporting interface. Initial discussions with the programmer were completed during the year. Another key source of data, Home Mortgage Disclosure Act (HMDA) home loan data, required greater depth of analysis. Substantial additional and more detailed data was obtained from the Federal Financial Institutions Examination Council and examined to identify private sector trends and evaluate high cost mortgage data for indications of barriers to fair housing. Data relating to the population and growth of protected classes and limited English language proficient (LEP) persons was also updated and incorporated for the new AI. All of the above research was compiled and analyzed to develop the list of impediments to fair housing contained in the AI, as well as strategies for mitigating and eventually eliminating them. The AI describes the underlying research, the state s findings based on the research, impediments and strategies in detail. The state submitted the completed document to HUD for review. Following is a summary of the impediments identified: Housing discrimination impedes fair housing choice and primarily impacts minorities and persons with disabilities. The prevalence of predatory lending products, coupled with a lack of access to credit and poor financial literacy, enable and may contribute to discriminatory effects. Economic barriers serve as an impediment to fair housing choice particularly when the supply of adequate affordable and accessible housing is limited State of South Carolina Consolidated Annual Performance & Evaluation Report Section II-B Program Year: April 1, 2011 March 31, 2012 Page 26
33 SECTION II GENERAL PERFORMANCE NARRATIVE B Affirmatively Furthering Fair Housing Regulatory barriers and lack of adequate coordination and resources can impede fair housing choice. Fair housing is impeded by a lack of knowledge of fair housing laws and fair housing resources among the general public, housing providers and policy makers. Action 3 Reviewed Local/Regional Analyses of Impediments Two regional planning grants awarded in the 2010 program year included funding for local or regional Analyses of Impediments in the Catawba and Santee Lynches Regional Council of Government regions of the state. Analyses of Impediments were prepared for eight counties in these two regions during 2011, and this information will be used to develop strategies and include in statewide updates. CDBG also provided funding during the 2011 program year to the Berkeley-Charleston- Dorchester and Lower Savannah Councils of Government to undertake research in eight counties in their regions, and to identify impediments to fair housing choice. This research will also be used to develop strategies and actions to mitigate local or regional impediments. In addition, CDBG continued to improve its grantee reporting process to obtain better information regarding grant recipients efforts at affirmatively furthering fair housing. As of October 2011, grantees must now provide more detailed documentation of fair housing efforts and associated costs as part of the grant closeout process. Action 4 - Made Funding Available The state continued to encourage local governments to undertake local or regional analyses of impediments and made funds available under its CDBG Program in $60,000 in funding was awarded in 2011 to two Councils of Government to undertake an Analysis of Impediments in their region. $47,500 in 2010 CDBG funds helped the Catawba and Santee-Lynches Councils of Government complete their Analyses of Impediments for their regions this year. CDBG funds were also used to assist the South Carolina Human Affairs Commission with education and outreach. $2,500 in CDBG funds were spent on outreach and education, including the booth, materials and the Affordable Housing Forum HAC exhibit. Funding for CDBG fair housing activities is included in the amount of the CDBG grant award earmarked for local administration. CDBG awarded a total of $24.7 million this program year and just over 5% was for local government administration and compliance with applicable state and federal regulations, including fair housing. Grants closed since October 2011 indicated how much of their administrative funds were used for fair housing activities: $5,940 in CDBG grant administrative funds was spent on fair housing activities, including development of materials and articles, publication of fair housing articles in local newspapers, publication of Fair Housing resolutions and proclamations and Section 504 notices, and staff resources State of South Carolina Consolidated Annual Performance & Evaluation Report Section II-B Program Year: April 1, 2011 March 31, 2012 Page 27
34 SECTION II GENERAL PERFORMANCE NARRATIVE B Affirmatively Furthering Fair Housing Nearly $15,000 in other local funds for related activities, including the development of AI s for local HOME Consortiums. Other Accomplishments Addressing Impediments Accomplishments related to Actions 5 9 include: Action 5 - Collaborated with the SC Human Affairs Commission (HAC) to provide education about fair housing. o HAC staff participation in the Affordable Housing Forum, at which HAC was an official exhibitor. (Note: This was the first year that HAC participated in the Forum as an exhibitor.) o Development of a colorful fair housing display that can be used at various venues. o Printing of brochures for distribution at various fair housing events. o A plan for HAC to document and report on future use of the booth and display and information dissemination. o HAC conducted and/or participated in nine educational and outreach events which were attended by over 1,400 people. HAC also was interviewed on television and radio and had letters to the editor published in several newspapers around the state. HAC efforts are detailed on the following page. Action 6 - CDBG promoted training activities and workshops to local governments, subrecipients, contractors and grant administrators in an effort to enhance local understanding of fair housing issues and encourage greater local efforts at furthering fair housing in communities around the state. The new CDBG web site was developed as a resource for making fair housing materials available. Action 7 - CDBG and SHFDA promoted April 2011 as Fair Housing Month to communicate fair housing opportunities for citizens throughout South Carolina. Activities included posting of information on the SC State Housing Finance and Development Authority and SC Government web sites, and mailings to units of local government notifying them of Fair Housing Month and recommendations for local government activities. Several local governments held events and most published articles in newspapers and newsletters and used existing vehicles like websites and utility bill mailings to promote fair housing. The SFHDA website link to fair housing resources is new this year and will be maintained in the future. Action 8 - CDBG continued to develop and/or acquire a broader range of materials, including materials appropriate for LEP outreach and education. These can be used by local governments and housing and services providers to help increase public awareness of fair housing. CDBG made resources available and provided training to local governments State of South Carolina Consolidated Annual Performance & Evaluation Report Section II-B Program Year: April 1, 2011 March 31, 2012 Page 28
35 SECTION II GENERAL PERFORMANCE NARRATIVE B Affirmatively Furthering Fair Housing SOUTH CAROLINA HUMAN AFFAIRS COMMISSION HOUSING OUTREACH AND TRAINING JULY 1, JUNE 30, 2012 Date 9/29/2011 Type of Contact Conducted Fair Housing training for Partnership Property Management - Florence Number of people 150 1/16/2012 King Day at the Dome - Housing Outreach 1,000 2/7/2012 3/14/2012 3/17/2012 4/2012 4/9/2012 4/16/2012 4/16/2012 4/24/2012 4/25/2012 4/26/2012 Conducted Fair Housing training - Housing staff of Charleston Trident Urban League Conducted Fair Housing training for Partnership Property Management - Florence Conducted Fair Housing training for the City of Columbia Homebuyers Forum Letters to the editor - The State Newspaper, Newberry Observer, Fort Mill Times, Georgetown Times, Francis Burns United Methodist Church Newsletter Guest on The Urban Scene - AM Radio Show - Columbia, SC -Discussed Fair Housing Presenter at the Affordable Housing Forum, sponsored by the Great Columbia Community Relations Council Interviewed about Fair Housing on WACH FOX TV- Columbia Conducted Fair Housing training for the Spartanburg Housing Authority Conducted Fair Housing training for the Sumter Board of Realtors Conducted Fair Housing training for the Human Affairs Commission board members State of South Carolina Consolidated Annual Performance & Evaluation Report Section II-B Program Year: April 1, 2011 March 31, 2012 Page 29
36 SECTION II GENERAL PERFORMANCE NARRATIVE B Affirmatively Furthering Fair Housing Action 9 - The SC State Housing Finance and Development Authority (SHFDA) hosted the two-day 2012 Palmetto Affordable Housing Forum April 16-17, 2011 at the Columbia Metropolitan Convention Center. Although just after the end of the program year, this was the Forum for the 2011 program year, following the 2010 Forum in February For the first time, the SC Department of Commerce facilitated and provided funding for a SC Human Affairs Commission exhibit, including a reusable display with graphics that can be changed according to audience and need, initial graphics suitable for the Forum, and printed brochures. Now in its 17th year, the forum is a collaborative effort between SHFDA, HUD, the Affordable Housing Coalition of SC, USDA-Rural Development, and the SC Department of Consumer Affairs. On the agenda were a number of sessions geared toward fair housing. As is typical, this event drew hundreds of attendees from around the state, including state and local government, community leaders, developers, investors, lenders, management companies, non-profits and others interested in affordable housing. Other actions by the state included education and outreach activities by the SC Department of Consumer Affairs (DCA) including: Launch of a new streamlined website, as just one of many initiatives to improve services to consumers. Website features include the ability to file complaints online, download informative brochures and access other educational materials. Developing a new legal track for the Palmetto Affordable Housing Forum, with topics ranging from Fair Housing and Landlord-Tenant Law to a Mortgage Law update. Credit counselors licensed by DCA earned continuing education credits by attending the Forum. Educating consumers by publicizing information about the national mortgage settlement that will result in relief for homeowners who 1) are in need of a mortgage loan modification, 2) are underwater in their mortgages, and/or 3) were harmed during the foreclosure process. DCA also provided important warnings about scammers taking advantage by calling consumers and claiming that money from the settlement is coming to them. Promoting Annual National Consumer Protection Week in March. Outreach presentations during the week ranged from credit repair to how to deal with debt and were held around the state. DCA also sponsored two regional phone banks to answer hundreds of consumer questions about the latest scams and fraud activities. Sponsoring the LifeSmarts competition. LifeSmarts is an education competition run by the National Consumers League that tests high school students nationwide on real-life consumer issues through online quizzes and live contests. The program has the dual goals of providing students with the tools they need to be smart consumers in the marketplace and teachers with much needed consumer-based curriculum. In addition, SHFDA s SC HELP Program partnered with AARP, the SC Appleseed Legal Justice Center, members of the SC State Legislature, and local bank representatives to hold public forums on foreclosure around the state State of South Carolina Consolidated Annual Performance & Evaluation Report Section II-B Program Year: April 1, 2011 March 31, 2012 Page 30
37 SECTION II GENERAL PERFORMANCE NARRATIVE B Affirmatively Furthering Fair Housing Affirmatively Further Fair Housing CDBG continued to encourage progressive fair housing actions and to provide guidance to local government recipients of CDBG funds regarding acceptable and meaningful actions they can undertake to further fair housing in their communities. CDBG also provided training on the subject at the annual CDBG Implementation Workshop. As a result, CDBG grantees are demonstrating broader efforts and more innovative methods to communicate, educate and raise awareness of fair housing issues. An increasing number of grantees are also starting to involve local citizens through surveys, participation in regional meetings and local housing councils, and discussions of fair housing issues using available forums such as CDBG needs assessment and other public hearings. Local governments are also undertaking local/regional analyses of impediments and analyses of local land use and zoning policies and housing affordability, thereby directly addressing some of South Carolina s identified impediments to fair housing. Funding for these fair housing activities is included in the amount of the CDBG grant award earmarked for local administration. CDBG awarded a total of $24.7 million this program year and just over 5% was for local government administration and compliance with applicable state and federal regulations, including fair housing. To ensure that local government recipients of CDBG funding also affirmatively further fair housing, the CDBG program requires that all grantees develop a plan including a schedule and a detailed description of fair housing activities which the recipient will undertake during the grant period to affirmatively further fair housing in the recipient s jurisdiction. The purpose is to encourage recipients to develop a comprehensive strategy for creating an environment which fosters non-discrimination, an accessible living environment, and the promotion of actions designed to affirmatively further fair housing. CDBG continues, each year, to encourage progressive fair housing actions and to provide guidance to CDBG grantees regarding acceptable and meaningful actions they can undertake to further fair housing in their communities. Plans must be submitted and approved prior to any funds being drawn, and implementation of activities must occur and be documented prior to project close out. Local plans submitted during Program Year 2011 identified a range of fair housing activities, continuing to represent expanded efforts. Notably, activities planned by local government recipients of CDBG funds and approved in 2011 include: Developing comprehensive public information programs that effectively promote and educate about fair housing by using multiple media, including newspapers, bulletin boards, churches, utility bill mailings, property tax bill mailings, public websites and web links to fair housing resources, local government newsletters, local government television channels, etc. Actively participating in local fairs and events and using a variety of venues for promoting fair housing and fair housing resources and focusing attention on fair housing isuses. Avenues identified by grant recipients in 2011 included adding fair housing issues to agendas for existing public meetings and public hearings, including the needs assessments and other public hearings required by CDBG, developing fair housing booths for events like the Park Fest Weekend in Elloree, and including fair housing information in including fair housing materials in the participants packets for a widely attended annual local marathon. Several communities will use poster 2011 State of South Carolina Consolidated Annual Performance & Evaluation Report Section II-B Program Year: April 1, 2011 March 31, 2012 Page 31
38 SECTION II GENERAL PERFORMANCE NARRATIVE B Affirmatively Furthering Fair Housing contests, including the Town of Sellers which will sponsor a poster contest at their new Fair Housing Resource Center to promote its use. Outreach to specific community groups such as housing councils, Community Action Agencies, and local providers of social services and special needs services. Publishing articles and news related to fair housing, as well as the more traditional display ads and fair housing month announcements, in local newspapers. Fourteen local governments indicated they will publish articles. Actively participating in local fairs and events and promoting fair housing and fair housing resources, including a unique ice cream social sponsored to improve participation in fair housing efforts at a local elementary school. Conducting a local fair housing forum. Two local governments accomplished this during the year. Developing and distributing a survey of the community regarding fair housing issues and undertaking a zoning review, with particular attention on barriers to affordable and fair housing choice. To ensure that local government recipients are undertaking the activities in their approved fair housing plans, CDBG monitored 69 recipients of one or more CDBG grants during the year to ensure that each recipient of CDBG or CDBG-R funds had fulfilled its fair housing responsibilities. Technical assistance was provided throughout the year to assist grantees in developing and implementing actions to further fair housing. In addition, CDBG revised its grantee reporting process to obtain better information regarding grant recipients efforts at affirmatively furthering fair housing. As of October 2011, grantees must now provide more detailed documentation of fair housing efforts and associated costs as part of the grant closeout process. Grants closed since October 2011 indicated $5,940 in CDBG grant administrative funds spent on fair housing activities, including development of materials and articles, publication of fair housing articles in local newspapers, publication of Fair Housing resolutions and proclamations and Section 504 notices, and staff resources. In addition, two grantees indicated nearly $15,000 in other local funds for related activities, including the development of AI s for local HOME Consortiums. Listed below are actual fair housing activities undertaken and reported during the program year, generally in addition to an increasing number of the following activities: local government resolutions and proclamations, fair housing ordinances, publication of resolutions/ proclamations/notices in newspapers and posting of notices and information in prominent public locations, inclusion of fair housing notices on water bills, fair housing poster contests and display of fair housing posters in public places, fair housing public service announcements, development of fair housing information centers in public places and development of fair housing resource files. Updated a local Analysis of Impediments (Sumter County) or participated in development of a regional AI (Bishopville, Summerton and Turbeville).Conducted fair housing surveys of community residents and survey results reported as part of Fair Housing Month activities State of South Carolina Consolidated Annual Performance & Evaluation Report Section II-B Program Year: April 1, 2011 March 31, 2012 Page 32
39 SECTION II GENERAL PERFORMANCE NARRATIVE B Affirmatively Furthering Fair Housing Developed a fair housing survey, with results to reported as part of next year s Fair Housing Month activities. Conducted housing surveys aimed at persons with disabilities to determine the needs and concerns of those with special needs, and in the case of Dillon County in particular, informed public of results during needs assessment hearings. Other surveys conducted by City of Bennettsville. Wrote an article discussing/promoting fair housing and had it published in local newspapers and magazines. Articles ran in local newspapers, including the Berkeley Independent, Chronicle Independent (Camden), Citizen News (Edgefield/Johnston), Clinton Chronicle, Edgefield County Advertiser, Laurens County Advertiser, Press & Banner (Abbeville), Saluda Standard Sentinel, Weekly Observer (Hemingway), and newspapers with local circulation areas in Hampton, Greeleyville, Walterboro, and throughout the counties of Georgetown, Marlboro and Beaufort. The City of Greenwood published a fair housing article by the SC Human Affairs Commission titled In All Fairness in the Greenwood Index Journal, and also ran an ad promoting fair housing for the entire month of April in support of Fair Housing Month. Created dedicated Fair Housing web pages on local government websites, including the website for the Town of Bluffton, and promotion of fair housing on websites like GOLAURENS.com, the Aiken, Chester and Lancaster County websites and the Town of Turbeville s website. Held a special community meeting at which a local resident, who is also a certified HUD Housing and Mortgage Counselor, was a guest speaker. Referrals were made to agencies that offer assistance to individuals with predatory lending and ore foreclosure issues. Topics covered at the meeting included HUD s guidelines for Fair Housing, housing discrimination, how to file complaints, predatory lending and foreclosure. Provided materials that local home mortgage lenders can give to first time homebuyers in lieu of providing guidance at workshops, which local banks had curtailed. Distributed fair housing education and outreach materials to local businesses that provide services to minorities and LMI area residents. Developed and produced fair housing information packets where were provided to Habitat for Humanity, United Way, Camden First CDC and local Realtors. Conducted an evaluation of local fair housing legal status, which will be used to help identify impediments to fair housing in the City of Darlington. Translated local government Fair Housing Resource File materials into Spanish to improve the effectiveness of outreach and public education efforts for community residents with Limited English Proficiency (LEP). Held a Fair Housing coloring contest at CE Murray Elementary School in Greeleyville and a poster contest at Grassy Pond Elementary School (Cherokee County) State of South Carolina Consolidated Annual Performance & Evaluation Report Section II-B Program Year: April 1, 2011 March 31, 2012 Page 33
40 SECTION II GENERAL PERFORMANCE NARRATIVE B Affirmatively Furthering Fair Housing Established a Fair Housing information center in locations other than Town Hall, such as the Florence County Department of Social Services offices, to promote fair housing resources to a targeted segment of the local population. Increased the number and frequency of Public Service Announcements Dillon County and City of Darlington both ran 20 times per week on four different radio stations throughout April as part of its Fair Housing Month activities. Sponsored a fair housing booth at the regional festivals and events, including the Hemingway BBQ/Shag Festival and the Greeleyville annual May Festival. Developed a comprehensive public information program using multiple types of media and methods, including local newspaper, radio stations, bulletin boards, churches, utility bill mailings and local public access cable television channels. Used existing avenues and community forums, such as CDBG needs assessments and public hearings, to involve the public in a discussion of fair housing. Used the community newsletter and/or routine utility and other mailings to promote fair housing to local residents, make residents aware of the community s commitment to fair housing, and provide references to fair housing resources. SHFDA, as the state s housing agency, also required its funding recipients to uphold the law, inform the public, owners and potential tenants about applicable fair housing laws, and affirmatively market HOME assisted housing in order to inform and solicit applications from eligible persons in the housing market area who are not likely to apply (defined as persons who do not reflect the race/ethnicity of the residents in the neighborhood where units are located) State of South Carolina Consolidated Annual Performance & Evaluation Report Section II-B Program Year: April 1, 2011 March 31, 2012 Page 34
41 C. Affordable Housing Actions taken by State agencies using funds other than CDBG and HOME, including the substantial state and other federal funds managed by the State Housing Finance and Development Authority (State Housing Trust Fund, Low Income Housing Tax Credits, Mortgage Revenue Bond Program, Multifamily Tax Exempt Bond Program, and Section 8) are discussed under Section II E Other Actions. Section II C below focuses only on actions and accomplishments for the four formula grant programs. Affordable housing is one of South Carolina s three priority needs and a major focus of HOME Program funds. Affordable housing issues have also been targeted in the state in recent years, with initiatives including creation of the SC Housing Commission in 2009, legislation enabling Local Housing Trust Funds as a means of improving the supply of affordable housing, and formation of three Local Housing Trust Funds, including one in the Midlands region during the 2011 program year. Specific initiatives are discussed in Section II E Other Actions, Actions to Eliminate Barriers to Affordable Housing, as are other actions which lower the cost of homeownership and/or expand the supply of rental housing, a key strategy for overcoming the barriers to affordable housing outlined in South Carolina s Analysis of Impediments to Fair Housing, or help to maintain homeowners in stable, affordable housing situations through foreclosure prevention and assistance. The statewide needs analysis conducted for the South Carolina Consolidated Plan ranked affordable housing as the highest priority need statewide after economic development. Housing needs were identified as: Availability of decent, safe and affordable housing, particularly housing that is close to transportation and/or offers easy access to community services and employment centers Rental housing and supportive and transitional housing for households emerging from homelessness or with special needs, such as the elderly, disabled and those living with HIV/AIDs Preservation and sustainability of existing affordable housing Emergency shelter for those that have become homeless, prevention of homelessness and rehousing those that have become homeless Housing stability and affordability assistance for those living with HIV/AIDs Table 3B, on the next page, summarizes the state s housing accomplishments for program year 2011, in terms of affordable rental housing, owner-occupied housing and the categories of homeless, non-homeless and special needs housing. For renter and owner-occupied housing, the chart indicates the actual number of existing units rehabilitated and the number of new units produced. Rental and homebuyer assistance accomplishments are also quantified State of South Carolina Consolidated Annual Performance & Evaluation Report Section II-C Program Year: April 1, 2011 March 31, 2012 Page 35
42 SECTION II GENERAL PERFORMANCE NARRATIVE C Affordable Housing Grantee Name: South Carolina Program Year: 2011 ANNUAL AFFORDABLE RENTAL HOUSING GOALS (SEC. 215) Table 3B - State Annual Housing Completion Goals Expected Annual Units To Be Completed * Actual Annual Number of Units Completed Resources used during the period CDBG HOME ESG HOPWA Acquisition of existing units Production of new units Rehabilitation of existing units 30 0 Rental Assistance Total Sec. 215 Affordable Rental ANNUAL AFFORDABLE OWNER HOUSING GOALS (SEC. 215) Acquisition of existing units Production of new units Rehabilitation of existing units 5 26 Homebuyer Assistance Total Sec. 215 Affordable Owner ANNUAL AFFORDABLE HOUSING GOALS (SEC. 215) Acquisition of existing units Production of new units Rehabilitation of existing units Rental/Homebuyer Assistance Total Sec. 215 Affordable Housing 1, ANNUAL AFFORDABLE HOUSING GOALS (SEC.215) Homeless households 30,000 24,403 Non homeless households 1,450 1,121 Special needs households ANNUAL HOUSING GOALS Annual Rental Housing Goal Annual Owner Housing Goal Total Annual Housing Goal 1, Comparison of Proposed and Actual Accomplishments The state s annual objectives were developed to address the priority need of providing decent and affordable housing and the more specific housing needs identified in the Consolidated Plan. Table 3A includes corresponding objectives DH-1.1 through DH-3.1. Table 3B, on the previous 2011 State of South Carolina Consolidated Annual Performance & Evaluation Report Section II-C Program Year: April 1, 2011 March 31, 2012 Page 36
43 SECTION II GENERAL PERFORMANCE NARRATIVE C Affordable Housing page, shows actual accomplishments for program year 2011, broken down by specific owner, renter, homeless, non-homeless and special needs housing activities. Generally, HOPWA, ESG and CDBG funded objectives, including support for transitional/supportive housing for people with special needs, tenant based rental assistance and short term emergency assistance for people with HIV/AIDs, homeless prevention and making existing affordable housing more affordable, through exterior repairs or connection to water and sewer infrastructure, were met and exceeded. HOME also met its goal for developing new affordable homeowner units, but fell short of the goal for new rental housing and affordability assistance for owners and renters. The latter was due, in large part, to a significant decrease in funding for HOME after proposed goals were established for Table 3B shows that all programs combined achieved progress toward the state s affordable housing goals during program year Rental housing accomplishments totaled 526 units, just under the goal of 600, and homeowner units totaled 242, compared with a goal of 570, which was too ambitious considering the reduction in funding HOME received for Combined rental and homeowner units were less than the overall goal of 1,170; however, HOME funding was used in combination with other programs, including Low Income Housing Tax Credits and the State Housing Trust Fund. This leveraged funding with these programs will result in an additional 364 new rental units and 12 primarily special needs homeowner units. Overall, in spite of another difficult year for housing nationwide, the state still managed to fund development of new or preservation of existing affordable housing, support transitional housing, and address its affordability goals, including the prevention of homelessness and assistance for short and long term housing instability for those with HIV/AIDs. A substantial number of low and moderate income households will benefit as a result. Low and Moderate Income Households As shown on the chart below, 100 percent of the individuals and/or households benefiting from the State s affordable housing activities are low to moderate income (LMI). HOME subsidies for rental or homeownership assistance (DH-2.1) require that all benefiting households be LMI. Owner and rental units must also be 100% occupied by LMI households in order for HOME funds to be used for acquisition or development (DH-1.1 and DH-1.2). The CDBG program requires 100% LMI beneficiaries for housing connections to public water and sewer and single family housing rehabilitation activities including exterior repairs (DH-3.1). New affordable rental housing is the only activity for which CDBG allows less than 100% LMI beneficiaries, and no new rental housing was funded in State of South Carolina Consolidated Annual Performance & Evaluation Report Section II-C Program Year: April 1, 2011 March 31, 2012 Page 37
44 SECTION II GENERAL PERFORMANCE NARRATIVE C Affordable Housing South Carolina Program Year 2011 Low and Moderate Income (LMI) Housing Accomplishments Object. Outcome/Objective Nbr DH-1.1 & Increase the supply of affordable DH-1.2 rental and homeowner units for LMI households DH-1.3 Support transitional and supportive housing for persons with special needs DH-2.1 Improve affordability of owner and rental housing for LMI families DH-2.2 Provide tenant-based rental assistance to make housing for persons with HIV/AIDs more affordable DH-2.3 Prevent homelessness and/or assist with rapid re-housing or transition to permanent housing DH-2.4 Address short-term housing instability by providing emergency assistance for people with HIV/AIDs DH-3.1 Make existing affordable housing more sustainable and preserve affordable housing stock Performance Measure New affordable housing units Number of units assisted Households assisted Households assisted Persons assisted Households assisted Households assisted 2011 Actual % LMI % % % % % % % In order to receive funding, applicants must indicate the total number of LMI households that will benefit from project activities and this LMI percentage must be consistent with program policies. As a result, CDBG and HOME housing projects funded in any year will predominantly benefit low and moderate income households, and in 2011 the programs benefited low and moderate income households exclusively. The LMI income category - extremely low income, low income or moderate income - for each benefiting household is generally not known until the project is complete. For CDBG, income categories for households benefiting from completed projects during the program year are summarized in Efforts to Address Worst Case Needs, below, and detailed in Section III CDBG Program Narrative, CDBG Funds Benefiting Low to Moderate Income Persons. Section 215 Households Served During 2011, the HOME Program provided affordable housing rental assistance to 255 renter households meeting the definitions contained in CFR , which governs the HOME rental program, and homeownership assistance to 197 owner households meeting the definitions contained in CFR , which governs the HOME homebuyer assistance program. Additionally, HOME commitments during the program year included the production of 129 new rental units and 19 homeowner units, primarily through new development. Table 3B State Housing Completion Goals provides additional information State of South Carolina Consolidated Annual Performance & Evaluation Report Section II-C Program Year: April 1, 2011 March 31, 2012 Page 38
45 SECTION II GENERAL PERFORMANCE NARRATIVE C Affordable Housing Efforts to Address Worst Case Needs Worst case affordable housing needs are defined as housing needs by low-income renters with severe cost burden, in substandard housing, or involuntarily displaced. During fiscal year 2011, South Carolina s Section 8 Housing Choice Voucher Program administered by the State Housing Finance and Development Authority (SHFDA) provided rental assistance to very low income individuals and their families in the following South Carolina counties: Clarendon, Colleton, Dorchester, Fairfield, Kershaw, Lee, and Lexington. A total of $123.3 million in assistance was provided to very low income families who, without this assistance, would otherwise be severely cost burdened. SHFDA also provides contract administration for HUD-subsidized apartments in privately owned complexes, reviewing and approving monthly assistance payments, conducting annual management and occupancy reviews and helping to facilitate housing for numerous families living in HUD housing in the state. Combined, the Section 8 Housing Choice Voucher Program and Contract Administration Programs benefited 19,918 very low income families in FY Additionally, approximately $7.3 million was awarded from the South Carolina Housing Trust Fund in FY 2011, including projects in which HOME also participated and provided an additional $1.2 million, and these funds included awards for rehabilitation and emergency repair of owner-occupied housing units, group homes for the disabled, emergency housing for victims of domestic violence and their families, single room occupancy rental units for working homeless and disabled veterans, multifamily rental units for single parent households, the elderly and other eligible households. Funded projects must generally benefit very low income households at or below 50% of the area median income. Projects with HOME participation benefited the homeless and the elderly, and both HOME and HOPWA provided funding to support for transitional housing for those with special needs. During program year 2011, several CDBG projects that included the connection of existing LMIoccupied housing units to public water and sewer infrastructure were completed. These projects were funded in prior years and benefited a total of 620 LMI households occupied by 1,944 LMI individuals. Of the total number of LMI people benefited, 45% or 873 are extremely low income homeowner or renter households (at or below 30% of the area median income) and an additional 35% or 671 individuals are very low income (at or below 50% of median income). Efforts to Address Accessibility Needs of Persons with Disabilities In 2011, HOME and HOPWA supported a total of 104 transitional or supportive housing units for people with special needs. In addition, SHFDA was involved in providing other special needs housing through the South Carolina Housing Trust Fund. Awards during FY 11 will help construct shelters, group homes and transitional housing to assist disabled individuals. Accessibility is a critical element of these projects. The ESG program supported 31 homeless shelters and homeless service organizations providing temporary housing and services. A total of 6,145 individuals with disabilities or special needs were served, as shown below. All are included in the total for special needs households shown on Table 3B State of South Carolina Consolidated Annual Performance & Evaluation Report Section II-C Program Year: April 1, 2011 March 31, 2012 Page 39
46 SECTION II GENERAL PERFORMANCE NARRATIVE C Affordable Housing Sheltered Homeless Served by ESG Funded Providers Program Year 2011 Disability Number Served During PY 2011 Chronically Homeless* 438 Severely Mentally Ill 168 Chronic Substance Abuse 358 Other Disability 590 Veterans 330 Persons with HIV/AIDS 14 Victims of Domestic Violence 4,084 Elderly 163 * Defined as an unaccompanied homeless person with a disabling condition who has been continually or routinely homeless HOPWA program activities during the program year included numerous activities to address the needs of persons with disabilities, specifically people living with HIV/AIDS (PLWHA). HOPWA provided tenant based rental assistance to 142 PLWHA, as well as short term assistance with mortgage, rent and utilities to an additional 319 additional PLWHA. HOPWA funding also provided supportive services activities, including case management, employment services, and transportation necessary to gain access to care, to 1,040 PLWHA. PLWHA benefitting from housing activities, or tenant based rental assistance and short term assistance, are included in the total for special needs households on Table 3B State of South Carolina Consolidated Annual Performance & Evaluation Report Section II-C Program Year: April 1, 2011 March 31, 2012 Page 40
47 D. Continuum of Care Actions taken by entities other than the four formula HUD grant programs, including the South Carolina Council on Homelessness and the regional continua of care providers, are described in Section II E Other Actions, Actions to Address Underserved Needs. Section II D below focuses on activities and accomplishments for HOPWA and ESG. ESG Funded Activities and Accomplishments Homeless Persons and Persons at Risk of Becoming Homeless Object. Nbr Outcome/Objective Performance Measure 2011 Goal 2011 Actual DH-2 Affordability of Decent Housing DH-2.3 Prevent homelessness Persons assisted SL-1 SL-1.2 SL-1.3 Availability/Accessibility of Suitable Living Environment Support organizations that provide essential services to homeless individuals and families Provide emergency shelter and services for homeless persons HOPWA Funded Activities and Accomplishments Supportive Housing for Persons with Special Needs Entities assisted Persons assisted 30,000 24,403 Object. Nbr DH-1 DH-1.3 DH-2 DH-2.2 DH-2.4 SL-1 SL-1.4 Outcome/Objective Availability/Accessibility of Decent Housing Support transitional housing and supportive housing facilities for people with special needs Affordability of Decent Housing Provide tenant-based rental assistance to make housing for persons with HIV/AIDS more affordable Address short-term housing instability by providing emergency assistance for people living with HIV/AIDs Availability/Accessibility of Suitable Living Environment Provide supportive services to persons with special needs to promote independent living Performance Measure Number of Housing units assisted 2011 Goal 2011 Actual Persons assisted Persons assisted Persons assisted 850 1,040 Actions Taken to Address the Needs of Homeless Persons and Persons with Special Needs Who Require Supportive Housing Among the four HUD programs covered by the Consolidated Plan, the Emergency Shelter Grant (ESG) and Housing Opportunities for Persons With HIV/AIDS (HOPWA) programs are those generally targeted toward the state s objectives relating to homeless persons, those at risk of becoming homeless and supportive housing for persons with special needs. These objectives, 2011 State of South Carolina Consolidated Annual Performance & Evaluation Report Section II-D Program Year: April 1, 2011 March 31, 2012 Page 41
48 SECTION II GENERAL PERFORMANCE NARRATIVE D Continuum of Care DH-1.3, DH-2.2, DH-2.3, DH-2.4, SL-1.2, SL-1.3, and SL-1.5, and related accomplishments for program year 2011 are summarized in the tables above. Emergency Shelter Grant Program (ESG) The ESG program is designed as the first step in a continuum of assistance to prevent homelessness and to enable the homeless population to move steadily toward independent living. The Continuum of Care model is based on the understanding that homelessness is not caused by simply a lack of shelter, but involves a variety of underlying needs. HUD believes the best approach for alleviating homelessness is through a community-based process that provides a comprehensive response to the diverse needs of homeless persons. The fundamental components of a Continuum of Care system are: Outreach and assessment to identify a homeless person's needs, Immediate (emergency) shelter as a safe, decent alternative to the streets, Transitional housing with appropriate supportive services to help people reach independent living, and Permanent housing or permanent supportive housing for the disabled homeless. In 2011, in order to address the needs of homeless persons and persons with special needs who are at risk of homelessness and require supportive services, the ESG program funded emergency shelter and transitional housing programs for the homeless. ESG funds supported thirty-one (31) homeless service providers which operate or support emergency or transitional shelters with a total capacity of 1,354 beds. All sub-recipients of ESG must exhibit through their applications and the monitoring process how they initiate the continuum of care process. The sub-recipients client intake, counseling, and case management processes must evaluate client needs and provide a connection within their community with which to fulfill those needs. The sub-recipients evaluation of client needs usually entails the service areas of housing, employment, financial management, transportation, mental illness, substance abuse, physical and/or mental disability, and general health care. Additionally, sub-recipients also evaluate legal aid and educational needs. Funding provided by ESG can be used by supported shelters for the following activities: Renovation, rehabilitation or conversion of buildings for emergency homeless shelters Provision of essential services Shelter operating expenses Developing and implementing homeless prevention efforts ESG funding was also made available for Homeless Management Information System (HMIS) administrative costs incurred by ESG grant recipients. Three received funds to assist with HMIS in During the program year, $1.47 million in ESG funds were available and the majority was used to meet operating costs. Using ESG funds, supported agencies provided services to 24,403 persons in the form of short-term and long-term temporary shelter, rental and utility assistance to 2011 State of South Carolina Consolidated Annual Performance & Evaluation Report Section II-D Program Year: April 1, 2011 March 31, 2012 Page 42
49 SECTION II GENERAL PERFORMANCE NARRATIVE D Continuum of Care prevent eviction, counseling, job assistance, education, health care and other assistance aimed at promoting independent living. Specific programs and services, and the number of funded shelters providing them, are outlined on the following page. ESG Funded Shelters Program Year 2011 Programs and Services Number of Shelters Program/Service 23 Emergency Shelter Facilities or Vouchers for Shelters 11 Transitional Housing 10 Homeless Prevention 8 Outreach 8 Employment 7 Mental Health 7 Child Care 6 Health Care 5 Food Pantry 4 Soup Kitchen/Meal Distribution 4 Alcohol/Drug Program 1 HIV/AIDs Services 10 Other (transportation, clothing, hygiene kits, and counseling) Housing Opportunities for Persons with HIV/AIDS (HOPWA) During the program year, HOPWA efforts focused on making decent, supportive housing available and affordable for persons with special needs who are at risk of becoming homeless. Persons living with HIV/AIDS (PLWHA) have housing needs that cover a wide spectrum from one-time utility assistance to homelessness and end of life hospice care. During program year 2011, the HOPWA program funded service providers undertaking a number of different activities from supportive services to financial support of existing transitional housing facilities. All of these are elements of the continuum of care for PLWHA. Supportive services include case management and transportation, and as part of case management, evaluation of housing needs. Where appropriate, case management leads to shortterm rent, mortgage and utility payments (STRMU), tenant based rental assistance (TBRA) or housing placement services. STRMU is appropriate in cases where a health related emergency requires assistance for a limited amount of time, whereas tenant based rental assistance offers longer term housing support to ensure the availability of decent supportive housing. Housing placement and facility based housing services assist individuals in need of transition from a hospital or mental health facility to a more permanent living situation, and stewardship units are provided for individuals that have reached a degree of self reliance and no longer require assistance in daily activities. As the AIDS epidemic changes and PLWHA begin to live longer, more individuals require longer term housing support and services to transition to independent living. Supportive services, such as transportation and employment services, are critical to helping individuals maintain housing stability State of South Carolina Consolidated Annual Performance & Evaluation Report Section II-D Program Year: April 1, 2011 March 31, 2012 Page 43
50 SECTION II GENERAL PERFORMANCE NARRATIVE D Continuum of Care During the program year, emergency assistance continued to play an important role and shortterm rent, mortgage and utility payments was provided to 319 PLWHA to ensure they could afford appropriate and supportive housing (DH-2.4). However, there was greater need for longer term solutions, and more people were assisted during the year through tenant based rental assistance, supportive services and community based transitional and supportive housing. Tenant based rental assistance was provided to 142 PLWHA; supportive services were provided to 1,040 PLWHA; and HOPWA provided support to 32 supportive or transitional community based housing facilities. Actions Taken to Prevent Homelessness and Help Homeless Persons Transition to Permanent Housing and Independent Living During the program year, activities aimed at preventing homelessness and promoting independent living were funded by ESG and HOPWA. As part of the Continuum of Care for people living with HIV/AIDS, HOPWA funds provide short term emergency housing assistance which, for individuals in crisis, can prevent homelessness. Short term rent, mortgage, and utility assistance was provided to a total of 319 people living with HIV/AIDS. HOPWA also funded supportive services activities to promote independent living. These services were provided to 1,040 individuals through a network of local organizations primarily funded through the federal Ryan White CARE Act, but which also received HOPWA funding in Both HOPWA activities are discussed in more detail in the section above. Homeless prevention activities funded by ESG increased steadily throughout the last five-year plan period, in response to greater national emphasis on homeless prevention, availability of new homeless prevention funds through the American Recovery and Reinvestment Act Homeless Prevention and Rapid Re-Housing Program (HPRP), and program changes aimed at encouraging prevention activities. The result was an increase from 230 at risk persons assisted in 2006 to 958 in In 2010, accomplishments for ESG and HPRP combined indicated still further growth in the number of at risk individuals and families that were helped to maintain permanent housing. During the current program year, Emergency Solutions Grant Program funding, which was expected to provide a second phase of 2011 funding and additional preventive funding, was not received as the final regulations for the new Solutions program were not completed in time. Next program year, the Solutions funds for 2011 will be available in addition to the 2012 Emergency Solutions Program funds. Even with less funding than anticipated, ESG program activities during the year were successful in achieving the homeless prevention goal. ESG funded shelters reported somewhat lower than expected numbers of homeless sheltered during the year, indicating a continued downward trend in sheltered homeless and progress toward helping homeless individuals transition out of homelessness or avoid homelessness. New Federal Resources Obtained From the Homeless SuperNOFA During the program year, neither the Governor s Office of Economic Opportunity, which administers the ESG program, nor the SC Department of Health and Environmental Control, which administers the HOPWA program, received new federal resources from the Homeless SuperNOFA. Homeless programs representing each of the state s four Continuums of Care regions (Charleston/Lowcountry, Greenville/Anderson/Spartanburg Upstate, Columbia/ Midlands, and Myrtle Beach/Sumter) were awarded $9.4 million in the Continuum of Care competition held during the 2011 program year. In addition, Charleston and Greenville Counties received $306,478 in ESG funds directly from HUD State of South Carolina Consolidated Annual Performance & Evaluation Report Section II-D Program Year: April 1, 2011 March 31, 2012 Page 44
51 SECTION II GENERAL PERFORMANCE NARRATIVE E Other Actions E. Other Actions Actions taken by the four formula grant programs, CDBG, HOME, HOPWA and ESG, to further the goals of the Consolidated Plan are described above, in Section II A - Assessment of Annual Goals and Objectives, Section II B - Affirmatively Furthering Fair Housing, Section II C -Affordable Housing and Section II D Continuum of Care. However, the State has taken substantial other actions with respect to: Addressing underserved needs, Fostering and maintaining affordable housing, Eliminating barriers to affordable housing, Institutional structure and coordination, Public housing, Lead-based paint hazards, and Reducing the number of persons living in poverty. These actions are described below. Actions to Address Underserved Needs Homeless Persons Prior to 2003, no single federal or state agency or organization in South Carolina was charged with planning and implementing a strategy to combat homelessness. In March 2003, the first South Carolina Council on Homelessness was convened. The overall goal was to improve the housing and service delivery system for homeless individuals and families in the state, and the Council s mission was to develop and implement a ten year plan to end chronic homelessness. In November 2004, the Council submitted its Blueprint to End Homelessness in South Carolina, which includes goals, strategies and objectives organized around five key areas: prevention, housing, services, effectiveness and accountability of the SC Homelessness Council itself, and data. The plan s five goals are: Establish a seamless integrated housing and service delivery system that links individuals and families with programs needed to prevent homelessness. Establish a sustainable continuum of housing options to ensure that all South Carolinians, including those who are homeless, have access to quality, affordable housing near services and amenities. Ensure that all homeless South Carolinians have access to the supportive services needed to achieve self sufficiency. Ensure the ability of the SC Council on Homelessness to achieve its vision. Develop a statewide homeless data collection and analysis system that will provide the information to address homelessness in South Carolina and evaluate the effectiveness of strategies and programs State of South Carolina Consolidated Annual Performance & Evaluation Report Section II-E Program Year: April 1, 2011 March 31, 2012 Page 45
52 SECTION II GENERAL PERFORMANCE NARRATIVE E Other Actions The Blueprint is still the guiding document for South Carolina s efforts to address homelessness, but major strides have been made in terms of coordinating previously independent state and continuum of care efforts as a result of Homeless Prevention and Rapid Re-housing (HPRP) stimulus funding, major changes to the old shelter-based ESG program, and transition to the new HPRP-like and prevention-oriented Emergency Solutions Grant Program. Activities to date consisted of coordinating the broad, multi-agency efforts required to organize and implement different homeless counts, including the most recent 2011 count, and implementing and improving the accuracy of data entered into the Homeless Management Information System (HMIS). The Faces of Homelessness: A Study of Homelessness in South Carolina report furthered the understanding of homeless issues in the state, provided estimates on the extent of homelessness and information on various sub-populations, and began informing state and local level planning. It also raised public awareness and described the methodology and results of the 2007 count, which provided valuable experience used to improve procedures and the overall quality of the counts subsequently conducted in 2009 and Program Year 2011 brought with it increased federal resources for homelessness, as well as the phase out of HPRP and the phase in of the new solutions-based ESG program. It also saw new levels of collaboration amongst the state s homeless services providers, including a variety of stakeholder meetings to establish priorities, develop policies and otherwise plan for the implementation of the new Emergency Solutions Grant program in Program Year The latter was a major focus of efforts during Program Year Other major activity during the program year included analyzing the results of the fourth statewide homeless count, which was completed just before the end of the prior program year in January 2011 and continuing work on some of the goals outlined in the state s homeless plan, or the Blueprint to End Homelessness. Regarding state goals work was completed and the new $11 million Transitions Center opened in Columbia in June It will house 214 homeless individuals and also includes a respite center with 26 short-term beds for those recuperating after release from in-patient hospital care, a computer lab where residents can do housing and employment searches and prepare resumes, and a day center offering free shower and laundry facilities convenient to the Columbia bus transit center. The goal is to engage people in longer term services that help deal with the root causes of homelessness and prepare residents for transition into stable, permanent housing. In addition, several local governments, including Columbia and the City of York, partnered with Project Homeless Connect to offer one-stop shops for services targeted at homeless individuals. One-stop centers are goals in other areas, including Myrtle Beach where its newly formed Homeless Coalition identified a one-stop as the best way to deliver services to the area s homeless. Regarding the 2011 count, the count of sheltered homeless took place on January 27, 2011 and the count of unsheltered homeless ran from January 27 through January 30, As with prior counts, a primary goal of the 2011 count was to obtain a reliable estimate of homeless individuals in every county in the state, to improve on and make more uniform the implementation of the count throughout the state, and to maximize volunteer efforts and resources by incorporating reliable data from HMIS. In preparation for the 2011 count, survey tools and forms were developed, including Spanish versions, and presentations, other training materials and a timeline were developed and disseminated amongst the Continuum of Care agencies that would recruit volunteers and provide manpower for the count. In November and 2011 State of South Carolina Consolidated Annual Performance & Evaluation Report Section II-E Program Year: April 1, 2011 March 31, 2012 Page 46
53 SECTION II GENERAL PERFORMANCE NARRATIVE E Other Actions December 2010, each Continuum of Care contacted homeless service agencies in rural areas to identify locations where homeless individuals receive services, finalized lists of known locations for the unsheltered count, began preparing agencies to use HMIS in conjunction with the count, and began recruiting qualified volunteers to use survey tools and collect the 2011 data. In January 2011, activities ramped up, including training of volunteers, test runs using data extractions from HMIS, reviews of test data quality, and subsequent training of local agencies to resolve data quality issues in advance of actual reporting that would follow the count at the end of January. Information was collected through: Use of the Homeless Management Information System (HMIS) Surveys of street populations Surveys of homeless and at risk individuals in shelters not using HMIS Surveys of homeless and at risk individuals receiving services from providers not using HMIS Surveys of individuals living in sub-standard housing Surveys of individuals temporarily living in motels using vouchers Following the actual count, data entry management teams met electronically to discuss data entry protocols, additional training was provided and data entry was performed by Continuum of Care staff, the SC Budget and Control Board, Office of Research and Statistics, received all 2011 count data on March 1 and began tabulation, de-duplication and analysis, and data was submitted to the HDX homeless information exchange system. Data from the 2011 count can be found on the SC Council on Homelessness website: Results of the 2011 count and trends indicated by the 2011 data are highlighted below. A total of 4,701 people were identified as either sheltered or unsheltered homeless, with the greatest concentrations in the Midlands and Upstate. Statewide, 38.6% or 1,813 were unsheltered homeless compared with 32.0% in emergency shelters and 29.5% in transitional shelters. Unsheltered homeless is defined as in a building not meant for human habitation, outdoors, or in a car or other vehicle, emergency room, or hotel/motel, or where information is missing. Sheltered homeless totaled 2,888. Between the state s four Continuum of Care regions, however, unsheltered homeless ranges from a high of 61.7% in the Eastern Carolina Region, to 43.3% and 39.6% in the Midlands and Lowcountry Regions, to a low of only 13.3% in the Upstate Region where 86.7% of all homeless are in some form of shelter. On average, a lower 61.4% of the state s total homeless population is sheltered, which is comparable to the Lowcountry region but higher than both the Midlands (56.7%) and Eastern Carolina (38.3%) Regions. This indicates not only considerable diversity in homelessness across the state but also differing needs for homeless services and solutions. In terms of family status, the 2011 count reflects a similar pattern to the 2009 count results. Of the total homeless population, 1,269 (27.0%) were males and females in families, 3,222 (68.5%) were unaccompanied adults and 62 (1.3%) were unaccompanied youths. More than three-quarters of all unaccompanied adults were 2011 State of South Carolina Consolidated Annual Performance & Evaluation Report Section II-E Program Year: April 1, 2011 March 31, 2012 Page 47
54 SECTION II GENERAL PERFORMANCE NARRATIVE E Other Actions male, while family members and unaccompanied youth were split fairly evenly between males and females. Family households numbered 458 an average family size of 2.77 persons per household, indicating a slight increase in average family size since the 2009 count. In terms of race and ethnicity, over half (58%) of all homeless in the state were African American, which is an increase since the 2009 count when 53% were African American. By comparison, whites represented a slightly smaller share of the total homeless population in 2011 at 37.5% and Hispanic/Latinos did not change appreciably at 3% of the state s homeless. Other race categories represented 4.4%. The breakdown by age again indicates little change since the 2009 count. The 2011 data indicates that 17.8% of the total homeless population were children age 17 and younger, almost half were age 33 to 52 at 43.6% and only 2.8% were over 62. Working age adults, or those between ages 18 and 62, represented more than threequarters of all homeless. Disability continues to characterize approximately one-quarter of all homeless, declining only slightly from 28.0% in 2009 to 22.9% in Disability includes substance abuse, mental illness and HIV, but approximately half of the 1,075 homeless reporting substance abuse (41.0%) or mental illness (46.7%). Other disabilities at 28.7% and HIV at only 3.7% were less common. Homeless with disabilities were also concentrated in Richland, Greenville, Charleston and Horry Counties. Veterans represent a growing share of homeless in the state, increasing from 436 in 2007 to 612 or 13% in Three-quarters of all homeless veterans, however, are in just four counties: Richland (32.7%), Charleston (24.2%), Greenville (11.3%) and Lexington (7.2%). Chronically homeless are even more concentrated geographically, with 44.5% in Richland County and 11.5% in Horry County, but the total number of chronically homeless at 400, or 8.5% of all homeless, has decreased from 481 in 2009 and 477 in Regarding statewide distribution, Horry County had the highest number of homeless in 2009, but in 2011 Richland (1,065) and Greenville (711) Counties both surpassed Horry (544), followed by Charleston County (449). Spartanburg, York, Florence, Anderson, Sumter, and Lexington made up the rest of the top ten counties in terms of homelessness, and the top ten as a whole accounted for 3,847 or 82% of the state s homeless. Not surprisingly, the top ten also correspond to the state s more urban areas. By shelter type, Greenville (653) and Richland (599) had substantially more homeless in emergency and transitional shelters than any other county, with the next highest being Charleston (294) and Spartanburg (261). Richland also had the highest number of unsheltered homeless (466), followed by Horry (365) and Charleston (155). All other counties had fewer than 100 unsheltered homeless. Regionally, As a percentage of the county population, the highest rates of homelessness were indicated in the following counties: Richland (27.7%), Horry (20.2%), Allendale (18.2%), Greenville (15.8%) and Kershaw (15.4%). Eight other counties had rates higher than the state average of 10.2%, including: Sumter (14.01%), Georgetown (13.6%), Florence (13.4%), Charleston (12.8%), Marlboro (12.8%), Cherokee 2011 State of South Carolina Consolidated Annual Performance & Evaluation Report Section II-E Program Year: April 1, 2011 March 31, 2012 Page 48
55 SECTION II GENERAL PERFORMANCE NARRATIVE E Other Actions (11.8%), Fairfield (10.9%) and Williamsburg (10.5 These rates are based on the 2011 count and population figures for South Carolina counties available from the 2010 census. In addition to the efforts of the Council on Homelessness, there are four regional homeless coalitions, which annually compete for their own funds from HUD, as well as funds from the State ESG Program. Other organizations involved in the homeless continuum of care include non-profits and others operating emergency and transitional shelters and permanent supportive housing, as well as providers of essential and supportive services to assist those who currently are homeless, shorten the duration of homelessness, facilitate the transition out of homelessness, or prevent homelessness for those currently at risk. Increasingly, the focus is on prevention and services, including outreach to unsheltered homeless and services and solutions aimed at decreasing chronic homelessness. Overall, the purpose of the homeless continuum of care is to identify and meet the needs of the homeless populations in the state by developing a seamless system of support, and providers consist of the four CoCs, homeless organizations, private individuals, non-government service providers, housing providers and developers, local government, local and county social service agencies, faith based institutions and business leaders. At the state level, the State Housing Trust Fund administered by SHFDA allows new construction and rehabilitation of homeless shelters and supportive housing as eligible activities. The Department of Mental Health also targets funding to housing and homelessness, and the state receives block grant funding for substance abuse, mental health and social services, all three of which the federal government intends for the treatment of people who are homeless. Other agencies, using primarily State or federal funding sources, also undertake activities as described in the Consolidated Plan. Activities during any year generally include the provision of information, outreach and referral, assistance to non-profit organizations, capacity-building, advocacy, continuum of care services, and technical assistance. Special Needs Including ESG, HOPWA and HOME, many other organizations provide services on a statewide or regional basis for non-homeless special needs populations, including the elderly, low-income families, persons with mental and physical disabilities, and persons with HIV/AIDS. Actions related to persons with disabilities are discussed in Section II C Affordable Housing, Efforts to Address Accessibility Needs of Persons with Disabilities. Actions related to persons with HIV/AIDS are discussed in Section II D Continuum of Care, Actions Taken to Address the Needs of Homeless Persons and Persons with Special Needs Who Require Supportive Housing. During 2011, service providers in the state continued to provide advocacy, direct assistance, funding, information, and/or referrals. A key player in terms of advocating for and developing housing for those with mental illness is typically the SC Department of Mental Health (DMH). However, ongoing budget cuts in recent years have reduced DMH s ability to fund new housing construction, and again in FY the agency was unable to meet its goal of developing 40 new supportive housing units. On the other hand, DMH administered eight HUD Shelter Plus Care grants that fund nine programs in 14 counties and through these programs maintained 183 existing units. DMH also provides funding for special needs housing through its Toward Local Care (TLC) Program, which is designed to return long-term psychiatric inpatient clients to live in the community with intensive support from Community Mental Health Centers. While unable to 2011 State of South Carolina Consolidated Annual Performance & Evaluation Report Section II-E Program Year: April 1, 2011 March 31, 2012 Page 49
56 SECTION II GENERAL PERFORMANCE NARRATIVE E Other Actions meet the goal of adding 45 additional units, DMH was able to maintain an existing 1,010 units. To date, 2,960 clients with serious and persistent mental illness, including 2,105 from an institutional setting, have participated in the program. This community-based treatment is not only better for the patient, but more financially feasible as costs are lower. A list of programs and services with a statewide service area follows. Additionally, a wide variety of local, regional and community based service providers exist throughout the state that provide either direct assistance or support services to individuals with disabilities, and an additional number of statewide agencies exist to support specific segments of the special needs population. Providers of Special Needs Services in South Carolina Organization Advocacy Primary Services Direct Funding Assistance Information/ Resources Affordable Housing Coalition X X ARC of South Carolina X X X X Commission for Minority Affairs X X Community Action Agencies (15 statewide) X X Community Development Corporations X X X Community Development Credit Unions (CDCUs) X X Community Development Financial Institutions (CDFIs) X X Continuum of Care for Emotionally Disturbed Children (Governor s Office) X X Councils of Government (10 Statewide) X X Councils on Aging X X X X County Departments of Mental Health X X X X SC Access (Lt. Governor s Office on Aging) X X SC Assistive Technology Program X X X SC CAP - Client Assistance Program (Governor s Office) X X X X SC Department of Alcohol and Other Drug Abuse Services X X X SC Department of Commerce, Grants Administration X SC Department of Disabilities and Special Needs and County Boards of Disabilities and Special Needs X X X X SC Department of Education Office of Exceptional Children X X SC Department of Health & Environmental Control (DHEC) X X X X SC Department of Labor - Migrant Farm Workers X X SC Department of Mental Health X X X X SC Department of Vocational Rehabilitation X SC Developmental Disabilities Council (Governor s Office) X X X SC Disabilities Network X X SC Independent Living Council X X X SC School for the Deaf and Blind Family Connection of South Carolina X X Federation of Families of South Carolina X X Federal Home Loan Bank of Atlanta X Governor s Office of Economic Opportunity X X X Habitat for Humanity X Harvest Hope Food Bank X X Help-line of the Midlands X Human Affairs Commission X X Humanities Foundation X X Institute on Poverty & Deprivation X X Legal Services Association X X Local Public Housing Authorities X National Alliance for the Mentally Ill (NAMI) X X X Nehemiah Corporation X X Palmetto Development Group (CDFI) X X Protection and Advocacy for People with Disabilities X X X X Ryan White HIV Care Consortia (13 statewide) X X X X Referral 2011 State of South Carolina Consolidated Annual Performance & Evaluation Report Section II-E Program Year: April 1, 2011 March 31, 2012 Page 50
57 SECTION II GENERAL PERFORMANCE NARRATIVE E Other Actions Providers of Special Needs Services in South Carolina Organization Advocacy Direct Assistance Primary Services Funding Information/ Resources Protection & Advocacy Systems for the Handicapped X X X X Regional Housing Authorities X Rural Interagency Alliance X X X Salvation Army X X X State and County DSS Offices X X X X State Budget and Control Board, Office of Research and Statistics X State Housing Finance and Development Authority X X Telamon Corporation X United Methodist Relief Center X United Way X X X Urban Leagues X X U.S. Department of Housing and Urban Development (HUD) X U.S. Department of Veterans Affairs X X X Veterans Advocate Outreach X X X Referral Actions to Foster and Maintain Affordable Housing The primary resources for addressing affordable housing in South Carolina are administered by the State Housing Finance and Development Authority (SHFDA), which also administers the HOME Program, a variety of state programs like the Housing Trust Fund, and a number of new federal programs that have been developed in recent years in response to the economy and weak housing conditions. The first of these programs, the HUD Neighborhood Stabilization Program (NSP), was created under the Housing and Economic Recovery Act (HERA) of 2008 to specifically respond to rising foreclosures and declining property values. NSP funds were a special allocation of CDBG funds that could be used to provide emergency assistance in acquiring and redeveloping foreclosed properties that might otherwise become sources of abandonment and blight in communities around the state. South Carolina received $44.6 million under the first round of funding in 2008 and received an additional $5.6 million under the third round of funding or NSP3 in The Substantial Amendment to the state s 2010 Consolidated Annual Action Plan for NSP3 was targeted to areas of greatest need, which were also small enough so that at least 20% of the REO properties and foreclosure starts during the year received NSP3 assistance. According to HUD, the minimum 20% assistance rate is necessary to achieve a stabilizing impact. To further increase the impact of NSP3, SHFDA selected subrecipients with highest need, which also were already successfully administering NSP1 grant funds. In this way, NSP3 complemented existing efforts, built on existing momentum and leveraged NSP dollars previously awarded. The cities of Florence, Rock Hill and Spartanburg and Richland County received NSP3 funds. Federal funds and initiatives following in the wake of HERA include: Low Income Housing Tax Credits - Efforts by Congress to help stimulate demand for Low Income Housing Tax Credits (LIHTC) by creating the HUD Tax Credit Assistance Program (TCAP) and Housing Credit Exchange Program, under which South Carolina received a $25.4 million TCAP, and increasing the per capita tax credit amount by 20 cents in 2009 and again by 10 cents more in Combined 2011 State of South Carolina Consolidated Annual Performance & Evaluation Report Section II-E Program Year: April 1, 2011 March 31, 2012 Page 51
58 SECTION II GENERAL PERFORMANCE NARRATIVE E Other Actions with the TCAP allocation, the tax credit increases provided the equity needed to move developments forward, helped facilitate 2011 Low Income Housing Tax Credit awards of $10.8 million and resulted in 882 new rental units for low income families. Neighborhood Stabilization Program - The Neighborhood Stabilization (NSP) Program was created under the Housing and Economic Recovery Act to respond to rising foreclosures and declining property values. NSP funds are a special allocation of the Community Development Block Grant funds designed to provide emergency assistance in acquiring and redeveloping foreclosed properties that might otherwise be abandoned, allowed to deteriorate and become a blighting influence on the community. The NSP3 Program was created under section 1497 of the Dodd-Frank Wall Street Reform and Consumer Protection Act of 2010 and represents a third round of funding under which South Carolina received an additional $5 million. One hundred percent of NSP3 funds were committed in FY 2011 to the state s areas of greatest need. South Carolina Homeownership and Employment Lending Program (SC HELP) - In 2010, the US Department of the Treasury announced funding available through HUD s Housing Finance Agency Innovation Fund for the Hardest Hit Housing Markets (HFA). An initial $138 million was followed by an additional $58 million allocated to South Carolina to assist hardest hit homeowners. South Carolina was selected for the HFA funding due to high, sustained unemployment. Following a successful pilot program, the US Treasury Department approved South Carolina s readiness assessment, and the program was expanded statewide effective January Through June 2011, SC HELP had committed $4 million to help 300 homeowners and an additional 6,000 households had begun the process of requesting assistance. SC HELP expects to use $300 million to assist responsible but struggling homeowners in South Carolina through monthly payment or direct loan assistance. The program is being administered by SC Housing Corp., a non-profit division of SHFDA and reported its first quarter results for the quarter ended March 31, At that time, more than 90% of households approved for assistance had incomes at or below 80% of the area median income, 67% reported unemployment as the underlying cause of hardship, and 39% were 90 days or more delinquent on their mortgage. Using new resources described above, and in addition to HOME program funding and accomplishments described above in Section II A Assessment of Annual Goals and Objectives and Section II B - Affordable Housing, SHFDA invested an additional $276.4 million in affordable housing activities in 2011 through its state programs, which resulted in: homeownership assistance to 2,333 households, Section 8 rental and contract administration assistance making housing affordable for 19,918 families, and creation of 2,902 new affordable housing units. Below is a summary of state housing programs administered by SHFDA and their considerable funding and accomplishments for A discussion of each program follows State of South Carolina Consolidated Annual Performance & Evaluation Report Section II-E Program Year: April 1, 2011 March 31, 2012 Page 52
59 SECTION II GENERAL PERFORMANCE NARRATIVE E Other Actions SC State Housing Finance and Development Authority State Programs Affordable Housing Actions and Accomplishments Fiscal Year 2011 Program Mortgage Revenue Bond Section 8 Housing Choice Voucher and Contract Administration SC HELP Homeownership & Employment Lending Program Type of Accomplishment Number of low and moderate income households provided homeownership assistance to in the form of below market interest rate loans Number of very low income households provided with rent and utility subsidies to keep housing costs at 30% of household income, plus number of affordable rental units in HUD-subsidized apartments in privately-owned complexes provided with administrative services Number of homeowners who had fallen behind on their mortgage payments due to unemployment or other unforeseen circumstances and who received assistance needed to avoid foreclosure FY 2011 Accomplishments Total FY 2011 Funding Invested (In Millions) 2,033 $ ,918 $ $4.0 Total Homeownership and Rental Assistance 22,251 $237.3 South Carolina Housing Trust Fund Low Income Housing Tax Credit Multifamily Tax Exempt Bond Program Number of new affordable housing units resulting from acquisition or construction of affordable single family homes and development of affordable: group homes for the disabled, emergency housing for battered women and their children, single room occupancy units for working homeless and disabled veterans, multifamily rental units for single-parent households, families and the elderly Number of new affordable multifamily rental units developed Number of low income multifamily rental units financed (all units created through rehabilitation) Total New Affordable Housing Units Created through New Construction or Rehabilitation Total State Funds Invested by SHFDA in $ $10.8 1,548 $21.0 2,902 $39.1 $276.4 million Mortgage Revenue Bond Program The Mortgage Revenue Bond (MRB) Program, administered by SHFDA, is the State s primary tool for expanding homeownership opportunities for low and moderate income families in South Carolina. The sale of tax exempt bonds to investors provides the bulk of the funding available to qualified, first-time homebuyers. Banks and mortgage companies originate mortgage loans on the agency s behalf and offer them at reduced interest rates. This below market rate financing provides the edge needed to make homeownership affordable for many of the state s lower income residents. Maximum purchase price and borrower income limits apply and typically vary by county. During 2011, MRB program funding alone totaled $110 million and helped 2,033 low and moderate income South Carolinians achieve homeownership State of South Carolina Consolidated Annual Performance & Evaluation Report Section II-E Program Year: April 1, 2011 March 31, 2012 Page 53
60 SECTION II GENERAL PERFORMANCE NARRATIVE E Other Actions South Carolina Housing Trust Fund In 1992, landmark legislation established the South Carolina Housing Trust Fund and created a valuable resource for affordable rental housing and homeownership opportunities for low income residents of the state. Funding comes from a dedicated portion of the deed stamp tax, tying annual funding levels directly to the state s level of real estate activity. Awards from the Housing Trust Fund are available to eligible non-profit housing development sponsors in all 46 counties. Funds are awarded on a quarterly basis and can be used to finance acquisition or construction of affordable single family homes or the development of affordable group homes for the disabled, emergency housing for battered women and their children, single room occupancy units for working homeless and disabled veterans, and multifamily rental units for single-parent households, families and the elderly. SHFDA provides technical assistance and compliance monitoring of Housing Trust Fund financed developments. Proposals are submitted to SHFDA s Board of Commissioners and awards are made based on local housing needs, development feasibility, and available resources. In 2011, a total of $7.3 million was awarded from the Housing Trust Fund to provide 472 affordable housing units for South Carolina families. This is a substantial decrease over funding available and awarded in 2009 and 2010 to provide 738 and 670 units respectively. The decreased availability of funds reflects the downturn in real estate development activity and related deed stamp taxes and restricts new affordable housing development which can be undertaken as a result of assistance from the Housing Trust Fund. Multifamily Tax Exempt Bond Program SHFDA s Multifamily Tax Exempt Bond Program provides permanent real estate financing for property being developed for multifamily rental use through the sale of tax-exempt revenue bonds. Since 1982, the Multi-Family Tax Exempt Bond Finance Program has provided permanent financing for apartments in more than 50 complexes located throughout the state. Financing is available to non-profit and for-profit sponsors, or developers, who agree to set aside: a) at least 20% of the units for households with annual gross incomes at or below 50% of the area median income, or b) 40% or more of the units for households whose annual gross income is at or below 60% of the area median. After a development has been placed in service, SHFDA staff review tenant records and development financial records, perform physical site inspections to ensure compliance with management and operating restrictions, and approve and conduct training for management personnel. During FY 2011, $21 million was allocated to help finance 41 multi-family developments in 36 communities in South Carolina. Low Income Housing Tax Credit Program The Low Income Housing Tax Credit Program (LIHTC) is a federal program administered in South Carolina by SHFDA. Its purpose is to provide an incentive to owners developing affordable multifamily rental housing. Allocations of credits are used to leverage public, private and other funds in order to keep rents affordable. Developments that may qualify for credits include new construction, acquisition with rehabilitation, and rehabilitation and adaptive re-use State of South Carolina Consolidated Annual Performance & Evaluation Report Section II-E Program Year: April 1, 2011 March 31, 2012 Page 54
61 SECTION II GENERAL PERFORMANCE NARRATIVE E Other Actions Developers who are awarded tax credits must agree to keep apartments affordable and available to lower income tenants for at least 30 years. Annually, the SHFDA establishes priorities and needs in its QAP, or Qualified Tax Credit Allocation Plan, and accordingly allocates tax credits for rental housing development projects which add to or significantly improve existing rental stock through redevelopment (rehabilitation); projects which promote and encourage the addition of or significant upgrade of rental housing in rural areas; projects which develop affordable rental housing in areas experiencing economic growth where current supply is limited; projects which attract (leverage) or preserve existing federal, state, and local subsidies through additional assistance; projects which help preserve long-term affordability of at-risk low income units; and projects which provide housing to disabled persons. Ten percent of the state s annual LIHTC allocation is reserved for the exclusive use of joint venture projects that involve the substantive participation of qualified non-profit organizations. In 2011, the funding allocation for the Low Income Housing Tax Credits program was $10.8 million. Awards were made to developers who will create 882 new affordable multifamily rental units in 15 housing developments. These accomplishments were facilitated by the Tax Credit Assistance and Tax Credit Exchange Programs (TCAP and TCEP) which were instrumental to boosting investor demand for low income housing tax credits in 2009 and Although investor demand rebounded somewhat in 2011 and Congress reduced the per capita tax credit amount to $2.10, states were allowed to retain the discretionary basis increase for Section 8 The Section 8 Rental Assistance Program is funded by the HUD and administered under contract with HUD by SHFDA. There are three (3) components to the state-administered Section 8 Program: Housing Choice Vouchers, Moderate Rehabilitation, and Homeownership Vouchers. The Section 8 Housing Choice Voucher Program provides rental assistance in the private rental market to very low income individuals and families in Clarendon, Colleton, Dorchester, Fairfield, Kershaw, Lee, Lexington, and Williamsburg Counties. The program is funded by HUD and limited by HUD s budget. Qualified families pay approximately 30% of their income toward rent and utilities and the program pays the difference. Currently, there is a waiting list for the program, and the waiting list is closed in most counties. Applicants must have a Gross Income below HUD s annually published income standard, and elderly, disabled and veteran applicants are given priority. Income limits are based on family size and county residence. During 2011, tenant-based or project-based rental assistance and contract administration activities for HUD-subsidized rental units in privately owned complexes totaled $123.3 million and benefited 19,918 very low income households. Actions to Eliminate Barriers to Affordable Housing Barriers to affordable housing were identified and evaluated as part of the development of the state s new Consolidated Plan for Housing and Community Development and the state s new Analysis of Impediments. Affordable housing development can be impeded by a variety of factors including zoning and land use policy, administrative and processing procedures involved in review, permitting and approval of housing development, property taxes, exactions 2011 State of South Carolina Consolidated Annual Performance & Evaluation Report Section II-E Program Year: April 1, 2011 March 31, 2012 Page 55
62 SECTION II GENERAL PERFORMANCE NARRATIVE E Other Actions and fees, local building codes, transportation, development and infrastructure costs and neighborhood opposition to local affordable housing development, or an attitude known as NIMBY, or Not In My Backyard. Identified barriers include: Limited availability of affordable housing sites o Scattered sites for affordable housing are not widely available or available in all communities with affordable housing needs. o Access to existing infrastructure and transportation limit locations suitable for affordable housing. o Given the limited locations where affordable housing exists, as transportation costs increase the distance between affordable housing options and job centers places an unequal burden on lower income groups. o NIMBY persists and continues to hinder the development of available sites. Zoning and regulatory barriers restrict affordable and supportive housing locations and impact costs. o Zoning procedures have not been reviewed locally in all communities. o Zoning requirements often restrict the placement of affordable housing, particularly rental housing and group homes for special needs populations. o Administrative fees and processing delays are costly and decrease affordability of even lower cost housing developments. Actions to address these barriers will help provide a greater supply of affordable housing in locations near jobs and services and improve the number of housing options available to lower income populations, which in South Carolina encompass a high degree of minorities, elderly and persons with disabilities, as well as households with single female parents. Expanding housing options in areas that are accessible to persons with disabilities, and increasing the awareness of requirements of developers and housing providers regarding accessibility and accommodations, will help eliminate physical barriers to housing choice for people with disabilities, who often have a difficult time locating suitable and accessible housing, and it will also facilitate aging in place of existing residents whose accessibility needs may currently be met but which may change as they get older. During the 2011 program year, SHFDA, CDBG, HOPWA, other housing partners in the state continued to make progress toward overcoming barriers to affordable housing. Activities are summarized below. SHFDA hosted the 2012 Palmetto Affordable Housing Forum, a two-day conference which encompassed topics, education and skills necessary to implement the strategies and overcome the barriers outlined above. Every year the forum consistently promotes SHFDA programs and tools for: o Cutting production and financing costs to make affordable single and multifamily rental projects more attractive to developers and thereby expand the affordable housing State of South Carolina Consolidated Annual Performance & Evaluation Report Section II-E Program Year: April 1, 2011 March 31, 2012 Page 56
63 SECTION II GENERAL PERFORMANCE NARRATIVE E Other Actions o Lowering purchasing and financing costs to make homeownership more affordable for more families. SHFDA held Lender Partner and SC State Housing Authority Certified Real Estate Professional training classes, as well as Legal and Real Estate continuing education credit seminars during the Palmetto Affordable Housing Forum, to increase awareness of housing programs and resources to expand the supply of affordable housing and increase homeownership opportunities in the state. Under the Palmetto Heroes Program, $15 million was earmarked to assist local heroes to become homeowners. Law enforcement officers, teachers, veterans, fire fighters, nurses and EMS personnel were all eligible for the 2011 program which featured a reduced mortgage interest rate and down payment assistance up to $5,000. SHFDA lowered rates for both its First-Time Home Buyers and Palmetto Heroes programs during the year, thereby making homeownership even more affordable. SHFDA issued $70 million in mortgage bonds in October in conjunction with the US Treasury Department s New Issue Bond Program. Revenue from the bonds was used to fund mortgages through the First-Time Home Buyer Program. SHFDA built on the successful pilot SC HELP program in January 2011, continued to accept applications for assistance and expanded eligibility for the program to include underemployed as well as unemployed homeowners. The program is designed to help responsible but struggling homeowners avoid foreclosure, thereby keeping homeowners in existing housing situations and restoring affordability. SHFDA also maintained its scmortgagehelp.com website to promote the SC HELP program, recruit housing counseling agencies interested in participating in the program, guide borrowers through the process of applying for assistance, and communicate resources available to assist with foreclosure prevention. Foreclosure prevention clinics and events around the state are posted on the site, along with links to regional agencies and websites dedicated to foreclosure prevention and assistance. SHFDA helped educate homeowners about its new SC HELP program by participating in a public forum held in Charleston in March Other participants included AARP, Appleseed Legal Justice Center, local bank representatives and local elected officials. All participants provided staff to advise consumers on steps to avoid foreclosure. SHFDA, the US Department of Agriculture (USDA) and HUD announced a partnership that will reduce regulatory burdens on affordable housing developers and owners and enable state and federal agencies to better serve low-income rental families. Via the partnership, SHFDA, USDA and HUD have worked together to increase communication between agencies, align the complex Subsidy Layering Review requirements for each program, provide a one-stop shop for developers seeking funding assistance, implement timelines to expedite reviews and simply the application process. This will hopefully address the administrative and procedural barriers to affordable housing development at the state and federal level. SHFDA continued to maintain and heavily promote its online tool for listing and searching affordable housing in South Carolina, SCHousingSearch.com State of South Carolina Consolidated Annual Performance & Evaluation Report Section II-E Program Year: April 1, 2011 March 31, 2012 Page 57
64 SECTION II GENERAL PERFORMANCE NARRATIVE E Other Actions SHFDA used social media to disseminate information to housing partners, homeowners and renters and others interested in housing in the state. The agency has continued its regular electronic newsletter and continued to use Twitter and Facebook. SHFDA s use of these innovative new electronic tools and technologies has allowed it to operate more efficiently and communicate in a more dynamic and timely way. SHFDA promoted homeownership and marketed the Mortgage Revenue Bond program and other homeownership assistance initiatives by undertaking the following activities: recognizing June 2011 as Homeownership Month; recognizing outstanding lenders and brokers at the 2012 Palmetto Affordable Housing Forum, working proactively to recruit additional single family mortgage lenders and get them trained and designated as SHFDA Lending Partners, and meeting regularly with lenders to get input on homebuyer program improvements; maintaining SHFDA community outreach task forces and volunteer councils; and by cultivating and expanding partnerships and working relationships among a variety of community leaders, public agencies, organizations, civic groups, and churches. SHFDA awarded grant funds during the program year for construction or to facilitate construction of new affordable owner-occupied and rental housing units. HOME and SHFDA funds in these projects directly lower the cost of the unit and thereby make rental and homeownership more affordable. SHFDA also provided HOME and other funds for down payment and closing cost assistance and below market interest rate financing to make homeownership more affordable and financing simpler and more available. SHFDA and HOPWA both provided funds for rental assistance. Please see Section II A - Assessment of Annual Goals and Objectives, Section II C - Affordable Housing, and Section II E - Other Actions, Actions to Foster and Maintain Affordable Housing, above. The SC Homebuilders Association sponsored a Rally for Home Ownership in January at the State House. The rally provided a venue for persons interested in housing issues to get involved and show support for the housing industry. A bill to create the South Carolina Community Land Trust Act of 2011 was introduced during the year through combined efforts of the Affordable Housing Coalition, SFHDA and other housing partners. This enabling legislation would allow creation of community land trusts, which would provide a valuable tool for developing affordable housing and workforce housing. The Federal Reserve of Richmond, SHFDA, the City of Columbia, the SC Association of Community Development Corporations and the Affordable Housing Coalition of South Carolina hosted a one-day forum on Community Land Trusts. The forum provided an overview of how shared equity models and Community Land Trusts in particular can preserve long-term affordable homeownership, promote neighborhood stabilization and expand community redevelopment efforts. In addition to actions undertaken by CDBG and SHFDA during the year were actions undertaken by various housing partners in the state and the SC Legislature. Chief among housing partners is the Affordable Housing Coalition of South Carolina (AHC), which continued its advocacy and communication efforts, holding its annual meeting in February 2012 in conjunction with the 2011 State of South Carolina Consolidated Annual Performance & Evaluation Report Section II-E Program Year: April 1, 2011 March 31, 2012 Page 58
65 SECTION II GENERAL PERFORMANCE NARRATIVE E Other Actions Palmetto Affordable Housing Forum, sponsoring a booth and a silent auction at the Forum, and keeping housing partners informed with its periodic newsletter. Actions to Overcome Gaps in Institutional Structure and Enhance Coordination The institutional structure supporting affordable housing and community and economic development in South Carolina is decentralized, consisting of both public and private sector agencies as well as numerous other organizations and institutions that are important development partners. All are vital resources in South Carolina's continuing challenge to address the affordable housing and community and economic development needs of lower income households in the state. Some organizations and institutions have established histories as partners with the State, while many more, like the growing number of non-profit organizations in the state, are new and emerging collaborators. Cross-sector communication and education is the primary strategy for improving coordination, and during the year, actions were focused on technical assistance, outreach and training; collaboration and coordination between the formula grant programs and state and other federal funding sources; and participation in state and regional organizations aimed at housing and community and economic development which provide opportunities for networking, idea sharing and discussion of common goals and strategies. Technical Assistance, Training and Outreach Training represents a key way to reach out to communities and partners, build capacity and increase interaction amongst the diverse group of housing and community development partners in the state, which includes units of local government, regional councils of governments, engineers, consultants, non-profits, CDCs and other organizations. During the year, the four formula grant programs focused on involving a broad range of potential partners in workshops and in providing technical assistance as needed to support capacity. Events included: CDBG application and implementation workshops and webinars CDBG environmental technical assistance workshop ESG pre-awards and post-awards workshops HOME application workshop and Wellness Clinics HOME CHDO technical assistance workshop Housing Trust Fund Wellness Clinics HOPWA site reviews During the program year, SHFDA hosted the 2012 Palmetto Affordable Housing Forum which brought together key state and federal players and was well attended by people representing a broad range of housing partners and affiliates from around the state. HOME technical assistance to CHDOs included workshops and ad hoc meetings, provided Wellness Clinics throughout the year, and participated in workshops, panels, and meetings that support and educate other state and local agencies and nonprofit organizations interested in affordable housing. HOME staff also maintained a presence at venues that target nonprofit organizations and used these venues to provide information regarding available financial resources, encouragement and solutions to 2011 State of South Carolina Consolidated Annual Performance & Evaluation Report Section II-E Program Year: April 1, 2011 March 31, 2012 Page 59
66 SECTION II GENERAL PERFORMANCE NARRATIVE E Other Actions overcoming the unique challenges of developing affordable housing. HOME continued to partner with service providers, realtor and home builders associations and to actively promote and provide training on its interactive affordable housing listing and search website, The highest levels of technical assistance were required during the year for organizations seeking to develop affordable housing, non-profits, Community Housing Development Organizations (CHDOs), Community Development Corporations (CDCs) and Community Development Financial Institutions (CDFIs). Affordable housing and supporting infrastructure projects require significant resources to develop and implement, and CDBG provided extensive technical assistance to help applicants and grantees develop and implement these projects, as well as to grantees. HOME focused technical assistance efforts on CHDOs, which have tremendous need for technical assistance in the areas of planning, management, and financial underwriting and management. CDCs and CDFIs, which are involved in the housing and community and economic development arena, were provided support and education from the SC Association of Community Development Corporations (SCADC). CDBG Technical Assistance Activities and Results CDBG Technical Assistance funds were used during the program year to conduct a variety of project and program assistance and outreach activities. CDBG hosted an Implementation Workshop during the year and also continued to use new technology to expand the reach and impact of CDBG technical assistance efforts by holding an Application Changes webinar. Attendees of the workshop included staff of the Councils of Government from around the state, local city and county governments and administrators involved in housing and community development. Representatives of 14 different organizations participated in the webinar and representatives of 22 organizations attended the Implementation Workshop. CDBG also provides technical assistance informally throughout the year, and during 2011, assisted 93 unique entities during 882 technical assistance actions, either in person or over the phone via teleconference. CDBG emphasizes technical assistance and capacity building for local governments and provided assistance in areas including identification of community needs, planning, citizen participation, economic development preparation, infrastructure development, federal and state requirements and compliance, lead-based paint, and general project development and implementation, scheduling, and budgeting. Collaboration and Coordination The formula grant programs regularly collaborate with other state and federal agencies in the implementation of specific projects, often in terms of coordinating funding. CDBG, HOME, local HOME Consortiums and the State Housing Trust Fund are often coordinated at the project level, particularly with respect to housing rehabilitation or housing development. CDBG and HOME collaborate at the program design level as well, since the two programs share related objectives. New during the 2011 program year, SHFDA announced a new partnership with the US Department of Agriculture Rural Development and HUD, which are key federal partners in housing, to increase communication between agencies, align requirements and help address the administrative and procedural barriers to affordable housing development. Federal agencies that typically provide leveraging funds for CDBG projects include the US Department of Commerce Economic Development Administration (EDA) and the US Department of Agriculture (USDA) Rural Development, and the Appalachian Regional Commission (ARC) State of South Carolina Consolidated Annual Performance & Evaluation Report Section II-E Program Year: April 1, 2011 March 31, 2012 Page 60
67 SECTION II GENERAL PERFORMANCE NARRATIVE E Other Actions As a requirement of the new Emergency Solutions version of the ESG Program, ESG also initiated a substantial new effort to coordinate with the Continuums of Care in the state and collaboratively establish policies and funding priorities for the new program to be implemented next program year. This new level of collaboration will improve homeless service delivery in the state and help achieve maximum impact from scarce resources. Also, since so many CDBG projects integrate funding from other federal and state agencies, major efforts have been made to improve communication and coordination between agencies that fund infrastructure projects. An Infrastructure Funders Committee was formed and meets on a quarterly basis to coordinate project funding and discuss issues of common concern. Representatives of the group include the SC Department of Commerce, State Budget & Control Board, USDA, EDA and the Rural Development Council. The improved communication network among funding providers like CDBG and USDA ultimately increases the efficiency of all projects. In 2009, South Carolina created a permanent Housing Commission consisting of twelve members drawn from the House of Representatives and the Senate and five non-legislative members. Its purpose is to foster the availability of affordable workforce housing and to provide a venue for interaction and communication in the area of affordable housing. Organizational Participation Opportunities for networking, education and strategizing amongst housing, community and economic development partners in the state, including the four formula grant programs and their administering agencies, are numerous. Some of the more notable opportunities include: Affordable Housing Coalition of South Carolina: Meets regularly to evaluate and address ways to improve access to affordable housing for low income citizens of the state. South Carolina Community Development Association: Made up of housing and community development professionals throughout South Carolina who meet regularly to network and discuss housing and community development strategies. South Carolina Economic Developer's Association: Economic development professionals throughout South Carolina who meet regularly to network and discuss economic development strategies. Governor s Rural Summit: An annual event that brings together parties interested and involved in addressing needs and overcoming challenges particular to South Carolina s rural areas. Other opportunities for coordination and communication during the program year included: Public hearing for the Consolidated Annual Action Plan HOME s Palmetto Affordable Housing Forum Housing Trust Fund Advisory Committee meetings South Carolina Homeless Coalition meetings Regional Council of Government (COG) meetings SC Association of CDCs (SCACDC) meeting 2011 State of South Carolina Consolidated Annual Performance & Evaluation Report Section II-E Program Year: April 1, 2011 March 31, 2012 Page 61
68 SECTION II GENERAL PERFORMANCE NARRATIVE E Other Actions SC Association of Regional Councils (SCARC) quarterly meetings SC Coordinating Council for Economic Development quarterly meetings Sessions of the Community Economic Development Certificate Program cosponsored by the SC Association of CDCs, Benedict College and Clemson University Workforce Partners meetings and conferences New Carolina South Carolina s Council on Competitiveness task forces Actions to Improve Public Housing and Resident Initiatives In South Carolina, community and regional Public Housing Authorities (PHAs) own and manage the public housing developments located throughout the state. The PHAs receive funding directly from HUD in the form, generally, of Capital Fund or Replacement Housing Factor funds. Capital Fund formula grants are awarded on an annual basis and may be used for a variety of activities including modernization, development, financing and management. Management activities may include development of resident initiatives and other programs for public housing tenants. Replacement Housing Factor funds are awarded PHAs that have removed units from inventory for the sole purpose of developing new public housing units. The State Housing Finance and Development Authority (SHFDA) does not own, operate or manage any public housing units, and as a result, the State is not directly involved in public housing improvement, or in the development or delivery of programs and services for public housing residents. However, the State does review the PHA s annual plans in developing its Consolidated Plan and Annual Plans, and SHFDA does serve as the Local Housing Authority in the administration and delivery of tenant and project based rental assistance to very low income households under HUD's Section 8 Rental Housing Certificate, Voucher, and Moderate Rehabilitation programs. Section 8 is not an emergency housing or a public housing program, but it does provide rent and utility subsidies to help income-eligible families afford market rents. The Authority serves as the local rental assistance agent in most rural counties and is the Contract Administrator for more than 250 complexes in South Carolina. Contract administration activities include reviewing and approving monthly assistance payments, conducting annual management and occupancy reviews, responding to tenant complaints and providing follow-up for inspections conducted by HUD s Real Estate Assessment Center, processing actions related to subsidy contracts and reporting and tracking processes required under the contract between the SHFDA and HUD. During fiscal year 2011, SHFDA provided Section 8 Housing Choice Voucher Program rental assistance to very low income families in Clarendon, Colleton, Dorchester, Fairfield, Kershaw, Lee, and Lexington Counties. During the same period, SHFDA assisted thousands of additional units with contract administration. Total subsidies provided in 2011 through vouchers and contract administration amounted to $123.3 million and assisted 19,918 families. SHFDA also continued to support, through financing or technical assistance, efforts of local Public Housing Authorities (PHAs) within the State Consolidated Planning Area which are consistent with the objectives of federal programs that encourage homeownership, self-sufficiency, and youth development State of South Carolina Consolidated Annual Performance & Evaluation Report Section II-E Program Year: April 1, 2011 March 31, 2012 Page 62
69 SECTION II GENERAL PERFORMANCE NARRATIVE E Other Actions Actions to Evaluate and Reduce Lead-Based Paint Hazards During program year 2011, South Carolina s actions to evaluate and reduce lead-based paint hazards were consistent with the strategies set forth in the Consolidated Plan and 2011 Action Plan. Notably, these actions included enforcing the lead-based paint hazard requirements of the various programs relating to housing: Lead-Based Paint requirements under CDBG and HOME Investment Partnerships Program Per each program s requirements/guidelines, grant recipients provided written notification to tenants and potential homebuyers of the dangers of lead-based paint poisoning. This was typically done via brochure. All individuals benefiting from rehabilitation or homeownership activities were required to read and sign documentation prior to occupying the unit. Lead-Based Paint requirements under SHFDA s Low Income Housing Tax Credit Program Under the LIHTC Program, property owners were required to complete an Annual Owners Certification and review of compliance with local suitability of occupancy standards. The requirement is that the property must meet local health, safety, and building codes. SHFDA also required disclosure of any recent violation citations to the owner certification review form. Lead-Based Paint requirements under SHFDA s Section 8 Restructuring Program HUD offered to provide lead-based paint testing for subsidized properties constructed prior to 1978, and participating properties were required to request testing by notifying HUD s Real Estate Assessment Center prior to 12/15/2000. Lead-Based Paint requirements under SHFDA s Homeownership and Mortgage Assistance Programs SHFDA required full disclosure of any lead paint hazard to prospective homebuyers by the seller of the home, consistent with the disclosures requirements for all residential real estate transactions, and accrual of any liability to the seller. Lead-Based Paint requirements under SHFDA s Housing Trust Fund Program Where Trust Funds were leveraged with other public housing development funds, the building and unit standards for that program applied. Additionally, all development and occupancy activities of developers/sponsors were required to must comply with applicable local building codes. In addition, the State took the following actions to address lead-based paint hazards in pre-1978 housing: Provision of information, education and outreach activities on lead-based paint hazard reduction through workshops and technical assistance to recipients of CDBG and HOME. Notification to residents and owners of all houses receiving CDBG and HOME assistance of the hazards of lead-based paint. Technical assistance to CDBG and HOME recipients to insure that the prohibition of lead-based paint is included in program policies and procedures as well as all HUD notification requirements State of South Carolina Consolidated Annual Performance & Evaluation Report Section II-E Program Year: April 1, 2011 March 31, 2012 Page 63
70 SECTION II GENERAL PERFORMANCE NARRATIVE E Other Actions Incorporation of lead hazard reduction strategies, in accordance with HUD requirements, in all HUD assisted housing rehabilitation. Encouragement of local governments and non-profit organizations that undertake housing rehabilitation to coordinate with DHEC for testing and referral when lead hazards are addressed in units which house children. Publication of training opportunities, when available, for rehabilitation contractors who work with local governments on CDBG and HOME projects and workers involved in lead based paint abatement. Assistance to those seeking lead based paint training in identifying training providers and materials. Actions to Ensure Compliance with Program and Comprehensive Planning Requirements The Consolidated Plan represents an assessment of needs statewide and forms the plan and strategies for addressing those needs on a prioritized basis, using all four formula grant programs. At the start of each year, a consolidated Annual Action Plan is developed within the context of the larger five year Consolidated Plan, based on the annual Program Statement developed for the CDBG program and the individual Annual Plans for the other three programs. Both the Consolidated Plan and the Annual Action Plan require adequate opportunity for public review and comment. Once finalized and made available to the public and potential applicants for program funds, any significant change during the year would require amendment of the applicable Program Statement and/or Annual Plan, involving additional opportunity for citizen participation. Finally, as part of the performance and reporting process, the State reviews its Consolidated and Annual Action Plans and evaluates consistency with the goals and objectives identified during the planning process. To ensure each application funded is consistent with the Consolidated Plan, each program defines eligible activities that are consistent with the objectives of the plan. Applicants may only apply for eligible activities, and to receive funding in a competitive program, must show that funding particular projects will effectively address the State s priority needs and achieve outcomes consistent with the Consolidated Plan. Under the CDBG program, local governments are also required to undertake a needs assessment and consult with the public about priorities before applying for funds, and potential projects are required to address the community s highest priority needs. Local governments must also comply with the State s comprehensive planning requirements. Actions to Reduce the Number of Persons Living Below the Poverty Level During the year, some of the State s most significant actions to reduce the number of people living in poverty involved economic development and workforce skills development and training, particularly in the state s least economically competitive counties where poverty levels and unemployment are high. Among the Consolidated Plan partner agencies, economic and workforce development actions are undertaken by CDBG, and these are described in detail Section II A Assessment of Annual Goals and Objectives and Section III CDBG Program Narrative. CDBG, however, is administered by the SC Department of Commerce, and CDBG 2011 State of South Carolina Consolidated Annual Performance & Evaluation Report Section II-E Program Year: April 1, 2011 March 31, 2012 Page 64
71 SECTION II GENERAL PERFORMANCE NARRATIVE E Other Actions resources are managed in conjunction with other state economic development resources, which are discussed below. Other resources for Workforce Development are housed in the Department of Education and Workforce. Other actions involve activities of local Community Development Corporations and Community Action Agencies, activities of the SC Commission on Minority Affairs, whose mission is to address the root causes of socioeconomic poverty and deprivation impacting the state s minority population, activities of the Governor s Office of Small and Minority Business Affairs, Family Independence Act initiatives (TANF) of the SC Department of Social Services, and publicprivate initiatives focused on asset protection and wealth-building, including legislative and outreach actions aimed at curbing predatory lending. Actions aimed at curtailing predatory lending were discussed in Section II B Affirmatively Furthering Fair Housing. Activities of public agencies can be found in their respective Annual Accountability Reports filed with SC State Legislature. Economic Development Actions The State s primary strategy for addressing poverty is the creation of expanded economic opportunity through the creation and retention of new and better paying jobs, particularly in areas of the state where unemployment and poverty levels are high. Counties are designated by tiers by the SC Department of Revenue according to their development status, with Tier 1 being most developed and Tier 4 being least developed and/or economically distressed. County development tier designations for calendar year 2011 are indicated on the map on page 2. During calendar year 2011, the SC Department of Commerce (Commerce) announced 20,013 new jobs, the second highest level of new job announcements since 2003, and $5.1 billion in new capital investment, the highest level since This was due in large part to the state s success in attracting new employers and encouraging existing employers to expand or locate additional facilities in the state. Also notable is the fact that 21% of new job creation and 32% of new capital investment was announced in the state s most rural and least developed counties, defined as those in the two lowest development tiers. The Enterprise Zone Job Development Credit (JDC) Program was implemented in 1996 to reward companies for creating new jobs and new tax base, especially in the less-developed parts of the state. This incentive provides the greatest value in the state s least developed counties where per capita income is lowest and unemployment highest. Approved companies can receive refunds equal to 2% to 5% of gross wages for new employees, depending on wage rates, but a company can only receive 100% of the refund if it creates jobs in a county designated as Distressed. Progressively, the company s share of the refund decreases from 100% to 55% as county designation moves toward Developed. The balance not refunded to the company goes directly into the state Rural Infrastructure Fund (RIF), where it can be used for grants to rural, less developed counties for projects ranging from economic readiness product development to workforce and tourism and assisting businesses that will create jobs. In terms of direct job creation, a total of 67 projects were approved for the Enterprise JDC Program in These companies will create 12,516 new jobs with health care benefits, including 3,853 in the state s least developed Tier 3 and 4 counties. Typically these new jobs also pay above the average per capita income in less developed tiers, and many employers will also offer training for new employees and for existing employees once they have established 2011 State of South Carolina Consolidated Annual Performance & Evaluation Report Section II-E Program Year: April 1, 2011 March 31, 2012 Page 65
72 SECTION II GENERAL PERFORMANCE NARRATIVE E Other Actions themselves with the company. Companies approved for Enterprise Zone benefits in 2011 will also invest $4.3 billion, including $682 million in Tier 3 and 4 counties and significantly increase the tax base on which the local economies depend. Commerce also used federal CDBG and state RIF and Coordinating Council for Economic Development funds to help create new jobs in the state s most economically challenged areas. CDBG activities relate specifically to the state Consolidated Plan goal of making economic opportunity available through the creation of new jobs, and CDBG accomplishments are discussed in greater detail in Section II A Assessment of Annual Goals and Objectives and Section III CDBG Program Narrative. State RIF and Coordinating Council resources were provided to assist local governments with 65 projects in 2011, including 41 in Tier 3 and 4 counties that will generate $458 million in new investment and 1,899 new jobs State of South Carolina Consolidated Annual Performance & Evaluation Report Section II-E Program Year: April 1, 2011 March 31, 2012 Page 66
73 F. Leveraging Resources Other Public and Private Resources for Addressing Needs Identified in the Consolidated Plan Funding for housing and community development programs in the state continues to be provided by both state and federal sources. State resources have increased in recent years, particularly in the area of economic development. State resources for affordable housing are also considerable but vary depending upon the specific source of revenue identified and/or the mechanics of the program. Additional and often more significant resources include federal programs that are allocated to the state. Less reliable federal resources are available on a competitive or demonstration basis. All of these resources are discussed below. State and Federal Affordable Housing Resources State resources for addressing affordable housing objectives of the Consolidated Plan are managed by the State Housing Finance and Development Authority (SHFDA), with the exception of the CDBG program. SHFDA also administers federal resources allocated to the state, which include HOME, the Low Income Housing Tax Credit (LIHTC), the Section 8 Rental Assistance programs and US Treasury Department Hardest Hit funding which was used to create the new South Carolina Homeownership and Employment Lending Program (SC HELP). An additional $5 million in third round Neighborhood Stabilization Program (NSP3) funding was also committed during the Program Year. The state Mortgage Revenue Bond and Multifamily Tax Exempt Bond Programs both derive funding from the sale of tax exempt bonds to investors, and funding levels fluctuate according to economic conditions and investor demand. The South Carolina Housing Trust Fund receives a dedicated share of the state deed stamp tax, and funding for this resource is dependent on the volume of real estate transactions in the state. Funds invested during fiscal year 2011, by SHFDA programs other than HOME, are shown below. Fiscal Year 2011 Affordable Housing Investments Non-HOME SHFDA Programs Program Amount in Millions Mortgage Revenue Bond Program $110.0 South Carolina Housing Trust Fund $7.3 Low Income Housing Tax Credit Program $10.8 Multifamily Tax Exempt Bond Program $21.0 Section 8 Housing Choice Voucher Program & Contract Administration $123.3 SC HELP Program foreclosure assistance $4.0 NSP3 $5.0 Total $281.4 The above SHFDA programs for developing housing in South Carolina are implemented by hundreds of private, non-profit and public sector housing partners. This layering of private investment capital and public funds is an important element in expanding the base of affordable housing and addressing the needs of the State s Consolidated Plan. It is also a significant source of additional leveraging State of South Carolina Consolidated Annual Performance & Evaluation Report Section II-F Program Year: April 1, 2011 March 31, 2012 Page 67
74 SECTION II GENERAL PERFORMANCE NARRATIVE F - Leveraging State Economic Development Resources State resources to assist with economic development objectives, particularly job creation, have increased substantially in recent years. Most significantly, the Rural Infrastructure Fund usually receives annual funding of $12 million. In addition, the annual appropriation to the Coordinating Council for Economic Development now totals $20 million. Further, these funds are now complemented by a host of new incentives for job creation, targeted industries, film production companies, etc. Other resources include: annual appropriations for the ReadySC Program of state technical college system, which partners closely with the SC Department of Commerce on job creation objectives by providing highly valuable pre-employment training assistance to businesses creating jobs in the state, state funding for the Registered Apprenticeships, QuickJobs and the Lottery Tuition Assistance Programs, and economic development funding for small business and community development from the Business Development Corporation of SC, the SC Capital Access Program, the SC Jobs Economic Development Authority or JEDA, the SC Venture Capital Authority and InvestSC operated by JEDA. The net result of new state funding for economic development has been to allow CDBG to adjust its economic development strategy to focus more on economic sustainability objectives, as discussed in Section II A Assessment of Annual Goals and Objectives and Section III CDBG Program Narrative. Other State Resources Various other state programs continue to be utilized to help carry out the goals of the Consolidated Plan. These include: programs for special needs housing under the Department of Mental Health (DMH); funding and programs applicable to both community and economic development through the State Budget and Control Board Division of Local Government (BCB), the state Rural Infrastructure Fund, and the SC Department of Parks, Recreation and Tourism (PRT); transportation programs through the SC Department of Transportation (DOT); and community development programs and resources from various state agencies including the SC Departments of Health and Environmental Control (DHEC), Health and Human Services (DHHS), and Archives and History (DAH). Programs, administering agencies and types of assistance are provided below in Exhibit II-2. Exhibit II-2 State Programs and Types of Assistance Type of Assistance Program Community Economic Housing Development Development Business Development Corporation of SC (BDC) / Community Development Corporation of SC X BDC / SC Capital Access Program X DAH / State Historic Preservation Grant X BCB / State Water Pollution Control Revolving Fund X DMH / Housing and Homeless Programs X DOC / CDC Fund X X X DOC / Coordinating Council for Economic Development X DOC / Rural Infrastructure Fund X X DOC / Other Grant Funds X DOT / C Funds Transportation X 2011 State of South Carolina Consolidated Annual Performance & Evaluation Report Section II-F Program Year: April 1, 2011 March 31, 2012 Page 68
75 SECTION II GENERAL PERFORMANCE NARRATIVE F - Leveraging Exhibit II-2 State Programs and Types of Assistance DOT / Transportation Assistance HHS / Senior Center Permanent Improvement Program X JEDA / Industrial Revenue Bond X JEDA / InvestSC / SC Venture Capital Authority X PRT Film Commission / Wage and Supplier Film Rebates X PRT / Park and Recreation Development Fund X PRT / Recreation Land Trust X PRT/ Tourism Fund X SHFDA / Housing Trust Fund X SHFDA / Mortgage Revenue Bond Programs (Homeownership) X SHFDA / Multi-Family Tax Exempt Bond (Multi-family) X State Budget and Control Board / Local Government X X State Tech / ReadySC (previously CATT) X State Tech / Registered Apprenticeships X State Tech / Pathways to Prosperity X X Federal Resources Excluding federal resources for economic recovery discussed above, major federal programs are allocated to states based on formulas. These include HOME, CDBG, Rural Development programs of the US Department of Agriculture, the Low Income Housing Tax Credit (LIHTC) and the Section 8 Rental Assistance programs operated by SHFDA, and Weatherization Assistance. A number of other federal resources are available only on a demonstration basis and/or through a competitive process on a national or regional level. These sources of funds are more difficult to obtain and less secure as a long term funding source; however, South Carolina continues to actively pursue and seek these funding opportunities on a project-by-project basis. These resources are described on the following pages in Exhibit II-3. Exhibit II-3 Federal, Non-Recovery Programs for Housing and Community Development Program Appalachian Regional Commission (ARC) DOE, Weatherization Assistance Program (WAP) DOI, Land and Water Conservation Fund (LWCF) DOL, Workforce Investment Act Program Description The ARC helps fund such projects as education and workforce training programs, highway construction, water and sewer system construction, leadership development programs, small business start-ups and expansions, and development of healthcare resources. WAP provides grants to states, which in turn sub-grant to local agencies, to install energy conservation measures in the households of low-income persons, especially the elderly, those with disabilities and families with children. The LWCF provides funds to local governments for the purchase of threatened lands to conserve them as parks, refuges, or other public lands. The WIA provides job-training services for economically disadvantaged youth and adults, dislocated workers and others who face significant employment barriers Housing Type of Assistance Community Economic Development Development X X X X X Transportation 2011 State of South Carolina Consolidated Annual Performance & Evaluation Report Section II-F Program Year: April 1, 2011 March 31, 2012 Page 69
76 SECTION II GENERAL PERFORMANCE NARRATIVE F - Leveraging Exhibit II-3 Federal, Non-Recovery Programs for Housing and Community Development Program DOT, Capital Program (Section 5309) DOT, Elderly and Persons with Disabilities Program (Section 5310) DOT, Non-Urbanized Area Formula Program (Section 5311) DOT, Transportation Equity Act for the 21st Century (TEA- 21) Funds DOT, Urbanized Area Formula Program (Section 5307) EDA, Public Works and Economic Development Program EDA, Short-term Planning Grants to States, Sub-State Planning Regions and Urban Areas EDA, Technical Assistance Program HHS, Community Services Block Grant (CSBG) HHS, Low Income Home Energy Assistance (LIHEAP) HUD, Brownfields Economic Development Initiative (BEDI) HUD, Community Development Block Grant (CDBG) Program Description The Section 5309 program provides funding for the establishment of new rail or bus-way projects, the improvement and maintenance of existing rail and other guide-way systems, and the upgrading of bus systems. Section 5310 makes funds available to states to meet the special transportation needs of elderly persons and persons with disabilities. The Section 5311 program provides funding for public transportation in rural and small urban areas, including capital and administrative expenses. Flexible funding that local governments may use either for transit improvements or highway purposes based on local planning priorities Section 5307 is a formula grant program for urbanized areas providing capital, operating, and planning assistance for mass transportation. The public works program helps distressed communities in economic decline to revitalize, expand, and upgrade their physical infrastructure to attract new industry, encourage business expansion, diversify local economies, and generate or retain long-term, private sector jobs and investment. Planning grants provide support for economic development planning, policymaking and implementation efforts, and to establish comprehensive economic development planning processes cooperatively with the state, political subdivisions, and economic development districts. The technical assistance program helps fill the knowledge and information gaps that may prevent leaders in the public and nonprofit sectors in distressed areas from making optimal decisions on local economic development issues, such as funding feasibility studies. The CSBG program provides states and staterecognized Indian Tribes with funds to provide a range of services to address the needs of low-income individuals to ameliorate the causes and conditions of poverty. LIHEAP provides federal funds to help eligible lowincome households meet their home heating and/or cooling needs. BEDI provides funds and loan guarantees to clean up and redevelop environmentally contaminated industrial and commercial sites, commonly known as "brownfields." CDBG provides grants that can use to revitalize neighborhoods, expand affordable housing and economic opportunities, and/or improve community facilities and services, principally to benefit low- and moderate-income persons. Housing X X X Type of Assistance Community Economic Development Development X X X X X X X X X Transportation X X X X X 2011 State of South Carolina Consolidated Annual Performance & Evaluation Report Section II-F Program Year: April 1, 2011 March 31, 2012 Page 70
77 SECTION II GENERAL PERFORMANCE NARRATIVE F - Leveraging Exhibit II-3 Federal, Non-Recovery Programs for Housing and Community Development Program HUD, Economic Development Initiative (EDI) HUD, Emergency Shelter Grants Programs (ESG) HUD, Empowerment Zones and Enterprise Communities Initiative (EZ/EC) HUD, Historically Black Colleges and Universities (HBCU) HUD, HOME Investment Partnership (HOME) HUD, HOPE HUD, Housing Opportunities for People with AIDS (HOPWA) HUD, Lead-Based Paint Hazard Control Grant Program HUD, Neighborhood Stabilization Program HUD, Section 108 Loan Guarantee Program Description EDI provides grants to local governments that they can use to enhance both the security of loans guaranteed through the Economic Development Loan Fund and the feasibility of the large economic development and revitalization projects they finance. ESG awards grants for the rehabilitation or conversion of buildings into homeless shelters. It also funds certain related services, operating expenses, homeless prevention activities, and administrative costs. The EZ/EC Initiative targets tax incentives, performance grants, and loans to designated low-income areas, called Empowerment Zones or Enterprise Communities, to create jobs, expand business opportunities, and support people looking for work. HBCU awards grants to historically black colleges and universities to address community development needs in their localities, including neighborhood revitalization, housing, and economic development HOME provides formula grants to states and localities that communities use often in partnership with local nonprofit groups to fund a wide range of activities that build, buy, and/or rehabilitate affordable housing for rent or homeownership or provide direct rental assistance to low-income people. HOPE helps revitalize distressed public housing developments by providing grants and flexibility to address the housing and social service needs of their residents, including physical improvements, management improvements, and social and community services. The HOPWA program provides housing assistance and related supportive services for low-income persons with HIV/AIDS and their families. The Lead-Based Paint Program funds a broad range of activities to reduce dangers from lead-contaminated dust, soil, and paint in private homes and apartments built before 1978 that are owned or rented by low-income families. Funds authorized under the Housing and Economic Recovery Act (HERA) of 2008, and again by the American Recovery and Reinvestment Act of 2009, and currently in its third round of funding. Administered by SHFDA, NSP funds can be used to purchase, rehabilitate, redevelop or demolish foreclosed homes in areas of greatest need in the state, as defined for each funding round. Section 108 enables states and local governments participating in the Community Development Block Grant (CDBG) program to obtain federally guaranteed loans that can help fuel large economic development projects and other revitalization activities. Housing X X Type of Assistance Community Economic Development Development X X X X X X X X X X X X X X X X Transportation 2011 State of South Carolina Consolidated Annual Performance & Evaluation Report Section II-F Program Year: April 1, 2011 March 31, 2012 Page 71
78 SECTION II GENERAL PERFORMANCE NARRATIVE F - Leveraging Exhibit II-3 Federal, Non-Recovery Programs for Housing and Community Development Program HUD, Section 202 Supportive Housing for the Elderly HUD, Section 8 Moderate Rehabilitation Single Room Occupancy Program for Homeless Individuals (SRO Program) HUD, Section 8 Rental Certificate Program HUD, Section 811 Supportive Housing for Persons with Disabilities HUD, Self-Help Homeownership Opportunity Program (SHOP) HUD Shelter Plus Care (S+P) HUD, Supportive Housing Program (SHP) HUD, Youthbuild IRS, Low Income Housing Tax Credit (LIHTC) NRCS, Conservation Programs RBS, Business Programs Program Description Section 202 provides capital advances to finance the construction and rehabilitation of structures that will serve as supportive housing for very low-income elderly persons and provides rent subsidies for the projects to help make them affordable. The SRO Program provides Section 8 rental assistance for moderate rehabilitation of buildings with single-room dwellings designed for the use of an individual, that often do not contain food preparation or sanitary facilities that will be rented by homeless people. The Section 8 Rental Certificate program increases affordable housing choices for very low-income households by allowing families to choose privately owned rental housing. Families apply to a local public housing authority (PHA) or administering governmental agency for a Section 8 certificate. The PHA pays the landlord the difference between 30 percent of the household's adjusted income and the unit's rent. The Section 811 program provides grants to nonprofit organizations to develop and construct or rehabilitate rental housing with supportive services for very lowincome persons with disabilities. SHOP provides funds for nonprofit organizations to purchase home sites and improve the infrastructure needed to set the stage for sweat equity and volunteerbased homeownership programs for low-income families. Shelter Plus Care provides rental assistance that, when combined with social services, provides supportive housing for homeless people with disabilities and their families. SHP provides grants to develop supportive housing and services that will enable homeless people to live as independently as possible. Youthbuild provides grants on a competitive basis to non-profit organizations to assist high-risk youth between the ages of 16 and 24 to learn housing construction job skills and to complete their high school education. The LIHTC program is a tool form private developers and nonprofit entities to construct or rehabilitate affordable rental units. Federal tax credits may be used to obtain a dollar-for-dollar reduction in income tax liability for 10 years or to obtain equity for a project through syndication. A variety of financial assistance programs is available for the conservation, improvement and sustainability of natural resources and the environment. Loans and grants are made to help build competitive businesses and cooperatives that can prosper in the global marketplace. To meet business credit needs in under-served areas, RBS Business Programs are usually leveraged with the resources of commercial, cooperative, or other private-sector lenders. Housing X X X X X X Type of Assistance Community Economic Development Development X X X X X X X Transportation 2011 State of South Carolina Consolidated Annual Performance & Evaluation Report Section II-F Program Year: April 1, 2011 March 31, 2012 Page 72
79 SECTION II GENERAL PERFORMANCE NARRATIVE F - Leveraging Exhibit II-3 Federal, Non-Recovery Programs for Housing and Community Development Program RHS, Community Facility Loans RHS, Farm Labor Housing RHS, Home Improvement Loans and Grants RHS, Home Ownership Loans RHS, Housing Preservation Grants RHS, Housing Subsidies RHS, Rural Rental Housing Loans RHS, Self Help Housing Loans RHS, Site Loans RUS, Water and Waste Disposal Programs SBA, Business Loans and Guarantees WIA, Workforce Investment Act Program Description Guaranteed loans are made to construct, enlarge, or improve community facilities for healthcare, public safety, and public services, including the costs to acquire land needed for a facility, pay necessary professional fees, and purchase equipment required for its operation. Loans and grants enable farmers, public or private nonprofit organizations, and units of state and local governments to build, buy, or repair farm labor housing in either dormitory or multifamily apartment style. Loans and grants enable low-income rural homeowners to remove health and safety hazards from their homes and to make homes accessible for people with disabilities. Financing is provided with no down payment and at favorable rates and terms through direct loans with RHS or with loans from a private financial institution that is guaranteed by RHS for the purchase, construction, rehabilitation, or relocation of dwellings and related facilities for low- or moderate-income rural persons. Grants help low-income homeowners repair and rehabilitate their homes. Rental property owners can use them to repair and rehabilitate their units if they agree to make such units available to low-income families. Funds are available to help subsidize monthly mortgage and rental payments, limiting these costs to no more than 30% of the adjusted monthly income of the applicant. These subsidies can be used with the home ownership, rural rental and farm labor programs. Rural Rental Housing loans are made to finance building construction and site development of multifamily living quarters for people with low, very low and moderate incomes. Self-Help Housing Loans help groups of six to ten lowincome families build their own homes by providing materials and the skilled labor they cannot furnish themselves. The families must agree to work together until all homes are finished. Site loans are used to buy adequate building sites for development of a desirable community by private or public nonprofit organizations. Direct and guaranteed loans are made to develop water and wastewater systems, including solid waste disposal and storm drainage, in rural areas and to cities and towns with a population of 10,000 or less. Financial, technical and management assistance is provided to help people start, run, and grow small businesses. SBA also assists in the government's disaster relief efforts by making low-interest recovery loans to both homeowners and businesses. Financial assistance to businesses for incumbent worker training, customized training, wages during on-the-job training, WorkKeys job profiling; Rapid Response assistance for employees faced with downsizing; and financial assistance to individual training Housing X X X X X X X X X Type of Assistance Community Economic Development Development X X X X X Transportation 2011 State of South Carolina Consolidated Annual Performance & Evaluation Report Section II-F Program Year: April 1, 2011 March 31, 2012 Page 73
80 SECTION II GENERAL PERFORMANCE NARRATIVE F - Leveraging Use of HUD Resources to Leverage Other Public and Private Resources During 2011, each of the four HUD programs used their federal CDBG, HOME, ESG or HOPWA funds to leverage additional investment from state, local, other federal, private, and non-profit sources. CDBG In 2011, new CDBG grant awards for Community Development, Economic Development and Planning projects totaled $24,497,639. CDBG funds in these projects leveraged an additional investment of $8.9 million. Leveraged funds came from a variety of sources, including required local matching funds, additional local county and city funds, funds from local utilities and waivers of local fees, funds from other federal sources including the Economic Development Administration, Department of Transportation and the Environmental Protection Agency, private funds, and state funds from the State Budget and Control Board Division of Local Government, the Department of Health and Environmental Control and the state technical college system. CDBG encourages applicants to secure additional sources of funding and weighs the resulting return on CDBG investment, along with a host of other factors identified in the annual Program Statement, in determining which applications are selected for award. As a result, funding from grant partners exceeds the required local match, which for 2011 was 10% of the grant request for most categories under the Community Development Program. Even with local budget constraints and continuing weak economic conditions, CDBG funds still leveraged funding equal to 36.5% of grants awarded and three and a half times the 10% requirement. This investment of additional funds demonstrates significant local commitment to projects funded during the year and helps ensure proposed outcomes will be achieved. HOME During the year, HOME funds were used to leverage other state and federal funds in all but a few cases. Other state and federal resources in HOME projects included other SHFDA funds, including Low Income Housing Tax Credits, Housing Trust funds, and Mortgage Revenue Bonds, funds from the SC Department of Mental Health which are earmarked for special needs housing, federal Rural Housing Services funds from the US Department of Agriculture, and funding provided by the Federal Home Loan Bank of Atlanta. Matching funds were provided by the Housing Action Partnerships Program. HOPWA HOPWA funds awarded $1,781,253 during Program Year Funds awarded for supportive services were the source of substantial leveraging. All DHEC HOPWA service providers, or sponsors, are also Ryan White service providers or collaborate closely with Ryan White service providers. Ryan White CARE Act resources leveraged are estimated at $2.7 million for case management across the state, including housing service planning. HOPWA was also used to leverage the resources of non-profit organizations that received HOPWA funding during the year. ESG ESG requires their subrecipients to match ESG funds on a dollar-for-dollar basis with other federal, state, local or private funding. ESG funding during the year totaled $1.47 million and 2011 State of South Carolina Consolidated Annual Performance & Evaluation Report Section II-F Program Year: April 1, 2011 March 31, 2012 Page 74
81 SECTION II GENERAL PERFORMANCE NARRATIVE F - Leveraging this was matched by other funds. In addition to this required match, agencies receiving ESG funds also reported additional leveraged funds. Combined required and additional leveraged funds totaled $9.17 million, as follows: $3.74 million in other federal sources including HUD, the Victims of Crime Act, the Family Violence Prevention Fund, and Community Services Block Grants, Low- Income Home Energy Assistance Program, Federal Emergency Management Agency and local city and county Community Development Block Grant programs. $1.78 million in state or local funding. $3.65 million in private funding from sources like the United Way, shelter-specific fund raising campaigns, fees, and the value of volunteer hours. Satisfaction of Matching Requirements HUD requires the State to provide matching funds for the CDBG, HOME, and ESG program allocations. The HOPWA program does not require a match from the State for their allocation. The CDBG program requires a 50% match for all administrative costs in excess of $100,000 on a dollar-for-dollar basis, and this is provided for in the budget of the administering agency, the SC Department of Commerce. In 2010, all administrative expenses in excess of $100,000 were split 50/50 between federal CDBG funds and matching state funds. The HOME program requires a 25% match. HOME program matching funds are provided by Housing Action Partnership Program funds managed by the SHFDA through the State Housing Trust Fund. For more information, please see Section IV - HOME Program Narrative, HOME Match Report. The ESG program requires a dollar-for-dollar match in non-esg funds for their allocation. To meet this requirement, the State requires that applicants to the State program provide a dollarfor-dollar match if they are awarded a grant. Match can be either in the form of a cash contribution or in other donated or in-kind resources such as the value of buildings, equipment and volunteer services. The State is allowed to waive the match requirement for up to the first $100,000 of its allocation for applicants who are least capable of leveraging local resources to meet the match. The State has established procedures to demonstrate that this provision has been met for those who wish to request a waiver. Since only a limited portion of the State s allocation is exempted from the matching requirement, and eligibility for the waiver must be sufficiently established by the applicant, only a few waivers are generally granted per funding cycle. For more information, please see Section VI - Emergency Shelter Grants Program, Matching Resources State of South Carolina Consolidated Annual Performance & Evaluation Report Section II-F Program Year: April 1, 2011 March 31, 2012 Page 75
82 G. Citizen Comments Received in Preparing the Performance Report In accordance with the State s Citizen Participation Plan, which can be found in the Consolidated Plan, the State provided the opportunity for citizen input into the Consolidated Annual Performance and Evaluation Report. An advertisement of the availability of a draft version of the report was published on June 10, 2012 in the state s three major newspapers, The Post and Courier, Charleston, SC; The Greenville News, Greenville, SC; The State, Columbia, SC. The advertisement stipulated the 15- day period during which the draft report was available for review. No comments were received State of South Carolina Consolidated Annual Performance & Evaluation Report Section II-G Program Year: April 1, 2011 March 31, 2012 Page 76
83 H. Self-Evaluation Evaluation of Accomplishments As a whole, South Carolina was successful during the program year in responding to priority needs in the state. This is reflected in the accomplishments for objectives and goals identified on Table 3A and discussed throughout this report. Proposed and actual accomplishments are discussed in Section II A - Assessment of Annual Goals and Objectives, as well as in the individual program sections: Section III CDBG Program Narrative, Section IV HOME Program Narrative, Section V HOPWA Program Narrative, and Section VI ESG Program Narrative. In the State s Consolidated Plan, goals were established for each of three priority need areas, decent housing, economic opportunity and suitable living environment. Accomplishments resulting from projects funded in 2011 will address each priority need and are summarized below. Decent Housing 452 low and moderate income households will be able to afford to purchase or rent decent housing, as a result of down payment, closing cost or rental assistance provided by HOME 148 new affordable owner and renter housing units will be developed using HOME funds 104 units of special needs supportive and transitional housing will be maintained or developed as a result of HOME and HOPWA funding. 559 existing affordable housing units will be made more sustainable by connecting them to public water and/or sewer or making exterior improvements/repairs using CDBG funds 142 people living with HIV/AIDS received tenant based rental assistance from service providers receiving HOPWA funding, and an additional 319 individuals in crisis received HOPWA-funded short-term emergency rent, mortgage and utility assistance 648 people avoided homelessness as a result of ESG funded prevention activities, which represents about twice as many households as last program year Economic Opportunity 15 residents, including at least 51% who are low and moderate income, will benefit from the availability of new jobs ESG and HOPWA funding supported 29 providers of programs and services that will improve accessibility to jobs and employment for LMI individuals 11,047 residents in two communities will benefit from improved resources for skills training and education as a result of workforce development projects involving upgraded or expanded libraries State of South Carolina Consolidated Annual Performance & Evaluation Report Section II-H Program Year: April 1, 2011 March 31, 2012 Page 77
84 SECTION II GENERAL PERFORMANCE NARRATIVE H Self-Evaluation Downtown revitalization, expansion of an existing industry and elimination of abandoned, blighted structures in four communities will result in more sustainable economic opportunity for a total of 12,259 residents. Suitable Living Environment 39 rural communities will benefit from new or upgraded public infrastructure, community facilities or services, making a suitable safe and healthy living environment available or sustainable as a result of CDBG funding 44 communities throughout the state will benefit from regional planning activities and 16 communities will benefit from development or implementation of plans for comprehensive neighborhood revitalization. 5,453 residents will benefit, including 3,771 who are LMI 24,403 homeless persons received emergency shelter as a result of ESG funding during the year All 31 emergency shelter, Continuums of Care which fund shelters and homeless service providers supported by ESG will provide essential supportive services for homeless persons and persons at risk of being homeless 1,040 people living with HIV/AIDS received supportive case management, employment and other services from care providers that received HOPWA funding during the year Most annual objectives were met and progress was made in all areas. During the year, the State was also successful in coordinating the various resources available for housing and community development, including remaining federal HUD programs and resources aimed at economic recovery, and targeting HUD funds to achieve the greatest impact. HOME funds continued to be used primarily for the development of new affordable housing for owners and renters and rental and homeownership assistance, while CDBG remained the primary HUD resource for addressing economic development and for the suitable living environment priority needs of infrastructure and community facilities. HOME funds continued to be managed in conjunction with substantial state and other federal resources managed by the SC Housing Finance and Development Authority, which in 2011 totaled over $284 million. Likewise, CDBG funds continued to be coordinated with other state resources for economic development managed by the SC Department of Commerce, including the Economic Development Setaside Fund and the Rural Infrastructure Fund, which together received $32 million in 2011 to assist with job creation and other economic development. ESG continued to fund shelter and supportive services for homeless individuals and homeless prevention for individuals and families at risk of homelessness, and HOPWA continued to fund assistance to people living with HIV/AIDS who require supportive housing and services State of South Carolina Consolidated Annual Performance & Evaluation Report Section II-H Program Year: April 1, 2011 March 31, 2012 Page 78
85 SECTION II GENERAL PERFORMANCE NARRATIVE H Self-Evaluation Impact on Identified Needs Housing Housing Needs The highest priority housing need in South Carolina is the availability of decent, safe and affordable housing, particularly housing that is close to transportation and/or offers easy access to community services and employment centers, rental housing, and transitional and permanent supportive housing for households emerging from homelessness or with special needs, such as the elderly, disabled and those living with HIV/AIDS. Preservation and sustainability of existing, affordable owner and renter housing is also important, and repairs, rehabilitation and energy efficiency improvements are needed to address this need. Improvements to existing housing can also address the need for housing that is physically more accessible for the elderly and disabled. Transitional and permanent supportive housing for people with special needs, including the elderly, disabled, those living with HIV/Aids and individuals and families emerging from homelessness, remains a priority need, and making this housing affordable is critical given the typically very low incomes of the elderly, disabled, previously homeless and other special needs sub-populations. Availability is also an issue, since development of new supportive and transitional housing is constrained by limited targeted funding and the limited number of low income housing developers with experience and capacity. Other priority needs relate to the homeless, both sheltered and unsheltered, and those at risk of becoming homeless. Emergency shelter was identified in the Consolidated Plan as a priority need and continues to be important, although results this year combined with the 2011 Homeless Count indicate a continuing gradual decline in needs related to sheltered homeless. During the next program year, however, efforts will be made to reach out to non-sheltered homeless and provide this difficult to serve population with services and to attempt to address this segment of the homeless population. This is a requirement under the new Solutions version of the ESG Program and reflects growing national priority on serving unsheltered homeless. Other priority needs related to homelessness include essential, supportive services for those who are homeless or transitioning out of homelessness and into independent living remains a priority, preventing homelessness for those at risk, and quickly re-housing those who have become homeless. The latter are particular priorities as the economic downturn continues and high unemployment, lost and lower wages, and high foreclosure rates persist. Homeless prevention and re-housing were at the heart of the Homeless Prevention and Rapid Re-housing (HPRP) federal stimulus program, and the new Emergency Solutions Grant program, which becomes effective next program year, will incorporate changes allowing it to better respond to these needs. Impact on Housing Needs Ongoing and consistent efforts by HOME, CDBG, the State Housing Finance and Development Authority (SHFDA) and other housing partners in the state have resulted over the years in thousands of new and rehabilitated owner and rental units, and thousands of households provided with homebuyer and rental assistance. Specifically, during the prior five-year Consolidated Plan period, HOME and CDBG funding alone resulted in the development of 1,595 new affordable housing units and preservation of 3,110 existing affordable housing units, and program year 2011 HOME funding will result in an additional 148 units. Plus, other housing partners have also been working to increase the supply of affordable housing, including the state s various Community Development Corporations, faith-based housing providers, non-profits, the State 2011 State of South Carolina Consolidated Annual Performance & Evaluation Report Section II-H Program Year: April 1, 2011 March 31, 2012 Page 79
86 SECTION II GENERAL PERFORMANCE NARRATIVE H Self-Evaluation Housing Trust Fund through SHFDA, regional Continuums of Care, and regional Housing Trust Funds in the Lowcountry and Upstate. The Midlands became the third region to form a Housing Trust Fund and convened its first meetings during the 2011 program year. Overall, these state efforts have helped address the need for safe, affordable and decent housing and have made a difference in the lives of many of the state s low and moderate income households. However, the population of the state continues to grow, wages continue to lag behind the nation as a whole, economic conditions continue in decline, resulting in more people without jobs and with fewer resources, and demand continues to outpace supply. Housing that is available continues to cost more than many can afford, putting homeownership and even rental out of reach for many, and the continuing economic downturn and high levels of foreclosure have placed increased pressure on rental housing. Evidence of this can be seen in HOME accomplishments for the year, where competitive projects submitted for HOME funding were heavily weighted in favor of new rental housing. At the same time, foreclosure continues to be a factor in the state, particularly along the coast. Substantial new resources have been targeted at this issue, including US Treasury Department Hardest Hit housing market funds, and SHFDA has used these funds to establish the SC HELP foreclosure assistance program, launch a pilot version, and expand the program statewide and to a broader group of eligible distressed homeowners. Initial response to the pilot was strong, with 300 homeowners receiving assistance and over 6,000 households in the process of requesting assistance as of June 30, 2011, and substantial accomplishments are anticipated for the coming year. This program, and other SHFDA affordable housing efforts, are discussed in detail in Section E Other Actions, Actions to Foster and Maintain Affordable Housing. HUD continues to sponsor training for foreclosure avoidance counseling, and national and regional entities like Neighborworks and Family Services, Inc. continue to work to help those at risk to stay in their homes. In spite of these efforts, foreclosure continues to figure largely into state housing market conditions. As of April 2012, RealtyTrac reports the rate of foreclosure in South Carolina as 1 in every 720 housing units, which is below the national average of 1 in every 698 units, down from the 1 in every 668 units reported by RealtyTrac in 2011, but still the third highest in the Southeast after Florida and Georgia. Within South Carolina, the chart below shows rates as of April Notably, the top five counties were also amongst the counties with the highest foreclosure rates in April Counties where the foreclosure rate has gotten worse include: York which jumped from eighth highest to the top slot, Horry which moved up from sixth to third, and Berkeley which moved from seventh to fourth. Other counties saw a decrease in their foreclosure rate, including Dorchester, Fairfield and Beaufort. Three counties were in the top 10 last year but had huge declines in the past year, including Charleston (from 4 to 14), Richland (from 5 to 18) and Lexington (from 9 to 17). A final group emerged in the top 10 this year, including Jasper, Greenville, Anderson and Pickens State of South Carolina Consolidated Annual Performance & Evaluation Report Section II-H Program Year: April 1, 2011 March 31, 2012 Page 80
 1 York 1 in 377 units 8 2 Dorchester 1 in 397 1 3 Horry 1 in 400 6 4 Berkeley 1 in 434 7 5 Beaufort 1 in 490 3 6 Jasper 1 in 490 Not in Top 10 7 Greenville 1 in")

87 SECTION II GENERAL PERFORMANCE NARRATIVE H Self-Evaluation Rank County South Carolina County Foreclosure Rankings As of April 2012 Change Over the Past Year Rate of Foreclosure Filing as of April 2012 Rank One Year Ago (April 2011) 1 York 1 in 377 units 8 2 Dorchester 1 in Horry 1 in Berkeley 1 in Beaufort 1 in Jasper 1 in 490 Not in Top 10 7 Greenville 1 in 499 Not in Top 10 8 Fairfield 1 in Anderson 1 in 678 Not in Top Pickens 1 in 692 Not in Top 10 The following Foreclosure Heat Maps illustrate changes in the state from April 2011 to April FORECLOSURE FILINGS As of April 2011 As of April State of South Carolina Consolidated Annual Performance & Evaluation Report Section II-H Program Year: April 1, 2011 March 31, 2012 Page 81
88 SECTION II GENERAL PERFORMANCE NARRATIVE H Self-Evaluation Related to foreclosures, as well as special needs households and their unique housing stability challenges, homeless prevention has emerged as both a need and a focus nationally and in South Carolina. Evidence of success in preventing homelessness can be seen in the higher numbers of households served over the last several years, and in the apparent continuing, gradual decrease in homelessness in this state which, as discussed in Section II E Other Actions, Actions to Address Underserved Needs, may at least partially be the result of prevention efforts. Foreclosure in particular has put many households at risk of losing their homes, and in fact the new prevention and solutions oriented ESG program for 2012 will acknowledge this and place greater emphasis on prevention. But other special populations, including veterans, those with disabilities including substance abuse and HIV/AIDs, victims of domestic violence and the chronically homeless, remain at risk of homelessness and source of continuing need for shelter, supportive services, supportive and transitional housing, housing affordability assistance and prevention activities. Overall, economic conditions and housing market conditions continue to undergo change, and recovery from both the foreclosure crisis and the ensuing recession have been slow. Strategies and actions related to affordable housing must address these changing conditions, while also continuing to encourage the development of infrastructure to support affordable housing, lower homeownership and rental costs and expand the supply of affordable housing. New and/or updated strategies were identified in the state s new Consolidated Plan for , but additional solutions will continue to be needed, particularly as new resources become available in South Carolina. Using existing resources, the State will continue to devote HOME, state and other federal resources to meeting housing needs, and the state will continue to focus attention on issues such as eliminating barriers to affordable housing and impediments to fair housing choice, as well as on new, emerging issues such as green building and energy efficiency. Non-Housing Needs In addition to housing, there exists a wide variety of other, often interrelated community and economic development needs throughout the state. These needs relate directly to quality of life for low and moderate income residents and to: Making a suitable, high quality living environment both available and sustainable, Addressing and helping to eliminate barriers to economic development and the ability, particularly for the state s most rural communities, to compete for new jobs and investment, and Creating communities where there is viable and sustainable economic opportunity for low and moderate income residents, as well as for its businesses and for the community as a whole. Economic Opportunity Economic Opportunity Needs The state s new Consolidated Plan identifies several priority needs related to economic development, including the need to create economic opportunity for individuals in the form of jobs, the need to improve access to jobs especially for persons with special needs, and the need to prepare communities to create and sustain economic opportunity by eliminating barriers such as blight and abandoned buildings, poor workforce skills, dilapidated and no longer vital commercial town centers, dilapidated and inadequate public infrastructure failing to properly 2011 State of South Carolina Consolidated Annual Performance & Evaluation Report Section II-H Program Year: April 1, 2011 March 31, 2012 Page 82
89 SECTION II GENERAL PERFORMANCE NARRATIVE H Self-Evaluation support existing business and residential areas and/or precluding growth, and poor or inadequate services for public health and safety. The latter are particularly important for communities to increase population and commercial activity, improve their ability to compete economically, and to increase the likelihood that the community will succeed in sustaining and growing local business and employers, attracting new businesses and creating and sustaining job growth. However, creating an environment conducive to economic growth is a complex process requiring planning, community leadership and involvement and innovative thinking. Jobs alone will not necessarily generate sustainable economic opportunity, and what worked twenty years ago will not necessarily create a solid economic base today, particularly in rural, less developed areas. New approaches are constantly necessary as the economy, local economic conditions, and business and employer needs all change. Further, areas in greatest need of economic development in South Carolina are also the state s smaller and more rural communities, where challenges are greatest because of above average levels of poverty and unemployment, gaps in education and skill levels, and limitations in the form of scarce resources, capacity and vision. Overall, a complex array of factors determines the ability of the state s communities to generate economic opportunity and employment for residents. Economic needs overlap suitable living environment needs and even housing, with the most pressing needs resulting from the economic downturn, business closures, job losses and high unemployment in many counties. Diverse and compelling needs associated with improving the economy include infrastructure, sites and buildings needed to attract new businesses, workforce development and employment-related training, downtown development and small business programs, and elimination of obstacles to economic development. Impact on Economic Opportunity Needs Accomplishments in 2011 have helped address economic development and sustainability needs and build on projects completed in prior years that are having a positive impact on local economies. After previously funded projects are completed, many local governments have reported that more businesses are being retained and others are growing, more individuals have skills needed by businesses in the community, residents are less likely to leave the community to find either economic opportunity or quality goods and services, and local economies are starting to show signs of being healthier and more sustainable. Similar impact is expected from projects funded in 2011, which use multiple approaches to make communities more sustainable economically or make jobs more available and more accessible, particularly for the state s low and moderate income workers. These included: Infrastructure assistance to support local business growth and allow an existing rural industry to expand and create 15 new jobs. Support for 29 programs that provide employment assistance, childcare and other programs and services, particularly for those who are homeless or have special needs, to improve access to existing jobs, ability to compete for jobs and ability to maintain employment. Improvement of workforce development resources at libraries in two communities to help improve skills and qualify area workers for jobs in today s economy. Revitalizing the downtown of a town to jump start local business growth and help retain and perhaps grow existing businesses, as well as to provide a better range of goods and services to residents State of South Carolina Consolidated Annual Performance & Evaluation Report Section II-H Program Year: April 1, 2011 March 31, 2012 Page 83
90 SECTION II GENERAL PERFORMANCE NARRATIVE H Self-Evaluation Eliminating blighting influences on two communities by demolishing dilapidated intown structures and clearing an abandoned mill site. Supporting expanding industries to diversify the economy or maintain existing anchors and increase local tax base from private investment, thereby also potentially stimulating greater demand for local goods and services and fostering related small business and job growth. In addition to efforts which were assisted by CDBG, the state managed significant economic development achievement in Projects were announced in all but nine counties, with 32% of investment and 21% of jobs in the state s most rural counties, or those designated in the bottom two tiers in terms of development status and most in need of economic opportunity. In these rural counties, the highest levels of overall job creation were 1,395 new jobs in Marlboro County and 1,630 new jobs in Sumter County, largely as a result of a major expansion by Continental Tire. Orangeburg County (695 jobs), Laurens County (490), Lancaster County (437), and Barnwell County (427) will also see significant numbers of new jobs. A total of 42 firms will create more than new jobs in the state s Tier 3 and 4 counties and invest almost $1.1 billion. However, there are counties where there were no or only limited announcements in 2011, indicating more investment and job creation is needed, particularly in the state s most rural areas. Statewide, the economic development news is positive. The state recruited or encouraged expansion by 149 companies that announced plans to create 2,013 new jobs and invest over $5.1 billion in the state. Job creation levels are consistent with 2010, which was the highest level of new jobs since 2003, and capital investment is the highest reported since Contributing to these totals were six projects that each announced more than 700 new jobs and will generate combined new capital investment of $2.1 billion. As referenced above, the largest job creation was announced by Continental Tire the Americas, which announced a $500 million investment in a new tire manufacturing facility in Sumter County and an expected 1,700 new jobs in South Carolina over the next ten years. The largest capital investment was announced by another tire company, Bridgestone, which will undertake a major, $1.2 billion expansion in Aiken County and create more than 850 new jobs. The other top three job creators include: TD Bank, which will expand operations in Greenville County and create 1,400 new jobs and $17 million in capital investment; 5-Star USA which will create a manufacturing campus in rural Marlboro County that will create 1,000 new jobs and an investment of $25 million; and Amazon, which is planning to increase investment in its Lexington County facility by $25 million and employment by 750 jobs. The expansion of Continental Tire and Bridgestone in South Carolina will strengthen the state s existing automotive manufacturing cluster, which includes over 250 automotive and automotiverelated companies in addition to BMW. Reflecting this growth, Business Facilities magazine rated South Carolina #2 in automotive manufacturing strength in its July/August 2011 edition. BMW celebrated major milestones in 2010, including the one-million th BMW X5 to roll off the production line, and announced an additional $100 million investment in The 2010 investment was the second largest by BMW to date, and coupled with the 2011 announcement mean an estimated 600 additional jobs for South Carolina. BMW s investment since its initial announcement in 1992 is now $4.7 billion, and the company employs more than 7,000 South Carolina residents. BMW is also a founding partner with Clemson University and the State of South Carolina in an advanced-technology research facility, the Clemson University 2011 State of South Carolina Consolidated Annual Performance & Evaluation Report Section II-H Program Year: April 1, 2011 March 31, 2012 Page 84
91 SECTION II GENERAL PERFORMANCE NARRATIVE H Self-Evaluation International Center for Automotive Research (CU-ICAR), which benefits the entire industry in this state. Aviation is a another newer but equally significant cluster, following the landmark 2009 decision by Boeing to build a second assembly line for its 787 Dreamliner aircraft in North Charleston. In a second announcement in May 2010, Boeing demonstrated its confidence in South Carolina by again selecting North Charleston as the site for a second new plant to fabricate interiors. Construction on the initial, $870 million Dreamliner assembly facility is now complete and the first Dreamliner rolled off the assembly line in April The impact is expected to be felt throughout the entire state, first by the more than 6,000 new jobs Boeing has created at the facility, and second as new business opportunities arise for existing companies and new suppliers and other companies seek proximity to Boeing. Currently, South Carolina is home to several hundred aerospace-related companies, and as this economic cluster evolves, these numbers will increase. Overall, between 2003 and 2011, the SC Department of Commerce has recruited over 142,000 new jobs and $29.3 billion in new capital investment. Unemployment, which lags behind announcements of investment and job creation, continues to decline from the January 2010 high of 12.5% to a lower 8.8% as of April 2012, but even with this improvement, South Carolina still has the 8 th highest unemployment rate in the nation. Within the Southeast, the state is faring slightly better, with a lower unemployment rate than Georgia (8.9%) and North Carolina (9.4%), but a higher rate than Florida (8.7%), Tennessee (7.8%) and Virginia (5.6%). More importantly, within the state, there are significant differences between urban and rural county unemployment rates. Three of the state s rural counties continue to have unemployment rates of 15% or higher, including Marion (17.4%), Marlboro (16.2%), and Allendale (16.0%). Other counties with persistently high unemployment are also rural and include Barnwell (14.1%), Chester and Union (13.6%), Dillon (13.5%), Clarendon (13.1%), McCormick (12.8%) and Fairfield and Orangeburg (12.2%). In other areas of the state, including the state s larger metropolitan areas in the Midlands, Upstate and Charleston Region, unemployment is generally below the state average. Variation in these rates within the state reflect the greater challenges faced by the state s less developed areas, and the ongoing need in these area for CDBG-funded efforts to eliminate economic barriers and improve competitiveness. Another key indicator is per capita household income, and South Carolina and the Southeast as a whole continue to lag behind the nation. States on the nation s southern border from Arizona to Georgia (but excluding Florida) also continue to be amongst the nation s highest in terms of poverty rate by household State of South Carolina Consolidated Annual Performance & Evaluation Report Section II-H Program Year: April 1, 2011 March 31, 2012 Page 85

92 SECTION II GENERAL PERFORMANCE NARRATIVE H Self-Evaluation 45,000 40,000 35,000 30,000 25,000 20,000 15,000 10,000 5,000 0 South Carolina Per Capita Income Compared to United States and Southeast United States Southeast region South Carolina Source: US Bureau of Economic Analysis, While continued improvement in unemployment and gains in per capita income can be expected as a result of recent announcements, as jobs are actually created and the new companies create indirect impact on the economy statewide, it is clear that economic opportunity remains a priority need in South Carolina. For the remainder of the consolidated plan period, to address persistent needs in the state, South Carolina will continue to pursue a longer-term strategy aimed at comprehensively addressing economic opportunity, by helping to attract new jobs and investment but also by making communities more sustainable and better able to support economic opportunity. The Department of Commerce is committed to assisting this long-term strategy, and CDBG will continue to make funding available to assist communities with a variety of efforts. Recruiting and retaining employers, particularly in rural areas, remains a compelling need, and CDBG will continue to assist through the provision of critical infrastructure, business assistance or other forms of public or private assistance that will directly result in new or retained jobs, particularly for low and moderate income residents. CDBG will also continue to make funding available for projects and activities that enrich communities, revitalize neighborhoods and communities, and holistically address elements that impact the community s attractiveness to business and industry, its ability to grow local businesses and industry, and its overall ability to support economic activity and growth. Suitable Living Environment Suitable Living Environment Needs Suitable living environment refers to the quality, condition and capacity of facilities and services provided by or available within communities, neighborhoods, towns, or regions that are primarily low and moderate income or where low and moderate income residents live and work. Basic, essential needs beyond shelter must be met in order to ensure health and safety. These include elements such as clean drinking water, water for fire protection, safe roads and bridges, and adequate storm drainage to prevent flooding. Community facilities and services must also be available, accessible and affordable in order to create and sustain quality of life. For those who are homeless, or those who have special needs, a suitable living environment can also mean 2011 State of South Carolina Consolidated Annual Performance & Evaluation Report Section II-H Program Year: April 1, 2011 March 31, 2012 Page 86
93 SECTION II GENERAL PERFORMANCE NARRATIVE H Self-Evaluation emergency shelter and related services or the supportive services necessary to make independent living possible for people living with HIV/AIDS and their families. Priority needs identified in the Consolidated Plan are broad and often relate to quality of life and community sustainability as well as community competitiveness and economic opportunity. Needs are interrelated and compelling, and the state has identified multiple means of strengthening communities and helping prepare them for a sustainable future. These include: Investing wisely in infrastructure, community facilities, services and neighborhoods comprehensively, by building on and improving existing assets while also helping to improve health and safety or economic opportunity. Working collaboratively within regions to develop regional economies of scale, maximize limited resources, especially as relates to existing infrastructure which needs to be modernized and upgraded to make existing systems more financially viable, energy efficient and sustainable. Limiting the financial impact on communities and tight municipal and county budgets by identifying, upgrading and maintaining existing facilities, or adaptively re-using existing facilities, and by avoiding the creation of new facilities that might create additional or undue financial operating burdens. Investing in and revitalizing existing neighborhoods in established communities to make them more livable and sustainable, with an emphasis on public safety, appearance, impact on community as a whole, and access to goods, services, housing and jobs. For those who are homeless, whether they are sheltered or unsheltered, much more basic needs exist for shelter and supportive services, and for those living with HIV/AIDS, supportive services such as case management, transportation, educational and employment services, and substance and drug abuse are needed to promote independent living. Impact on Suitable Living Environment Needs In 2011, CDBG committed substantial funding to assist the state s local communities in becoming more sustainable, and ESG and HOPWA continued to provide funding for special needs suitable living objectives. Specifically, CDBG provided funding to assist 39 predominantly LMI communities with their infrastructure needs. While this is significant progress, there are still many more communities with existing needs, and new areas of need will continue to emerge as state growth continues, existing systems age and budgets and financial resources remain limited. While areas without public infrastructure continue to exist, they are typically lower in population and often less feasibly served by extension of new service. In other areas, infrastructure exists but is aging, dilapidated and inadequate to support the community s current needs, much less future needs and growth. And as the economic downturn persists, local budgets remain insufficient to address these needs, particularly in the state s more rural areas. Many smaller municipalities in South Carolina have found themselves unable to finance critical upgrades and are instead relying on aging, unreliable and/or inadequate systems. These not only impede business and residential growth, but can also threaten public health and safety and create environmental concerns. Likewise, other infrastructure is also aging and becoming inadequate and/or deteriorated, with roads being the most significant need, and drainage remains an unmet need in many areas of the state State of South Carolina Consolidated Annual Performance & Evaluation Report Section II-H Program Year: April 1, 2011 March 31, 2012 Page 87
94 SECTION II GENERAL PERFORMANCE NARRATIVE H Self-Evaluation Another concern is increasing costs, particular as systems age, to maintain multiple small, separate systems and CDBG has been providing funding for plans to develop regional systems. The Town of Gifford received CDBG funds to undertake a study of the viability of developing a regional water and wastewater system to serve the towns of Gifford, Scotia and Estill in Hampton County. The completed study included a collaborative institutional framework for resolving water supply and water and wastewater treatment issues, improving the level of shared knowledge regarding the legal, technical and economic factors affecting water management, and providing for improved water resource conservation. The framework also provided a means of tying municipalities and surrounding communities together in a common effort to address problems from a regional perspective. The study has helped to launch a new regional water/sewer authority in Hampton County and combine six small and inefficient systems into one more effective, efficient and sustainable solution for the region. To encourage further regional efforts, CDBG continues to assign points in the competitive funding process to projects that involve or will help develop regional systems. In addition to infrastructure, community facilities and services also remain ongoing needs, particularly where necessary to support high priority services, such as health care, public safety and workforce education. It is becoming more important, however, for communities to make more strategic, targeted investments and to develop plans that include these facilities in larger efforts to revitalize entire neighborhoods. This not only expands the availability and/or improves the quality of services in low to moderate income neighborhoods, but it also has other beneficial impacts, including: an improved quality of life for residents, stabilization of the community and preservation of housing values in existing neighborhoods. Through the CDBG Program s Village Renaissance initiative, funding has been set aside to encourage communities to undertake the planning required to successfully design such projects, and then to implement plans in logical, measured phases, with the goal being maximum impact on the community. To date, CDBG has awarded funding for 14 Village Renaissance plans, approved 8 previously completed plans and awarded subsequent funding for implementation, and awarded funding for a second implementation phase for three communities. Since public safety and health care, in particular, are crucial building blocks of a suitable living environment, CDBG has encouraged neighborhood revitalization planning and implementation projects which also address services critical to support economic growth. Public safety and crime prevention elements have been incorporated into all Village Renaissance projects funded, and CDBG has funded a number of other projects that will address fire protection and health services. In Walterboro, CDBG funded a Community Safety Initiative project that included a number of safety improvements along with revitalization, with the result that violent crime dropped 30% in one year, with additional decreases expected. In conjunction with the grant funded activities, programs were also created for at risk youth, including mentoring and internship. Public safety is a number one priority for the neighborhood and CDBG was instrumental in helping to fund an innovative approach to addressing this key quality of life concern. A total of 29 communities have benefited from Village Renaissance or Community Enrichment funding for neighborhood revitalization and public health or safety projects such as fire station expansions and health clinics. In spite of this, many more communities need to be revitalized and public health and safety needs remain in many other communities. Planning is another ongoing need, especially as comprehensive, coordinated approaches become more of a priority and as 2011 State of South Carolina Consolidated Annual Performance & Evaluation Report Section II-H Program Year: April 1, 2011 March 31, 2012 Page 88
95 SECTION II GENERAL PERFORMANCE NARRATIVE H Self-Evaluation funding and resources become more limited. CDBG will therefore continue to provide funding that will help address community sustainability through community infrastructure and facilities, neighborhood revitalization and planning. For those who are homeless, a much more basic need for shelter takes precedence, and ESG has and will continue to provide funding for operations and essential services, including new services such as outreach to the unsheltered which is eligible under the new Emergency Solutions Grant Program. Higher priority will be provided to prevention of homeless and assistance with transitional housing and re-housing efforts, however, which is also in keeping with the new Solutions oriented ESG program that will be implemented in future years, and in this is also reasonable given the apparent decrease in the rate of homelessness in the state indicated by the 2011 Homeless Count. For those living with HIV/AIDS, supportive services such as case management, transportation, educational and employment services, and substance and drug abuse will continue to be needed to promote independent living. The life expectancy for people with HIV/AIDS has increased, and so has the need for longer term housing solutions and the supportive services that are provided in conjunction with housing dedicated to this special needs population. Barriers to Implementing Strategies The continued availability of federal and state funding is perhaps the single most important factor affecting whether and how well the state can implement its strategies for community and economic development. Federal dollars, which have declined substantially in the last few years, will continue to be a major concern as the national budget shortfall worsens. The 2011 budget included cuts of 16% for CDBG over the previous year and 25% for HOME, with. ESG and HOPWA relatively unchanged. Similarly, state and local government budget shortfalls mean that fewer resources are available to address increasing community needs. If reductions in federal program funding levels continue, it will be necessary to adjust performance targets, coordinate and leverage other resources and strategically target efforts to the most critical needs where the greatest impacts can be achieved. Communities throughout South Carolina face individual challenges requiring individual solutions, and the State CDBG, HOME, HOPWA and ESG programs recognize this. Each program is broadly designed to address state level needs and objectives, while also allowing the flexibility to use HUD funds effectively at the local level. Applicants have the latitude to design projects based on local citizen participation that reflect local priorities and that are tailored to meet specific local needs. Then, through the competitive funding process, projects selected for funding are the best, or those that will achieve the greatest impact and contribute most toward achieving the State s goals. This is a significant strength of the State programs, but also a complicating factor in terms of planning and goal setting at the state level. Each program designs eligible activities which funding recipients can undertake in order to meet identified needs and achieve objectives, but none of the programs can accurately predict what kinds of applications will be received, which will involve the strongest, highest impact projects and which will be selected for funding in any year. Further, existing programs are occasionally adjusted and/or new pilot programs are introduced, and this requires guidance and technical assistance, as well as several initial funding cycles, to introduce the new programs, build knowledge, interest and capacity on the part of applicants, and to generate viable projects State of South Carolina Consolidated Annual Performance & Evaluation Report Section II-H Program Year: April 1, 2011 March 31, 2012 Page 89
96 SECTION II GENERAL PERFORMANCE NARRATIVE H Self-Evaluation Needed Adjustments or Improvements Priority needs and strategies identified for the next five years, as well as the specific goals and objectives set forth in the 2011 Action Plan, reflect the research and analysis undertaken to develop the new state Consolidated Plan for The new five-year strategy also reflects adjustments from prior years to accommodate changing resources, priorities and conditions. The Consolidated Plan, which includes the 2011 Action Plan, can be downloaded from the SC Department of Commerce website by visiting the CDBG Forms and Documents webpage at the address below. Specific CDBG program changes for the upcoming plan period and program year are described in Section III - CDBG Program Narrative, Changes in Program Objectives. Since the completion of the Consolidated Plan, HOME has made changes to its 2012 program in response to both significantly decreased HUD allocations in 2010 and 2011 and changes in the economy requiring greater priority and funding for affordable rental housing. Owner-occupied rehabilitation and tenant-based rental assistance have both been eliminated as eligible activities to allow remaining funding to be targeted toward rental housing development. Additionally, more regional HOME housing consortiums have been established, resulting in a smaller statewide allocation. These regional entities have greater capacity to focus on single family housing needs. State funds then are leveraged with HOME for multi-family housing needs that often require more layered subsidies to make them feasible. ESG has also made changes for 2012 to accommodate the new requirements of the Emergency Solutions Grant program which succeeds the Shelter version of the ESG program still in effect during the 2011 program year. These were anticipated in the Consolidated Plan and are reflected in the strategies which allowed for greater emphasis on HPRP-type homeless prevention and rehousing activities, but the final program rules published after the Consolidated Plan was completed identify new activities not previously contemplated, including outreach to unsheltered homeless. The 2012 HOME and ESG Annual Plans are included in the 2012 Consolidated Annual Action Plan, available on and provide greater details. In the future, more adjustments may be required if underlying needs continue to change, funding levels are further reduced and or new funding sources created, or shifts occur in the broader strategies for community development, housing or economic development within which the programs operate. The latter is occurring at the federal level, as well as at the state level. Given this and uncertainties regarding funding, the state will continue to identify specific goals and any changes to strategies and objectives annually in each Annual Action Plan State of South Carolina Consolidated Annual Performance & Evaluation Report Section II-H Program Year: April 1, 2011 March 31, 2012 Page 90
97 I. Monitoring Manner and Frequency of Monitoring Activities Monitoring and technical assistance are essential to ensuring compliance with the statutory and regulatory requirements and provisions of the CDBG, HOME, HOPWA and ESG programs. During the program year, compliance monitoring was conducted by the relevant administering agencies and organizations, in a manner and at a frequency consistent with the monitoring and compliance requirements for each program. CDBG All CDBG projects are monitored for compliance prior to project completion and at various points in the grant process. The programmatic and financial monitoring review process is carried out to address three basic questions: Are approved activities being carried out and in a timely manner? Are activities and certifications conducted in accordance with the requirements and the primary objectives of Title I and with other applicable laws? Does the recipient show a continuing capacity to carry out approved activities in a timely manner? During the course of a CDBG project, the State monitors each recipient through periodic on-site visits and written quarterly reports, so that any problems that might occur may be resolved as soon as possible. Significant resources are dedicated to proactively providing technical assistance to ensure that local grantees have the capacity to carry out grants in accordance with laws and regulations and in a timely manner. Benchmarks for a project are established at the time of grant award, and thereafter are monitored frequently to ensure adequate progress is being made. CDBG staff also review the timeliness of disbursements and actual expenditures compared to budget. It is the goal of the State to assist and support recipients in complying with applicable State and Federal requirements and in implementing their project activities. HOME In the HOME program, all projects are monitored for compliance. Prior to monitoring, each recipient is required to attend one or more HOME Wellness meetings to ascertain their compliance with regulations. Follow-up meetings are scheduled as needed for recipients to receive technical assistance to ensure full compliance. Those recipients deemed to be in compliance are then scheduled for monitoring visits. In addition, written quarterly reports are received by the Authority to compliment the wellness meetings as another form of follow-up. HOPWA For HOPWA, SCDHEC requires programmatic and fiscal reports from each contractor quarterly and annually. Contract monitoring visits are conducted at least annually. A team composed of program staff conducts annual site review visits. This team approach is quite effective in conducting a comprehensive site review with a focus on providing technical assistance State of South Carolina Consolidated Annual Performance & Evaluation Report Section II-I Program Year: April 1, 2011 March 31, 2012 Page 91
98 SECTION II GENERAL PERFORMANCE NARRATIVE I - Monitoring Program issues monitored during a site visit include documentation of client eligibility as well as verification of income information. Fiscal documentation of previously submitted invoices is also reviewed. Contractors/subcontractors meeting the federal threshold of expending $300,000 or more of federal funds in a fiscal year are required to submit fiscal audit reports according to the federal regulations time frames. The HIV/AIDS Division provides technical assistance (TA) to funded HIV care and services contractors for both administrative and programmatic activities. TA is provided and/or coordinated by Division staff. Specific areas of TA that the division provides include: Monitoring of contract objectives. Assistance in planning, implementing, and evaluating HIV care and services. Assistance with the coordination of community networking and consortia activities. Dissemination of federal and state policies and procedures. Linking with Division and/or DHEC training and TA resources. Other issues relevant to HIV care and services contracts as well as in response to requests for assistance. The Division provides targeted technical assistance and monitoring to contractors out of compliance with the contract objectives through the use of the corrective technical assistance plan. An agency may be placed on this plan when any of the following conditions are present. OMB audit is overdue. Quarterly reports are submitted late during two or more quarters. Contractors placed on this plan receive written notice of specific areas of programmatic/ administrative weakness, in addition to a technical assistance plan with specific recommendations outlining steps to improve areas cited. Follow-up technical assistance may be conducted in order to assess the agency s ability to resolve deficiencies. Agencies that do not resolve or adequately address deficiencies may jeopardize future funding opportunities. ESG The Governor s Office of Economic Opportunity (OEO) is required by Title I of the Housing and Community Development Act of 1974, as amended, to review the performance of units of local government which receive Emergency Shelter Grants Program (ESG) funds through the State. Monitoring visits to each subgrantee are made to (1) review the financial records of the subgrantee, and (2) to offer technical assistance. Subgrantees are generally monitored at least once during the grant period by a representative of the Office of Economic Opportunity for the purpose of reviewing the programmatic accomplishments of the projects funded under the Emergency Shelter Grants Program. Site visits are made to each project site / subgrantee at least once during the calendar year in which the unit of local government has received ESG funds. The State representative reviewing the accomplishments of the project will assess actual progress measured against the approved objectives, budget, and timetable proposed by the subgrantee. The purpose of the programmatic 2011 State of South Carolina Consolidated Annual Performance & Evaluation Report Section II-I Program Year: April 1, 2011 March 31, 2012 Page 92
99 SECTION II GENERAL PERFORMANCE NARRATIVE I - Monitoring review is to (1) evaluate program management in compliance with the application submitted to the OEO, (2) assess the accomplishments of the program, and (3) to offer technical assistance State of South Carolina Consolidated Annual Performance & Evaluation Report Section II-I Program Year: April 1, 2011 March 31, 2012 Page 93
100 SECTION III CDBG PROGRAM NARRATIVE SECTION III - CDBG PROGRAM NARRATIVE Use of CDBG Funds During the Program Year and Assessment of Relationship of CDBG Funds to Goals and Objectives The state s Consolidated Plan identifies priority needs in terms of housing, suitable living environment and economic opportunity. HOME and other SHFDA managed housing resources are targeted exclusively to housing, and both HOPWA and ESG are targeted to special needs and homeless housing and services. On the other hand, no Consolidated Plan programs other than CDBG are available for non-housing needs, or to address suitable living environment and economic opportunity. CDBG funds are therefore targeted at more holistic community development, neighborhood revitalization and economic sustainability and competitiveness activities, of which housing is only one of a broad array of eligible activities. In 2011 CDBG funds were used to address the Consolidated Plan objectives identified by local applicants for funding as a priority, and which are summarized in the table below. Additional discussion of the goals, objectives and accomplishments are found in the previous sections of this report: Section I Summary of Resources and Distribution, Community Development Block Grant Program, Table 3A Summary of Specific Annual Objectives Section II A - Assessment of Annual Goals and Objectives Decent Housing Object. Nbr DH-3 DH-3.1 Outcome/Objective Sustainability of Decent Housing Make existing affordable housing more sustainable and preserve affordable housing stock Performance Measure 2011 Goal 2011 Actual Households assisted Suitable Living Environment Object. Nbr SL-1 SL-1.1 Outcome/Objective Availability/Accessibility of Suitable Living Environment Provide funding for new or improved infrastructure, facilities, or services Performance Measure 2011 Goal Number of predominantly LMI communities assisted 2011 Actual SL-3 SL-3.1 SL-3.2 Sustainability of Suitable Living Environment Support community and regional planning and coordination initiatives Preserve neighborhoods through revitalization, development and elimination of blight Number of predominantly LMI communities assisted Number of predominantly LMI communities assisted State of South Carolina Consolidated Annual Performance & Evaluation Report Section III-CDBG Program Year: April 1, 2011 March 31, 2012 Page 94
101 SECTION III CDBG PROGRAM NARRATIVE Object. Nbr Outcome/Objective Economic Opportunity Performance Measure 2011 Goal 2011 Actual EO-1 Availability/Accessibility of Economic Opportunity EO-1.1 Support the creation or retention of jobs for LMI persons Jobs created or retained EO-3 EO-3.1 Sustainability of Economic Opportunity Improve community economic competitiveness and ability to support economic opportunity Number of communities assisted 10 6 For CDBG, 2011 was a productive year in which funds were used to make progress toward all objectives. CDBG awarded $24.5 million for infrastructure, neighborhood revitalization, planning, economic development and other projects that will directly address community viability, economic opportunity and sustainability. Further, 100% of funds awarded will benefit LMI communities or eliminate slum and blight conditions, and the majority of funds (63%) will benefit the bottom two tiers of counties in terms of development (those which would previously have been distressed or least or under developed). Housing As noted above, use of CDBG funds is designed to complement other state program funds and HOME funds, which are targeted exclusively to housing. To this end, CDBG continues to make funds available for neighborhood revitalization and infrastructure to support new affordable housing, as well as planning for revitalization which typically will include improvements to housing using CDBG or other resources. In 2011, these activities were eligible under the CDBG Village Renaissance Program, which is aimed at holistic revitalization of residential areas to positively impact vitality and sustainability of the entire community. Most revitalization projects involve multiple phases with priority in the initial phases being the provision of basic infrastructure. Both planning and implementation of revitalization plans support future revitalization and development activities, including housing, although housing units will not be reported as accomplishments unless directly funded by CDBG. Projects assisted by CDBG in 2011 will address sustainability of housing by extending new public water and sewer service and connecting 533 existing LMI households at no cost and providing exterior improvements and repair for an additional 26 units as part of comprehensive efforts to revitalize neighborhoods. Other public facility and community safety activities, combined with clearance of vacant and dilapidated housing, will improve overall community sustainability and help better support development of affordable housing and other housing improvements in the future. Funding in support of these objectives includes: $5.25 million was awarded to help revitalize, stabilize, improve public safety and make eleven communities more sustainable. An additional $125,000 was awarded to 5 communities to undertake Village Renaissance planning. 5,453 neighborhood residents will benefit, including 3,771 who are LMI. Twenty-six existing affordable housing units will be made more sustainable as a result of implementation projects State of South Carolina Consolidated Annual Performance & Evaluation Report Section III-CDBG Program Year: April 1, 2011 March 31, 2012 Page 95
102 SECTION III CDBG PROGRAM NARRATIVE $606,812 was included in 12 CDBG grant awards for new public facilities projects that will connect 533 low and moderate income families to public water and sewer. Availability of infrastructure is basic to decent housing. In its absence, families must rely on old, typically unreliable septic tanks and wells, and this often leads to unsafe or unlivable housing conditions. Economic Development Next to affordable housing, economic development is the highest priority need identified in the Consolidated Plan, and of the four formula grant programs, CDBG is the only program which targets funding toward economic development and economic opportunity. However, other state funding and incentives exist for job creating economic development projects, and because these resources have fewer requirements and are better suited to the fast track projects which are typical today, non-cdbg resources are often more of an incentive to companies seeking to locate new facilities or expand in South Carolina. Additional state resources include the Economic Development Setaside fund which receives an annual appropriation of $20 million per year, and the Rural Infrastructure Fund (RIF) which currently receives more than $12 million a year. While job creation remains a priority need, the struggling economy and slowdown in job creation has limited demands for CDBG assistance, and in general CDBG assistance is more often required for preparing communities to attract economic development investment, rather than for job creation activities. For many companies, market opportunities are short-lived and a very quick response is required in order to capitalize on market conditions. As a result, project time frames are increasingly short and often incompatible with the CDBG process and its complex, often cumbersome record-keeping and requirements. Other more flexible state resources are more appropriate for these fast-track business locations and expansions. CDBG does, however, remain an important resource for projects where the foregoing issues are less of a factor, and for projects making new jobs available in more rural and economically distressed areas. In 2011, CDBG assistance was provided to Hampton County for infrastructure necessary to support the expansion of an existing industry which will create 15 jobs. Since CDBG funding is managed in conjunction with these other resources, the state has opted to target funding where it will be most effective for rural job creation projects when feasible given the project timeframe, for downtown revitalization which will result in small business growth and/or retention and indirectly create jobs, and for projects that will improve economic competitiveness and help the community attract sustainable economic opportunity for its residents. Job creation has also resulted from prior year CDBG funding invested in downtown streetscape and revitalization projects aimed at making rural communities more economically competitive. Each community is now more economically vital and better able to support local businesses. Local businesses, in turn, have been able to create greater economic opportunity for local residents in the form of jobs. The communities also benefit from increased property tax and other business related revenues, improved sense of place, which is vital for small rural towns to thrive, and improved access to goods and services. The overall result is a more diverse and economically sustainable community and business environment State of South Carolina Consolidated Annual Performance & Evaluation Report Section III-CDBG Program Year: April 1, 2011 March 31, 2012 Page 96
103 SECTION III CDBG PROGRAM NARRATIVE For example, in the City of Greenwood, CDBG has funded a number of downtown redevelopment projects that have catalyzed business activity in town. The most recently funded project extended existing streetscape efforts along Court Avenue and was completed toward the end of the 2011 program year. Already, the City has reported two new businesses and one expansion resulting in seven new or retained jobs. Additional results are expected over the next year as Greenwood continues to track economic impact resulting from this CDBG project. Other projects in downtown Abbeville and York have also generated new business growth. Four new businesses have opened in downtown Abbeville and the town center now hosts live music performances on the Square. Local real estate companies have created events to show off the new downtown to prospective commercial and retail tenants. In York, new small retail businesses have also opened and Bluestar Silicones USA chose York as the site of a new 190,000 square foot manufacturing plant and warehouse. The company is converting a former textile plant for its use and expects to create 60 new jobs. Sustainable economic opportunity is a complex problem that requires new solutions, new types of projects and funding, and stable and sustainable communities as a base. For job growth to occur, rural local communities must first be capable of sustaining and supporting both businesses and residents, which involves community development, redevelopment and revitalization, as well as a broad spectrum of supporting community infrastructure and facilities. The latter must set the table for business by supporting a suitable quality of life and providing for health and safety, workforce development, and other vital community needs. Improvements in workforce skill levels not only support local businesses and the community, but are also a critical element in attracting larger scale economic development projects where worker skills, education and training are often key considerations. Similarly, essential community services are not only vital to keeping the local population healthy and safe, but also play an important role in supporting businesses and helping to attract new employers. During the year, CDBG funded several projects that will revitalize downtowns or remove obstacles to economic competitiveness and two projects that will improve workforce development resources at local libraries. Results and accomplishments for the 2011 program year include: $165,000 to assist a rural industrial expansion in the Town of Estill that will create 15 new jobs, while also making the local economy more diverse, creating greater need for goods and services and supporting additional small business and job growth. $500,000 to address community revitalization in one community, by improving streets and other public and community facilities in downtown commercial centers. 8,305 community residents will benefit. $589,000 to demolish blighted, abandoned and obsolete buildings representing obstacles to economic development in two communities, benefiting a total of 1,474 residents. $550,000 to expand or renovate two libraries in two communities, to provide 11,047 residents with enhanced opportunities for skill development, training and education. Suitable Living Environment In the Consolidated Plan, infrastructure and community facilities were both identified as areas of significant need in South Carolina. Historically, rural communities in particular often lacked 2011 State of South Carolina Consolidated Annual Performance & Evaluation Report Section III-CDBG Program Year: April 1, 2011 March 31, 2012 Page 97
104 SECTION III CDBG PROGRAM NARRATIVE sufficient tax base to develop public infrastructure necessary to providing a decent quality of life for all residents. Many low and moderate income residential areas did not have public water for fire protection, safe potable water for household and business use, or safe and reliable public sewer facilities. CDBG funding has therefore been used to provide new public infrastructure in areas that were not previously served, and in many cases to address related health and safety issues. More recently, a new and often greater need is to make existing systems more sustainable by addressing environmental problems and health and safety concerns posed by aging, dilapidated and/or inadequate systems. Inadequate systems can not only impair a community s quality of life but also its economic competitiveness by limiting its ability to support existing business and residential growth. During program year 2011, substantial CDBG funding was used to address priority infrastructure and community facilities needs and ensure the availability of a suitable living environment, as summarized below. $16.3 million in CDBG funding was awarded to 38 predominantly low and moderate income communities around the state for projects that will make public water or sewer available for fire protection, residential and business use, and to alleviate health and safety issues. Projects will benefit 25,852 residents, 64% of whom are LMI. $500,000 in CDBG funding was awarded to one primarily low and moderate income community to improve drainage and alleviate related health and safety issues. The project will benefit 550 residents, 82% of whom are LMI. Drainage improvements will also be undertaken in conjunction with water/sewer and neighborhood revitalization projects. CDBG Progress Toward Achieving Affordable Housing Objectives The HOME program is focused almost exclusively on affordable housing and is managed in conjunction with a substantial array of other resources, including both new federal resources created in response to recent economic challenges and other state resources for affordable housing. Most HOME funds are used for the development of affordable rental housing, rental assistance, homebuyer assistance and acquisition/rehabilitation of affordable owner rental units, and other available state funds managed by SHFDA complement HOME s range of activities. HOME Consortiums are also being formed in various regions of the state, expanding the availability of HOME funds to meet local housing objectives. CDBG, on the other hand, is the only one of the four HUD formula programs with funding earmarked for infrastructure, community facilities, and community revitalization/economic development, all of which are also priority needs identified in the state Consolidated Plan. Priority housing activities for CDBG were therefore targeted toward activities that complement infrastructure and community and economic development. Examples include connecting LMI housing units to new public infrastructure, demolishing vacant and abandoned houses that pose safety and security concerns in residential neighborhoods targeted for improvement, and performing needed exterior repairs as part of comprehensive programs of neighborhood revitalization. In 2011, CDBG again focused on providing funds for holistically revitalizing, energizing and stabilizing neighborhoods through its Village Renaissance Program. Funded projects include a variety of eligible public and community facilities, public services and housing-related activities, including repair of 26 LMI houses, connection of 533 LMI housing 2011 State of South Carolina Consolidated Annual Performance & Evaluation Report Section III-CDBG Program Year: April 1, 2011 March 31, 2012 Page 98
105 SECTION III CDBG PROGRAM NARRATIVE units to public water and sewer, and clearance of lots and dilapidated housing. As a result, projects funded during program year 2011 will address larger community sustainability objectives while also stabilizing neighborhoods and readying them for future affordable housing development. Combined housing accomplishments of the HOME, CDBG, HOPWA and ESG programs are illustrated on Table 2B. CDBG Funding Benefiting Low to Moderate Income Persons CDBG has historically focused on projects that will benefit low to moderate income (LMI) persons, including extremely low income persons who earn 0 to 30% of the area median income, low income persons who earn 30 to 50% of the median, and moderate income persons who earn 50 to 80% of the median. Typically, the majority of CDBG funded activities benefit LMI persons and meet the LMI national objective, and 2011 was no exception. Of the total $24.5 million awarded during the program year, 98% or $23.9 million will benefit LMI persons. In addition, projects which have been closed during the year provide an indication of the numbers of LMI individuals who have actually benefited. For 2011, this included 53,610 LMI, including 43% at 0-30% of AMI, 28% at 30-50% AMI, and 39% at 50-80% AMI. The attachments to this section, Attachment 1 IDIS Financial Summaries and Attachment 2 CDBG Civil Rights Report provide greater detail on funds benefiting LMI persons. Families and Persons Assisted by CDBG Funding (Civil Rights Compliance) CDBG funds assist persons of varying races and ethnicity. For completed projects which were funded out of open HUD allocations, including area benefit projects, the overall racial and ethnic characteristics for households (housing projects) and persons (all other types of projects) are shown below. Race/Ethnicity CDBG Funded 2010 Census Projects Completed South Carolina* African American 49.4% 27.9% White 47.7% 66.2% American Indian/Alaskan Native 0.5% 0.4% Asian 0.2% 1.3% Hawaiian/Other Pacific Islander 0.05% 0.1% * Note that, while we have included the current 2010 census data for the state for comparison, CDBG projects were generally completed before the 2010 Census. Of those beneficiaries reporting more than one race and/or ethnicity, 0.3% were African American and White, 0.04% American Indian/Alaskan Native and White, 0.03% American Indian/Alaskan Native and African American, and 0.2% were Asian and White. Other individuals reporting multiple races were 1.7%. Additionally, 0.2% reported Hispanic ethnicity in addition to one or more of the race categories. By program year of funding, the distribution is similar to the distribution for all fund years on average, as shown on the following page State of South Carolina Consolidated Annual Performance & Evaluation Report Section III-CDBG Program Year: April 1, 2011 March 31, 2012 Page 99
106 SECTION III CDBG PROGRAM NARRATIVE Race & Ethnic Characteristics of Completed Project Beneficiaries By Year of CDBG Funding Year African American White American Indian/ Alaskan Native Asian Native Hawaiian/ Other Pacific Islander African American & White Asian & White American Indian/ Alaskan Native & African American American Indian/ Alaskan Native & White Other Individuals Reporting More Than 1 Race Hispanic Total ,770 42, , , ,094 34, , , ,344 36, , , ,545 11, , ,312 4, ,625 Total 134, ,493 1, , , % 49.8% 0.7% 0.3% 0.06% 0.1% 0.02% 0.04% 0.05% 1.4% 0.1% 100.0% % 46.5% 0.3% 0.2% 0.03% 0.1% 0.02% 0.01% 0.00% 2.5% 0.2% 100.0% % 50.4% 0.7% 0.2% 0.04% 0.1% 0.03% 0.05% 0.07% 1.5% 0.1% 100.0% % 43.1% 0.2% 0.2% 0.03% 1.6% 0.01% 0.00% 0.01% 1.8% 0.6% 100.0% % 35.7% 0.2% 0.1% 0.11% 2.3% 0.00% 0.08% 0.01% 0.4% 0.0% 100.0% Total 49.4% 47.7% 0.5% 0.2% 0.05% 0.3% 0.02% 0.03% 0.04% 1.7% 0.2% 100.0% 2011 State of South Carolina Consolidated Annual Performance & Evaluation Report Section III-CDBG Program Year: April 1, 2011 March 31, 2012 Page 100
107 SECTION III CDBG PROGRAM NARRATIVE To ensure funding assistance does not exclude or discriminate against minorities, all applicants requesting CDBG funds are required to provide maps showing service areas. Funding decisions are further predicated on an analysis of proposed persons or households to benefit from project activities, either directly or indirectly, and the related income and race and ethnicity categories for the proposed beneficiaries. Recipients of CDBG funds must also ensure that CDBG-funded activities are conducted in a manner which will not cause discrimination on the basis of race, color, national origin, religion, sex, disability, age or familial status. All CDBG recipients must also comply with Section 504 accessibility requirements and submit a plan for 504 compliance which must be reviewed and approved prior to any funds being drawn. Section 504 compliance plans were submitted by and approved for each of the 58 different local governments awarded CDBG funding during program year Together with Fair Housing Plans discussed in Section II Affirmatively Furthering Fair Housing, which must also be submitted and approved before any grant funds can be drawn, the purpose is to encourage recipients to develop a comprehensive strategy for creating an environment which fosters nondiscrimination, an accessible living environment, and affirmatively furthers fair housing. Implementation of activities on either the 504 or Fair Housing Plan must occur prior to project close out. Other requirements for CDBG grant recipients include: Track and report the income, race and ethnicity of all applicants for direct CDBG financial assistance, as well as the income, race and ethnicity of all actual beneficiaries of CDBG funded projects. Comply with Equal Opportunity laws and requirements and ensure nondiscrimination in the provision of, use of or benefit from CDBG-funded housing, services, facilities and improvements, in CDBG-related employment, and in procurement related to CDBG-funded activities. Track and report on contracts quarterly, including information on the minority and Section 3 status of contractors and whether contractors represent woman-owned businesses. The State of South Carolina is also committed to ensuring equal opportunity. The state does not discriminate on the basis of age, race, color, religion, sex, national origin, familial status or disability in the admission or access to, or treatment of or employment in, its federally assisted programs or activities. Additionally, the CDBG Program includes staff designated to coordinate compliance with non-discrimination requirements, and he may be contacted at the above address and telephone numbers and notices of discrimination and equal opportunity are included on all public notices and notices. Changes in Program Objectives Changes to the CDBG Program for 2011 were generally minor clarifications of the 2010 Program and mostly designed to more efficiently target reduced resources. Within the Community Infrastructure Program, priorities were revised to clarify the program s focus on sustainability of existing systems. The Community Enrichment Program was expanded slightly for education and workforce opportunities, accessibility of public facilities for the disabled and 2011 State of South Carolina Consolidated Annual Performance & Evaluation Report Section III-CDBG Program Year: April 1, 2011 March 31, 2012 Page 101
108 SECTION III CDBG PROGRAM NARRATIVE LMI workforce transportation accessibility, and a planning component for downtown revitalization projects to help improve local economic conditions and support retail/small business. The Ready to Go Program was revised to require that projects address an urgent or compelling infrastructure or public facilities need, and to clarify requirements for up-front investment of local or other funds for planning. The Village Renaissance Program remained largely unchanged, with only minor changes to ensure timely implementation. Community Development Strategy Areas South Carolina does not have any Community Development Strategy Areas. CDBG Program Narrative Attachments In June 2011, HUD issued CPD Notice 11-03, which specified a new set of IDIS (Integrated Disbursement and Information System) Financial Summary and Activity Summary reports to comply with the requirements for attachments to the CDBG Program Narrative. These reports are described below. An important note is that these are new reports which have been modified by HUD IDIS contractors to meet unique state program requirements, and which are only available via download from the HUD IDIS system. The current 2011 program year is the first year for which these reports are required, and there have been changes to the way data is formatted. The following notes provide clarification on the display of data in the new reports. IDIS Financial Summary Reports: The new Financial Summary reports are focused on expenditure activities, or the amount of each year s HUD Grant expended by the state and its subrecipients during the program year. The Financial Summaries are also live reports reflecting data in IDIS as of the report run date. By comparison, the Activity Summary generally reflects activity during the program year, as of the March 31 program year end date. Important Note on Adjustments: A key element of the Financial Summaries is reporting based on year of funding from HUD, rather than by year of award to grant recipients (IDIS plan or project year). Enhancements to IDIS were necessary to allow this, but these updates were completed in 2010, making data reported by IDIS subject to inaccuracies for years earlier than For this reason, HUD designed the report to use a series of adjustments entered by the state into IDIS, and then used by IDIS to calculate an accurate total amount of each item reported. Both IDIS data and state adjustments are indicated on the report, as well as the calculated total amount. Readers should focus on lines with labels beginning with Total. Program Income There are also two types of Program Income in IDIS for states, and both are combined in the Financial Summary reporting. The first is called Program Income (PI) and it is used to fund drawdowns when received, prior to drawing CDBG funds. The state obligates these funds upon receipt, generally to fund on hand requests for payments. The second is called State Revolving 2011 State of South Carolina Consolidated Annual Performance & Evaluation Report Section III-CDBG Program Year: April 1, 2011 March 31, 2012 Page 102
109 SECTION III CDBG PROGRAM NARRATIVE Fund Program Income (SF) in IDIS, and this is used to fund grant awards. IDIS uses the term distribution for both expenditure of PI and obligation of SF funds. CDBG Program regulations require that Program Income be reported based on the year during which it is obligated to grant recipients. As noted in CPD 11-03, HUD requires that program income (PI) returned to the state belongs to the [HUD Grant] which funds the program year in which the program income is distributed. This means that program income is reported in two different ways on the Financial Summaries: In Part A, Sources of State CDBG Funds, Program Income is reported on the Financial Summary report for the year during which it was received In Part B, State CDBG Resources by Use, Program Income is reported on the report for the year during which it was distributed to recipients, or when SF is obligated to grant recipients or when PI is obligated and expended. Once received, both PI and SF take the year distributed, so all distributions are known as of the close of the program year covered by the report. No additional distributions are possible for 2010, for example, after the end of the 2010 program year in March Amounts shown as distributed are actual amounts of PI expended and SF obligated, and these will only change on future reports if an obligated amount is reduced or an SF obligated grant is terminated. Any recaptured funds will be carried forward to the current year and shown in the year when they are redistributed. There may be balances of undistributed SF funds at the end of a program year. These are shown in the most current open fund year, or the year which they are available for distribution. Total undistributed Program Income is shown in this Annual Performance Report on the Financial Summary for the 2011 HUD Grant. Program Income Reporting The labels in this section are confusing, as is the documentation for these line items provided in the related HUD notice. The state has therefore made the following assumptions: Program Income Returned to the State and Redistributed, shown on Line 20, should be the total amount of PI obligated to grant recipients and expended during the year and SF State Revolving Fund Program Income obligated to grant recipients during the year. Figures here are populated by IDIS. Adjustments on Line 21 are those needed to correct the IDIS data on Line 19. The correct total amount distributed is shown on Line 22, labeled Total redistributed. Program Income Returned to the State and Not Yet Redistributed, shown on Line 23, is assumed to be PI and SF balances. These are only applicable to the Financial Summary for the 2011 HUD Grant which corresponds to the current program year. Distributions for all other years generally will not change, except where obligated SF funds are recaptured, and any funds distributed since last reporting would have to be reported on the 2011 report. The state s undistributed SF balance, resulting from receipts in any program year, is therefore shown on the 2011 report. Line 23 is populated by IDIS, and adjustments on Line 24 are those needed to a) correct the IDIS amount on Line 23 and b) deduct balances carried forward to Total Not Yet Redistributed on Line 25 is zero for all years except State of South Carolina Consolidated Annual Performance & Evaluation Report Section III-CDBG Program Year: April 1, 2011 March 31, 2012 Page 103
110 SECTION III CDBG PROGRAM NARRATIVE Program Income Retained by Recipients, shown on Line 26, should be zero for all HUD Grants as no program income is retained by the State or allowed to be retained by its sub-recipients. Program income on hand must be spent before any additional CDBG funds are drawn. Adjustments on Line 27 are those needed to make Total retained equal to zero. Public Service Cap This section shows expenditures in IDIS for activities with a public services IDIS matrix code. South Carolina tracks expenditures not just by activity but also by budget for incidental activities, which as recommended by HUD during IDIS training sessions for states, are not separately reported in IDIS to avoid duplication of accomplishment data.. Adjustments are therefore those needed to a) correct IDIS populated data on Line 41, and b) include amounts for incidental public services not reflected in IDIS. Note that compliance with the public services cap cannot be determined until all funds from a particular HUD Grant have been expended. Planning and Administration Cap This section shows expenditures in IDIS for activities with a planning or administration IDIS matrix code. South Carolina tracks expenditures by activity as well as by budget for incidental project activities not reported in IDIS, as described above. Adjustments are those needed to a) correct IDIS populated data on Line 50, and b) include amounts for incidental local administration and planning. Note that compliance with the planning and administration cap cannot be determined until all funds from a particular HUD Grant have been expended. Compliance with Overall Low and Moderate Income Benefit This section shows expenditures in IDIS for activities based on the CDBG National Objective. South Carolina tracks expenditures by activity as well as by budget for incidental project activities not reported in IDIS, as described above. In some cases, an incidental budget item may meet a different national objective, and incidental local planning and administration is not used to determine compliance with the LMI overall benefit requirement. Adjustments are those needed to a) correct IDIS populated data on Lines 561, 65 and 68, and b) adjust for incidental local administration and planning or incidental expenditures meeting other national objectives. IDIS Activity Summary The Activity Summary, which is available as a separate document and can be downloaded from shows activities funded out of each HUD grant that were determined by IDIS to be active during the year. Generally activities are included if they had funds expended during the year, were completed or canceled in IDIS during the year, or were otherwise flagged by IDIS as active. However, the state notes that some active grants are not shown on the report, especially in cases where they were completed after March 31, Also note that data not collected by IDIS for particular types of activities is often shown as 0 rather than as a blank or as N/A. Accomplishments for Low Mod Area Benefit activities are shown only under Proposed Accomplishments, where despite the label, the data shown is either proposed if the activity is open in IDIS or actual if the activity is completed. The state collects more detailed information on grant beneficiaries and this is shown in the Family and Persons Assisted by CDBG Funding section, above State of South Carolina Consolidated Annual Performance & Evaluation Report Section III-CDBG Program Year: April 1, 2011 March 31, 2012 Page 104
111 SECTION III CDBG PROGRAM NARRATIVE Information on the Activity Summary includes: UGLG the unit of local government to which the state has obligated funding from one or more HUD Grants. Note that if the activity is for a Regional Planning grant, the local government name is shown in the IDIS Activity field. Grant Year The HUD Grant from which funds were obligated to the local government. Project The CDBG Program under which funds were obligated to the local government. IDIS Activity The number assigned to the activity by IDIS, plus the name of the local government. Status The IDIS status of the activity, which can be Completed if the activity has been closed in IDIS, and in which case it will show the date closed in IDIS, Open along with a zero, which indicates no completed date, and Canceled for activities that have been cancelled in IDIS. Objective The HUD objective which the activity addresses and which is either Decent Housing, Suitable Living Environment or Economic Opportunity. Outcome The HUD outcome for the activity, which is either Availability/ Accessibility, Affordability or Sustainability. CDBG activities generally reflect Availability or Sustainability. Matrix Code An IDIS code generally reflecting the type of activity. National Objective The HUD national objective for the activity. Initial Funding Date The date on which funding for the activity was physically set up in IDIS. Date obligated is collected by IDIS to facilitate reporting on the timeliness of obligating funds, but this is not shown on the Activity Summary. Financing Funded Amount Amount of the HUD Grant obligated to the activity, including both PI and SF Program Income. Net Drawn The cumulative amount of HUD Grant funds, PI or SF expended. Proposed Accomplishments Generally, either the number of people expected to benefit from an activity with an LMA, LMC, SBA, SBS or UN national objective, the number of jobs expected to be created by an activity with an LMJ national objective, or the number of households expected to benefit from an LMH national objective. Note that for LMA completed activities, the data here reflect actual beneficiaries. Total Population in Service Area Shown only for LMA area benefit activities and shown as zero (0) to indicate not applicable for all other activities. Census Tract Percent Low/Mod Percentage of the Total Population in Service Area which are LMI. Shown only for LMA activities and shown as zero (0) to indicate not applicable or no data for all other activities. Refer to Attachment 2, CDBG Low and Moderate Income and Civil Rights Report more complete data on beneficiaries. Actual Accomplishments Number Assisted Shown only for non-lma activities and shown as zero (0) for LMA projects. Zeroes also shown for non-housing activities in all fields in columns labeled Owner, Renter and Total which all refer to households. Non-LMA, non-housing accomplishments are shown in the column labeled Persons. Actual Accomplishments Income Category Similar to Actual Accomplishments Number Assisted above State of South Carolina Consolidated Annual Performance & Evaluation Report Section III-CDBG Program Year: April 1, 2011 March 31, 2012 Page 105
112 SECTION III CDBG PROGRAM NARRATIVE Annual Accomplishments IDIS requires different information for different project types, and each can be entered by year of accomplishment. However, this report may show 0 as the number benefiting, regardless of whether data exists elsewhere in IDIS. Activities not in IDIS There are no activities that are not in IDIS State of South Carolina Consolidated Annual Performance & Evaluation Report Section III-CDBG Program Year: April 1, 2011 March 31, 2012 Page 106
113 SECTION IV HOME PROGRAM NARRATIVE SECTION IV - HOME PROGRAM NARRATIVE 2011 State of South Carolina Consolidated Annual Performance & Evaluation Report Section IV-HOME Program Year: April 1, 2011 March 31, 2012
114 HOME Investment Partnership Program State of South Carolina Program Annual Report For the Period of April 1, 2011 March 31, 2012 Submitted To: US Department of Housing and Urban Development Community Planning and Development Division 1835 Assembly Street Columbia, SC Prepared by South Carolina State Housing Finance and Development Authority 300-C Outlet Pointe Blvd., Columbia, SC Telephone (803) Fax (803) TDD (803)
115 TABLE OF CONTENTS Page Executive Summary Consolidated Plan Narrative... 4 Private Sector Participation Narrative... 5 Community Housing Development Organizations Narrative... 6 Affirmative Marketing... 7 Minority Outreach Narrative... 8 Shortfall Funds Narrative... 9 Relocation Narrative Monitoring Compliance Narrative Program Income Narrative Appendices A HOME funds Geographic Data B. HOME Match Report C. Section 3 Summary Report
116 ANNUAL PERFORMACE REPORT April 1, March 31, 2012 Executive Summary In 1992, the South Carolina State Housing Finance and Development Authority (the Authority) was designated as the Participating Jurisdiction (PJ) for the State of South Carolina. The Authority accepted all responsibility for the implementation, administration, and evolution of the HOME Investment Partnership Program (HOME) in accordance with regulations 24 CFR Part 92, as amended. The overall national objectives of the HOME program are to expand the supply of decent, safe, sanitary and affordable housing for low and very low income beneficiaries, and to promote the development of partnerships as part of an effective delivery system. The Authority believes the HOME program has been an integral part in achieving its mission to create quality affordable housing opportunities for the citizens of South Carolina, in conjunction with meeting the goals set forth in the 2011 Consolidated Plan. Additionally, for the past twenty years, the HOME Program has adapted to the ever changing affordable housing environment to achieve those goals. The Authority receives an allocation of HOME Program funds each year, based on the state s population, from the U.S. Dept. of Housing and Urban Development (HUD). For 2011, that amount was $6,922,241. The money earned through HOME activities, such as monthly payments from previous low interest loans awarded, is referred to as Program Income (PI). HOME PI is added to the HUD allocation annually and the total amount is then distributed among the HOME eligible activities. Those activities are homeownership, rental, and tenant based rental assistance. In 2011 HOME PI was anticipated to be $3,000,000 but the Authority actually receipted in the Integrated Disbursement & Information System (IDIS) $4,595,505. There was also a carry forward amount of $2,000,000 for a total actual allocation of $13,517,746. Using previous years Action Plans as guidance, the Authority set aside portions of the above total for each eligible HOME activity. For 2011, the Authority allocated HOME PI funds for downpayment/closing cost in conjunction with the Mortgage Revenue Bond Program (MRB) and for rental housing assistance in conjunction with the Authority s Rental Assistance Voucher Program. These activities provide borrowers and tenants affordable housing opportunities by providing downpayment/closing cost assistance and rental assistance, respectively. HOME PI funding, in the amount of $981,062, provided 397 HOME assisted units; of which 199 tenants benefited from rental assistance and 198 beneficiaries were provided assistance to purchase a home. Additionally, in this past year s competitive cycle, three (3) homeownership applications totaling $312,000 were awarded. The Authority allocated the largest portion of HOME funds to rental activities. During the competitive HOME cycle, a total of five (5) awards were made for $1,235,976. In addition, a total of nine (9) awards in the amount of $5,770,000 were committed to the Authority s Low Income Housing Tax Credit Program (LIHTC). The combined funding of HOME funds and Tax Credits for rental developments is considered one of the Authority s major initiatives. Page 1
117 In the noncompetitive activity for 2011, two (2) Tenant Based Rental Assistance (TBRA) applications were funded by the Authority in the amount of $271,905. The Authority continues to provide TBRA for Public Housing Authority s (PHAs) extensive rental assistance waiting lists with the intent to provide some relief and opportunities to those potential beneficiaries waiting for permanent assistance. PHAs awarded HOME funds can provide rental assistance for a period of up to 24 months to those persons that are very low income (50% or below area median income). The PHAs generally provide this assistance with their corresponding voucher programs or they design a separate program to provide assistance for a prioritized target group. In conclusion, the 2011 HOME funds produced 204 units for funds awarded to recipients and produced 805 units in conjunction with Authority administrated programs with HOME PI funds. The 2011 funds were allocated as follows: 10% for Administration ($692,224) and 5% for CHDO Operating Expenses ($346,112). [Note: The 15% Legislated amount to be awarded for the CHDO set-aside ($1,038,336) is included in both the homeownership and rental allocations.] The Authority expenditures for the 2011 reporting period were $13,307, The overall design of the Authority s distribution plan appears to be effective in that all regions of the state (up-state, lowcountry, and midlands) have utilized at least one of the activities available. Maps that outline the geographic location of 2011 HOME projects by activity and number of units are found in Appendix A. Page 2
118 2011 HOME Awards Awardees Award Amount Type of Applicant Type of Award # HOME Assisted Units County 2011 Homeownership Recipients Community Assistance Provider, Inc. $180,000 CHDO Grant 4 Newberry Pickens County Habitat for Humanity $42,000 CHDO Grant 3 Pickens Clarendon County CDC $90,000 CHDO Grant 12 Clarendon TOTAL $312, Rental Recipients Homes of Hope $337,378 CHDO Grant/Loan 6 Anderson Greenville Housing Futures $126,190 CHDO Grant 2 Greenville Homes of Hope $287,510 CHDO Grant 6 Greenville Genesis Homes $237,003 CHDO Grant 3 Greenville Lowcountry Housing & Redev. Corp. $247,895 Nonprofit Loan 4 Beaufort TOTAL $1,235, HOME/TAX Credit Rental Recipients Wellington Estates $620,000 For-Profit Loan 10 Aiken Merrimack Heights, LP $750,000 For-Profit Loan 10 Berkeley Summerville Garden $800,000 For-Profit Loan 15 Berkeley Cypress Lane, LP $390,000 For-Profit Loan 12 Georgetown Pelham Village, LP $360,000 For-Profit Loan 12 Greenville Cloverfield Estates $600,000 For-Profit Loan 12 Greenville Wescott Place $800,000 For-Profit Loan 12 Lexington CDG of S. Carolina, LP $800,000 For-Profit Loan 15 Richland Chestnut Pointe, LP $650,000 For-Profit Loan 10 Sumter TOTAL $5,770, TBRA Recipients Housing Authority of Fort Mill $175,000 PHA Grant 35 York & Lancaster Housing Authority of the City of Charleston $96,905 PHA Grant 21 Charleston & Berkeley TOTAL $271, Page 3
119 SOUTH CAROLINA STATE PJ Narrative Statement Consolidated Plan (ConPlan) HOME program activities, as outlined in the State's 2011 HOME Action Plan, conformed to the three broad housing priorities identified in the 2011 Annual Action Plan/Consolidation Plan (ConPlan). Those goals were to: 1. Enhance suitable living environments through new accessibility, affordability and sustainability. 2. Create decent housing with new availability, affordability and sustainability. 3. Provide economic opportunity through improved accessibility, affordability and sustainability. All three were broad five-year priorities utilizing federal, State, local and private resources. The Authority continues to meet all these objectives through all of the HOME activities which include acquisition, rehabilitation, new construction, direct assistance in providing downpayment/closing cost and TBRA which demonstrates the successful development of affordable housing represented in the awards made in In addition, the 2011 awards were made to various types of organizations (public housing authorities, nonprofits, forprofits, and individuals) in an effort to expand the Authority s housing partnership base. The production of housing for persons with special needs is increasing statewide. In 2011, the HOME program funded eight (8) projects for total of (72) units for persons with special needs. The special needs groups and the numbers of units served are as follows: the mentally-physically disabled and/or homeless (35), large families (22), and elderly (15). HOME staff provides an assortment of training for all participants and frequently participates in workshops, panels, and meetings that support and educate nonprofit and for profit organizations, as well as other local agencies interested in affordable housing. The Authority s HOME staff began holding special workshops which addressed specific topics related to the HOME requirements. The annual HOME application workshop was held February 17 th 18 th, 2011, in conjunction with the Palmetto Housing Forum and included a complete review of the application process and the HOME federal requirements including relocation, Davis-Bacon, Minority Outreach/Section 3, and Lead Based Paint. It is expected that this open communication will lead to more efficient, comprehensive, and coordinated planning of all participants. Since nonprofit participation is increasing in the housing development field, the HOME staff maintains a presence at venues that target nonprofit organizations by providing information about financial resources available for affordable housing. Additionally, HOME staff is available to offer encouragement and solutions to overcome the challenges of affordable housing development. Page 4
120 SOUTH CAROLINA STATE PJ Narrative Statement PRIVATE SECTOR PARTICIPATION The Authority, in partnership with the Affordable Housing Coalition of South Carolina, South Carolina Department of Consumer Affairs, U. S. Dept. of Agriculture Rural Housing Service and U. S. Dept of Housing and Urban Development hosted the 2011 Palmetto Affordable Housing Forum at the Columbia Metropolitan Convention Center on February 17 th 18 th, Nearly 500 registrants participated in a series of concurrent sessions with many various educational offerings. Those offerings varied from affordable housing awareness to consumer education, economic impacts of affordable housing to federal program overviews, and other specialized issues. Special sessions were also held to educate developers about the Gateway to Homeownership the Authority s Mortgage Revenue Bond Program, Neighborhood Stabilization Program (NSP), HOME and the Housing Trust Fund programs. Much of the 2011 conference was dominated by the economic crisis, foreclosure issues and energy efficiency providing such sessions as loss mitigation, housing counseling and going green. The Authority continues to market the interactive web tool This website contains free services to both landlords and tenants seeking to either list or find available affordable housing properties throughout the entire state. SCHousingSearch.com represents a tremendous opportunity to match landlords and tenants and offers a tool that is available without cost. To date, the Authority has partnered with various service providers, marketed to real estate investment clubs, realtors associations, and home builders associations. The web site is also promoted through newspapers and other media in an effort to educate the public about the resources and opportunities that SCHousingSearch.com has to offer. The Authority continues to enjoy positive relationships with the staff of many lending institutions as more rental and homeownership activities are undertaken. Discussions generally include program rules and restrictions, lending requirements, project development and resource maximization. Page 5
121 SOUTH CAROLINA STATE PJ Narrative Statement COMMUNITY HOUSING DEVELOPMENT ORGANIZATIONS (CHDOs) While the number of State-designated CHDOs is more than adequate, the State continues to foster and encourage CHDO participation. Each organization that inquires about receiving CHDO designation is sent an application package outlining the requirements for designation, acceptable forms of documentation, as well as program information specific to CHDOs. This application package and all forms are available on the Authority s at All potential CHDOs are invited to attend HOME- sponsored trainings conducted by technical assistance providers so that they have the opportunity to network with existing CHDOs. The State has designated over 75 CHDOs since the program s inception. The following list represents CHDOs that were designated or recertified for the State s 2011 HOME program. Allen Temple, CEDC Allendale County Alive, Inc. Benedict-Allen CDC Blackville CDC Brookland-West Columbia CHDC Camden First CDC Charleston Area CDC Clarendon County CDC Community Assistance Providers Community Dev. Improvement Corp. ECHO, Inc. Genesis Homes Grand Strand Housing Greenville Housing Futures Home Alliance, Inc Homes of Hope Jasper Neighbors United Low Country Hsg. & Econ. Dev. Found. Inc. Lowcountry Community Services, Inc. Metanoia Nehemiah Community Revitalization Neighborhood Hsg. Corp. of Greenville, Inc. New Covenant Community Center, Inc. P.A.S.T.O.R.S, Inc. Pickens County Habitat for Humanity Santee-Lynches Affordable Hsg. CDC Second Baptist CDC Southern Carolina Regional CDC, Inc. Southeastern Housing Foundation Spartanburg Housing Development Corp. Sumter County CDC Upstate Homeless Coalition of SC Most CHDOs, although in existence more than one year, have a great need for continuing technical assistance in the areas of managing the housing development process, strategic planning, financial underwriting and the financial management of their organizations. The State will continue to address these needs by working individually with CHDOs through various workshops and training. Page 6
122 SOUTH CAROLINA STATE PJ Narrative Statement AFFIRMATIVE MARKETING The State adopted the affirmative marketing procedures and requirements for HOMEassisted housing in accordance with the regulations at Affirmative marketing requirements are triggered when developments contain five (5) or more HOME-assisted units. These procedures outline actions required by owners, property managers, developers or grant administrators to ensure that information regarding HOMEassisted housing is provided and that eligible persons from all racial, ethnic and gender groups have access to these units. All projects funded by HOME require developers/owners to certify that their intentions are to comply with marketing efforts to attract all racial, ethnic and gender groups and not to discriminate against anyone. In addition, they are required to design and implement procedures that promote Fair Housing Laws and Equal Housing Opportunities (EHO) in all phases of the development. Developers/owners advertise their HOME award to announce potential housing opportunities associated with federal funds which are available in the various counties. All recipients are instructed to use the EHO logo on all Public Notice Ads advertising the award of funds to the project. Developers are further instructed to post Fair Housing Laws and EHO logos on construction signboards at the site. During construction and when projects are completed and leased up, the State monitors for compliance in these areas. Page 7
123 SOUTH CAROLINA STATE PJ Narrative Statement MINORITY OUTREACH The State continues to encourage recipients efforts in increasing minority outreach in the HOME program. The total dollar amount of construction contracts awarded to projects was $95,690,996 and of that amount there were a total of eleven (11) Section 3 businesses that received construction contracts totaling $4,656,652 or 4.9%. Under the non-construction category a total of $3,704,498 was awarded and of that amount $105,000 or 2.8% was awarded to Section 3 businesses. The Authority reports on the Minority Business Enterprises (MBE) or Women Business Enterprises (WBE) in October of every fiscal year to determine awards to these groups. While the State still does not have a large pool of minority and women-owned construction contractors, the State will continue to monitor the outreach efforts of recipients in this area. All recipients are required to maintain file documentation of their minority outreach efforts. In addition, the Authority requires all recipients to insert language, within the body of their marketing advertisements, encouraging minority and women-owned contractors to inquire about job opportunities. Some recipients have very few minority participants while others have several. The Authority requires outreach efforts to minority and women-owned businesses as well as all businesses to be: 1. Good faith, comprehensive and continuing endeavors; 2. Supported by a statement of public policy and commitment published in the print media of widest local circulation; 3. Supported by an office and/or a key ranking staff person with oversight responsibilities; and 4. Designed to utilize all available and appropriate public and private sector local resources. The Authority will continue to stress the importance of minority participation and make individual assessments as to the progress, or lack thereof, of each recipient. Page 8
124 SOUTH CAROLINA STATE PJ Narrative Statement SHORTFALL FUNDS This section is not applicable to the State. Page 9
125 SOUTH CAROLINA STATE PJ Narrative Statement RELOCATION All rental and homeownership recipients are given specific instructions on the relocation requirements at both the HOME Application and Implementation Workshops. Applicants who do not comply with the general notice requirements prior to the submission of their application are not considered for funding. All recipients are further directed to HUD's Handbook 1378, Tenant Assistance, Relocation and Real Property Acquisition, revised July 1992, for additional guidance. All recipients are instructed to take all reasonable steps to minimize displacement by: 1. Considering whether or not displacement will occur as a part of funding decisions and project feasibility determination. 2. Assuring, whenever possible, that residential occupants are offered an opportunity to return to buildings that are being rehabilitated. 3. Planning rehabilitation projects that allow tenants to remain in the unit (depending on the amount of rehabilitation work to be undertaken) to minimize displacement. 4. Following notification and advisory service procedures carefully to ensure that families do not move from the units simply because they are not informed about plans for the project or their rights. There were no relocations during this period. Page 10
126 SOUTH CAROLINA STATE PJ Narrative Statement MONITORING COMPLIANCE Each HOME rental project receives a minimum of three on site inspection visits and one initial monitoring visit during the two-year award period. Projects are visited at the start of the project; during construction, at project completion, at lease-up, and every year thereafter. At project completion, each recipient is sent the Initial Compliance Monitoring Rental Review Packet which the recipient must complete and submit to the Authority prior to the monitoring of the project. The Packet requires that information be submitted on the following: tenant income limits, maximum rent and utility standards, utility allowance certifications, maximum actual unit rent computations and a unit status report. Once this information is received and reviewed, an initial monitoring of the project is conducted. In addition, to the initial monitoring review, HOME rental projects are monitored throughout the affordability period in accordance with the HOME regulations, which is referred to as long term compliance monitoring. Once on site compliance monitoring reviews are completed (within 30 to 45 days), the Authority sends the recipients a monitoring review report/letter. The monitoring review report/letter may consist of noncompliance issues requiring corrective actions or recommendations for best practices. Recipients are given an appropriate time to cure all issues. A list of 2011 compliance monitoring reviews completed during this period can be found on pages Page 11
127 SOUTH CAROLINA STATE PJ Monitoring Compliance Report Project Name County #HOME Date of Monitoring Units Visit North Apartments Orangeburg 36 October 28, 2011 Boozer-North Project Lexington 9 November 4, 2011 Vance Street Project Greenville 6 September 26, 2011 Dogwood Townhouses Complex Bamberg 4 October 28, 2011 DMH Project-Homes Of Hope Inc. Greenville 11 November 7, 2011 Companion Foundation - Easley Pickens 4 October 18, 2011 Cypress Place Apartments Richland 22 September 23, 2011 Sumner Avenue Apartment Charleston 11 August 2, 2011 Balsam Place/Safe Place At the Beach Horry 25 December 5, 2011 Camden First-Campbell Street Kershaw 3 September 28, 2011 Starlight Village Darlington 5 September 29, 2011 Butterfly House Phase 2 Barnwell 4 November 30, 2011 South Boundary Street Barnwell 4 November 30, 2011 Main Street Townhomes Phase IV York 3 November 2, 2011 Greenline Commons Greenville 5 October 3, 2011 The Arbors Phase I Lexington 6 November 4, 2011 Main Street Townhomes Phase I York 6 November 2, 2011 The Arbors Phase II Lexington 6 November 4, 2011 Companion at Arlington Court Spartanburg 8 October 27, 2011 Main Street Townhomes Phase II York 10 November 2, 2011 Queen Street Project Greenville 10 November 17, 2011 Pines At Sunset Village Greenville 18 November 3, 2011 Green Street Plaza York 51 November 10, 2011 Companion at Windsor East Phase III Colleton 8 February 23, 2011 Companion at Windsor East Phase I Colleton 10 February 23, 2011 Companion at Windsor East Phase II Colleton 10 February 23, 2011 Reedy Place Apartments Greenville 11 May 5, 2011 Devonshire Apartments Georgetown 32 July 12, 2011 Canterbury House Charleston 46 November 1, 2011 Prestwick at August Street Greenville 13 April 22, 2011 Crowefield Greene Berkeley 10 August 9, 2011 The West Yards Lofts Charleston 30 June 2, 2011 Summerville Duplexes Dorchester 4 October 20, 2011 LRS Business Ventures Dillon 2 December 28, 2011 LRS Business Ventures Dillon 2 December 28, 2011 Joe Louis St. Homes York 2 July 13, 2011 Jackson Street Duplex Dillon 2 December 28, 2011 Betha Rentals Dillon 3 December 28, 2011 Draymont Ridge Phase III C Spartanburg 3 November 1, 2011 Ervin St. Quadraplex Florence 4 September 14, 2011 Draymont Ridge Phase III B Spartanburg 4 November 1, 2011 J&T Florence Duplex Project Florence 4 September 14, 2011 Page 12
128 SOUTH CAROLINA STATE PJ Monitoring Compliance Report Project Name County #HOME Date of Monitoring Units Visit North Avenue 4-Plex Lexington 4 July 28, 2011 Lincoln Circle Aiken 6 September 7, 2011 Wessinger Square Lexington 6 July 28, 2011 Antioch Housing Corp - Park Street Greenville 6 October 18, 2011 Bellwood Subdivision Clarendon 7 November 17, 2011 Pilgrim's Inn Apartments IV York 8 September 8, 2011 Companion at Summer Cove Phase V Lexington 8 July 29, 2011 Companion at Summer Cove Phase VI Lexington 8 July 29, 2011 Companion at Summer Cove Phase IV Lexington 8 July 29, 2011 Eagles Nest Phase II Greenwood 8 November 18, 2011 Burcan Development York 8 September 13, 2011 Draymont Ridge Development Ph III A Spartanburg 10 November 1, 2011 Leach St. Place Greenville 10 October 18, 2011 Buncombe Place Apartments Greenville 10 October 18, 2011 Draymont Ridge Development Ph I Spartanburg 11 November 1, 2011 Vincent Place Newberry 11 August 25, 2011 Phoenix Trace Apartments Greenville 12 October 18, 2011 Leaphart Place Lexington 12 July 27, 2011 Canal Apartments Beaufort 12 August 23, 2011 Gower Place Phase 1 Greenville 18 October 18, 2011 Burnside Manor I Laurens 21 September 15, 2011 Burnside Manor II Laurens September 15, 2011 Canal Apartments Phase II Beaufort 10 August 23, 2011 Villages at Horse Creek Aiken 7 February 2, 2011 Saluda Crossing Aiken 5 February 9, 2011 Villages At Horse Creek Senior Aiken 7 February 4, 2011 River Birch Apartments Chesterfield 3 January 19, 2011 Oak Terrace Apartments Chesterfield 5 January 21, 2011 Pecan Grove Apartments Darlington 6 June 29, 2011 Darlington Downtown Lofts Darlington 6 April 21, 2011 Hollybrook Edgefield 6 July 11, 2011 Brookstone Apartments Edgefield 10 January 27, 2011 Palmetto Frond Apartments Florence 6 April 22, 2011 Cambridge Court Florence 13 August 31, 2011 Lakota Crossing Florence 14 November 2, 2011 Bailey Gardens Apartments Florence 5 August 30, 2011 Swann Meadows Greenwood 11 August 5, 2011 Swansgate Apartments I Horry 7 April 6, 2011 Pipers Pointe Horry 14 November 9, 2011 Elmcreek Apartments (aka Swansea Apts) Lexington 8 January 31, 2011 Southern Forest Marion 8 September 2, 2011 Page 13
129 SOUTH CAROLINA STATE PJ Monitoring Compliance Report Project Name County #HOME Date of Monitoring Units Visit Pine Hill Apartments Orangeburg 14 February 18, 2011 Park West Pickens 12 August 3, 2011 Cedar Springs Place Spartanburg 10 March 1, 2011 Magnolia Park Apartments Williamsburg 5 March 11, 2011 Wilderness Cove Beaufort 10 October 20, 2011 Harbor Apartments Charleston 10 June 7, 2011 Shady Grove Charleston 14 October 28, King Street Apartments Charleston 8 August 3, 2011 Peachtree Apartments Cherokee 6 July 5, 2011 Iveywood Park II Cherokee 6 April 20, 2011 Iveywood Park II Cherokee 13 April 13, 2011 The McAliley Chester 4 February 28, 2011 Lakebrook Apartments Clarendon 8 April 28, 2011 Edisto Terrace Apartments Colleton 10 February 18, 2011 Middletown Apartments Darlington 8 June 20, 2011 Harmony Ridge Greenville 8 November 4, 2011 Blackwater Cove Horry 6 May 20, 2011 Morris Manor Horry 4 May 5, 2011 Heron Crossing Apartments Jasper 6 March 11, 2011 Deerfield Village Jasper 5 October 7, 2011 J Press Apartments Laurens 4 July 22, 2011 Fieldale Lee 6 July 25, 2011 Cedar Creek Apartments Marion 8 October 11, 2011 Culpepper Landing II Spartanburg 14 April 8, 2011 Spring Garden Apartments Sumter 6 September 1, 2011 Hickory Hollow Sumter 13 June 15, 2011 Fairforest II Union 4 June 13, 2011 Elm Square Williamsburg 5 January 21, 2011 Kings Square I Williamsburg 6 May 11, 2011 Colony West Apartments of Barnwell Barnwell 12 October 28, 2011 Williston Elderly Barnwell 5 June 8, 2011 SC Model Charleston 5 October 7, 2011 Autumn Run Apartments Darlington 8 July 21, 2011 Villages at Beaver Dam (Reel Drive) Edgefield 6 April 25, 2011 Brighton Ridge Apartments Edgefield 9 July 7, 2011 Sparrow Ridge Florence 5 May 5, 2011 Mauldin Gardens Apartments Greenville 13 October 17, 2011 Raintree Apartments Greenville 7 September 15, 2011 Bridle Ridge Apartments Kershaw 8 October 25, 2011 Anderson Center Apartments Marion 4 April 7, 2011 Timberland Crossing Pickens 14 September 20, 2011 Companion at Walnut Hill Pickens 8 September 7, 2011 Page 14
130 SOUTH CAROLINA STATE PJ Monitoring Compliance Report Project Name County #HOME Date of Monitoring Units Visit Avery Lakes Apartments York 10 April 11, 2011 Forrest Brook York 11 August 17, 2011 Laurel Hill Beaufort 14 October 11, 2011 Carriage 123 Club Apartments Beaufort 10 May 25, 2011 Simmons Townhomes Beaufort 8 April 6, 2011 Seven Farms Apartments Berkeley 14 March 16, 2011 Rutledge Place Charleston 8 April 28, 2011 Grand Oaks Apartments Charleston 12 April 27, 2011 The Shires Apartments Charleston 14 November 8, 2011 Nunan Street Apartments Charleston 4 October 7, 2011 Chester Townhouses Phase I Chester 12 March 8, 2011 Chester Townhouses Phase II Chester 10 March 10, 2011 Cedar Key Dorchester 10 February 8, 2011 Vintage Gardens Edgefield 14 March Crane Creek Horry 11 August 5, 2011 Camden Cove Kershaw 6 March 2, 2011 Ashwood Pointe Lee 8 January 25, 2011 Fern Hall Crossing Lexington 10 January 13, 2011 Bennettsville Lofts Marlboro 11 February 28, 2011 Newberry Senior Housing Newberry 7 October 18, 2011 Mason Manor (Spartanburg Elderly) Spartanburg 19 February 9, 2011 Wellington Square York 8 November 10, 2011 Phoenix Place Apartments Greenwood 20 November 4, 2011 Prestwick at Augusta Street Greenville 10 April 22, 2011 Orchard Park Apartments Saluda 4 August 17, 2011 Allendale Manor Allendale 5 August 4, 2011 The Falls Chester 2 August 3, 2011 Miller Grove Apartments Lancaster 10 July 19, 2011 Parr Place (South Main Street Apts) Lancaster 3 July 21, Dillon Apartments Beaufort 10 November 8, 2011 The Manor Apartments Lancaster 3 July 22, 2011 New York Townhouses York 9 August 30, 2011 Voorhees-Denmark CDC Bamberg 5 January 12, 2012 Bethea Apartments Dillon 2 January 13, 2012 Bethea Apartments Dillon 2 January 13, 2012 Genesis Homes-Chicora Greenville 4 January 19, 2012 Old Woodruff Rd. Apts. Greenville 20 January 19, 2012 Millwood Estates Marion 6 May 11, 2012 Victor Village II Spartanburg 14 January 19, 2012 Edgewood Apartments Orangeburg 14 January 26, 2012 Coit Village Florence 12 March 20, 2012 Page 15
131 SOUTH CAROLINA STATE PJ Monitoring Compliance Report Project Name County #HOME Date of Monitoring Units Visit Ridgeview Manor Apartments Aiken 18 January 19, 2012 Palmetto Ridge Estates Florence 11 March 21, 2012 Fountain Hills II Laurens 6 April 26, 2012 Saluda Crossing Aiken 5 February 10, 2012 Hollybrook Edgefield 6 March 21, 2012 Pine Hill Apartments Orangeburg 14 January 27, 2012 Fern Hall Crossing Lexington 10 January 18, 2012 Magnolia Park Apartments Williamsburg 5 May 22, 2012 River Birch Apartments Chesterfield 3 January 25, 2012 Oak Terrace Apartments Chesterfield 5 January 24, 2012 Cedar Springs Place Spartanburg 10 April 20, 2012 Swansgate Apartments I Horry 7 April 3, 2012 Middletown Apartments Darlington 8 February 3, 2012 Elmcreek Apartments (aka Swansea Apts) Lexington 8 January 17, 2012 Cedar Creek Apartments Marion 8 February 7, 2012 Hope Harbor Williamsburg 4 May 2, 2012 Hampton Chase Orangeburg 13 April 6, 2012 Hartsville Garden Apartments Darlington 14 March 2, 2012 Blackwater Cove Horry 6 February 15, 2012 Morris Manor Horry 4 February 14, 2012 Elm Square Williamsburg 5 May 15, 2012 Kings Square I Williamsburg 6 April 13,2012 Hickory Hollow Sumter 13 May 29, 2012 Lakebrook Apartments Clarendon 8 March 29, 2012 J Press Apartments Laurens 4 March 12, 2012 Hunters Blind Abbeville 5 February 14, 2012 Pebble Creek Lexington 10 January 31, 2012 Bennettsville Lofts Marlboro 11 February 8, 2012 Cedar Key Dorchester 10 April 11, 2012 Camden Cove Kershaw 6 February 7, 2012 Chester Townhouses Phase I Chester 12 May 3, 2012 Chester Townhouses Phase II Chester 10 May 3, 2012 Brookstone Apartments Edgefield 10 February 21, 2012 Vintage Gardens Edgefield 14 January 12, 2012 Ashwood Pointe Lee 8 January 19,2012 Avery Lakes Apartments York 10 February 28, 2012 The McAliley Chester 4 May 24, 2012 Sparrow Ridge Florence 5 February 13, 2012 Page 16
132 SOUTH CAROLINA STATE PJ Narrative Statement PROGRAM INCOME FUNDS As described in the 2011 HOME Action Plan, the State allocated Program Income to the Authority s Single Family Mortgage Revenue Bond (MRB) program as well as to the Authority s Rental Assistance Voucher Program. The MRB program is the flagship program offered by the Authority. The sale of tax-exempt bonds to investors provides the bulk of the funding available to qualified beneficiaries. Like all of the Authority s homeownership programs, persons purchasing homes under the MRB program must meet minimum credit standards, as well as income and purchase price restrictions which vary by county. HOME PI provides down payment and closing cost assistance as five year deferred forgivable loans in an amount up to $5,000. In addition, to direct assist through down payment and closing costs, rental assistance (TBRA) is provided to the Authority s Rental Assistance Voucher Program. For these two activities a total of $981,062 was expended in HOME PI which produced a total of 397 affordable housing units. Of those units, 198 units/households were provided with down payment and closing cost assistance in the form of deferred forgivable loans and 199 units/households were provided with rental assistance. Page 17
133 Appendix A 2011 HOME Project Awards Dollars and Units (Includes all HOME activities) Oconee Pickens Units=3 $42,000 Greenville Units=35 $1,610,703 Spartanburg Cherokee Union York Units=35 $175,000 Chester Lancaster Chesterfield Marlboro Anderson Units=6 $337,378 Abbeville McCormick Laurens Greenwood Edgefield Newberry Units=4 $180,000 Saluda Aiken Units=10 $620,000 Richland Units=15 Lexington $800,000 Units=12 $800,000 Barnwell Fairfield Allendale Kershaw Calhoun Orangeburg Bamberg Lee Sumter Units=10 $650,000 Clarendon Units=12 $90,000 Dorchester Colleton Darlington Florence Williamsburg Berkeley Units=35 $1,598,452 Dillon Marion Georgetown Units=12 $390,000 Horry Hampton Charleston Units=11 $48,453 Jasper Beaufort Units=4 $247,895
134 Appendix B HOME Match Report Part I Participant Identification U.S. Department of Housing and Urban Development Office of Community Planning & Development Match Contribution for Federal Fiscal Year (yyyy) 1. Participant No. (Assigned by HUD) 2. Name of the Participating Jurisdiction 3. Name of Contact (person completing the report) 5. Street Address of the Participating Jurisdiction 4. Contact's Phone Number (Include area code) 6. City 7. State 8. Zip Code Columbia SC Part II Fiscal Year Summary 1. Excess match from prior Federal fiscal year 2. Match Contributed during current Federal fiscal year (see Part III.9.) 3. Total match available for current Federal fiscal year (line 1+ line 2) 4. Match liability for current Federal fiscal year 5. Excess match carried over to next Federal fiscal year (line 3 minus line 4) Part III Match Contribution for the Federal Fiscal Year 1. Project No. or Other ID M11-SG C Outlet Pointe Blvd 2. Date of Contribution (mm/dd/yyyy) South Carolina State Housing Finance & Development Authority 3. Cash (non-federal sources) 4. Foregone Taxes, Fees, Charges 5. Appraised Land/Real Property Required Infrastructure 943, $2,189,734 OMB Approval No (exp. (8/31/2009) $3,132, $2,981, $151, page 1 of 4 pages form HUD A (12/94) 7. Site Preparation, Construction Materials, Donated Labor 8. Bond Financing 9. Total Match /16/2001 $37, $37, /16/2001 $37, $37, /8/2000 $167, $167, /17/2001 $53, $53, /17/2001 $26, $26, /11/2001 $6, $6, /16/2001 $24, $24, /16/2001 $44, $44, /16/2001 $77, $77, /17/2001 $360, $360, /20/2001 $41, $41, /11/2001 $33, $33, /7/2001 $136, $136, /12/2001 $36, $36, /11/2001 $22, $22, /11/2001 $300, $300, /17/2001 $300, $300, /11/2001 $183, $183, /11/2001 $300, $300, Subtotal $2,189, $ Fran D. Ellington (803)
135
136
137 SECTION V HOPWA PROGRAM NARRATIVE SECTION V - HOPWA PROGRAM NARRATIVE 2011 State of South Carolina Consolidated Annual Performance & Evaluation Report Section V-HOPWA Program Year: April 1, 2011 March 31, 2012
 The CAPER report for HOPWA formula grantees provides annual information on program accomplishments that supports program evaluation and the ability to measure program")
138 Housing Opportunities for Persons with AIDS (HOPWA) Program Consolidated Annual Performance and Evaluation Report (CAPER) Measuring Performance Outcomes Final Released 1/12/12 OMB Number (Expiration Date: 10/31/2014) The CAPER report for HOPWA formula grantees provides annual information on program accomplishments that supports program evaluation and the ability to measure program beneficiary outcomes as related to: maintain housing stability; prevent homelessness; and improve access to care and support. This information is also covered under the Consolidated Plan Management Process (CPMP) report and includes Narrative Responses and Performance Charts required under the Consolidated Planning regulations. The public reporting burden for the collection of information is estimated to average 42 hours per manual response, or less if an automated data collection and retrieval system is in use, along with 60 hours for record keeping, including the time for reviewing instructions, searching existing data sources, gathering and maintaining the data needed, and completing and reviewing the collection of information. Grantees are required to report on the activities undertaken only, thus there may be components of these reporting requirements that may not be applicable. This agency may not conduct or sponsor, and a person is not required to respond to a collection of information unless that collection displays a valid OMB control number. Previous editions are obsolete form HUD D (Expiration Date: 10/31/2014)
139 Overview. The Consolidated Annual Performance and Evaluation Report (CAPER) provides annual performance reporting on client outputs and outcomes that enables an assessment of grantee performance in achieving the housing stability outcome measure. The CAPER, in conjunction with the Integrated Disbursement Information System (IDIS), fulfills statutory and regulatory program reporting requirements and provides the grantee and HUD with the necessary information to assess the overall program performance and accomplishments against planned goals and objectives. HOPWA formula grantees are required to submit a CAPER, and complete annual performance information for all activities undertaken during each program year in the IDIS, demonstrating coordination with other Consolidated Plan resources. HUD uses the CAPER and IDIS data to obtain essential information on grant activities, project sponsors, Subrecipient organizations, housing sites, units and households, and beneficiaries (which includes racial and ethnic data on program participants). The Consolidated Plan Management Process tool (CPMP) provides an optional tool to integrate the reporting of HOPWA specific activities with other planning and reporting on Consolidated Plan activities. Table of Contents PART 1: Grantee Executive Summary 1. Grantee Information 2. Project Sponsor Information 3. Administrative Subrecipient Information 4. Program Subrecipient Information 5. Grantee Narrative and Performance Assessment a. Grantee and Community Overview b. Annual Performance under the Action Plan c. Barriers or Trends Overview d. Assessment of Unmet Housing Needs PART 2: Sources of Leveraging and Program Income 1. Sources of Leveraging 2. Program Income and Resident Rent Payments PART 3: Accomplishment Data: Planned Goals and Actual Outputs PART 4: Summary of Performance Outcomes 1. Housing Stability: Permanent Housing and Related Facilities 2. Prevention of Homelessness: Short-Term Housing Payments 3. Access to Care and Support: Housing Subsidy Assistance with Supportive Services PART 5: Worksheet - Determining Housing Stability Outcomes PART 6: Annual Certification of Continued Use for HOPWA Facility- Based Stewardship Units (Only) PART 7: Summary Overview of Grant Activities A. Information on Individuals, Beneficiaries and Households Receiving HOPWA Housing Subsidy Assistance (TBRA, STRMU, PHP,Facility Based Units, Master Leased Units ONLY) B. Facility-Based Housing Assistance Assistance, Housing Relocation & Stabilization Services, Employment, Education, General Health Status,, Pregnancy Status, Reasons for Leaving, Veteran s Information, and Children s Education. Other HOPWA projects sponsors may also benefit from collecting these data elements. Final Assembly of Report. After the entire report is assembled, please number each page sequentially. Filing Requirements. Within 90 days of the completion of each program year, grantees must submit their completed CAPER to the CPD Director in the grantee s State or Local HUD Field Office, and to the HOPWA Program Office: at HOPWA@hud.gov. Electronic submission to HOPWA Program office is preferred; however, if electronic submission is not possible, hard copies can be mailed to: Office of HIV/AIDS Housing, Room 7212, U.S. Department of Housing and Urban Development, 451 Seventh Street, SW, Washington, D.C. Record Keeping. Names and other individual information must be kept confidential, as required by 24 CFR However, HUD reserves the right to review the information used to complete this report for grants management oversight purposes, except for recording any names and other identifying information. In the case that HUD must review client level data, no client names or identifying information will be retained or recorded. Information is reported in aggregate to HUD without personal identification. Do not submit client or personal information in data systems to HUD. Definitions Adjustment for Duplication: Enables the calculation of unduplicated output totals by accounting for the total number of households or units that received more than one type of HOPWA assistance in a given service category such as HOPWA Subsidy Assistance or Supportive Services. For example, if a client household received both TBRA and STRMU during the operating year, report that household in the category of HOPWA Housing Subsidy Assistance in Part 3, Chart 1, Column [1b] in the following manner: HOPWA Housing Subsidy Assistance [1] Outputs: Number of Households 1. Tenant-Based Rental Assistance 1 2a. 2b. Permanent Housing Facilities: Received Operating Subsidies/Leased units Transitional/Short-term Facilities: Received Operating Subsidies Continued Use Periods. Grantees that received HOPWA funding for new construction, acquisition, or substantial rehabilitations are required to operate their facilities for HOPWA-eligible beneficiaries for a ten (10) years period. If no further HOPWA funds are used to support the facility, in place of completing Section 7B of the CAPER, the grantee must submit an Annual Certification of Continued Project Operation throughout the required use periods. This certification is included in Part 6 in CAPER. The required use period is three (3) years if the rehabilitation is non-substantial. In connection with the development of the Department s standards for Homeless Management Information Systems (HMIS), universal data elements are being collected for clients of HOPWA-funded homeless assistance projects. These project sponsor/subrecipient records would include: Name, Social Security Number, Date of Birth, Ethnicity and Race, Gender, Veteran Status, Disabling Conditions, Residence Prior to Program Entry, Zip Code of Last Permanent Address, Housing Status, Program Entry Date, Program Exit Date, Personal Identification Number, and Household Identification Number. These are intended to match the elements under HMIS. The HOPWA program-level data elements include: Income and Sources, Non-Cash Benefits, HIV/AIDS Status, Services Provided, and Housing Status or Destination at the end of the operating year. Other suggested but optional elements are: Physical Disability, Developmental Disability, Chronic Health Condition, Mental Health, Substance Abuse, Domestic Violence, Date of Contact, Date of Engagement, Financial 3a. 3b Permanent Housing Facilities: Capital Development Projects placed in service during the operating year Transitional/Short-term Facilities: Capital Development Projects placed in service during the operating year Short-term Rent, Mortgage, and Utility Assistance 1 Adjustment for duplication (subtract) 1 TOTAL Housing Subsidy Assistance (Sum of Rows 1-4 minus 1 Row 5) Previous editions are obsolete Page i form HUD D (Expiration Date: 10/31/2014)
140 Administrative Costs: Costs for general management, oversight, coordination, evaluation, and reporting. By statute, grantee administrative costs are limited to 3% of total grant award, to be expended over the life of the grant. Project sponsor administrative costs are limited to 7% of the portion of the grant amount they receive. Beneficiary(ies): All members of a household who received HOPWA assistance during the operating year including the one individual who qualified the household for HOPWA assistance as well as any other members of the household (with or without HIV) who benefitted from the assistance. Central Contractor Registration (CCR): The primary registrant database for the U.S. Federal Government. CCR collects, validates, stores, and disseminates data in support of agency acquisition missions, including Federal agency contract and assistance awards. Both current and potential federal government registrants (grantees) are required to register in CCR in order to be awarded contracts by the federal government. Registrants must update or renew their registration at least once per year to maintain an active status. Although recipients of direct federal contracts and grant awards have been required to be registered with CCR since 2003, this requirement is now being extended to indirect recipients of federal funds with the passage of ARRA (American Recovery and Reinvestment Act). Per ARRA and FFATA (Federal Funding Accountability and Transparency Act) federal regulations, all grantees and sub-grantees or subcontractors receiving federal grant awards or contracts must have a DUNS (Data Universal Numbering System) Number. Chronically Homeless Person: An individual or family who : (i) is homeless and lives or resides individual or family who: (i) Is homeless and lives or resides in a place not meant for human habitation, a safe haven, or in an emergency shelter; (ii) has been homeless and living or residing in a place not meant for human habitation, a safe haven, or in an emergency shelter continuously for at least 1 year or on at least 4 separate occasions in the last 3 years; and (iii) has an adult head of household (or a minor head of household if no adult is present in the household) with a diagnosable substance use disorder, serious mental illness, developmental disability (as defined in section 102 of the Developmental Disabilities Assistance and Bill of Rights Act of 2000 (42 U.S.C )), post traumatic stress disorder, cognitive impairments resulting from a brain injury, or chronic physical illness or disability, including the co-occurrence of 2 or more of those conditions. Additionally, the statutory definition includes as chronically homeless a person who currently lives or resides in an institutional care facility, including a jail, substance abuse or mental health treatment facility, hospital or other similar facility, and has resided there for fewer than 90 days if such person met the other criteria for homeless prior to entering that facility. (See 42 U.S.C (2))This does not include doubled-up or overcrowding situations. grassroots. HOPWA Eligible Individual: The one (1) low-income person with HIV/AIDS who qualifies a household for HOPWA assistance. This person may be considered Head of Household. When the CAPER asks for information on eligible individuals, report on this individual person only. Where there is more than one person with HIV/AIDS in the household, the additional PWH/A(s), would be considered a beneficiary(s). HOPWA Housing Information Services: Services dedicated to helping persons living with HIV/AIDS and their families to identify, locate, and acquire housing. This may also include fair housing counseling for eligible persons who may encounter discrimination based on race, color, religion, sex, age, national origin, familial status, or handicap/disability.. HOPWA Housing Subsidy Assistance Total: The unduplicated number of households receiving housing subsidies (TBRA, STRMU, Permanent Housing Placement services and Master Leasing) and/or residing in units of facilities dedicated to persons living with HIV/AIDS and their families and supported with HOPWA funds during the operating year. Household: A single individual or a family composed of two or more persons for which household incomes are used to determine eligibility and for calculation of the resident rent payment. The term is used for collecting data on changes in income, changes in access to services, receipt of housing information services, and outcomes on achieving housing stability. Live-In Aides (see definition for Live-In Aide) and nonbeneficiaries (e.g. a shared housing arrangement with a roommate) who resided in the unit are not reported on in the CAPER. Housing Stability: The degree to which the HOPWA project assisted beneficiaries to remain in stable housing during the operating year. See Part 5: Determining Housing Stability Outcomes for definitions of stable and unstable housing situations. In-kind Leveraged Resources: These involve additional types of support provided to assist HOPWA beneficiaries such as volunteer services, materials, use of equipment and building space. The actual value of the support can be the contribution of professional services, based on customary rates for this specialized support, or actual costs contributed from other leveraged resources. In determining a rate for the contribution of volunteer time and services, use the rate established in HUD notices, such as the rate of ten dollars per hour. The value of any donated material, equipment, building, or lease should be based on the fair market value at time of donation. Related documentation can be from recent bills of sales, advertised prices, appraisals, or other information for comparable property similarly situated. Disabling Condition: Evidencing a diagnosable substance use disorder, serious mental illness, developmental disability, chronic physical illness, or disability, including the co-occurrence of two or more of these conditions. In addition, a disabling condition may limit an individual s ability to work or perform one or more activities of daily living. An HIV/AIDS diagnosis is considered a disabling condition. Facility-Based Housing Assistance: All eligible HOPWA Housing expenditures for or associated with supporting facilities including community residences, SRO dwellings, short-term facilities, project-based rental units, master leased units, and other housing facilities approved by HUD. Faith-Based Organization: Religious organizations of three types: (1) congregations; (2) national networks, which include national denominations, their social service arms (for example, Catholic Charities, Lutheran Social Services), and networks of related organizations (such as YMCA and YWCA); and (3) freestanding religious organizations, which are incorporated separately from congregations and national networks. Grassroots Organization: An organization headquartered in the local community where it provides services; has a social services budget of $300,000 or less annually, and six or fewer full-time equivalent employees. Local affiliates of national organizations are not considered Leveraged Funds: The amount of funds expended during the operating year from non-hopwa federal, state, local, and private sources by grantees or sponsors in dedicating assistance to this client population. Leveraged funds or other assistance are used directly in or in support of HOPWA program delivery. Live-In Aide: A person who resides with the HOPWA Eligible Individual and who meets the following criteria: (1) is essential to the care and wellbeing of the person; (2) is not obligated for the support of the person; and (3) would not be living in the unit except to provide the necessary supportive services. See the Code of Federal Regulations Title 24, Part and the HOPWA Grantee Oversight Resource Guide for additional reference. Master Leasing: Applies to a nonprofit or public agency that leases units of housing (scattered-sites or entire buildings) from a landlord, and subleases the units to homeless or low-income tenants. By assuming the tenancy burden, the agency facilitates housing of clients who may not be able to maintain a lease on their own due to poor credit, evictions, or lack of sufficient income. Operating Costs: Applies to facility-based housing only, for facilities that are currently open. Operating costs can include day-to-day housing Previous editions are obsolete Page ii form HUD D (Expiration Date: 10/31/2014)
141 function and operation costs like utilities, maintenance, equipment, insurance, security, furnishings, supplies and salary for staff costs directly related to the housing project but not staff costs for delivering services. Outcome: The degree to which the HOPWA assisted household has been enabled to establish or maintain a stable living environment in housing that is safe, decent, and sanitary, (per the regulations at 24 CFR (b)) and to reduce the risks of homelessness, and improve access to HIV treatment and other health care and support. Output: The number of units of housing or households that receive HOPWA assistance during the operating year. Permanent Housing Placement: A supportive housing service that helps establish the household in the housing unit, including but not limited to reasonable costs for security deposits not to exceed two months of rent costs. Program Income: Gross income directly generated from the use of HOPWA funds, including repayments. See grant administration requirements on program income for state and local governments at 24 CFR 85.25, or for non-profits at 24 CFR Project-Based Rental Assistance (PBRA): A rental subsidy program that is tied to specific facilities or units owned or controlled by a project sponsor or Subrecipient. Assistance is tied directly to the properties and is not portable or transferable. Subrecipient Organization: Any organization that receives funds from a project sponsor to provide eligible housing and other support services and/or administrative services as defined in 24 CFR If a subrecipient organization provides housing and/or other supportive services directly to clients, the subrecipient organization must provide performance data on household served and funds expended. Funding flows to subrecipients as follows: HUD Funding Grantee Project Sponsor Subrecipient Tenant-Based Rental Assistance (TBRA): TBRA is a rental subsidy program similar to the Housing Choice Voucher program that grantees can provide to help low-income households access affordable housing. The TBRA voucher is not tied to a specific unit, so tenants may move to a different unit without losing their assistance, subject to individual program rules. The subsidy amount is determined in part based on household income and rental costs associated with the tenant s lease. Transgender: Transgender is defined as a person who identifies with, or presents as, a gender that is different from his/her gender at birth. Veteran: A veteran is someone who has served on active duty in the Armed Forces of the United States. This does not include inactive military reserves or the National Guard unless the person was called up to active duty. Project Sponsor Organizations: Any nonprofit organization or governmental housing agency that receives funds under a contract with the grantee to provide eligible housing and other support services or administrative services as defined in 24 CFR Project Sponsor organizations are required to provide performance data on households served and funds expended. Funding flows to a project sponsor as follows: HUD Funding Grantee Project Sponsor Short-Term Rent, Mortgage, and Utility (STRMU) Assistance: A time-limited, housing subsidy assistance designed to prevent homelessness and increase housing stability. Grantees may provide assistance for up to 21 weeks in any 52 week period. The amount of assistance varies per client depending on funds available, tenant need and program guidelines. Stewardship Units: Units developed with HOPWA, where HOPWA funds were used for acquisition, new construction and rehabilitation that no longer receive operating subsidies from HOPWA. Report information for the units is subject to the three-year use agreement if rehabilitation is non-substantial and to the ten-year use agreement if rehabilitation is substantial. Previous editions are obsolete Page iii form HUD D (Expiration Date: 10/31/2014)
142 Transgender: Transgender is defined as a person who identifies with, or presents as, a gender that is different from his/her gender at birth. Housing Opportunities for Person with AIDS (HOPWA) Consolidated Annual Performance and Evaluation Report (CAPER) Measuring Performance Outputs and Outcomes OMB Number (Expiration Date: 10/31/2014) Part 1: Grantee Executive Summary As applicable, complete the charts below to provide more detailed information about the agencies and organizations responsible for the administration and implementation of the HOPWA program. Chart 1 requests general Grantee Information and Chart 2 is to be completed for each organization selected or designated as a project sponsor, as defined by CFR In Chart 3, indicate each subrecipient organization with a contract/agreement of $25,000 or greater that assists grantees or project sponsors carrying out their administrative or evaluation activities. In Chart 4, indicate each subrecipient organization with a contract/agreement to provide HOPWA-funded services to client households. These elements address requirements in the Federal Funding and Accountability and Transparency Act of 2006 (Public Law ). Note: Please see the definition section for distinctions between project sponsor and subrecipient. Note: If any information does not apply to your organization, please enter N/A. Do not leave any section blank. 1. Grantee Information HUD Grant Number SCH09-F999, SCH10-F999, SCH11-F999 Operating Year for this report From (mm/dd/yy) 04/01/2011 To (mm/dd/yy) 03/31/2012 Grantee Name Soutt Carolina Department of Health and Environmental Control Business Address Mill/Jarrett Complex, STD/HIV Division, Box City, County, State, Zip Columbia Richland SC Employer Identification Number (EIN) or Tax Identification Number (TIN) DUN & Bradstreet Number (DUNs): Central Contractor Registration (CCR): Is the grantee s CCR status currently active? Yes No If yes, provide CCR Number: *Congressional District of Grantee s Business Address *Congressional District of Primary Service Area(s) *City(ies) and County(ies) of Primary Service Area(s) Organization s Website Address 6 Cities: Counties: Is there a waiting list(s) for HOPWA Housing Subsidy Assistance Services in the Grantee service Area? Yes No If yes, explain in the narrative section what services maintain a waiting list and how this list is administered. * Service delivery area information only needed for program activities being directly carried out by the grantee. Previous editions are obsolete Page 1 form HUD D (Expiration Date: 10/31/2014)
143 2. Project Sponsor Information Please complete Chart 2 for each organization designated or selected to serve as a project sponsor, as defined by CFR Use this section to report on organizations involved in the direct delivery of services for client households. These elements address requirements in the Federal Financial Accountability and Transparency Act of 2006 (Public Law ). Note: Please see the definitions for distinctions between project sponsor and subrecipient. Note: If any information does not apply to your organization, please enter N/A. Project Sponsor Agency Name Parent Company Name, if applicable The Cooperative Ministry Name and Title of Contact at Project Sponsor Agency Address Business Address Ann Derrick, Director of Health Programs aderrick@coopmin.org 3821 West Beltline City, County, State, Zip, Columbia, Richland, SC Phone Number (with area code) Employer Identification Number (EIN) or Tax Identification Number (TIN) DUN & Bradstreet Number (DUNs): Fax Number (with area code) Congressional District of Project Sponsor s Business Address 6 Congressional District(s) of Primary Service Area(s) City(ies) and County(ies) of Primary Service Area(s) Total HOPWA contract amount for this Organization for the operating year Organization s Website Address 5,6 Cities: All cities within 4 county area: Clarendon, Lee, Newberry, Sumter $40,221 Counties: Clarendon, Lee, Newberry, Sumter Is the sponsor a nonprofit organization? Yes No Please check if yes and a faith-based organization. Please check if yes and a grassroots organization. Does your organization maintain a waiting list? Yes No If yes, explain in the narrative section how this list is administered. Previous editions are obsolete Page 2 form HUD D (Expiration Date: 10/31/2014)
144 2. Project Sponsor Information Please complete Chart 2 for each organization designated or selected to serve as a project sponsor, as defined by CFR Use this section to report on organizations involved in the direct delivery of services for client households. These elements address requirements in the Federal Financial Accountability and Transparency Act of 2006 (Public Law ). Note: Please see the definitions for distinctions between project sponsor and subrecipient. Note: If any information does not apply to your organization, please enter N/A. Project Sponsor Agency Name Parent Company Name, if applicable AID Upstate Name and Title of Contact at Project Sponsor Agency Address B. Andrew Hall, Executive Director Andy.hall@aidupstate.org Business Address PO box 105 City, County, State, Zip, Greenville, Greenville County, SC Phone Number (with area code) Employer Identification Number (EIN) or Tax Identification Number (TIN) DUN & Bradstreet Number (DUNs): Fax Number (with area code) Congressional District of Project Sponsor s Business Address 4 Congressional District(s) of Primary Service Area(s) City(ies) and County(ies) of Primary Service Area(s) Total HOPWA contract amount for this Organization for the operating year Organization s Website Address 3,4 Cities: All cities within 4 county area: Anderson, Greenville, Oconee, Pickens $340,750 Counties: Anderson, Greenville, Oconee, Pickens Is the sponsor a nonprofit organization? Yes No Please check if yes and a faith-based organization. Please check if yes and a grassroots organization. Does your organization maintain a waiting list? Yes No If yes, explain in the narrative section how this list is administered. Previous editions are obsolete Page 3 form HUD D (Expiration Date: 10/31/2014)
145 2. Project Sponsor Information Please complete Chart 2 for each organization designated or selected to serve as a project sponsor, as defined by CFR Use this section to report on organizations involved in the direct delivery of services for client households. These elements address requirements in the Federal Financial Accountability and Transparency Act of 2006 (Public Law ). Note: Please see the definitions for distinctions between project sponsor and subrecipient. Note: If any information does not apply to your organization, please enter N/A. Project Sponsor Agency Name Parent Company Name, if applicable Upper Savannah Care Services Name and Title of Contact at Project Sponsor Agency Address Taisha Williams taishawilliams@usccgleams.org Business Address 322 Main Street Suite 302 City, County, State, Zip, Greenwood, Greenwood, SC Phone Number (with area code) Employer Identification Number (EIN) or Tax Identification Number (TIN) DUN & Bradstreet Number (DUNs): Congressional District of Project Sponsor s 3 Business Address Fax Number (with area code) Congressional District(s) of Primary Service Area(s) City(ies) and County(ies) of Primary Service Area(s) Total HOPWA contract amount for this Organization for the operating year Organization s Website Address 3 Cities: All cities within 4 county area: Abbeville, Greenwood, Laurens, McCormick $49,632 Counties: Abbeville, Greenwood, Laurens, McCormick Is the sponsor a nonprofit organization? Yes No Please check if yes and a faith-based organization. Please check if yes and a grassroots organization. Does your organization maintain a waiting list? Yes No If yes, explain in the narrative section how this list is administered. Previous editions are obsolete Page 4 form HUD D (Expiration Date: 10/31/2014)
146 2. Project Sponsor Information Please complete Chart 2 for each organization designated or selected to serve as a project sponsor, as defined by CFR Use this section to report on organizations involved in the direct delivery of services for client households. These elements address requirements in the Federal Financial Accountability and Transparency Act of 2006 (Public Law ). Note: Please see the definitions for distinctions between project sponsor and subrecipient. Note: If any information does not apply to your organization, please enter N/A. Project Sponsor Agency Name Hope Health Edisto Name and Title of Contact at Project Sponsor Agency Address Business Address Parent Company Name, if applicable Hope Health, Inc. Amber Maley, Case Management Supervisor amber@hope-health.org 1857 Joe S Jeffords Hwy City, County, State, Zip, Orangeburg, Orangeburg, SC Phone Number (with area code) Employer Identification Number (EIN) or Tax Identification Number (TIN) DUN & Bradstreet Number (DUNs): Fax Number (with area code) Congressional District of Project Sponsor s Business Address 6 Congressional District(s) of Primary Service Area(s) City(ies) and County(ies) of Primary Service Area(s) Total HOPWA contract amount for this Organization for the operating year Organization s Website Address 6 Cities: All cities within 2 county area: Orangeburg, Bamberg $76,405 Counties: Orangeburg, Bamberg Is the sponsor a nonprofit organization? Yes No Please check if yes and a faith-based organization. Please check if yes and a grassroots organization. Does your organization maintain a waiting list? Yes No If yes, explain in the narrative section how this list is administered. Previous editions are obsolete Page 5 form HUD D (Expiration Date: 10/31/2014)
147 2. Project Sponsor Information Please complete Chart 2 for each organization designated or selected to serve as a project sponsor, as defined by CFR Use this section to report on organizations involved in the direct delivery of services for client households. These elements address requirements in the Federal Financial Accountability and Transparency Act of 2006 (Public Law ). Note: Please see the definitions for distinctions between project sponsor and subrecipient. Note: If any information does not apply to your organization, please enter N/A. Project Sponsor Agency Name Parent Company Name, if applicable Hope Health, Inc Name and Title of Contact at Project Sponsor Agency Address Business Address Mulamba Lunda, Director of Program Services mulamba@hope-health.org 600 E. Palmetto Street City, County, State, Zip, Florence, Florence, SC Phone Number (with area code) Employer Identification Number (EIN) or Tax Identification Number (TIN) DUN & Bradstreet Number (DUNs): Fax Number (with area code) Congressional District of Project Sponsor s Business Address 6 Congressional District(s) of Primary Service Area(s) City(ies) and County(ies) of Primary Service Area(s) Total HOPWA contract amount for this Organization for the operating year Organization s Website Address 5,6 Cities: All cities within 6 county area: Chesterfield, Darlington, Dillon, Florence, Marion, Marlboro $159,570 Counties: Chesterfield, Darlington, Dillon, Florence, Marion, Marlboro Is the sponsor a nonprofit organization? Yes No Please check if yes and a faith-based organization. Please check if yes and a grassroots organization. Does your organization maintain a waiting list? Yes No If yes, explain in the narrative section how this list is administered. Previous editions are obsolete Page 6 form HUD D (Expiration Date: 10/31/2014)
148 2. Project Sponsor Information Please complete Chart 2 for each organization designated or selected to serve as a project sponsor, as defined by CFR Use this section to report on organizations involved in the direct delivery of services for client households. These elements address requirements in the Federal Financial Accountability and Transparency Act of 2006 (Public Law ). Note: Please see the definitions for distinctions between project sponsor and subrecipient. Note: If any information does not apply to your organization, please enter N/A. Project Sponsor Agency Name Hope Health Lower Savannah Name and Title of Contact at Project Sponsor Agency Address Business Address Parent Company Name, if applicable Hope Health, inc Christine Gordon, ACRN, MSN/MHA Christine@hope-health.org 130 Waterloo Street City, County, State, Zip, Aiken, Aiken, SC Phone Number (with area code) Employer Identification Number (EIN) or Tax Identification Number (TIN) DUN & Bradstreet Number (DUNs): Congressional District of Project Sponsor s 2 Business Address Fax Number (with area code) Congressional District(s) of Primary Service Area(s) City(ies) and County(ies) of Primary Service Area(s) Total HOPWA contract amount for this Organization for the operating year Organization s Website Address 2,3 Cities: All cities within 2 county area: Allendale, Barnwell $20,013 Counties: Allendale, Barnwell Is the sponsor a nonprofit organization? Yes No Please check if yes and a faith-based organization. Please check if yes and a grassroots organization. Does your organization maintain a waiting list? Yes No If yes, explain in the narrative section how this list is administered. Previous editions are obsolete Page 7 form HUD D (Expiration Date: 10/31/2014)
149 2. Project Sponsor Information Please complete Chart 2 for each organization designated or selected to serve as a project sponsor, as defined by CFR Use this section to report on organizations involved in the direct delivery of services for client households. These elements address requirements in the Federal Financial Accountability and Transparency Act of 2006 (Public Law ). Note: Please see the definitions for distinctions between project sponsor and subrecipient. Note: If any information does not apply to your organization, please enter N/A. Project Sponsor Agency Name Parent Company Name, if applicable Piedmont Care Name and Title of Contact at Project Sponsor Agency Address Tracey Jackson, Executive Director tracey@piedmontcare.org Business Address 101 N. Pine Street, Suite 200 City, County, State, Zip, Spartanburg, Spartanburg, SC Phone Number (with area code) Employer Identification Number (EIN) or Tax Identification Number (TIN) DUN & Bradstreet Number (DUNs): Fax Number (with area code) Congressional District of Project Sponsor s Business Address 4 Congressional District(s) of Primary Service Area(s) City(ies) and County(ies) of Primary Service Area(s) Total HOPWA contract amount for this Organization for the operating year Organization s Website Address 4 Cities: All cities within 3 county area: Cherokee, Spartanburg, Union $77,797 Counties: Cherokee, Spartanburg, Union Is the sponsor a nonprofit organization? Yes No Please check if yes and a faith-based organization. Please check if yes and a grassroots organization. Does your organization maintain a waiting list? Yes No If yes, explain in the narrative section how this list is administered. Previous editions are obsolete Page 8 form HUD D (Expiration Date: 10/31/2014)
150 2. Project Sponsor Information Please complete Chart 2 for each organization designated or selected to serve as a project sponsor, as defined by CFR Use this section to report on organizations involved in the direct delivery of services for client households. These elements address requirements in the Federal Financial Accountability and Transparency Act of 2006 (Public Law ). Note: Please see the definitions for distinctions between project sponsor and subrecipient. Note: If any information does not apply to your organization, please enter N/A. Project Sponsor Agency Name Parent Company Name, if applicable CARETEAM Name and Title of Contact at Project Sponsor Agency Address Business Address Johanna Haynes, Executive Director jhaynes@careteam.org 3650 Clay Pond Road City, County, State, Zip, Myrtle Beach, Horry, SC Phone Number (with area code) Employer Identification Number (EIN) or Tax Identification Number (TIN) DUN & Bradstreet Number (DUNs): Fax Number (with area code) Congressional District of Project Sponsor s Business Address 1 Congressional District(s) of Primary Service Area(s) City(ies) and County(ies) of Primary Service Area(s) Total HOPWA contract amount for this Organization for the operating year Organization s Website Address 1 Cities: All cities within 3 county area: Georgetown, Horry, Williamsburg $129,684 Counties: Georgetown, Horry, Williamsburg Is the sponsor a nonprofit organization? Yes No Please check if yes and a faith-based organization. Please check if yes and a grassroots organization. Does your organization maintain a waiting list? Yes No If yes, explain in the narrative section how this list is administered. Previous editions are obsolete Page 9 form HUD D (Expiration Date: 10/31/2014)
151 2. Project Sponsor Information Please complete Chart 2 for each organization designated or selected to serve as a project sponsor, as defined by CFR Use this section to report on organizations involved in the direct delivery of services for client households. These elements address requirements in the Federal Financial Accountability and Transparency Act of 2006 (Public Law ). Note: Please see the definitions for distinctions between project sponsor and subrecipient. Note: If any information does not apply to your organization, please enter N/A. Project Sponsor Agency Name Parent Company Name, if applicable Catawba Care Name and Title of Contact at Project Sponsor Agency Address Business Address Latisha Jackson, Director of Support Services ljackson@catwabacare.org 500 Lakeshore Parkway City, County, State, Zip, Rock Hill, York, SC Phone Number (with area code) Employer Identification Number (EIN) or Tax Identification Number (TIN) DUN & Bradstreet Number (DUNs): Fax Number (with area code) Congressional District of Project Sponsor s Business Address 5 Congressional District(s) of Primary Service Area(s) City(ies) and County(ies) of Primary Service Area(s) Total HOPWA contract amount for this Organization for the operating year Organization s Website Address 5 Cities: All cities within 2 county area: Chester, Lancaster $21,792 Counties: Chester, Lancaster Is the sponsor a nonprofit organization? Yes No Please check if yes and a faith-based organization. Please check if yes and a grassroots organization. Does your organization maintain a waiting list? Yes No If yes, explain in the narrative section how this list is administered. Previous editions are obsolete Page 10 form HUD D (Expiration Date: 10/31/2014)
152 2. Project Sponsor Information Please complete Chart 2 for each organization designated or selected to serve as a project sponsor, as defined by CFR Use this section to report on organizations involved in the direct delivery of services for client households. These elements address requirements in the Federal Financial Accountability and Transparency Act of 2006 (Public Law ). Note: Please see the definitions for distinctions between project sponsor and subrecipient. Note: If any information does not apply to your organization, please enter N/A. Project Sponsor Agency Name Parent Company Name, if applicable The ACCESS Network, Inc. Name and Title of Contact at Project Sponsor Agency Address Business Address Gwen Bampfield gwenbam@aol.com 5710 North Okatie Hwy, Suite B City, County, State, Zip, Ridgeland, Jasper, SC Phone Number (with area code) Employer Identification Number (EIN) or Tax Identification Number (TIN) DUN & Bradstreet Number (DUNs): Fax Number (with area code) Congressional District of Project Sponsor s Business Address 2 Congressional District(s) of Primary Service Area(s) City(ies) and County(ies) of Primary Service Area(s) Total HOPWA contract amount for this Organization for the operating year Organization s Website Address 2,6 Cities: All cities within 4 county area: Beaufort, Colleton, Hampton, Jasper $79,340 Counties: Beaufort, Colleton, Hampton, Jasper Is the sponsor a nonprofit organization? Yes No Please check if yes and a faith-based organization. Please check if yes and a grassroots organization. Does your organization maintain a waiting list? Yes No If yes, explain in the narrative section how this list is administered. Previous editions are obsolete Page 11 form HUD D (Expiration Date: 10/31/2014)
153 2. Project Sponsor Information Please complete Chart 2 for each organization designated or selected to serve as a project sponsor, as defined by CFR Use this section to report on organizations involved in the direct delivery of services for client households. These elements address requirements in the Federal Financial Accountability and Transparency Act of 2006 (Public Law ). Note: Please see the definitions for distinctions between project sponsor and subrecipient. Note: If any information does not apply to your organization, please enter N/A. Project Sponsor Agency Name Parent Company Name, if applicable University of South Carolina Name and Title of Contact at Project Sponsor Agency Address Business Address Dr. David Parker, Director of Office of Supportive Housing Services david.parker@usc.sc.edu 1325 Laurel Street City, County, State, Zip, Columbia, Richland, SC Phone Number (with area code) Employer Identification Number (EIN) or Tax Identification Number (TIN) DUN & Bradstreet Number (DUNs): Congressional District of Project Sponsor s 6 Business Address Fax Number (with area code) Congressional District(s) of Primary Service Area(s) City(ies) and County(ies) of Primary Service Area(s) Total HOPWA contract amount for this Organization for the operating year Organization s Website Address 5,6 Cities: All cities within 4 county area: Richland, Lexington, Newberry, Fairfield $75,559 Counties: Richland, Lexington, Newberry, Fairfield Is the sponsor a nonprofit organization? Yes No Please check if yes and a faith-based organization. Please check if yes and a grassroots organization. Does your organization maintain a waiting list? Yes No If yes, explain in the narrative section how this list is administered. Previous editions are obsolete Page 12 form HUD D (Expiration Date: 10/31/2014)
154 2. Project Sponsor Information Please complete Chart 2 for each organization designated or selected to serve as a project sponsor, as defined by CFR Use this section to report on organizations involved in the direct delivery of services for client households. These elements address requirements in the Federal Financial Accountability and Transparency Act of 2006 (Public Law ). Note: Please see the definitions for distinctions between project sponsor and subrecipient. Note: If any information does not apply to your organization, please enter N/A. Project Sponsor Agency Name DHEC Region 4 Name and Title of Contact at Project Sponsor Agency Address Business Address Parent Company Name, if applicable South Carolina Department of Health and Environmental Control Mamie Elmore, Director of Social Work elmorem@dhec.sc.gov 105 North Magnolia Street City, County, State, Zip, Sumter, Sumter, SC Phone Number (with area code) Employer Identification Number (EIN) or Tax Identification Number (TIN) DUN & Bradstreet Number (DUNs): Fax Number (with area code) Congressional District of Project Sponsor s Business Address 6 Congressional District(s) of Primary Service Area(s) City(ies) and County(ies) of Primary Service Area(s) Total HOPWA contract amount for this Organization for the operating year Organization s Website Address 5,6 Cities: All cities within 4 county area: Sumter, Clarendon, Lee, Kershaw $46,619 Counties: Sumter, Clarendon, Lee, Kershaw Is the sponsor a nonprofit organization? Yes No Please check if yes and a faith-based organization. Please check if yes and a grassroots organization. Does your organization maintain a waiting list? Yes No If yes, explain in the narrative section how this list is administered. Previous editions are obsolete Page 13 form HUD D (Expiration Date: 10/31/2014)
155 2. Project Sponsor Information Please complete Chart 2 for each organization designated or selected to serve as a project sponsor, as defined by CFR Use this section to report on organizations involved in the direct delivery of services for client households. These elements address requirements in the Federal Financial Accountability and Transparency Act of 2006 (Public Law ). Note: Please see the definitions for distinctions between project sponsor and subrecipient. Note: If any information does not apply to your organization, please enter N/A. Project Sponsor Agency Name Parent Company Name, if applicable Sumter Family Health Center Name and Title of Contact at Project Sponsor Agency Address Business Address Norlica Washington Finkley, Dierector of CM/Supportive Services mwashington@sumterfhc.com 1278 North Lafayette Drive City, County, State, Zip, Sumter, Sumter, SC Phone Number (with area code) Employer Identification Number (EIN) or Tax Identification Number (TIN) DUN & Bradstreet Number (DUNs): Fax Number (with area code) Congressional District of Project Sponsor s Business Address 5 Congressional District(s) of Primary Service Area(s) City(ies) and County(ies) of Primary Service Area(s) Total HOPWA contract amount for this Organization for the operating year Organization s Website Address 5,6 Cities: All cities within 4 county area: Clarendon, Lee, Sumter, Kershaw $21,780 Counties: Clarendon, Lee, Sumter, Kershaw Is the sponsor a nonprofit organization? Yes No Please check if yes and a faith-based organization. Please check if yes and a grassroots organization. Does your organization maintain a waiting list? Yes No If yes, explain in the narrative section how this list is administered. Previous editions are obsolete Page 14 form HUD D (Expiration Date: 10/31/2014)
156 2. Project Sponsor Information Please complete Chart 2 for each organization designated or selected to serve as a project sponsor, as defined by CFR Use this section to report on organizations involved in the direct delivery of services for client households. These elements address requirements in the Federal Financial Accountability and Transparency Act of 2006 (Public Law ). Note: Please see the definitions for distinctions between project sponsor and subrecipient. Note: If any information does not apply to your organization, please enter N/A. Project Sponsor Agency Name Parent Company Name, if applicable Fort Mill Housing Services, Inc Name and Title of Contact at Project Sponsor Agency Address Business Address Joseph Beasley, TBRA Program Coordinator jbeasley@hafmasc.com 105 Bozeman Dr. City, County, State, Zip, Fort Mill, York County, SC, Phone Number (with area code) Employer Identification Number (EIN) or Tax Identification Number (TIN) DUN & Bradstreet Number (DUNs): Fax Number (with area code) Congressional District of Project Sponsor s Business Address 5th Congressional District(s) of Primary Service Area(s) City(ies) and County(ies) of Primary Service Area(s) Total HOPWA contract amount for this Organization for the operating year Organization s Website Address 1,2,3,4,5,6 Cities: All cities within 35 county area: Anderson, Greenville, Oconee, Pickens, Cherokee, Spartanburg, Union, Clarendon, Lee, Newberry, Sumter, Chesterfield, Darlington, Dillon, Florence, Marion, Marlboro, Beaufort, Colleton, Hampton, Jasper, Allendale, Barnwell, Chester, Lancaster, Orangeburg, Bamberg, Abbeville, Greenwood, Laurens, McCormick, Georgetown, Horry, Williamsburg, Kershaw $603, Counties: Anderson, Greenville, Oconee, Pickens, Cherokee, Spartanburg, Union, Clarendon, Lee, Newberry, Sumter, Chesterfield, Darlington, Dillon, Florence, Marion, Marlboro, Beaufort, Colleton, Hampton, Jasper, Allendale, Barnwell, Chester, Lancaster, Orangeburg, Bamberg, Abbeville, Greenwood, Laurens, McCormick, Georgetown, Horry, Williamsburg, Kershaw Is the sponsor a nonprofit organization? Yes No Please check if yes and a faith-based organization. Please check if yes and a grassroots organization. Does your organization maintain a waiting list? Yes No If yes, explain in the narrative section how this list is administered. The list was formed when the funding limit was met. As new referrals are made to the program, they are added to the bottom of the list for that county. As a household leaves the program, the household at the top of the list for that county is contacted. Previous editions are obsolete Page 15 form HUD D (Expiration Date: 10/31/2014)
157 3. Administrative Subrecipient Information Use Chart 3 to provide the following information for each subrecipient with a contract/agreement of $25,000 or greater that assists project sponsors to carry out their administrative services but no services directly to client households. Agreements include: grants, subgrants, loans, awards, cooperative agreements, and other forms of financial assistance; and contracts, subcontracts, purchase orders, task orders, and delivery orders. (Organizations listed may have contracts with project sponsors) These elements address requirements in the Federal Funding and Accountability and Transparency Act of 2006 (Public Law ). Note: Please see the definitions for distinctions between project sponsor and subrecipient. Note: If any information does not apply to your organization, please enter N/A. Subrecipient Name Parent Company Name, if applicable Name and Title of Contact at Subrecipient Address Business Address City, State, Zip, County Phone Number (with area code) Fax Number (include area code) Employer Identification Number (EIN) or Tax Identification Number (TIN) DUN & Bradstreet Number (DUNs): North American Industry Classification System (NAICS) Code Congressional District of Subrecipient s Business Address Congressional District of Primary Service Area City (ies) and County (ies) of Primary Service Area(s) Total HOPWA Subcontract Amount of this Organization for the operating year Cities: Counties: Previous editions are obsolete Page 16 form HUD D (Expiration Date: 10/31/2014)
158 4. Program Subrecipient Information Complete the following information for each subrecipient organization providing HOPWA-funded services to client households. These organizations would hold a contract/agreement with a project sponsor(s) to provide these services. For example, a subrecipient organization may receive funds from a project sponsor to provide nutritional services for clients residing within a HOPWA facility-based housing program. Please note that subrecipients who work directly with client households must provide performance data for the grantee to include in Parts 2-7 of the CAPER. Note: Please see the definition of a subrecipient for more information. Note: Types of contracts/agreements may include: grants, sub-grants, loans, awards, cooperative agreements, and other forms of financial assistance; and contracts, subcontracts, purchase orders, task orders, and delivery orders. Note: If any information is not applicable to the organization, please report N/A in the appropriate box. Do not leave boxes blank. Sub-recipient Name Parent Company Name, if applicable Name and Title of Contact at Contractor/ Sub-contractor Agency Address Business Address City, County, State, Zip Phone Number (included area code) Fax Number (include area code) Employer Identification Number (EIN) or Tax Identification Number (TIN) DUN & Bradstreet Number (DUNs) North American Industry Classification System (NAICS) Code Congressional District of the Sub-recipient s Business Address Congressional District(s) of Primary Service Area City(ies) and County(ies) of Primary Service Area Total HOPWA Subcontract Amount of this Organization for the operating year Cities: Counties: Previous editions are obsolete Page 17 form HUD D (Expiration Date: 10/31/2014)
159 5. Grantee Narrative and Performance Assessment a. Grantee and Community Overview Provide a one to three page narrative summarizing major achievements and highlights that were proposed and completed during the program year. Include a brief description of the grant organization, area of service, the name(s) of the program contact(s), and an overview of the range/type of housing activities provided. This overview may be used for public information, including posting on HUD s website. Note: Text fields are expandable. State of South Carolina Department of Health and Environmental Control, STD/HIV Division Formula Grantee Key Facts Service Area: State of South Carolina Grant: Formula Allocations: FY 2000 $1,402,000 FY 2001 $1,614,000 FY 2002 $1,041,000 FY 2003 $1,117,000 FY 2004 $1,387,000 FY 2005 $1,356,000 FY 2006 $1,387,000 FY 2007 $1,403,000 FY 2008 $1,491,000 FY 2009 $ 1,563,881 FY 2010 $1,708,727 FY 2011 $1,728,286 South Carolina has experienced a 42% increase in the number of persons living with HIV/AIDS from 2000 to 2010 increasing the demand for housing services. Contact Information: Noreen O Donnell South Carolina Dept. of Health & Environmental Control, STD/HIV Division Mills/Jarrett Complex, Box Columbia, SC Phone: FAX: Executive Summary Grantee and Community Profile The Statewide HOPWA program is administered by the SC Department of Health and Environmental Control (DHEC), STD/HIV Division. DHEC distributes the funds to regional Ryan White Care Providers and/or eligible non-profit organizations that assist persons living with HIV/AIDS. The state HOPWA program serves all areas of South Carolina with the exception of the Columbia and Charleston EMAs, which receive HOPWA funding directly from HUD and Aiken and York Counties which are part of neighboring states EMAs. The HIV/AIDS epidemic in South Carolina is continuing to grow with an average of 795 cases of HIV infection reported each year. At the end of 2010, there were 14,708 persons estimated to be living with HIV (including AIDS) in South Carolina, excluding persons diagnosed in other states who now live in the state. South Carolina has experienced a 42 percent increase of all people living with HIV/AIDS from 2000 to The increase in the number of people living with HIV/AIDS in South Carolina equates to increased need for health care and housing services. The primary objective of DHEC s HOPWA program is to keep PLWHA from becoming homeless. Persons living with HIV or AIDS risk losing their housing due to compounding factors, such as increased medical costs and limited incomes or reduced ability to keep working due to AIDS and related illnesses. The Statewide Comprehensive Plan developed in 2009 identified lack of housing as a hindrance to clients ability to access and comply with HIVrelated services and treatment because of the relative priority and immediacy individuals place on securing safe, stable housing versus seeking health care, especially if they are asymptomatic. Activities such as enrolling PLWHA into Housing Case Management, which includes developing individualized client action plans, and developing relationships with local housing experts have been identified in the 2009 Plan to increase the proportion of PLWHA who are stably housed and therefore, improving their ability to access medical care. Program Accomplishments HOPWA funds are used to provide Tenant Based Rental Assistance (TBRA), Short-Term Rent, Mortgage and Utility payments (STRMU), Permanent Housing Placement (PHP), Supportive Services, and Operating Funds for Facility Based Housing. During FY , 142 households were served with TBRA; 319 households received STRMU; 55 received Permanent Housing Placement and 1,040 households received Supportive Services such as case management or transportation. Thirty-two households resided in facility units supported with HOPWA operating funds and twelve households resided in units of housing developed with HOPWA funds during the last ten years and continue to Previous editions are obsolete Page 18 form HUD D (Expiration Date: 10/31/2014)
160 house individuals living with HIV/AIDS. Case management is an important component of South Carolina's HOPWA continuum of care. Trends in the HIV epidemic indicate that over the next 5-10 years there is a continued need for more affordable housing on a long term basis, particularly housing in areas that provide a safe, healthy environment for families or women with children. The project sponsors of the state South Carolina HOPWA program (with the counties and activities they serve) are: AID Upstate (Greenville, Pickens, Oconee and Anderson counties with STRMU, PHP, and Supportive Services) AID Upstate (Statewide Community Care Facility) Piedmont Care (Spartanburg, Union and Cherokee counties with STRMU, PHP, and Supportive Services) Catawba Care Coalition (Chester and Lancaster counties with STRMU, PHP, and Supportive Services) Cooperative Ministry (Sumter, Clarendon, Kershaw, Newberry and Lee counties with STRMU, PHP, and Supportive Services) Fort Mill Housing Services, Inc. (all SC counties except Richland, Lexington, Aiken, York, Fairfield, Edgefield, Kershaw, Calhoun, Saluda and counties with TBRA and Supportive Services) HopeHealth PeeDee (Florence, Darlington, Marion, Marlboro, Dillon and Chesterfield counties with STRMU, PHP, and Supportive Services) HopeHealth Edisto (Orangeburg and Bamberg counties with STRMU, PHP, and Supportive Services) HopeHealth Lower Savannah (Barnwell and Allendale counties with STRMU, PHP and Supportive Services) ACCESS Network (Jasper, Beaufort, Colleton and Hampton counties with STRMU, PHP, and Supportive Services) Upper Savannah Care Services (Greenwood, Laurens, McCormick and Abbeville counties with STRMU, PHP, and Supportive Services) CARETEAM (Horry, Georgetown and Williamsburg counties with STRMU, PHP, Supportive Services) Sumter Family Health Center (Sumter County with Supportive Services) Wateree County Health Department (Sumter County with Supportive Services) University of South Carolina Department of Medicine (Richland, Lexington, Newberry and Fairfield counties with Supportive Services) b. Annual Performance under the Action Plan Provide a narrative addressing each of the following four items: 1. Outputs Reported. Describe significant accomplishments or challenges in achieving the number of housing units supported and the number households assisted with HOPWA funds during this operating year compared to plans for this assistance, as approved in the Consolidated Plan/Action Plan. Describe how HOPWA funds were distributed during your program year among different categories of housing and geographic areas to address needs throughout the grant service area, consistent with approved plans. DHEC has been the HOPWA formula grantee for the State of South Caroline since DHEC serves all areas of the state except the two areas that are HOPWA entitlement communities (Columbia and Charleston). The following organizations are the DHEC HOPWA sponsors who directly provide housing and supportive services to eligible people living with HIV/AIDS (PLWHA). Catawba Care Fort Mill Housing Services, Inc. Hope Health Lower Savannah DHEC Region 4 Sumter Family Health Center CARETEAM University of South Carolina Piedmont Care, Inc. ACCESS Network The Cooperative Ministry Upper Savannah Care Services Hope Health Pee Dee Hope Health Edisto AID Upstate All DHEC HOPWA sponsors are Ryan White Part B service providers or collaborate closely with Ryan White Part B service providers. The project sponsors, with the exception of the Cooperative Ministry and Fort Mill Housing Services, Inc., all provide supportive services, primarily case management, for PLWHA statewide. Case management is an important component of South Carolina s HOPWA continuum of care, particularly for clients who need assistance with maintaining medical care and treatment and stable housing. HOPWA case management is defined as the provision of supportive services that are designed to help clients establish and/or maintain stable housing. HOPWA case management includes the development of individualized client action plans that establish goals and objectives around meeting clients needs, including house needs. Previous editions are obsolete Page 19 form HUD D (Expiration Date: 10/31/2014)
161 During FY , the goal of 110 clients served with TBRA was exceeded as 142 households were served with TBRA. 319 household received STRMU assistance exceeded the goal of 300. Fifty-five households were provided with permanent housing placement exceeding the goal of 40. 1,040 households received supportive services such as case management, employment assistance, transportation, and alcohol and drug abuse services exceeding the goal of 850 supportive services. Thirty-two households resided in units supported with HOPWA operating funds, which exceeded the goal of 20. Twelve households resided in units of housing developed with HOPWA funds during the last ten years and continue to house individuals living with HIV/AIDS. 2. Outcomes Assessed. Assess your program s success in enabling HOPWA beneficiaries to establish and/or better maintain a stable living environment in housing that is safe, decent, and sanitary, and improve access to care. Compare current year results to baseline results for clients. Describe how program activities/projects contributed to meeting stated goals. If program did not achieve expected targets, please describe how your program plans to address challenges in program implementation and the steps currently being taken to achieve goals in next operating year. If your program exceeded program targets, please describe strategies the program utilized and how those contributed to program successes. Tenant based rental assistance (TBRA) goals were 129% complete for FY Emergency housing assistance (STRMU) exceeded the goal and reached 106% complete. Permanent Housing Placement goals were 138% complete. Supportive services were also in excess of the goal with 122% complete. Community-based residence including transitional and permanent housing were above the target with 160% complete. The impact of activities undertaken by the state program during FY are significant for PLWHA in South Carolina. Based on 2011 Ryan White Part B Data Reports (RDR), of the 9,957 clients served, 92% of clients are living below 200% of the federal Poverty Level. An unforeseen emergency event, such as medical costs or car repairs, would cause them to live in substandard housing without power, water, or heat or even become homeless. STRMU keeps clients in housing when medical emergencies occur and in this time of continued economic distress the STRMU goal was exceeded as more clients had emergency needs. When living arrangements are detrimental to a client s health and quality of living, permanent housing placement services assist clients getting into a new home. Increasing use of supportive services in order to assist individuals in maintaining housing stability are critical and reflected in the high completion rate for supportive services, including case management and transportation. Case management and other supportive services (such as transportation) provide clients with the assistance necessary to stay in medical care and develop and maintain adherence to forward moving action plans, including housing elements of action plans. Facility based housing assistance and tenant based rental assistance both provide safe, stable housing situations for PLWHA s long term housing needs. Transitional housing assists PLWHA moving from one housing circumstance to another from mental health or substance abuse treatment to facility based of tenant based housing assistance. Clients in transitional facilities have often exhausted all other options in the area and had nowhere else to go. The facilities allow clients the ability simultaneously work on a long term housing goal without the day-to-day instability of homelessness. Twelve units of facility based, transitional housing was available during FY These units of housing were developed with HOPWA funds during the last ten years and continue to house individuals living with HIV/AIDS. This housing helped those PLWHA transitioning from mental health or substance abuse programs, or who need a low level of assistance with daily living activities. 3. Coordination. Report on program coordination with other mainstream housing and supportive services resources, including the use of committed leveraging from other public and private sources that helped to address needs for eligible persons identified in the Consolidated Plan/Strategic Plan. HOPWA funds budgeted and expended for FY are included on pages of the CAPER. Leveraged funds are reported on page 25. All DHEC HOPWA sponsors are Ryan White service providers or collaborate closely with Ryan White service providers. Ryan White Part B resources leveraged are reflected in the report. Twelve stewardship units were highly leveraged, providing the units for only $150,000 of HOPWA funds and an estimated $167,666 of leveraged funds. 4. Technical Assistance. Describe any program technical assistance needs and how they would benefit program beneficiaries. Previous editions are obsolete Page 20 form HUD D (Expiration Date: 10/31/2014)
162 We have no technical assistance needs at this time. c. Barriers and Trends Overview HOPWA/HUD Regulations Planning Discrimination/Confidentiality Multiple Diagnoses Housing Availability Eligibility Rent Determination and Fair Market Rents Technical Assistance or Training Supportive Services Credit History Rental History Criminal Justice History Housing Affordability Geography/Rural Access Other, please explain further Provide a narrative addressing items 1 through 3. Explain how barriers and trends affected your program s ability to achieve the objectives and outcomes discussed in the previous section. 1. Describe any barriers (including regulatory and non-regulatory) encountered in the administration or implementation of the HOPWA program, how they affected your program s ability to achieve the objectives and outcomes discussed, and, actions taken in response to barriers, and recommendations for program improvement. Provide an explanation for each barrier selected. Overall barriers to Housing for People Living with HIV/AIDS in South Carolina: The Statewide Coordinated Statement of Need (SCSN) completed in 2009 identified the need to develop solutions for a continuum of housing needs, including emergency housing and temporary shelter. Examples of cited barriers to housing assistance include: Many rural clients live with family members and their names are not typically on utility bills or leases. As a result, they are not eligible for utility of rental assistance. Lack of transportation to employment or medical services. Section 8 Housing Choice Voucher Programs have lengthy waiting lists and exclusion policies. Lack of sufficient, affordable housing. Homelessness/lack of documentation. Condition of local economy and its impact on HIV services. AIDS related stigma. Client s criminal history and substance abuse issues. Client s credit and rental history. Recommendations: Solutions/strategies to housing barriers for persons with HIV were addressed during the development of the SCSN. Recommendations include: Employment training Development of supportive housing Resource identification Continued collaboration with other local housing providers HOPWA Program Barriers: The primary programmatic barrier for the HOPWA grant year was in providing end of year reporting data. The new CAPER was not released far enough in advance to make the updates in the data system and reporting tools reflecting the report changes. We continue to train the project sponsors around data input and reporting as turnover at sponsor agencies is significant. 2. Describe any trends in the community that may affect the way in which the needs of persons living with HIV/AIDS are being addressed, and provide any other information important to the future provision of services to this population. As the epidemic has evolved into a long-term illness affecting nearly as many women as men, the need for long-term, affordable housing in safe neighborhoods has increased. This increase in women with HIV increases the demands for health care and housing. TBRA and facility based housing, through the HOPWA program, meets the need for some clients. In both rural and urban areas, there is a lack of affordable housing in safe neighborhoods. Case management, with the development of housing plans, will continue to be vital for clients to identify and maintain housing. Previous editions are obsolete Page 21 form HUD D (Expiration Date: 10/31/2014)
163 3. Identify any evaluations, studies, or other assessments of the HOPWA program that are available to the public. The South Carolina Ryan White Statewide Coordinated Statement of Need and Comprehensive Plan was updated in January The purpose of the SCSN and Comprehensive Plan is to provide a collaborative mechanism to identify and address significant HIV care issues related to the needs of people living with HIV/AIDS (PLWHA) and to maximize coordination, integration, and effective linkages across the Ryan White Parts related to such issues. The SCSN and Comprehensive Plan identifies broad goals related to the needs of PLWHA, identifies critical gaps in life-extending care needed by PLWHA both in and out of care, and describes cross-cutting issues for Ryan White providers. The Comprehensive Plan portion of the document describes a plan for the organization and delivery of health and support services in South Carolina. The plan includes appropriate strategies, goals and timelines. While the SCSN and Comprehensive Plan were developed as a requirement of the Ryan White programs, much of the information is applicable to HOPWA providers as well as the client population overlaps. In , a Needs Assessment of clients receiving services from the 11 HIV/AIDS service organizations was completed. Results from this survey are being used in planning services to be provided. Previous editions are obsolete Page 22 form HUD D (Expiration Date: 10/31/2014)
164 d. Unmet Housing Needs: An Assessment of Unmet Housing Needs In Chart 1, provide an assessment of the number of HOPWA-eligible households that require HOPWA housing subsidy assistance but are not currently served by any HOPWA-funded housing subsidy assistance in this service area. In Row 1, report the total unmet need of the geographical service area, as reported in Unmet Needs for Persons with HIV/AIDS, Chart 1B of the Consolidated or Annual Plan(s), or as reported under HOPWA worksheet in the Needs Workbook of the Consolidated Planning Management Process (CPMP) tool. Note: Report most current data available, through Consolidated or Annual Plan(s), and account for local housing issues, or changes in HIV/AIDS cases, by using combination of one or more of the sources in Chart 2. If data is collected on the type of housing that is needed in Rows a. through c., enter the number of HOPWA-eligible households by type of housing subsidy assistance needed. For an approximate breakdown of overall unmet need by type of housing subsidy assistance refer to the Consolidated or Annual Plan (s), CPMP tool or local distribution of funds. Do not include clients who are already receiving HOPWA-funded housing subsidy assistance. Refer to Chart 2, and check all sources consulted to calculate unmet need. Reference any data from neighboring states or municipalities Consolidated Plan or other planning efforts that informed the assessment of Unmet Need in your service area. Note: In order to ensure that the unmet need assessment for the region is comprehensive, HOPWA formula grantees should include those unmet needs assessed by HOPWA competitive grantees operating within the service area. 1. Planning Estimate of Area s Unmet Needs for HOPWA-Eligible Households 1. Total number of households that have unmet housing subsidy assistance need. 2. From the total reported in Row 1, identify the number of households with unmet housing needs by type of housing subsidy assistance: a. Tenant-Based Rental Assistance (TBRA) b. Short-Term Rent, Mortgage and Utility payments (STRMU) Assistance with rental costs Assistance with mortgage payments Assistance with utility costs. c. Housing Facilities, such as community residences, SRO dwellings, other housing facilities Previous editions are obsolete Page 23 form HUD D (Expiration Date: 10/31/2014)
165 2. Recommended Data Sources for Assessing Unmet Need (check all sources used) = Data as reported in the area Consolidated Plan, e.g. Table 1B, CPMP charts, and related narratives = Data established by area HIV/AIDS housing planning and coordination efforts, e.g. Continuum of Care = Data from client information provided in Homeless Management Information Systems (HMIS) X = Data from project sponsors or housing providers, including waiting lists for assistance or other assessments on need including those completed by HOPWA competitive grantees operating in the region. = Data from prisons or jails on persons being discharged with HIV/AIDS, if mandatory testing is conducted X = Data from local Ryan White Planning Councils or reported in CARE Act Data Reports, e.g. number of clients with permanent housing = Data collected for HIV/AIDS surveillance reporting or other health assessments, e.g. local health department or CDC surveillance data End of PART 1 Previous editions are obsolete Page 24 form HUD D (Expiration Date: 10/31/2014)
166 PART 2: Sources of Leveraging and Program Income 1. Sources of Leveraging Report the source(s) of cash or in-kind leveraged federal, state, local or private resources identified in the Consolidated or Annual Plan and used in the delivery of the HOPWA program and the amount of leveraged dollars. In Column [1], identify the type of leveraging. Some common sources of leveraged funds have been provided as a reference point. You may add Rows as necessary to report all sources of leveraged funds. Include Resident Rent payments paid by clients directly to private landlords. Do NOT include rents paid directly to a HOPWA program as this will be reported in the next section. In Column [2] report the amount of leveraged funds expended during the operating year. Use Column [3] to provide some detail about the type of leveraged contribution (e.g., case management services or clothing donations). In Column [4], check the appropriate box to indicate whether the leveraged contribution was a housing subsidy assistance or another form of support. Note: Be sure to report on the number of households supported with these leveraged funds in Part 3, Chart 1, Column d. A. Source of Leveraging Chart [1] Source of Leveraging Public Funding Ryan White-Housing Assistance [2] Amount of Leveraged Funds Ryan White-Other (Medical Case Management Services) 2,701,472 Housing Choice Voucher Program (Fort Mill) 603,163 Low Income Housing Tax Credit HOME Shelter Plus Care Emergency Solutions Grant Other Public: HUD PSH (Access Network) 67,640 Other Public: HUD Home Haven (Access Network) 43,444 Other Public: Other Public: Other Public: Private Funding Grants In-kind Resources Other Private: Other Private: Other Funding Grantee/Project Sponsor/Subrecipient (Agency) Cash Resident Rent Payments by Client to Private Landlord $206,436 TOTAL (Sum of all Rows) $3,622,155 [3] Type of Contribution [4] Housing Subsidy Assistance or Other Support Housing Subsidy Assistance Other Support Housing Subsidy Assistance Other Support Housing Subsidy Assistance Other Support Housing Subsidy Assistance Other Support Housing Subsidy Assistance Other Support Housing Subsidy Assistance Other Support Housing Subsidy Assistance Other Support Housing Subsidy Assistance Other Support Housing Subsidy Assistance Other Support Housing Subsidy Assistance Other Support Housing Subsidy Assistance Other Support Housing Subsidy Assistance Other Support Housing Subsidy Assistance Other Support Housing Subsidy Assistance Other Support Housing Subsidy Assistance Other Support Housing Subsidy Assistance Other Support Housing Subsidy Assistance Other Support Previous editions are obsolete Page 25 form HUD D (Expiration Date: 10/31/2014)
167 2. Program Income and Resident Rent Payments In Section 2, Chart A., report the total amount of program income and resident rent payments directly generated from the use of HOPWA funds, including repayments. Include resident rent payments collected or paid directly to the HOPWA program. Do NOT include payments made directly from a client household to a private landlord. Note: Please see report directions section for definition of program income. (Additional information on program income is available in the HOPWA Grantee Oversight Resource Guide). A. Total Amount Program Income and Resident Rent Payment Collected During the Operating Year Program Income and Resident Rent Payments Collected Total Amount of Program Income (for this operating year) 1. Program income (e.g. repayments) 2. Resident Rent Payments made directly to HOPWA Program $6, Total Program Income and Resident Rent Payments (Sum of Rows 1 and 2) $6,170 B. Program Income and Resident Rent Payments Expended To Assist HOPWA Households In Chart B, report on the total program income and resident rent payments (as reported above in Chart A) expended during the operating year. Use Row 1 to report Program Income and Resident Rent Payments expended on Housing Subsidy Assistance Programs (i.e., TBRA, STRMU, PHP, Master Leased Units, and Facility-Based Housing). Use Row 2 to report on the Program Income and Resident Rent Payment expended on Supportive Services and other non-direct Housing Costs. Program Income and Resident Rent Payment Expended on HOPWA programs Total Amount of Program Income Expended (for this operating year) 1. Program Income and Resident Rent Payment Expended on Housing Subsidy Assistance costs 2. Program Income and Resident Rent Payment Expended on Supportive Services and other nondirect $5,833 housing costs 3. Total Program Income Expended (Sum of Rows 1 and 2) $5,833 End of PART 2 Previous editions are obsolete Page 26 form HUD D (Expiration Date: 10/31/2014)
168 PART 3: Accomplishment Data Planned Goal and Actual Outputs In Chart 1, enter performance information (goals and actual outputs) for all activities undertaken during the operating year supported with HOPWA funds. Performance is measured by the number of households and units of housing that were supported with HOPWA or other federal, state, local, or private funds for the purposes of providing housing assistance and support to persons living with HIV/AIDS and their families. Note: The total households assisted with HOPWA funds and reported in PART 3 of the CAPER should be the same as reported in the annual year-end IDIS data, and goals reported should be consistent with the Annual Plan information. Any discrepancies or deviations should be explained in the narrative section of PART HOPWA Performance Planned Goal and Actual Outputs [1] Output: Households [2] Output: Funding HOPWA Performance Planned Goal and Actual HOPWA Assistance Leveraged Households HOPWA Funds a. b. c. d. e. f. Goal Actual Goal Actual HOPWA Budget HOPWA Actual HOPWA Housing Subsidy Assistance [1] Output: Households [2] Output: Funding 1. Tenant-Based Rental Assistance , , a. Permanent Housing Facilities: Received Operating Subsidies/Leased units (Households Served) , , b. Transitional/Short-term Facilities: Received Operating Subsidies/Leased units (Households Served) 31, (Households Served) ,826 3a. Permanent Housing Facilities: Capital Development Projects placed in service during the operating year (Households Served) 3b. Transitional/Short-term Facilities: Capital Development Projects placed in service during the operating year (Households Served) 4. Short-Term Rent, Mortgage and Utility Assistance , , Permanent Housing Placement Services ,764 16, Adjustments for duplication (subtract) Total HOPWA Housing Subsidy Assistance (Columns a. d. equal the sum of Rows 1-5 minus Row 6; Columns e. and f. equal the sum of Rows 1-5) , , Housing Development (Construction and Stewardship of facility based housing) [1] Output: Housing Units [2] Output: Funding 8. Facility-based units; Capital Development Projects not yet opened (Housing Units) 9. Stewardship Units subject to 3 or 10 year use agreements 10. Total Housing Developed (Sum of Rows 78 & 9) Supportive Services [1] Output Households [2] Output: Funding 11a. Supportive Services provided by project sponsors/subrecipient that also delivered 615, HOPWA housing subsidy assistance b Supportive Services provided by project sponsors/subrecipient that only provided. supportive services , Adjustment for duplication (subtract) 13. Total Supportive Services (Columns a. d. equal the sum of Rows 11 a. & b. minus Row 12; Columns e. and f. equal the sum of Rows 11a. & 11b.) , , Housing Information Services [1] Output Households [2] Output: Funding 14. Housing Information Services 15. Total Housing Information Services Previous editions are obsolete Page 27 form HUD D (Expiration Date: 10/31/2014)
169 Grant Administration and Other Activities [1] Output Households [2] Output: Funding 16. Resource Identification to establish, coordinate and develop housing assistance resources 17. Technical Assistance (if approved in grant agreement) 18. Grantee Administration (maximum 3% of total HOPWA grant) Project Sponsor Administration (maximum 7% of portion of HOPWA grant awarded) , Total Grant Administration and Other Activities (Sum of Rows 16 19) 127,557 92, Total Expended [2] Outputs: HOPWA Funds Expended 21. Total Expenditures for program year (Sum of Rows 7, 10, 13, 15, and 20) Budget 1,781,253 Actual 1,736, Listing of Supportive Services Report on the households served and use of HOPWA funds for all supportive services. Do NOT report on supportive services leveraged with non-hopwa funds. Data check: Total unduplicated households and expenditures reported in Row 17 equal totals reported in Part 3, Chart 1, Row 13. Supportive Services [1] Output: Number of Households [2] Output: Amount of HOPWA Funds Expended 1. Adult day care and personal assistance 2. Alcohol and drug abuse services 3. Case management 4. Child care and other child services 5. Education 6. Employment assistance and training 7. Health/medical/intensive care services, if approved Note: Client records must conform with 24 CFR Legal services 9. Life skills management (outside of case management) 10. Meals/nutritional services 11. Mental health services 12. Outreach 13. Transportation Other Activity (if approved in grant agreement). Specify: Sub-Total Households receiving Supportive Services (Sum of Rows 1-14) 16. Adjustment for Duplication (subtract) 17. TOTAL Unduplicated Households receiving Supportive Services (Column [1] equals Row 15 minus Row 16; Column [2] equals sum of Rows 1-14) 5 12, , , , , , Previous editions are obsolete Page 28 form HUD D (Expiration Date: 10/31/2014)
170 3. Short-Term Rent, Mortgage and Utility Assistance (STRMU) Summary In Row a., enter the total number of households served and the amount of HOPWA funds expended on Short-Term Rent, Mortgage and Utility (STRMU) Assistance. In Row b., enter the total number of STRMU-assisted households that received assistance with mortgage costs only (no utility costs) and the amount expended assisting these households. In Row c., enter the total number of STRMU-assisted households that received assistance with both mortgage and utility costs and the amount expended assisting these households. In Row d., enter the total number of STRMU-assisted households that received assistance with rental costs only (no utility costs) and the amount expended assisting these households. In Row e., enter the total number of STRMU-assisted households that received assistance with both rental and utility costs and the amount expended assisting these households. In Row f., enter the total number of STRMU-assisted households that received assistance with utility costs only (not including rent or mortgage costs) and the amount expended assisting these households. In row g., report the amount of STRMU funds expended to support direct program costs such as program operation staff. Data Check: The total households reported as served with STRMU in Row a., column [1] and the total amount of HOPWA funds reported as expended in Row a., column [2] equals the household and expenditure total reported for STRMU in Part 3, Chart 1, Row 4, Columns b. and f., respectively. Data Check: The total number of households reported in Column [1], Rows b., c., d., e., and f. equal the total number of STRMU households reported in Column [1], Row a. The total amount reported as expended in Column [2], Rows b., c., d., e., f., and g. equal the total amount of STRMU expenditures reported in Column [2], Row a. a. Housing Subsidy Assistance Categories (STRMU) Total Short-term mortgage, rent and/or utility (STRMU) assistance [1] Output: Number of Households Served [2] Output: Total HOPWA Funds Expended on STRMU during Operating Year 319 $192,034 b. Of the total STRMU reported on Row a, total who received assistance with mortgage costs ONLY. Unable to report detail Unable to report detail c. Of the total STRMU reported on Row a, total who received assistance with mortgage and utility costs. Unable to report detail Unable to report detail d. Of the total STRMU reported on Row a, total who received assistance with rental costs ONLY. Unable to report detail Unable to report detail e. Of the total STRMU reported on Row a, total who received assistance with rental and utility costs. Unable to report detail Unable to report detail f. Of the total STRMU reported on Row a, total who received assistance with utility costs ONLY. Unable to report detail Unable to report detail g. Direct program delivery costs (e.g., program operations staff time) Unable to report detail End of PART 3 Previous editions are obsolete Page 29 form HUD D (Expiration Date: 10/31/2014)
171 Part 4: Summary of Performance Outcomes In Column [1], report the total number of eligible households that received HOPWA housing subsidy assistance, by type. In Column [2], enter the number of households that continued to access each type of housing subsidy assistance into next operating year. In Column [3], report the housing status of all households that exited the program. Data Check: The sum of Columns [2] (Number of Households Continuing) and [3] (Exited Households) equals the total reported in Column[1]. Note: Refer to the housing stability codes that appear in Part 5: Worksheet - Determining Housing Stability Outcomes. Section 1. Housing Stability: Assessment of Client Outcomes on Maintaining Housing Stability (Permanent Housing and Related Facilities) A. Permanent Housing Subsidy Assistance [1] Output: Total Number of Households Served [2] Assessment: Number of Households that Continued Receiving HOPWA Housing Subsidy Assistance into the Next Operating Year [3] Assessment: Number of Households that exited this HOPWA Program; their Housing Status after Exiting [4] HOPWA Client Outcomes 1 Emergency Shelter/Streets Unstable Arrangements 2 Temporary Housing Temporarily Stable, with Reduced Risk of Homelessness Tenant-Based Rental Assistance Private Housing 1 4 Other HOPWA 5 Other Subsidy 1 Stable/Permanent Housing (PH) 6 Institution 7 Jail/Prison 1 8 Disconnected/Unknown 10 Unstable Arrangements 9 Death 4 Life Event 1 Emergency Shelter/Streets Unstable Arrangements 2 Temporary Housing 1 Temporarily Stable, with Reduced Risk of Homelessness Permanent Supportive Housing Facilities/ Units Private Housing 1 4 Other HOPWA 5 Other Subsidy 1 6 Institution Stable/Permanent Housing (PH) 7 Jail/Prison 8 Disconnected/Unknown 1 Unstable Arrangements B. Transitional Housing Assistance [1] Output: Total Number of Households Served [2] Assessment: Number of Households that Continued Receiving HOPWA Housing Subsidy Assistance into the Next Operating Year 9 Death Life Event [3] Assessment: Number of Households that exited this HOPWA Program; their Housing Status after Exiting [4] HOPWA Client Outcomes 1 Emergency Shelter/Streets Unstable Arrangements Transitional/ Short-Term Housing Facilities/ Units Temporary Housing 1 Temporarily Stable with Reduced Risk of Homelessness 3 Private Housing 3 4 Other HOPWA 5 Other Subsidy 12 Stable/Permanent Housing (PH) 6 Institution 7 Jail/Prison 1 8 Disconnected/unknown Unstable Arrangements 9 Death Life Event Previous editions are obsolete Page 30 form HUD D (Expiration Date: 10/31/2014)
172 B1:Total number of households receiving transitional/short-term housing assistance whose tenure exceeded 24 months 0 Section 2. Prevention of Homelessness: Assessment of Client Outcomes on Reduced Risks of Homelessness (Short-Term Housing Subsidy Assistance) Report the total number of households that received STRMU assistance in Column [1]. In Column [2], identify the outcomes of the households reported in Column [1] either at the time that they were known to have left the STRMU program or through the project sponsor or subrecipient s best assessment for stability at the end of the operating year. Information in Column [3] provides a description of housing outcomes; therefore, data is not required. At the bottom of the chart: In Row 1a., report those households that received STRMU assistance during the operating year of this report, and the prior operating year. In Row 1b., report those households that received STRMU assistance during the operating year of this report, and the two prior operating years. Data Check: The total households reported as served with STRMU in Column [1] equals the total reported in Part 3, Chart 1, Row 4, Column b. Data Check: The sum of Column [2] should equal the number of households reported in Column [1]. Assessment of Households that Received STRMU Assistance [1] Output: Total number of households [2] Assessment of Housing Status [3] HOPWA Client Outcomes Maintain Private Housing without subsidy (e.g. Assistance provided/completed and client is stable, not likely to seek additional support) Other Private Housing without subsidy (e.g. client switched housing units and is now stable, not likely to seek additional support) Other HOPWA Housing Subsidy Assistance 0 Other Housing Subsidy (PH) Stable/Permanent Housing (PH) 319 Institution (e.g. residential and long-term care) 2 Likely that additional STRMU is needed to maintain current housing arrangements 262 Transitional Facilities/Short-term (e.g. temporary or transitional arrangement) 0 Temporarily Stable, with Reduced Risk of Homelessness Temporary/Non-Permanent Housing arrangement (e.g. gave up lease, and moved in with family or friends but expects to live there less than 90 days) 3 Emergency Shelter/street 0 Jail/Prison 3 Disconnected 6 Unstable Arrangements Death 1 Life Event 1a. Total number of those households that received STRMU Assistance in the operating year of this report that also received STRMU assistance in the prior operating year (e.g. households that received STRMU assistance in two consecutive operating years). 1b. Total number of those households that received STRMU Assistance in the operating year of this report that also received STRMU assistance in the two prior operating years (e.g. households that received STRMU assistance in three consecutive operating years) Previous editions are obsolete Page 31 form HUD D (Expiration Date: 10/31/2014)
173 Section 3. HOPWA Outcomes on Access to Care and Support 1a. Total Number of Households Line [1]: For project sponsors/subrecipients that provided HOPWA housing subsidy assistance during the operating year identify in the appropriate row the number of households that received HOPWA housing subsidy assistance (TBRA, STRMU, Facility-Based, PHP and Master Leasing) and HOPWA funded case management services. Use Row c. to adjust for duplication among the service categories and Row d. to provide an unduplicated household total. Line [2]: For project sponsors/subrecipients that did NOT provide HOPWA housing subsidy assistance identify in the appropriate row the number of households that received HOPWA funded case management services. Note: These numbers will help you to determine which clients to report Access to Care and Support Outcomes for and will be used by HUD as a basis for analyzing the percentage of households who demonstrated or maintained connections to care and support as identified in Chart 1b. below. Total Number of Households 1. For Project Sponsors/Subrecipients that provided HOPWA Housing Subsidy Assistance: Identify the total number of households that received the following HOPWA-funded services: a. Housing Subsidy Assistance (duplicated)-tbra, STRMU, PHP, Facility-Based Housing, and Master Leasing 508 b. Case Management 875 c. Adjustment for duplication (subtraction) 316 d. Total Households Served by Project Sponsors/Subrecipients with Housing Subsidy Assistance (Sum of Rows a.b minus Row c.) 2. For Project Sponsors/Subrecipients did NOT provide HOPWA Housing Subsidy Assistance: Identify the total number of households that received the following HOPWA-funded service: a. HOPWA Case Management 89 b. Total Households Served by Project Sponsors/Subrecipients without Housing Subsidy Assistance 89 1b. Status of Households Accessing Care and Support Column [1]: Of the households identified as receiving services from project sponsors/subrecipients that provided HOPWA housing subsidy assistance as identified in Chart 1a., Row 1d. above, report the number of households that demonstrated access or maintained connections to care and support within the program year. Column [2]: Of the households identified as receiving services from project sponsors/subrecipients that did NOT provide HOPWA housing subsidy assistance as reported in Chart 1a., Row 2b., report the number of households that demonstrated improved access or maintained connections to care and support within the program year. Note: For information on types and sources of income and medical insurance/assistance, refer to Charts below. Categories of Services Accessed 1. Has a housing plan for maintaining or establishing stable ongoing housing 2. Had contact with case manager/benefits counselor consistent with the schedule specified in client s individual service plan (may include leveraged services such as Ryan White Medical Case Management) 3. Had contact with a primary health care provider consistent with the schedule specified in client s individual service plan 4. Accessed and maintained medical insurance/assistance 5. Successfully accessed or maintained qualification for sources of income [2] For project [1] For project sponsors/subrecipients that sponsors/subrecipients that did NOT provide HOPWA Outcome provided HOPWA housing subsidy housing subsidy assistance, Indicator assistance, identify the households identify the households who who demonstrated the following: demonstrated the following: Support for Stable Housing Access to Support Access to Health Care Access to Health Care Sources of Income Previous editions are obsolete Page 32 form HUD D (Expiration Date: 10/31/2014)
174 Chart 1b., Line 4: Sources of Medical Insurance and Assistance include, but are not limited to the following (Reference only) MEDICAID Health Insurance Program, or use local program name MEDICARE Health Insurance Program, or use local program name Veterans Affairs Medical Services AIDS Drug Assistance Program (ADAP) State Children s Health Insurance Program (SCHIP), or use local program name Ryan White-funded Medical or Dental Assistance Chart 1b., Row 5: Sources of Income include, but are not limited to the following (Reference only) Earned Income Veteran s Pension Unemployment Insurance Pension from Former Job Supplemental Security Income (SSI) Child Support Social Security Disability Income (SSDI) Alimony or other Spousal Support Veteran s Disability Payment Retirement Income from Social Security Worker s Compensation General Assistance (GA), or use local program name Private Disability Insurance Temporary Assistance for Needy Families (TANF) Other Income Sources 1c. Households that Obtained Employment Column [1]: Of the households identified as receiving services from project sponsors/subrecipients that provided HOPWA housing subsidy assistance as identified in Chart 1a., Row 1d. above, report on the number of households that include persons who obtained an income-producing job during the operating year that resulted from HOPWA-funded Job training, employment assistance, education or related case management/counseling services. Column [2]: Of the households identified as receiving services from project sponsors/subrecipients that did NOT provide HOPWA housing subsidy assistance as reported in Chart 1a., Row 2b., report on the number of households that include persons who obtained an income-producing job during the operating year that resulted from HOPWA-funded Job training, employment assistance, education or case management/counseling services. Note: This includes jobs created by this project sponsor/subrecipients or obtained outside this agency. Note: Do not include jobs that resulted from leveraged job training, employment assistance, education or case management/counseling services. Categories of Services Accessed Total number of households that obtained an income-producing job [1 For project sponsors/subrecipients that provided HOPWA housing subsidy assistance, identify the households who demonstrated the following: [2] For project sponsors/subrecipients that did NOT provide HOPWA housing subsidy assistance, identify the households who demonstrated the following: End of PART 4 Previous editions are obsolete Page 33 form HUD D (Expiration Date: 10/31/2014)
175 PART 5: Worksheet - Determining Housing Stability Outcomes (optional) 1. This chart is designed to assess program results based on the information reported in Part 4 and to help Grantees determine overall program performance. Completion of this worksheet is optional. Permanent Housing Subsidy Assistance Tenant-Based Rental Assistance (TBRA) Permanent Facilitybased Housing Assistance/Units Transitional/Short- Term Facility-based Housing Assistance/Units Total Permanent HOPWA Housing Subsidy Assistance Reduced Risk of Homelessness: Short-Term Assistance Short-Term Rent, Mortgage, and Utility Assistance (STRMU) Total HOPWA Housing Subsidy Assistance Stable Housing (# of households remaining in program plus ) Stable/Permanent Housing Temporary Housing (2) Temporarily Stable, with Reduced Risk of Homelessness Unstable Arrangements (1+7+8) Unstable Arrangements Life Event (9) Life Events Background on HOPWA Housing Stability Codes Stable Permanent Housing/Ongoing Participation 3 = Private Housing in the private rental or home ownership market (without known subsidy, including permanent placement with families or other self-sufficient arrangements) with reasonable expectation that additional support is not needed. 4 = Other HOPWA-funded housing subsidy assistance (not STRMU), e.g. TBRA or Facility-Based Assistance. 5 = Other subsidized house or apartment (non-hopwa sources, e.g., Section 8, HOME, public housing). 6 = Institutional setting with greater support and continued residence expected (e.g., residential or long-term care facility). Temporary Housing 2 = Temporary housing - moved in with family/friends or other short-term arrangement, such as Ryan White subsidy, transitional housing for homeless, or temporary placement in institution (e.g., hospital, psychiatric hospital or other psychiatric facility, substance abuse treatment facility or detox center). Unstable Arrangements 1 = Emergency shelter or no housing destination such as places not meant for habitation (e.g., a vehicle, an abandoned building, bus/train/subway station, or anywhere outside). 7 = Jail /prison. 8 = Disconnected or disappeared from project support, unknown destination or no assessments of housing needs were undertaken. Life Event 9 = Death, i.e., remained in housing until death. This characteristic is not factored into the housing stability equation. Tenant-based Rental Assistance: Stable Housing is the sum of the number of households that (i) remain in the housing and (ii) those that left the assistance as reported under: 3, 4, 5, and 6. Temporary Housing is the number of households that accessed assistance, and left their current housing for a non-permanent housing arrangement, as reported under item: 2. Unstable Situations is the sum of numbers reported under items: 1, 7, and 8. Previous editions are obsolete Page 34 form HUD D (Expiration Date: 10/31/2014)
176 Permanent Facility-Based Housing Assistance: Stable Housing is the sum of the number of households that (i) remain in the housing and (ii) those that left the assistance as shown as items: 3, 4, 5, and 6. Temporary Housing is the number of households that accessed assistance, and left their current housing for a non-permanent housing arrangement, as reported under item 2. Unstable Situations is the sum of numbers reported under items: 1, 7, and 8. Transitional/Short-Term Facility-Based Housing Assistance: Stable Housing is the sum of the number of households that (i) continue in the residences (ii) those that left the assistance as shown as items: 3, 4, 5, and 6. Other Temporary Housing is the number of households that accessed assistance, and left their current housing for a non-permanent housing arrangement, as reported under item 2. Unstable Situations is the sum of numbers reported under items: 1, 7, and 8. Tenure Assessment. A baseline of households in transitional/short-term facilities for assessment purposes, indicate the number of households whose tenure exceeded 24 months. STRMU Assistance: Stable Housing is the sum of the number of households that accessed assistance for some portion of the permitted 21-week period and there is reasonable expectation that additional support is not needed in order to maintain permanent housing living situation (as this is a time-limited form of housing support) as reported under housing status: Maintain Private Housing with subsidy; Other Private with Subsidy; Other HOPWA support; Other Housing Subsidy; and Institution. Temporarily Stable, with Reduced Risk of Homelessness is the sum of the number of households that accessed assistance for some portion of the permitted 21-week period or left their current housing arrangement for a transitional facility or other temporary/non-permanent housing arrangement and there is reasonable expectation additional support will be needed to maintain housing arrangements in the next year, as reported under housing status: Likely to maintain current housing arrangements, with additional STRMU assistance; Transitional Facilities/Short-term; and Temporary/Non-Permanent Housing arrangements Unstable Situation is the sum of number of households reported under housing status: Emergency Shelter; Jail/Prison; and Disconnected. End of PART 5 Previous editions are obsolete Page 35 form HUD D (Expiration Date: 10/31/2014)
177 PART 6: Annual Certification of Continued Usage for HOPWA Facility-Based Stewardship Units (ONLY) The Annual Certification of Usage for HOPWA Facility-Based Stewardship Units is to be used in place of Part 7B of the CAPER if the facility was originally acquired, rehabilitated or constructed/developed in part with HOPWA funds but no HOPWA funds were expended during the operating year. Scattered site units may be grouped together on one page. Grantees that used HOPWA funding for new construction, acquisition, or substantial rehabilitation are required to operate their facilities for HOPWA eligible individuals for at least ten (10) years. If non-substantial rehabilitation funds were used they are required to operate for at least three (3) years. Stewardship begins once the facility is put into operation. Note: See definition of Stewardship Units. 1. General information HUD Grant Number(s) Grantee Name Operating Year for this report From (mm/dd/yy) To (mm/dd/yy) Final Yr Yr 1; Yr 2; Yr 3; Yr 4; Yr 5; Yr 6; Yr 7; Yr 8; Yr 9; Yr 10; Date Facility Began Operations (mm/dd/yy) 2. Number of Units and Non-HOPWA Expenditures Facility Name: Total Stewardship Units (subject to 3- or 10- year use periods) 3. Details of Project Site Project Sites: Name of HOPWA-funded project Site Information: Project Zip Code(s) Site Information: Congressional District(s) Number of Stewardship Units Developed with HOPWA funds Amount of Non-HOPWA Funds Expended in Support of the Stewardship Units during the Operating Year Is the address of the project site confidential? If the site is not confidential: Please provide the contact information, phone, address/location, if business address is different from facility address Yes, protect information; do not list Not confidential; information can be made available to the public I certify that the facility that received assistance for acquisition, rehabilitation, or new construction from the Housing Opportunities for Persons with AIDS Program has operated as a facility to assist HOPWA-eligible persons from the date shown above. I also certify that the grant is still serving the planned number of HOPWA-eligible households at this facility through leveraged resources and all other requirements of the grant agreement are being satisfied. I hereby certify that all the information stated herein, as well as any information provided in the accompaniment herewith, is true and accurate. Name & Title of Authorized Official of the organization that continues Signature & Date (mm/dd/yy) to operate the facility: Name & Title of Contact at Grantee Agency (person who can answer questions about the report and program) Contact Phone (with area code) End of PART 6 Previous editions are obsolete Page 36 form HUD D (Expiration Date: 10/31/2014)
178 Part 7: Summary Overview of Grant Activities A. Information on Individuals, Beneficiaries, and Households Receiving HOPWA Housing Subsidy Assistance (TBRA, STRMU, Facility-Based Units, Permanent Housing Placement and Master Leased Units ONLY) Note: Reporting for this section should include ONLY those individuals, beneficiaries, or households that received and/or resided in a household that received HOPWA Housing Subsidy Assistance as reported in Part 3, Chart 1, Row 7, Column b. (e.g., do not include households that received HOPWA supportive services ONLY). Section 1. HOPWA-Eligible Individuals who Received HOPWA Housing Subsidy Assistance a. Total HOPWA Eligible Individuals Living with HIV/AIDS In Chart a., provide the total number of eligible (and unduplicated) low-income individuals living with HIV/AIDS who qualified their household to receive HOPWA housing subsidy assistance during the operating year. This total should include only the individual who qualified the household for HOPWA assistance, NOT all HIV positive individuals in the household. Individuals Served with Housing Subsidy Assistance Total Number of individuals with HIV/AIDS who qualified their household to receive HOPWA housing subsidy assistance. 508 Chart b. Prior Living Situation In Chart b., report the prior living situations for all Eligible Individuals reported in Chart a. In Row 1, report the total number of individuals who continued to receive HOPWA housing subsidy assistance from the prior operating year into this operating year. In Rows 2 through 17, indicate the prior living arrangements for all new HOPWA housing subsidy assistance recipients during the operating year. Data Check: The total number of eligible individuals served in Row 18 equals the total number of individuals served through housing subsidy assistance reported in Chart a. above. Total HOPWA Category Eligible Individuals Receiving Housing Subsidy Assistance 1. Continuing to receive HOPWA support from the prior operating year 338 New Individuals who received HOPWA Housing Subsidy Assistance support during Operating Year 2. Place not meant for human habitation (such as a vehicle, abandoned building, bus/train/subway station/airport, or outside) 6 3. Emergency shelter (including hotel, motel, or campground paid for with emergency shelter voucher) 9 4. Transitional housing for homeless persons 3 5. Total number of new Eligible Individuals who received HOPWA Housing Subsidy Assistance with a Prior Living Situation that meets HUD definition of homelessness (Sum of Rows 2 4) Permanent housing for formerly homeless persons (such as Shelter Plus Care, SHP, or SRO Mod 6. Rehab) 7. Psychiatric hospital or other psychiatric facility 8. Substance abuse treatment facility or detox center 9. Hospital (non-psychiatric facility) 10. Foster care home or foster care group home 11. Jail, prison or juvenile detention facility Rented room, apartment, or house House you own Staying or living in someone else s (family and friends) room, apartment, or house Hotel or motel paid for without emergency shelter voucher Other 17. Don t Know or Refused TOTAL Number of HOPWA Eligible Individuals (sum of Rows 1 and 5-17) Previous editions are obsolete Page 37 form HUD D (Expiration Date: 10/31/2014)
179 c. Homeless Individual Summary In Chart c., indicate the number of eligible individuals reported in Chart b., Row 5 as homeless who also are homeless Veterans and/or meet the definition for Chronically Homeless (See Definition section of CAPER). The totals in Chart c. do not need to equal the total in Chart b., Row 5. Category HOPWA eligible individuals served with HOPWA Housing Subsidy Assistance Number of Homeless Veteran(s) 3 17 Number of Chronically Homeless Section 2. Beneficiaries In Chart a., report the total number of HOPWA eligible individuals living with HIV/AIDS who received HOPWA housing subsidy assistance (as reported in Part 7A, Section 1, Chart a.), and all associated members of their household who benefitted from receiving HOPWA housing subsidy assistance (resided with HOPWA eligible individuals). Note: See definition of HOPWA Eligible Individual Note: See definition of Transgender. Note: See definition of Beneficiaries. Data Check: The sum of each of the Charts b. & c. on the following two pages equals the total number of beneficiaries served with HOPWA housing subsidy assistance as determined in Chart a., Row 4 below. a. Total Number of Beneficiaries Served with HOPWA Housing Subsidy Assistance Individuals and Families Served with HOPWA Housing Subsidy Assistance 1. Number of individuals with HIV/AIDS who qualified the household to receive HOPWA housing subsidy assistance (equals the number of HOPWA Eligible Individuals reported in Part 7A, Section 1, Chart a.) 2. Number of ALL other persons diagnosed as HIV positive who reside with the HOPWA eligible individuals identified in Row 1 and who benefitted from the HOPWA housing subsidy assistance 3. Number of ALL other persons NOT diagnosed as HIV positive who reside with the HOPWA eligible 371 individual identified in Row 1 and who benefited from the HOPWA housing subsidy 4. TOTAL number of ALL beneficiaries served with Housing Subsidy Assistance (Sum of Rows 1,2, & 3) 911 Total Number Previous editions are obsolete Page 38 form HUD D (Expiration Date: 10/31/2014)
180 b. Age and Gender In Chart b., indicate the Age and Gender of all beneficiaries as reported in Chart a. directly above. Report the Age and Gender of all HOPWA Eligible Individuals (those reported in Chart a., Row 1) using Rows 1-5 below and the Age and Gender of all other beneficiaries (those reported in Chart a., Rows 2 and 3) using Rows 6-10 below. The number of individuals reported in Row 11, Column E. equals the total number of beneficiaries reported in Part 7, Section 2, Chart a., Row 4. HOPWA Eligible Individuals (Chart a, Row 1) A. B. C. D. E. 1. Under to 30 years to 50 years years and Older Subtotal (Sum of Rows 1-4) 6. Under to 30 years to 50 years years and Older Subtotal (Sum of Rows 6-9) Male Female Transgender M to F Transgender F to M TOTAL (Sum of Columns A-D) All Other Beneficiaries (Chart a, Rows 2 and 3) A. B. C. D. E. Male Female Transgender M to F Transgender F to M TOTAL (Sum of Columns A-D) Total Beneficiaries (Chart a, Row 4) 11. TOTAL (Sum of Rows 5 & 10) Previous editions are obsolete Page 39 form HUD D (Expiration Date: 10/31/2014)
181 c. Race and Ethnicity* In Chart c., indicate the Race and Ethnicity of all beneficiaries receiving HOPWA Housing Subsidy Assistance as reported in Section 2, Chart a., Row 4. Report the race of all HOPWA eligible individuals in Column [A]. Report the ethnicity of all HOPWA eligible individuals in column [B]. Report the race of all other individuals who benefitted from the HOPWA housing subsidy assistance in column [C]. Report the ethnicity of all other individuals who benefitted from the HOPWA housing subsidy assistance in column [D]. The summed total of columns [A] and [C] equals the total number of beneficiaries reported above in Section 2, Chart a., Row 4. HOPWA Eligible Individuals All Other Beneficiaries Category [A] Race [all individuals reported in Section 2, Chart a., Row 1] [B] Ethnicity [Also identified as Hispanic or Latino] [C] Race [total of individuals reported in Section 2, Chart a., Rows 2 & 3] [D] Ethnicity [Also identified as Hispanic or Latino] 1. American Indian/Alaskan Native Asian Black/African American Native Hawaiian/Other Pacific Islander White American Indian/Alaskan Native & White Asian & White Black/African American & White American Indian/Alaskan Native & Black/African American Other Multi-Racial Column Totals (Sum of Rows 1-10) Data Check: Sum of Row 11 Column A and Row 11 Column C equals the total number HOPWA Beneficiaries reported in Part 3A, Section 2, Chart a., Row 4. *Reference (data requested consistent with Form HUD Race and Ethnic Data Reporting Form) Section 3. Households Household Area Median Income Report the area median income(s) for all households served with HOPWA housing subsidy assistance. Data Check: The total number of households served with HOPWA housing subsidy assistance should equal Part 3C, Row 7, Column b and Part 7A, Section 1, Chart a. (Total HOPWA Eligible Individuals Served with HOPWA Housing Subsidy Assistance). Note: Refer to for information on area median income in your community. Households Served with HOPWA Housing Subsidy Percentage of Area Median Income Assistance % of area median income (extremely low) % of area median income (very low) % of area median income (low) Total (Sum of Rows 1-3) 508 Previous editions are obsolete Page 40 form HUD D (Expiration Date: 10/31/2014)
182 Part 7: Summary Overview of Grant Activities B. Facility-Based Housing Assistance Complete one Part 7B for each facility developed or supported through HOPWA funds. Do not complete this Section for programs originally developed with HOPWA funds but no longer supported with HOPWA funds. If a facility was developed with HOPWA funds (subject to ten years of operation for acquisition, new construction and substantial rehabilitation costs of stewardship units, or three years for non-substantial rehabilitation costs), but HOPWA funds are no longer used to support the facility, the project sponsor or subrecipient should complete Part 6: Annual Certification of Continued Usage for HOPWA Facility-Based Stewardship Units (ONLY). Complete Charts 2a., Project Site Information, and 2b., Type of HOPWA Capital Development Project Units, for all Development Projects, including facilities that were past development projects, but continued to receive HOPWA operating dollars this reporting year. 1. Project Sponsor/Subrecipient Agency Name (Required) AID Upstate 2. Capital Development 2a. Project Site Information for HOPWA Capital Development of Projects (For Current or Past Capital Development Projects that receive HOPWA Operating Costs this reporting year) Note: If units are scattered-sites, report on them as a group and under type of Facility write Scattered Sites. Type of Development this operating year HOPWA Funds Expended this operating year (if applicable) Non-HOPWA funds Expended (if applicable) Name of Facility: The Laurel New construction $ $ Type of Facility [Check only one box.] Rehabilitation $ $ Acquisition $ $ Operating $152,967 $11,667 Permanent housing Short-term Shelter or Transitional housing Supportive services only facility a. Purchase/lease of property: Date (mm/dd/yy): b. Rehabilitation/Construction Dates: Date started: Date Completed: c. Operation dates: Date residents began to occupy: April 1, 2007 Not yet occupied d. Date supportive services began: Date started: April 1, 2007 Not yet providing services e. Number of units in the facility: HOPWA-funded units = 11 Total Units = 11 f. Is a waiting list maintained for the facility? g. What is the address of the facility (if different from business address)? 3 South Leach Street Yes No If yes, number of participants on the list at the end of operating year h. Is the address of the project site confidential? Yes, protect information; do not publish list No, can be made available to the public Previous editions are obsolete Page 41 form HUD D (Expiration Date: 10/31/2014)
183 2b. Number and Type of HOPWA Capital Development Project Units (For Current or Past Capital Development Projects that receive HOPWA Operating Costs this Reporting Year) For units entered above in 2a. please list the number of HOPWA units that fulfill the following criteria: Rental units constructed (new) and/or acquired with or without rehab Number Designated for the Chronically Homeless Number Designated to Assist the Homeless Number Energy- Star Compliant Number 504 Accessible Rental units rehabbed Homeownership units constructed (if approved) 3. Units Assisted in Types of Housing Facility/Units Leased by Project Sponsor or Subrecipient Charts 3a., 3b. and 4 are required for each facility. In Charts 3a. and 3b., indicate the type and number of housing units in the facility, including master leased units, project-based or other scattered site units leased by the organization, categorized by the number of bedrooms per unit. Note: The number units may not equal the total number of households served. Please complete separate charts for each housing facility assisted. Scattered site units may be grouped together. 3a. Check one only Permanent Supportive Housing Facility/Units Short-term Shelter or Transitional Supportive Housing Facility/Units 3b. Type of Facility Complete the following Chart for all facilities leased, master leased, project-based, or operated with HOPWA funds during the reporting year. Name of Project Sponsor/Agency Operating the Facility/Leased Units: Type of housing facility operated by the project sponsor/subrecipient a. Single room occupancy dwelling Total Number of Units in use during the Operating Year Categorized by the Number of Bedrooms per Units SRO/Studio/0 1 bdrm 2 bdrm 3 bdrm 4 bdrm 5+bdrm bdrm b. Community residence 1 c. Project-based rental assistance units or leased units d. Other housing facility Specify: 4. Households and Housing Expenditures Enter the total number of households served and the amount of HOPWA funds expended by the project sponsor/subrecipient on subsidies for housing involving the use of facilities, master leased units, project based or other scattered site units leased by the organization. Housing Assistance Category: Facility Based Housing a. Leasing Costs Output: Number of Households Output: Total HOPWA Funds Expended during Operating Year by Project Sponsor/subrecipient b. Operating Costs , c. Project-Based Rental Assistance (PBRA) or other leased units d. Other Activity (if approved in grant agreement) Specify: e. Adjustment to eliminate duplication (subtract) TOTAL Facility-Based Housing Assistance f. (Sum Rows a. through d. minus Row e.) , Previous editions are obsolete Page 42 form HUD D (Expiration Date: 10/31/2014)
184 Part 7: Summary Overview of Grant Activities B. Facility-Based Housing Assistance Complete one Part 7B for each facility developed or supported through HOPWA funds. Do not complete this Section for programs originally developed with HOPWA funds but no longer supported with HOPWA funds. If a facility was developed with HOPWA funds (subject to ten years of operation for acquisition, new construction and substantial rehabilitation costs of stewardship units, or three years for non-substantial rehabilitation costs), but HOPWA funds are no longer used to support the facility, the project sponsor or subrecipient should complete Part 6: Annual Certification of Continued Usage for HOPWA Facility-Based Stewardship Units (ONLY). Complete Charts 2a., Project Site Information, and 2b., Type of HOPWA Capital Development Project Units, for all Development Projects, including facilities that were past development projects, but continued to receive HOPWA operating dollars this reporting year. 1. Project Sponsor/Subrecipient Agency Name (Required) AID Upstate 2. Capital Development 2a. Project Site Information for HOPWA Capital Development of Projects (For Current or Past Capital Development Projects that receive HOPWA Operating Costs this reporting year) Note: If units are scattered-sites, report on them as a group and under type of Facility write Scattered Sites. Type of Development this operating year HOPWA Funds Expended this operating year (if applicable) Non-HOPWA funds Expended (if applicable) Name of Facility: Stephen s House New construction $ $ Type of Facility [Check only one box.] Rehabilitation $ $ Acquisition $ $ Operating $31, $26,927 Permanent housing Short-term Shelter or Transitional housing Supportive services only facility a. Purchase/lease of property: Date (mm/dd/yy): b. Rehabilitation/Construction Dates: Date started: Date Completed: c. Operation dates: Date residents began to occupy: Not yet occupied d. Date supportive services began: Date started: Not yet providing services e. Number of units in the facility: HOPWA-funded units = 6 Total Units = 6 f. Is a waiting list maintained for the facility? Yes No If yes, number of participants on the list at the end of operating year g. What is the address of the facility (if different from business address)? 200 West Earl Street, Greenville, SC h. Is the address of the project site confidential? Yes, protect information; do not publish list No, can be made available to the public Previous editions are obsolete Page 43 form HUD D (Expiration Date: 10/31/2014)
185 2b. Number and Type of HOPWA Capital Development Project Units (For Current or Past Capital Development Projects that receive HOPWA Operating Costs this Reporting Year) For units entered above in 2a. please list the number of HOPWA units that fulfill the following criteria: Rental units constructed (new) and/or acquired with or without rehab Number Designated for the Chronically Homeless Number Designated to Assist the Homeless Number Energy- Star Compliant Number 504 Accessible Rental units rehabbed Homeownership units constructed (if approved) 3. Units Assisted in Types of Housing Facility/Units Leased by Project Sponsor or Subrecipient Charts 3a., 3b. and 4 are required for each facility. In Charts 3a. and 3b., indicate the type and number of housing units in the facility, including master leased units, project-based or other scattered site units leased by the organization, categorized by the number of bedrooms per unit. Note: The number units may not equal the total number of households served. Please complete separate charts for each housing facility assisted. Scattered site units may be grouped together. 3a. Check one only Permanent Supportive Housing Facility/Units Short-term Shelter or Transitional Supportive Housing Facility/Units 3b. Type of Facility Complete the following Chart for all facilities leased, master leased, project-based, or operated with HOPWA funds during the reporting year. Name of Project Sponsor/Agency Operating the Facility/Leased Units: Type of housing facility operated by the project sponsor/subrecipient a. Single room occupancy dwelling Total Number of Units in use during the Operating Year Categorized by the Number of Bedrooms per Units SRO/Studio/0 1 bdrm 2 bdrm 3 bdrm 4 bdrm 5+bdrm bdrm b. Community residence 1 c. Project-based rental assistance units or leased units d. Other housing facility Specify: 4. Households and Housing Expenditures Enter the total number of households served and the amount of HOPWA funds expended by the project sponsor/subrecipient on subsidies for housing involving the use of facilities, master leased units, project based or other scattered site units leased by the organization. Housing Assistance Category: Facility Based Housing a. Leasing Costs Output: Number of Households Output: Total HOPWA Funds Expended during Operating Year by Project Sponsor/subrecipient b. Operating Costs 19 $31, c. Project-Based Rental Assistance (PBRA) or other leased units d. Other Activity (if approved in grant agreement) Specify: e. Adjustment to eliminate duplication (subtract) TOTAL Facility-Based Housing Assistance f. (Sum Rows a. through d. minus Row e.) 19 $31, Previous editions are obsolete Page 44 form HUD D (Expiration Date: 10/31/2014)
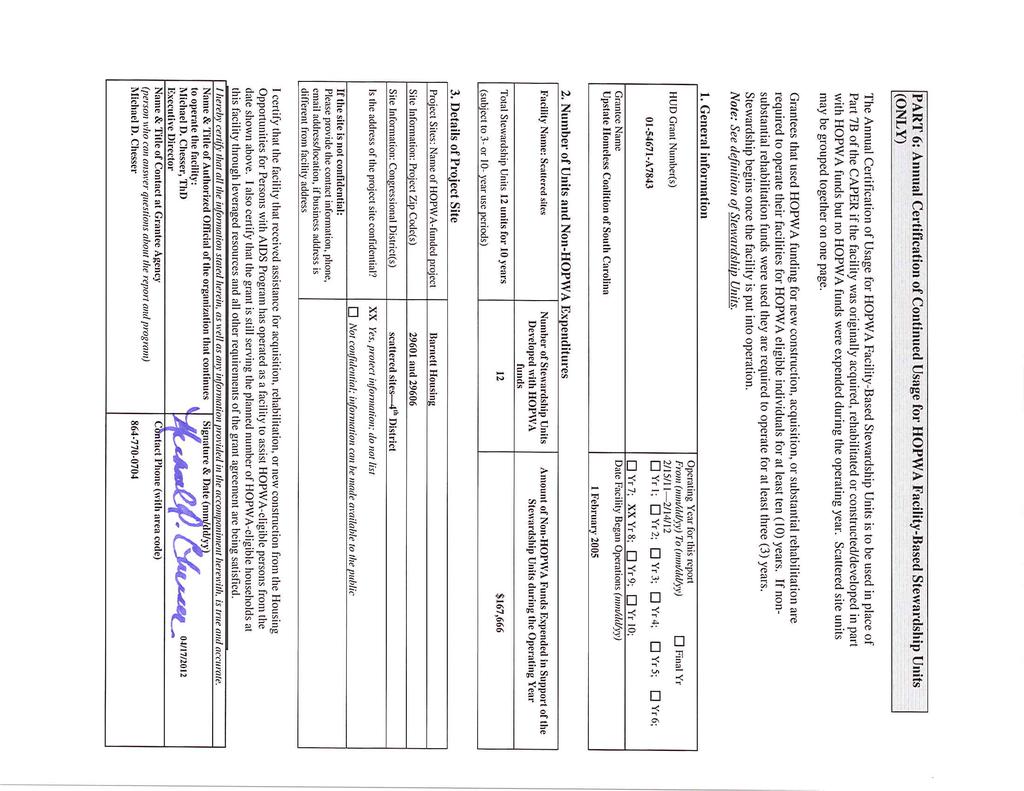
186
JOB DEVELOPMENT CREDIT
 SCEDA ECONOMIC DEVELOPMENT 101 May 8, 2014 NEXSEN PRUET April C. Lucas Tushar V. Chikhliker Nexsen Pruet, LLC Nexsen Pruet, LLC 1230 Main Street, Suite 700 1230 Main Street, Suite 700 Columbia, SC 29201
Executive Summary. AP 05 Executive Summary 24 CFR (c), (b) 1. Introduction
, (b) 1. Introduction") Executive Summary AP 05 Executive Summary 24 CFR 91.200(c), 91.220(b) 1. Introduction The South Carolina State Consolidated Plan encompasses five programs funded by the US Department of Housing and Urban
Executive Summary AP 05 Executive Summary 24 CFR 91.200(c), 91.220(b) 1. Introduction The South Carolina State Consolidated Plan encompasses five programs funded by the US Department of Housing and Urban
South Carolina s. Road Map to the Future
 South Carolina s Road Map to the Future S.C. BUSINESS ROUN DTABLE To Members of the General Assembly: On December, the below-named groups delivered a letter urging your attention to one of the most important,
2017 Election Calendar
 2017 Calendar Date of Number Name of Type of 07/11/2017 20457 12-CHESTER Fort Lawn Town Council Special Special 07/11/2017 20420 19-EDGEFIELD Edgefield Council Dist. 4 Special Special 07/18/2017 20448
Role of SAPT Block Grant in Non- Medicaid Expansion States
 Role of SAPT Block Grant in Non- Medicaid Expansion States Stephen L. Dutton, Chief of Staff Frankie Long, Treatment Director South Carolina Department of Alcohol and Other Drug Abuse Services (DAODAS)
Delivery Buddy: NRP Support via Telemedicine
 Delivery Buddy: NRP Support via Telemedicine Bridget Allen, RNC, MS Carley Howard, MD, FAAP 9/19/16 Introductions Bridget Allen RNC, MS Clemson University undergraduate and graduate school. Masters Maternal
OPERATIONS STATE EMERGENCY OPERATIONS CENTER (SEOC)
") OPERATIONS STATE EMERGENCY OPERATIONS CENTER (SEOC) OVERVIEW State Emergency Operations Center (SEOC) Purpose, and OPCONs Composition & Duties SEOC Information and Tasking Flow SEOC PURPOSE Multi Agency
OPERATIONS STATE EMERGENCY OPERATIONS CENTER (SEOC) OVERVIEW State Emergency Operations Center (SEOC) Purpose, and OPCONs Composition & Duties SEOC Information and Tasking Flow SEOC PURPOSE Multi Agency
PRECONSTRUCTION DIRECTOR OF PRECONSTRUCTION PRATT ROBERT I ROOM 425A UPSTATE LESTER MARK C
 PRECONSTRUCTION DIRECTOR OF PRECONSTRUCTION PRATT ROBERT I 803-737-1350 ROOM 425A PRECONSTRUCTION SUPPORT RIGHT OF WAY SURVEYS ENGINEER LIFSEY MATTHEW R METTS MITCHELL D YOUNG RANDALL L LESTER MARK C EARGLE
Executive Summary Consolidated Plan
 Executive Summary 2015-2019 Consolidated Plan ES-05 Executive Summary - 91.200(c), 91.220(b) 1. Introduction The Five-Year Consolidated Plan and Annual Action Plan meet the U. S. Department of Housing
BlueChoice HealthPlan Medicaid An Overview Community Outreach Perspective
 BlueChoice HealthPlan Medicaid An Overview Community Outreach Perspective 1 BlueChoice HealthPlan Medicaid In the Communities We Serve! 2 BlueChoice HealthPlan Medicaid Our focus is on preventive care.
COMMUNITY DEVELOPMENT BLOCK GRANT (CDBG) (Technical Assistance Program)
 (Technical Assistance Program)") COMMUNITY DEVELOPMENT BLOCK GRANT (CDBG) (Technical Assistance Program) Objective: Provides technical assistance to recipients of CDBG program funds. Administering Agency:, and Development NYS Object Code:
COMMUNITY DEVELOPMENT BLOCK GRANT (CDBG) (Technical Assistance Program) Objective: Provides technical assistance to recipients of CDBG program funds. Administering Agency:, and Development NYS Object Code:
FEMA CONGRESSIONAL ADVISORY November 14, 2016
 U.S. Department of Homeland Security Federal Emergency Management Agency DR-4286-SC Congressional Affairs Telephone 202-445-8820 FEMA CONGRESSIONAL ADVISORY November 14, 2016 Contents Key messages Disaster
Michael McInerney, Director of External Affairs South Carolina Department of Commerce
 Henry McMaster SOUTH CAROLINA Robert M. Hitt III G o v e r n o r D E P A R T M E N T O F C O M M E R C E S e c r e t a r y TO: FROM: Michael McInerney, Director of External Affairs South Carolina Department
ANNEX 1-Basic Plan ALERT AND NOTIFICATION PROCEDURES APPENDIX 2
 ANNEX 1-Basic Plan ALERT AND NOTIFICATION PROCEDURES APPENDIX 2 I. INTRODUCTION Nuclear Power Plant (NPP) licensees in conjunction with state and local emergency management organizations have established
CCL E-News & E-Notes
 Serving Children and Families New Online Payment System Child Care Licensing will unveil a new online fee payment system on April 23. You will be able to pay Licensing Fees, Central Registry Fees, and
State of West Virginia Consolidated Annual Action Plan
 State of West Virginia Consolidated West Virginia Development Office West Virginia Housing Development Fund Fiscal Year Draft Date: March 23, 1 Executive Summary AP-05 Executive Summary - 24 CFR 91.200(c),
FY Consolidated Plan Budget Development
 FY 2018-19 Consolidated Plan Budget Development Chan Williams, Assistant Director Office of Budget, Grant Administration M. Elizabeth Reich, Chief Financial Officer Jack Ireland, Director, Office of Budget
SUMMARY OF ELIGIBLE AND INELIGIBLE COMMUNITY DEVELOPMENT BLOCK GRANT PROGRAM ACTIVITIES
 ATTACHMENT D-1 SUMMARY OF ELIGIBLE AND INELIGIBLE COMMUNITY DEVELOPMENT BLOCK GRANT PROGRAM ACTIVITIES This is a summary of the activities that are eligible and ineligible for assistance under the Community
Annual Action Plan 2018
 1 The goals of the State are to provide decent housing, a suitable living environment and expanded economic opportunities for low and moderate-income residents. The State strives to accomplish these goals
Virginia s National Housing Trust Fund Allocation Plan 2016 DRAFT
 Virginia s National Housing Trust Fund Allocation Plan 2016 DRAFT Background The National Housing Trust Fund (NHTF) is a dedicated fund that will provide resources to build, preserve, and rehabilitate
Community Development Block Grant
 Community Development Block Grant Program Description Program Year April 1, 2018 - March 31, 2019 State of South Carolina Department of Commerce Grants Administration State of South Carolina Department
Executive Summary... 2 AP-05 Executive Summary - 24 CFR (c), (b) PR-05 Lead & Responsible Agencies (b)...
, (b) PR-05 Lead & Responsible Agencies (b)...") Contents Executive Summary... 2 AP-05 Executive Summary - 24 CFR 91.200(c), 91.220(b)... 2 PR-05 Lead & Responsible Agencies - 91.300(b)... 7 AP-12 Participation - 91.115, 91.300(c)... 14 Expected Resources...
Contents Executive Summary... 2 AP-05 Executive Summary - 24 CFR 91.200(c), 91.220(b)... 2 PR-05 Lead & Responsible Agencies - 91.300(b)... 7 AP-12 Participation - 91.115, 91.300(c)... 14 Expected Resources...
Executive Summary. 2. Summarize the objectives and outcomes identified in the Plan
 The purpose of this new plan and substantial amendments to the State of Florida's 5-year Consolidated Plan and for is to include the new National Housing Trust Fund (NHTF) program as part of the suite
Community Development Block Grant (CDBG) Program
 Program") The information provided here is for informational and educational purposes and current as of the date of publication. The information is not a substitute for legal advice and does not necessarily reflect
The information provided here is for informational and educational purposes and current as of the date of publication. The information is not a substitute for legal advice and does not necessarily reflect
Managing CDBG. A Guidebook for Grantees on Subrecipient Oversight. U.S. Department of Housing and Urban Development
 U.S. Department of Housing and Urban Development Office of Community Planning and Development Community Development Block Grant Program Managing CDBG A Guidebook for Grantees on Subrecipient Oversight
Surveillance, Outcomes Assessment, and Intervention Capacity
 Surveillance, Outcomes Assessment, and Intervention Capacity Participant Identification Surveillance SCI Association Clinical Center Pilot studies Project grants Bench Science/ Mechanistic Clinical and
2016 Community Development Block Grant (CDBG) General Information
 General Information") Housing & Community Development Services 1690 W. Littleton Blvd. Suite 300 Littleton, CO 80120 (303) 738-8040 2016 Community Development Block Grant (CDBG) General Information The Community Development
Housing & Community Development Services 1690 W. Littleton Blvd. Suite 300 Littleton, CO 80120 (303) 738-8040 2016 Community Development Block Grant (CDBG) General Information The Community Development
Horry County Community Development 1515 Fourth Avenue Conway, SC 29526
 Community Development Block Grant Program Year 2017 2018 Application Instruction Booklet Horry County Community Development 1515 Fourth Avenue Conway, SC 29526 www.horrycounty.org 843 915 7033 CDBG GRANT
2017 CDBG Applica on Guidelines. State of South Carolina Community Development Block Grant Program
 2017 CDBG Applicaon Guidelines State of South Carolina Community Development Block Grant Program State of South Carolina Community Development Block Grant Program 2017 Application Guidelines State of South
NEW YORK STATE Annual Action Plan Program Year 2012
 NEW YORK STATE Annual Action Plan Program Year 2012 As Accepted by U.S. Department of Housing and Urban Development December 28, 2011 NEW YORK STATE DIVISION OF HOUSING AND COMMUNITY RENEWAL NEW YORK STATE
Program Year 2019 Grant Application Overview
 Program Year 2019 Grant Application Overview 192 Anderson Street, Suite 150, Marietta GA 30060 Ph: 770-528-1455; Fax: 770-528-1466 Kimberly Roberts, Ph.D. Managing Director Rabihah Walker Deputy Director
City of Los Angeles, Consolidated Annual Performance and Evaluation Report, Program
 SECTION IX LEVERAGING OF RESOURCES This section provides an overview of leveraging of Consolidated Plan funds from the perspective of overall city activities. Earlier in the CAPER report, individual leveraging
ANNE ARUNDEL COUNTY. ACTIVITY RECOMMENDATION FORM for CAPITAL PROJECTS LOCAL FISCAL YEAR 2017
 ARUNDEL COMMUNITY DEVELOPMENT SERVICES, INC. ANNE ARUNDEL COUNTY ACTIVITY RECOMMENDATION FORM for CAPITAL PROJECTS LOCAL FISCAL YEAR 2017 Community Development Block Grant (CDBG) Program Home Investment
COSCDA Federal Advocacy Priorities for Fiscal Year 2008
 COSCDA Federal Advocacy Priorities for Fiscal Year 2008 The Council of State Community Development Agencies (COSCDA) represents state community development and housing agencies responsible for administering
Welcome and Introductions. Iris Payne Programs and Compliance Section Chief
 Welcome and Introductions Iris Payne Programs and Compliance Section Chief Mission Statement: To improve the economic well-being and quality of life for all North Carolinians. Maximum Feasible Deference
State of Tennessee Annual Action Plan
 State of Tennessee 2018-19 Annual Action Plan Executive Summary AP-05 Executive Summary - 24 CFR 91.200(c), 91.220(b) 1. Introduction The Annual Action Plan serves as the State of Tennessee s annual application
II. PROPOSED PROGRAM YEAR 2018 ACTION PLAN SUMMARY:
 CITY OF MOBILE COMMUNITY DEVELOPMENT PROGRAM FIVE YEAR CONSOLIDATED PLAN PY 2018-2022 (MAY 1, 2018-APRIL 30, 2023) ANNUAL ACTION PLAN PY 2018 (MAY 1, 2018-APRIL 30, 2019) ACTION PLAN-ONE YEAR USE OF FUNDS
NEW YORK STATE Annual Action Plan Program Year 2015
 NEW YORK STATE Annual Action Plan Program Year 2015 As Accepted by U.S. Department of Housing and Urban Development NEW YORK STATE DIVISION OF HOUSING AND COMMUNITY RENEWAL NEW YORK STATE HOUSING TRUST
Community Development Grants Administration Proposed Funding Allocation Plan (FAP)
") City of Milwaukee - Community Development Grants Administration 2009 Proposed Funding Allocation Plan (FAP) NOTICE OF POSSIBLE FUNDING REDUCTION This disclaimer serves as notice to all recipients of funding
City of Milwaukee - Community Development Grants Administration 2009 Proposed Funding Allocation Plan (FAP) NOTICE OF POSSIBLE FUNDING REDUCTION This disclaimer serves as notice to all recipients of funding
Community Development Block Grant Program Year Application Instruction Booklet
 Community Development Block Grant Program Year 2016-2017 Application Instruction Booklet Horry County Community Development Block Grant Office 1515 Fourth Avenue Conway, SC 29526 www.horrycounty.org 843-915-7033
CDBG & HOME Proposed Programming for the FY 2018 Annual Action Plan
 CDBG & HOME Proposed ming for the FY 2018 Annual Action Plan City of Jamestown, NY Jamestown City Council Public Hearing June 4 th, 2018 at 6:30pm City Council Chambers, Municipal Building Annual Plan
New Castle County, Department of Community Services Consolidated Five Year Plan for
 New Castle County, Department of Community Services Consolidated Five Year Plan for 2015-2020 November 13, 2014 Bear Library November 14, 2014 Multi-Purpose Room In Conjunction with the Action Plan Funding
Executive Summary. AP-05 Executive Summary - 24 CFR (c), (b) 1. Introduction
, (b) 1. Introduction") Executive Summary AP-05 Executive Summary - 24 CFR 91.200(c), 91.220(b) 1. Introduction The U.S. Department of Housing and Urban Development (HUD) has designated the City of McKinney as a grantee recipient
Executive Summary AP-05 Executive Summary - 24 CFR 91.200(c), 91.220(b) 1. Introduction The U.S. Department of Housing and Urban Development (HUD) has designated the City of McKinney as a grantee recipient
SELLING TO THE STATE OF SOUTH CAROLINA. Voight Shealy State Materials Management Officer Budget and Control Board
 SELLING TO THE STATE OF SOUTH CAROLINA Voight Shealy State Materials Management Officer Budget and Control Board Application of the SC Procurement Code This code applies to every procurement or expenditure
City of Trenton Department of Housing & Economic Development
 City of Trenton Department of Housing & Economic Development Public Hearing Community Development Block Grant HOME Investment Partnerships Program Emergency Solutions Grant February 5, 2018 Agenda Background
What is the Community Development Block Grant Program (CDBG)?
?") What is the Community Development Block Grant Program (CDBG)? The Community Development Block Grant (CDBG) is a federal grant program administered by the U.S. Department of Housing and Urban Development
What is the Community Development Block Grant Program (CDBG)? The Community Development Block Grant (CDBG) is a federal grant program administered by the U.S. Department of Housing and Urban Development
2018 Community Development Block Grant (CDBG) General Information
 General Information") Housing & Community Development Services 1690 W. Littleton Blvd. Suite 300 Littleton, CO 80120 (303) 738-8040 2018 Community Development Block Grant (CDBG) General Information The Community Development
Housing & Community Development Services 1690 W. Littleton Blvd. Suite 300 Littleton, CO 80120 (303) 738-8040 2018 Community Development Block Grant (CDBG) General Information The Community Development
City of Coeur d Alene Community Development Block Grant 2017 Community Opportunity Grant Application Guidelines
 City of Coeur d Alene Community Development Block Grant 2017 Community Opportunity Grant Application Guidelines Dear Interested Applicant: The City of Coeur d Alene is currently accepting applications
Annual Action Plan 2016
 1 Executive Summary AP-05 Executive Summary - 24 CFR 91.200(c), 91.220(b) 1. Introduction The (AAP) is the annual implementation of the Five Year Consolidated Plan for the U.S. Depaertment of Housing and
GWINNETT COUNTY, GEORGIA APPLICATION MANUAL FOR HUD ENTITLEMENT GRANT PROGRAMS
 GWINNETT COUNTY, GEORGIA APPLICATION MANUAL FOR HUD ENTITLEMENT GRANT PROGRAMS HOME PROGRAM FISCAL YEAR 2012 APPLICATION PICKUP/SUBMISSION LOCATION: GWINNETT COUNTY COMMUNITY DEVELOPMENT PROGRAM 575 OLD
AP 15 Expected Resources (c)(1,2) Introduction. FFY 2018 formula grant amounts are somewhat higher than FFY 2017 levels.
(1,2) Introduction. FFY 2018 formula grant amounts are somewhat higher than FFY 2017 levels.") Please note: The substantial amendment to the approved 2018 Action Plan simply restores the potential use of HOME Investment Partnership funds for Special Needs Housing. Language added to reflect that
Please note: The substantial amendment to the approved 2018 Action Plan simply restores the potential use of HOME Investment Partnership funds for Special Needs Housing. Language added to reflect that
Mecklenburg County Community Development Block Grant (CDBG) FY 2018 Notice of Funding Availability
 FY 2018 Notice of Funding Availability") Mecklenburg County is preparing for its FY 2017-2018 Community Development Block Grant Program Annual Action Plan and Funding Allocation. As an Entitlement County, it anticipates receiving approximately
Mecklenburg County is preparing for its FY 2017-2018 Community Development Block Grant Program Annual Action Plan and Funding Allocation. As an Entitlement County, it anticipates receiving approximately
CITIZEN PARTICIPATION PLAN
 CITY OF BOISE, IDAHO CITIZEN PARTICIPATION PLAN HOUSING & COMMUNITY DEVELOPMENT DIVISION 1025 SOUTH CAPITOL BOULEVARD BOISE, ID 83706-3000 (208) 384-4158 IDAHO RELAY SERVICE DIAL 7-1-1 OR SPECIAL TOLL
City of Trenton Department of Housing & Economic Development
 City of Trenton Department of Housing & Economic Development Application workshop for: Community Development Block Grant HOME Investment Partnerships Program Emergency Solutions Grant December 14, 2016
CHAPTER 2: ACTIVITY SELECTION AND IMPLEMENTATION
 CHAPTER 2: ACTIVITY SELECTION AND IMPLEMENTATION CHAPTER PURPOSE & CONTENTS This chapter provides an overview of the framework within which states must make decisions concerning activities and units of
Fiscal Year ANNUAL ACTION PLAN (AAP) October 1, 2018 to September 30, 2019
 October 1, 2018 to September 30, 2019") 5790 Margate Boulevard Margate, FL 33063 Fiscal Year 2019 ANNUAL ACTION PLAN (AAP) October 1, to September 30, 2019 Board of City Commissioners Arlene R. Schwartz, Mayor Anthony N. Caggiano, Vice Mayor
5790 Margate Boulevard Margate, FL 33063 Fiscal Year 2019 ANNUAL ACTION PLAN (AAP) October 1, to September 30, 2019 Board of City Commissioners Arlene R. Schwartz, Mayor Anthony N. Caggiano, Vice Mayor
Annual Action Plan 2016
 1 Executive Summary AP-05 Executive Summary - 24 CFR 91.200(c), 91.220(b) 1. Introduction The (AAP) is the annual implementation of the Five Year Consolidated Plan for the U. S. Department of Housing and
CITY OF CHINO HILLS COMMUNITY DEVELOPMENT BLOCK GRANT PROGRAM
 CITY OF CHINO HILLS COMMUNITY DEVELOPMENT BLOCK GRANT PROGRAM PROGRAM YEAR 2016-17 APPLICATION INFORMATION BOOKLET COMMUNITY SERVICES DEPARTMENT CITY OF CHINO HILLS COMMUNITY DEVELOPMENT BLOCK GRANT PROGRAM
Office of Community & Economic Development Fiscal Year 2019 Budget Presentation
 Office of Community & Economic Development Fiscal Year 2019 Budget Presentation Office of Community & Economic Development The City of Clarksville is an Entitlement City according to the U.S. Department
TOWN OF BARNSTABLE COMMUNITY DEVELOPMENT BLOCK GRANT PROGRAM (CDBG) CONSOLIDATED ANNUAL PERFORMANCE EVALUATION (CAPER) PROGRAM YEAR 2015
 CONSOLIDATED ANNUAL PERFORMANCE EVALUATION (CAPER) PROGRAM YEAR 2015") TOWN OF BARNSTABLE COMMUNITY DEVELOPMENT BLOCK GRANT PROGRAM (CDBG) CONSOLIDATED ANNUAL PERFORMANCE EVALUATION (CAPER) PROGRAM YEAR 2015 JULY 1, 2015 JUNE 30, 2016 DRAFT GRANTEE: LEAD AGENCY: ADDRESS:
TOWN OF BARNSTABLE COMMUNITY DEVELOPMENT BLOCK GRANT PROGRAM (CDBG) CONSOLIDATED ANNUAL PERFORMANCE EVALUATION (CAPER) PROGRAM YEAR 2015 JULY 1, 2015 JUNE 30, 2016 DRAFT GRANTEE: LEAD AGENCY: ADDRESS:
SAN IPSE CAPITAL OF SILICON VALLEY
 CITY OF 2 SAN IPSE CAPITAL OF SILICON VALLEY TO: HONORABLE MAYOR AND CITY COUNCIL COUNCIL AGENDA: 9/15/15 ITEM: ^ ^ Memorandum FROM: Jacky Morales-Ferrand SUBJECT: SEE BELOW DATE: Approved Date f/z/'s'
North Carolina. Annual Action Plan. Presented to the U. S. Department of Housing and Urban Development
 North Carolina 2015 Annual Action Plan Presented to the U. S. Department of Housing and Urban Development Developed By: North Carolina Department of Commerce Division of Community Assistance North Carolina
CITY OF PERRIS. F Y Consolidated Annual Performance and REPORT PERIOD: JULY 1, JUNE 30, 2014 PRESENTED TO:
 CITY OF PERRIS F Y 2 3-24 Consolidated Annual Performance and E v a l u a t i o n R e p o r t ( C A P E R ) REPORT PERIOD: JULY, 23 - JUNE 3, 24 PRESENTED TO: United States Department of Housing and Urban
Alameda County Housing and Community Development Department Citizen Participation Plan
 Alameda County Housing and Community Development Department Revised 7/10/12 Table of Contents Introduction 3 General 3 I. Purpose and Goals 3 II. General Approach to Citizen Participation..4 A. Open Participation...4
ARLINGTON COUNTY, VIRGINIA
 ARLINGTON COUNTY, VIRGINIA County Board Agenda Item Meeting of April 22, 2006 DATE: March 30, 2006 SUBJECT: Approval of the County s Annual Consolidated Plan for Fiscal Year (FY) 2007, which includes the
EMERGENCY SOLUTIONS AND COMMUNITY DEVELOPMENT BLOCK GRANT PROGRAM APPLICATION FOR FUNDING PROGRAM YEAR FY 18/19
 The Department of Housing and Neighborhood Preservation 2408 Courthouse Drive Building 21, Room 144 Virginia Beach, VA 23456 757-385-5750 EMERGENCY SOLUTIONS AND COMMUNITY DEVELOPMENT BLOCK GRANT PROGRAM
May 2017 BlueNewsSM. Realignment within the BlueCross BlueShield and BlueChoice Health Plan Provider Relations and Education Team
 May 2017 BlueNewsSM for Providers The Wait Is Over! Benefit Update Meeting Winners CMS Validation Program Returns Frequently Asked Questions Claims and Billing Minute Featured Webinar Important Reminders
HOME Investment Partnerships APPLICATION
 PY 2016 APPLICATION CYCLE APPLICATION CDBG PROGRAM OFFICE 121 Haynes Street, Marietta, GA 30060 Submission Requirements 2016 Application Instructions INTRODUCTION The Program (HOME) provides formula grants
CONSOLIDATED PLAN 2017 Annual Action Plan
 2015-2020 CONSOLIDATED PLAN 2017 Annual Action Plan MORGAN COUNTY TOOELE COUNTY WEBER COUNTY Prepared by the Wasatch Front Regional Council for the Utah Small Cities Community Development Block Grant (CDBG)
DRAFT NEW HAMPSHIRE 2017 ACTION PLAN
 DRAFT NEW HAMPSHIRE 2017 ACTION PLAN OMB Control No: 2506-0117 (exp. 07/31/2015) Annual Action Plan 2017 Contents Executive Summary... 1 AP-05 Executive Summary - 24 CFR 91.200(c), 91.220(b)... 1 PR-05
CITY OF PORT HURON COMMUNITY DEVELOPMENT DIVISION CONSOLIDATED ANNUAL PERFORMANCE EVALUATION REPORT (CAPER)
") CITY OF COMMUNITY DEVELOPMENT DIVISION CONSOLIDATED ANNUAL PERFORMANCE EVALUATION REPORT (CAPER) (JULY 1, 214 TO JUNE 3, 215) 214 PROGRAM YEAR DRAFT Fifth Program Year CAPER The CPMP Consolidated Annual
CITY OF COMMUNITY DEVELOPMENT DIVISION CONSOLIDATED ANNUAL PERFORMANCE EVALUATION REPORT (CAPER) (JULY 1, 214 TO JUNE 3, 215) 214 PROGRAM YEAR DRAFT Fifth Program Year CAPER The CPMP Consolidated Annual
CHAPTER 2: ACTIVITY SELECTION AND IMPLEMENTATION
 CHAPTER 2: ACTIVITY SELECTION AND IMPLEMENTATION CHAPTER PURPOSE & CONTENTS This chapter provides an overview of the framework within which grantees must make decisions concerning activities and organizations
Housing and Community Development Division 525 East South Street Orlando, FL 32801
 216-217 217 CONSOLIDATED ANNUAL PERFORMANCE AND EVALUATION REPORT (CAPER) EXECUTIVE SUMMARY Housing and Community Development Division 525 East South Street Orlando, FL 3281 ORANGE COUNTY CONSOLIDATED
The State of Iowa Consolidated Plan for Housing & Community Development ANNUAL ACTION PLAN: 2015
 The State of Iowa Consolidated Plan for Housing & Community Development ANNUAL ACTION PLAN: 2015 Iowa Economic Development Authority November 2014 INTRODUCTION/EXECUTIVE SUMMARY... 1 CITIZEN PARTICIPATION...
City of Alexandria Annual Action Plan
 City of Alexandria 2017-2018 Annual Action Plan Community Development Block Grant and HOME Investment Partnership Act Programs Prepared for submission to the U.S. Dept. of HUD By the City of Alexandria,
FLEET STREET NEWS. G reetings Fellow. From the President s Desk...
 Volume 6, Issue 1 Spring 2012 Post Office Box 7824 Columbia, SC 29202 S o u t h e a s t G o v e r n m e n t a l F l e e t M a n a g e r s A s s o c i a t i o n FLEET STREET NEWS INSIDE THIS ISSUE: 2012
CHAPTER 9: OTHER ELIGIBLE ACTIVITIES
 CHAPTER 9: OTHER ELIGIBLE ACTIVITIES CHAPTER PURPOSE & CONTENTS This chapter provides grantees with general information on other CDBG-eligible activities. The chapter covers: SECTION TOPIC PAGE 9.1 Interim
TOWN OF BARNSTABLE COMMUNITY DEVELOPMENT BLOCK GRANT PROGRAM (CDBG) CONSOLIDATED ANNUAL PERFORMANCE EVALUATION (CAPER) PROGRAM YEAR 2015
 CONSOLIDATED ANNUAL PERFORMANCE EVALUATION (CAPER) PROGRAM YEAR 2015") TOWN OF COMMUNITY DEVELOPMENT BLOCK GRANT PROGRAM (CDBG) CONSOLIDATED ANNUAL PERFORMANCE EVALUATION (CAPER) PROGRAM YEAR 215 JULY 1, 215 JUNE 3, 216 DRAFT GRANTEE: LEAD AGENCY: ADDRESS: TOWN OF TOWN OF
TOWN OF COMMUNITY DEVELOPMENT BLOCK GRANT PROGRAM (CDBG) CONSOLIDATED ANNUAL PERFORMANCE EVALUATION (CAPER) PROGRAM YEAR 215 JULY 1, 215 JUNE 3, 216 DRAFT GRANTEE: LEAD AGENCY: ADDRESS: TOWN OF TOWN OF
FISCAL YEAR 2018/2019 APPLICATION FOR FUNDING
 FISCAL YEAR 2018/2019 APPLICATION FOR FUNDING COMMUNITY DEVELOPMENT BLOCK GRANT (CDBG) CFDA # 14.218 HOME INVESTMENT PARTNERSHIP (HOME) - CFDA # 14.239 EMERGENCY SOLUTIONS GRANT PROGRAMS (ESG) - CFDA #
Community Development Block Grant Program FFY 2014 Annual Action Plan
 Community Development Block Grant Program FFY 2014 Annual Action Plan Prepared By: Town of Union Planning Department Paul A. Nelson, Director 3111 East Main Street Endwell, New York 13760 Approved By Town
2. Nature and Reasons For Any Changes In Program Objectives and Indicate How the County Would Change Its Programs As A Result Of Its Experiences
 SECTION V: PROGRAM'S PERFORMANCE A. Community Development Block Grant Performance 1. Assessment Of Relationship Of the Use Of CDBG Funds To the Priorities, Needs, Goals, and Objectives Identified In the
Applications Must Be Typed In Entirety No Applications With Any Handwritten Entries Will Be Accepted Excluding Signatures and Check Boxes
 APPLICATION INSTRUCTIONS COMMUNITY DEVELOPMENT BLOCK GRANT (CDBG) AND HOME INVESTMENT PARTNERSHIP (HOME) PROGRAMS Program Year 2018 January 1, 2018 December 31, 2018 Applications Must Be Typed In Entirety
Community Development Plan
 Community Development Plan This chapter provides an overview of the federal Community Development Block Grant Program as well as Washington County s CDBG program by providing a summary of Washington County
State of Tennessee Annual Action Plan Fiscal Year For Housing and Community Development Programs. Year 3
 State of Tennessee ------ Annual Action Plan Fiscal Year 2017-18 ------ For Housing and Community Development Programs Year 3 State of Tennessee Annual Action Plan Executive Summary AP 05 Executive Summary
City of Tyler Housing Agency s FY FY Year Plan
 City of Tyler Housing Agency s FY 2015- FY 2019 5-Year Plan City of Tyler Housing Agency s FY 2015 - FY 2019 5-Year Plan This section defines the quantifiable accomplishments of the goals and objectives
2016 Legislative Report for the Transportation Alternatives Program
 2016 Legislative Report for the Transportation Alternatives Program Introduction: The Transportation Alternatives Program (TAP) was authorized by the Federal transportation funding Act - the Moving Ahead
COMMUNITY DEVELOPMENT BLOCK GRANT APPLICATION PACKET
 COMMUNITY DEVELOPMENT PROGRAM 70 Church Street, White Plains, New York 10601 (914) 422-1300 E-Mail: planning@whiteplainsny.gov THOMAS M. ROACH MAYOR CHRISTOPHER N. GOMEZ COMMISSIONER LINDA K. PUOPLO DEPUTY
CITY OF HUNTINGTON BEACH. Action Plan FY
 Action Plan FY 2014-2015 Community Development Block Grant HOME Investment Partnership Submitted to the U.S. Department of Housing and Urban Development City Council Matthew M. Harper, Mayor Joe Shaw,
County of Union We re Connected to You!
 COUNTY OF UNION Community Development Block Grant County of Union We re Connected to You! Department of ECONOMIC DEVELOPMENT 10 Elizabethtown Plaza Elizabeth, NJ 07207 908-527- 4086 (phone) 908-527- 4715
City of Alameda Program Guidelines for CDBG FY18-19
 Notice of Funding Availability Request for Proposal (NOFA/RFP) Community Development Block Grant (CDBG) & HOME Investment Partnerships Program (HOME) Program Guidelines July 1, 2018 - June 30, 2019 City
NEW HAMPSHIRE CODE OF ADMINISTRATIVE RULES TABLE OF CONTENTS
 TABLE OF CONTENTS CHAPTER Cdfa 300 COMMUNITY DEVELOPMENT BLOCK GRANT RULES PART Cdfa 301 PURPOSE AND SCOPE Section Cdfa 301.01 CDBG Program Structure; Role of the Community Development Finance Authority
Action Plan. City of West Palm Beach 2017 Action Plan 3rd Year
 2017 Action Plan 3rd Year Table of Content AP-05 Executive Summary. 2 AP-05 Lead & Responsible Agencies. 4 PR-10 Consultation...... 5 AP-12 Participation...... 7 AP-15 Expected Resources.. 8 AP-20 Annual
Narrative Responses GENERAL. Executive Summary
 Fifth Program Year Action Plan The CPMP Fifth Annual Action Plan includes the SF 424 and Narrative Responses to Action Plan questions that CDBG, HOME, HOPWA, and ESG grantees must respond to each year
COMMUNITY DEVELOPMENT BLOCK GRANT PROGRAM HOME INVESTMENT PARTNERSHIPS PROGRAM FISCAL YEAR 2016 APPLICATION PACKAGE
 COMMUNITY DEVELOPMENT BLOCK GRANT PROGRAM HOME INVESTMENT PARTNERSHIPS PROGRAM FISCAL YEAR 2016 APPLICATION PACKAGE Introduction This package contains materials needed to apply for City of Chester CDBG
Town of Apple Valley
 Town of Apple Valley Adopted Action Plan Fiscal Year 2008-2009 Contact: Cindy Amagrande, Housing & Community Development Specialist II Town of Apple Valley, Economic Development Department 14955 Dale Evans
Community Development Block Grant (CDBG)
") February 22, 2016 U.S. Department of Housing and Urban Development Community Planning & Development Division Region IV, Miami Field Office Brickell Plaza Federal Building 909 SE First Avenue, Room 500
February 22, 2016 U.S. Department of Housing and Urban Development Community Planning & Development Division Region IV, Miami Field Office Brickell Plaza Federal Building 909 SE First Avenue, Room 500
Annual Action Plan Executive Summary. 1. Introduction
 CITY OF PAWTUCKET Draft Annual Action Plan FY 2017 (July 1, 2017- June 30, 2018) for the Community Development Block Grant Program HOME Investment Partnership Program Emergency Solutions Grant Program
FINAL 2017 CDBG PROGRAM RULES
 FINAL 2017 CDBG PROGRAM RULES TO: FROM: All HCPC Municipalities and Hancock County Tom Martin, Executive Director DATE: December 15, 2016 RE: 2017 Program Summary This memorandum describes the final 2017
CONSOLIDATED HOUSING AND COMMUNITY DEVELOPMENT PLAN FOR THE STATE OF ALASKA ANNUAL ACTION PLAN. State Fiscal Year 2018 (Federal Fiscal Year 2017)
") CONSOLIDATED HOUSING AND COMMUNITY DEVELOPMENT PLAN FOR THE STATE OF ALASKA ANNUAL ACTION PLAN State Fiscal Year 2018 (Federal Fiscal Year 2017) May 15, 2017 Table of Contents ES-05 Executive Summary -
CONSOLIDATED HOUSING AND COMMUNITY DEVELOPMENT PLAN FOR THE STATE OF ALASKA ANNUAL ACTION PLAN State Fiscal Year 2018 (Federal Fiscal Year 2017) May 15, 2017 Table of Contents ES-05 Executive Summary -
Narrative Responses $559,603 $16,090 $7,105 $582,798
 First Program Year Action Plan The CPMP First Annual Action Plan includes the SF 424 and Narrative Responses to Action Plan questions that CDBG, HOME, HOPWA, and ESG grantees must respond to each year