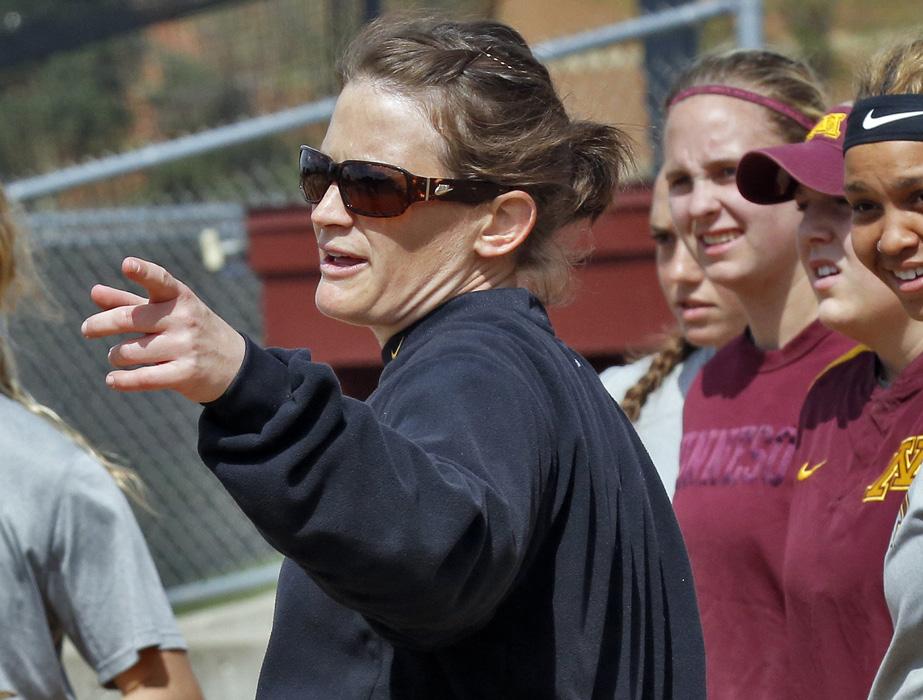
Head Coaches of Women's Collegiate Teams A REPORT ON SELECT NCAA DIVISION-I MID-MAJOR CONFERENCE MEMBER INSTITUTIONS
|
|
|
- Belinda Glenn
- 6 years ago
- Views:
Transcription
1 Head Coaches of Women's Collegiate Teams A REPORT ON SELECT NCAA DIVISION-I MID-MAJOR CONFERENCE MEMBER INSTITUTIONS


2 www. TuckerCenter. org facebook.com/tuckercenter facebook.com/allianceofwomencoaches This report was prepared by Nicole M. LaVoi, Ph.D., associate director, the Tucker Center for Research on Girls & Women in Sport, and Board of Directors member of the Alliance of Women Coaches. Please direct all inquiries to Acknowledgements Thank you to the following individuals for their role in producing this report: Maddie Kornfeld, Sara Loeffelad, Sam Dean, Marnie Kinnaird, Anna Posbergh, Jonathan Sweet. Design by Nance Longley. LaVoi, N. M. (2015, September). Head coaches of women's collegiate teams: A report on select NCAA Division-I Mid- Major institutions, Minneapolis: The Tucker Center for Research on Girls & Women in Sport 2015 Regents of the University of Minnesota. All rights reserved. The University of Minnesota is an equal opportunity educator and employer. Opinions expressed herein belong entirely to the authors and do not necessarily represent viewpoints of the Regents of the University of Minnesota.
3 Head Coaches of Women's Collegiate Teams A REPORT ON SELECT NCAA DIVISION-I MID-MAJOR INSTITUTIONS This longitudinal research series, now in its third year, is a partnership between the Tucker Center for Research on Girls & Women in Sport at the University of Minnesota the first research center of its kind in the world and the Alliance of Women Coaches, an organization dedicated to increasing the number of women in the coaching profession. In the first benchmark report of this longitudinal research series, The Decline of Women Coaches in Collegiate Athletics: A Report on Select NCAA Division-I FBS Institutions, (LaVoi, 2013), we detailed the historical decline in the percentage of women head coaches in the 40+ years following the passage of Title IX, explained why this research and women coaches matter and how minority status in the workplace can affect individuals, provided rationale for why examining employment patterns in big time athletics programs is important, and reported the percentage of women in coaching positions by sport and conference. Additionally, we assigned a grade to each institution, sport, and conference based on the percentage of women head coaches of women s teams and detailed the process and rationale for our data collection, methodology, and grading criteria. We also raised a number of important questions and highlighted missing information in the current body of knowledge that would help us answer a critical question: What can be done to retain and increase the percentage of women who are in the coaching profession? Purpose The purpose of this research series is multifacted: 1) to document and benchmark the percentage of women coaches of women s teams; 2) to provide evidence that will help retain and increase the percentage of women who are in the coaching profession; 3) to track the effectiveness of initiatives aimed at reversing the decline of the percentage of women in coaching; and 4) to bring awareness while providing an evidence-based starting point for a national discussion on this important issue. In this report we answer the following research question: What percentage of women occupy head coach positions for women s sport teams in 52 select NCAA Division I mid-major athletics programs during the academic year? 1
4 Methodology Documenting and adhering to a rigorous methodology is important for transparency, comparison to other data, and consistency in tracking and reporting over time. For a detailed account of our methodology, coding key, data collection, reliability processes, and how we determined and developed grading criteria, see the report (LaVoi, 2013) which can be downloaded free of charge at Data for this report was collected from November 2014 through April 2015 by visiting each institution s athletics website and reviewing the coaching roster/staff for the academic year for each NCAA-sponsored and NCAA-emerging sport women s team listed. All individuals listed on the coaching roster were recorded. In some cases the number of head coaches is greater (due to co-head coaches, and inclusion of diving) or less (due to unfilled positions at the time of data collection) than the number of sports offered at a particular institution. SAMPLE The dataset included all head coaches of women s teams (N = 472) at 52 institutions of higher education in all geographic regions of the United States that were current members of four select NCAA Division-I mid-major conferences: Mid-American, Mountain West, Conference USA, and Sun Belt. Appendix A summarizes the distribution of schools by conference recorded for GRADE CRITERIA The scale used to assign grades is as follows: A = %, B = 55-69%, C = 40-54%, D = 25-39%, F = 0-24%. If rounding up the decimal resulted in moving up a grade level, the institution, sport, or conference was placed in the higher grade bracket. Institutions with the same female head coach percentage were ordered alphabetically. Results By Coaching Position In the academic year, women coaches comprised less than half (45.6%) of all coaching positions. A smaller percentage of women coaches occupied head coaching positions (40.3%) compared to assistant (48.9%) and associate (50.0%; see Table 1) coaching positions. However, in a few of the less visible, entry-level positions such as director of operations (75.0%) and graduate assistant (73.9%) women occupied the majority of the positions. The only two exceptions to this trend were the positions of video coordinator (41.7%) and volunteer coaches (43.2%), in which men occupied the majority. Nonetheless, women were more likely to fill positions that were more behind the scenes than highly visible positions, such as athletic director. In fact, men (67.3%) were about twice as likely to be athletic directors than women (32.7%) at institutions in these four mid-major conferences. 2
5 TABLE 1. PERCENTAGE OF WOMEN COACHES AND ATHLETIC STAFF FOR WOMEN'S TEAMS Position Female Male Total % n % n N Head Coach (Senior) Associate Coach Assistant Coach SUBTOTAL Athletic Director Director of Operations Volunteer Coach Graduate Assistant Video Coordinator TOTAL BY SPORT There was great variance across 22 NCAA sports in terms of percentage of female head coaches (see Tables 2 & 3). Table 2 contains grades by percentage, while Table 3 contains breakdown by sport and gender of coach. Some of the sports such as lacrosse (100.0%), softball (76.7%), and golf (75.6%) all of which earned an A grade, had a predominance of women head coaches, while other sports had few (if any) women head coaches. Three sports (alpine skiing, fencing, and sailing) had no female head coaches. Women were much less likely than men to hold head coaching positions in sports with co-ed teams such as swimming (32.1%), track & field (19.1%), and cross country (10.9%). More sports (n=7) earned an F, than sports (n=6) that earned an A or B grade. TABLE 2. GRADE BY SPORT FOR PERCENTAGE OF FEMALE HEAD COACHES FOR Grade Criteria Sport A Lacrosse (100%), Softball (76.7%), Golf (75.6%) B Water Polo (66.7%), Field Hockey (57.1%), Basketball (56.3%) C Equestrian (50.0%), Sand Volleyball (50.0%), Volleyball (44.2%), Tennis (43.5%), Gymnastics (40.0%) D Bowling (33.3%), Crew/Rowing (33.3%), Rifle (33.3%), Swimming (32.1%) F 24-0 Track (19.1%), Soccer (18.0%), Diving (17.9%), Cross Country Run (10.9%), Alpine Skiing (0.0%), Fencing (0.0%), Sailing (0.0%) 3
6 TABLE 3. HEAD COACH NUMBER AND PERCENTAGE ALPHABETICALLY BY SPORT AND GENDER FOR WOMEN S TEAMS Head Coaches Female Male Sport % n % n N Alpine skiing Basketball Bowling Crew/Rowing Cross Country Diving Equestrian Fencing Field Hockey Golf Gymnastics Lacrosse Rifle Sailing Sand VB Soccer Softball Swimming Tennis Track & Field Volleyball Water Polo TOTAL BY INSTITUTION Based on the percentage of women head coaches, only 2 of the 52 institutions (3.8%) Texas State (80.0%) and Bowling Green (71.4%) received As compared to peer institutions (see Tables 4, 6, & 7). Nearly one-third of the 52 mid-major institutions (32.7%) fell within the C-grade range. Compared to the A-grade schools, more than three times as many institutions received failing grades (17.3%) and more than six times as many institutions received Ds (25.0%) for percentage of women head coaches. Colorado College and Louisiana Tech University tied for the lowest percentage of women head coaches (0.0%), followed by UL Monroe and University of Wyoming (11.1%). However, it is worth noting that Colorado College only had one D-1 women s team (women s hockey), and thus an F-grade might not be a fair representation of their coaching staff for women s teams. 4
7 TABLE 4. DISTRIBUTION OF GRADES BY INSTITUTION FOR PERCENTAGE OF WOMEN HEAD COACHES Grade Grade Criteria Institutions Institutions Receiving Grade A % B % C % D % F % TOTAL % BY CONFERENCE Out of the four NCAA D-I mid-major conferences, the Mid-American Conference had the highest percentage of women head coaches (47.2%), followed by Mountain West (40.0%). Both earned C grades. Conference USA (37.8%) and Sun Belt (36.5%) had the lowest percentages of women head coaches, and both earned a D. None of the four conferences had a percentage of women head coaches greater than 50.0%, and thus no conference earned an A or a B. TABLE 5. GRADE BY CONFERENCE FOR PERCENTAGE OF WOMEN HEAD COACHES. Grade Criteria Conference A B C Mid-American (47.2%), Mountain West (40.0%) D Conference USA (37.8%), Sun Belt (36.5%) F 24-0 Conclusion The purpose of this report was to provide an analysis of the percentage of women in coaching and administrative positions at the collegiate level, by institution, conference, and sport. Similar to prior reports on women coaches in collegiate athletics (LaVoi, 2012, 2013, 2014), this report provides further evidence for the under-representation of women coaches in collegiate athletics at the NCAA D-I mid-major conference level. These data illustrate an underrepresentation of women in coaching and administrative positions. In in these four mid-major conferences, female coaches occupy less than half of all head coach, assistant coach, and associate coach positions. Male coaches are afforded more opportunities to coach both male and female athletes, and men occupy the majority of athletic administrative positions. As the data demonstrate, male coaches and administrators are well-represented in collegiate athletics, especially in positions in which they are afforded more money, power, 5
8 TABLE GRADES BY INSTITUTION FOR PERCENT OF WOMEN HEAD COACHES OF WOMEN S TEAMS A (70-100%) B (55-69%) C (40-54%) D (25-39%) F (0-24%) Texas State (80.0%) Buffalo (66.7%) Southern Mississippi University (50.0%) Bowling Green (71.4%) Western Michigan (66.7%) University of Texas at San Antonio (50.0%) Troy (37.5%) Eastern Michigan (33.3%) Marshall University (20.0%) University of North Texas (20.0%) Florida Atlantic University (63.6%) Miami (50.0%) Ohio (33.3%) South Alabama (20.0%) University of Nevada-Reno (63.6%) UT Arlington (50.0%) Boise State (30.8%) Colorado State (20.0%) Central Michigan (62.5%) UNLV (50.0%) Western Kentucky University (30.0%) UL Lafayette (14.3%) San Diego State (61.5%) Ball State (45.5%) Akron (30.0%) UL Monroe (11.1%) CSU-Fresno (58.3%) University of Texas at El Paso (44.4%) New Mexico State (27.3%) University of Wyoming (11.1%) Northern Illinois (55.6%) Toledo (44.4%) Air Force (27.3%) Louisiana Tech University (0.0%) Appalachian State (55.6%) Georgia State (44.4%) Middle Tennesse State University (25.0%) Colorado College (0.0%) University of Alabama at Birmingham (54.5%) University of New Mexico (54.5%) University of North Caroline - Charlotte (42.9%) Kent State (25.0%) Rice University (42.9%) Arkansas State (25.0%) UALR (42.9%) Hawaii (42.9%) San Jose State University (25.0%) Utah State University (25.0%) Florida International University (40.0%) Old Dominion University (40.0%) Georgia Southern (40.0%) Idaho (40.0%) 6
9 TABLE 7. HEAD COACH NUMBER AND PERCENT HIGH TO LOW BY INSTITUTION AND GENDER Head Coaches Female Male School % N % N Texas State Bowling Green Buffalo Western Michigan Florida Atlantic University University of Nevada-Reno Central Michigan San Diego State CSU-Fresno Northern Illinois Appalachian State Alabama-Birmingham University of New Mexico Southern Mississippi Texas-San Antonio Miami UT Arlington UNLV Ball State Texas-El Paso Toledo Georgia State North Carolina-Charlotte Rice University UALR Hawaii Florida International Head Coaches Female Male School % N % N Old Dominion University Georgia Southern Idaho Troy Eastern Michigan Ohio Boise State Western Kentucky Akron New Mexico State Air Force Middle Tennessee State Kent State Arkansas State San Jose State University Utah State University Marshall University University of North Texas South Alabama Colorado State UL Lafayette UL Monroe University of Wyoming Louisiana Tech University Colorado College Total
10 visibility and higher status. It is especially worth noting that men often occupy the decisionmaking positions, in which they have the primary say in the hiring process. These trends in the representation of women coaches support additional research on barriers facing women coaches and athletic administrators (see LaVoi & Dutove, 2012), with the aim of reducing these barriers. References LaVoi, N. M. (2014, January). Head coaches of women s collegiate teams: A report on select NCAA Division-I FBS institutions, Retrieved from LaVoi, N. M. (2013, December). The decline of women coaches in collegiate athletics: A report on select NCAA Division-I FBS institutions, Retrieved from LaVoi, N. M., & Dutove, J. K. (2012). Barriers and supports for female coaches: An ecological model. Sports Coaching Review, 1(1), LaVoi, N. M. (2015, February). Head coaches of women s collegiate teams: A report on select NCAA Division-I FBS institutions, Minneapolis: Tucker Center for Research on Girls & Women in Sport. 8
11 Appendix A CONFERENCE COMPOSITION Conference USA Mid-American/MIAC Mountain West Sun Belt University of North Caroline -Charlotte Akron Air Force Appalachian State Florida International University Ball State Boise State UALR Florida Atlantic University Bowling Green Colorado College Arkansas State Louisiana Tech University Buffalo Colorado State Georgia Southern Marshall University Central Michigan CSU-Fresno Georgia State Middle Tennesse State University Eastern Michigan Hawaii Idaho University of North Texas Kent State University of Nevada-Reno UL Lafayette Old Dominion University Miami University of New Mexico UL Monroe Rice University Northern Illinois San Diego State New Mexico State Southern Mississippi University Ohio San Jose State University South Alabama University of Alabama at Birmingham Toledo UNLV UT Arlington University of Texas at El Paso Western Michigan Utah State University Troy University of Texas at San Antonio University of Wyoming Texas State Western Kentucky University 9
12
13

14 A report designed to make a difference in the lives of girls and women in sport and to increase the number of women in the coaching profession School of Kinesiology
PFU DRAFT TIPS Draft Kit. Tip 1: Avoid drafting too many teams from the same conference
 2016 Draft Kit PFU DRAFT TIPS Here are a few insider tips that will give you the upper hand in your draft this year. Feel free to heed the advice or just follow your own instincts. Either way, have a blast
HIGH SCHOOL ATHLETICS PARTICIPATION SURVEY
 2011-12 HIGH SCHOOL ATHLETICS PARTICIPATION SURVEY Conducted By THE NATIONAL FEDERATION OF STATE HIGH SCHOOL ASSOCIATIONS Based on Competition at the High School Level in the 2011-12 School Year BOYS GIRLS
All-Time College Football. Attendance. All-Time NCAA Attendance. Annual Football Bowl Subdivision (FBS) Attendance. Annual Total NCAA Attendance
 Attendance. Annual Total NCAA Attendance") Attendance Records All-Time College Football Attendance... 2 All-Time NCAA Attendance... 2 Annual Conference Attendance Leaders... 3 Largest Regular-Season Crowds... 10 2012 Attendance... 11 Annual Team
Attendance Records All-Time College Football Attendance... 2 All-Time NCAA Attendance... 2 Annual Conference Attendance Leaders... 3 Largest Regular-Season Crowds... 10 2012 Attendance... 11 Annual Team
THE GENDER EQUITY SCORECARD VI
 THE GENDER EQUITY SCORECARD VI Charles L. Kennedy Senior Instructor Political Science Penn State York clk8@psu.edu May, 2009 1 The North Texas Mean Green repeated as the national champions on the sixth
HIGH SCHOOL ATHLETICS PARTICIPATION SURVEY
 2015-16 HIGH SCHOOL ATHLETICS PARTICIPATION SURVEY Conducted By THE NATIONAL FEDERATION OF STATE HIGH SCHOOL ASSOCIATIONS Based on Competition at the High School Level in the 2015-16 School Year BOYS GIRLS
Head Coaches of Women s Collegiate Teams
 Head Coaches of Women s Collegiate Teams A Report on Seven Select NCAA Division-I Conferences 2017-2018 www. TuckerCenter. org Twitter: @TuckerCenter facebook.com/tuckercenter www. G o C o a c h e s. org
HIGH SCHOOL ATHLETICS PARTICIPATION SURVEY
 2017-18 HIGH SCHOOL ATHLETICS PARTICIPATION SURVEY Conducted By THE NATIONAL FEDERATION OF STATE HIGH SCHOOL ASSOCIATIONS Based on Competition at the High School Level in the 2017-18 School Year SPORT
TROJAN SEXUAL HEALTH REPORT CARD. The Annual Rankings of Sexual Health Resources at American Colleges and Universities. TrojanBrands.
 TROJAN SEXUAL HEALTH The Annual Rankings of Sexual Health Resources at American Colleges and Universities PRESENTED BY TOP 10 1 UNIVERSITY OF GEORGIA 2 OREGON STATE UNIVERSITY 3 UNIVERSITY OF MICHIGAN
PFU DRAFT TIPS Draft Kit. Tip 1: Avoid drafting too many teams from the same conference
 2017 Draft Kit PFU DRAFT TIPS Here are a few insider tips that will give you the upper hand in your draft this year. Feel free to heed the advice or just follow your own instincts. Either way, have a blast
Scoring Algorithm by Schiller Industries
 As of June 28, 2017 MEN'S CUP STANDINGS Points WOMEN'S CUP STANDINGS Points 1. Ohio State 111 1. Stanford 175.5 2. Florida 105 2. USC 129 3. North Carolina 100 3. Florida 87 4. Stanford 94.5 4. Oregon
2 All-Time College football Attendance. All-Time NCAA Attendance. Annual Football Bowl Subdivision (FBS) Attendance
 Attendance") Attendance Records All-Time College Football Attendance... 2 All-Time NCAA Attendance... 2 Annual Conference Attendance Leaders... 3 Largest Regular-Season Crowds... 10 2009 Attendance... 10 Annual Team
Attendance Records All-Time College Football Attendance... 2 All-Time NCAA Attendance... 2 Annual Conference Attendance Leaders... 3 Largest Regular-Season Crowds... 10 2009 Attendance... 10 Annual Team
Media Contact: Destini Orr , Todd Currie ,
 Media Contact: Destini Orr 804-704-0195, DestiniOrr@knights.ucf.edu Todd Currie 561-384-0891, todd.currie@ucf.edu Keeping Score When It Counts: Assessing the Academic Records of the 2016-2017 -bound College
Colleges/Universities with Exercise Science/Kinesiology-related Graduate Programs
 Colleges/Universities with Exercise Science/Kinesiology-related Graduate Programs (If you know of a college/university not on this list, please contact the CSCCa National Office to have it added.) ALABAMA
MAC ANNOUNCES UPDATED 2016 FOOTBALL SCHEDULE
 MAC ANNOUNCES UPDATED 2016 FOOTBALL SCHEDULE 2016 schedule features 17 November nationally televised games on ESPN2, ESPNU and CBS Sports Network For Immediate Release Thursday, June 9, 2016 Cleveland,
2013 Sexual Health. Report Card. The Annual Rankings of Sexual Health Resources at American Colleges and Universities BRAND CONDOMS
 BRAND CONDOMS Report Card The Annual Rankings of Resources at American Colleges and Universities TOP 10 Report Card 1 2 3 4 5 6 7 8 9 10 Princeton University Columbia University University of Arizona University
Campus Forum on Athletics April 3, :30 pm
 Campus Forum on Athletics April 3, 2014 3:30 pm A pessimist sees the difficulty in every opportunity; an optimist sees the opportunity in every difficulty. Outcomes of the Session $66.3 million for Science
CSCAA NCAA Division I Scholar All-America Teams
 College Swimming Coaches Association of America- For Immediate Release March 5, 2014 Contact: Joel Shinofield, Executive Director (540) 460-6563; joel@cscaa.org CSCAA NCAA Division I Scholar All-America
Mike DeSimone's 2006 College Football Division I-A Top 119 Ratings Bowl Schedule
 2006/2007 College Football Games Page 1 of 8 Mike DeSimone's 2006 College Football Division I-A Top 119 Ratings Schedule Predictions Last Modified: Tuesday, 12, 2006 Record: 0 Correct 0 Incorrect (%) Download
Media Contact: Brett Estrella (508) ,
 ,") Media Contact: Brett Estrella (508)-577-2767, bestrella@knights.ucf.edu Keeping Score When It Counts: Assessing the Academic Records of the 2017-2018 -bound College Football Teams By Richard Lapchick with
Media Contact: Brett Estrella (508)-577-2767, bestrella@knights.ucf.edu Keeping Score When It Counts: Assessing the Academic Records of the 2017-2018 -bound College Football Teams By Richard Lapchick with
Appalachian State University L500030AppStUBlkVinyl. University of Alabama L500030AlabmaBlkVinyl. Arizona State University L500030ArizStBlkVinyl
 University of Alabama at Birmingham L500030AlaBirBlkVinyl University of Alabama L500030AlabmaBlkVinyl Appalachian State University L500030AppStUBlkVinyl Arizona State University L500030ArizStBlkVinyl University
Sears Directors' Cup Final Standings
 1 Stanford 662.5 5 59.5 2 63.0 4 61.0 3 61.5 1 64.0 57 0.0 54 0.0 971.5 2 North Carolina 565.0 53.0 17 44.5 19 46.0 8 57.0 41 17.5 16 0.0 7 58.0 9 54.5 789.5 3 UCLA 485.5 118.0 7 58.0 1 64.0 5 58.5 3 61.5
Drink Mats Grill Mats
 Alabama A&M Alabama State Alabama-ALogo 14000 12115 15500 Alabama at Birmingham Alabama at Huntsville Alabama-Elephant Logo 9064 Appalachian State Arizona 10328 Arizona State 10329 Arkansas 14015 12116
COLLEGE BASKETBALL. Jamaican Classic Montego Bay
 COLLEGE BASKETBALL 2017-18 SCHEDULE DATE GAME TIME FRI 11/10 Veterans Classic at the U.S. Naval Academy Memphis vs. Alabama 6:30 Pittsburgh vs. Navy 9:00 SUN 11/12 Princeton at Butler 6:00 MON 11/13 College
Name. Class. Year. trojan sexual health report card edition THE ANNUAL RANKING OF SEXUAL HEALTH RESOURCES AT AMERICAN COLLEGES & UNIVERSITIES
 Name Class Year trojan sexual health report card 2010 edition THE ANNUAL RANKING OF SEXUAL HEALTH RESOURCES AT AMERICAN COLLEGES & UNIVERSITIES important use no.1 condom Trojan Brand condoms trusted for
College Football. ~2015 Season~ Television Game Schedule
 College Football ~2015 Season~ Television Game Schedule Saturday, August 29 North Dakota State at Montana ESPN 2:30 p.m. Thursday, September 3 Florida International at Central Florida CBSSN 5 p.m. South
Gender, Race & LGBT Inclusion of Head Coaches of Women s Teams A Report on Select NCAA Division I Conferences for the 45th Anniversary of Title IX
 Gender, Race & LGBT Inclusion of Head Coaches of Women s Teams A Report on Select NCAA Division I Conferences for the 45th Anniversary of Title IX June 2017 www. tuckercenter. org Twitter: @TuckerCenter
Ethnic Studies Asst 55, ,755-2, ,111 4,111
 A&S Prof 99,202 163 112,307-13,105-11.67 2,136,071 2,210,459 Asso 69,100 115 74,200-5,101-6.87 586,572 648,916 Asst 60,014 78 62,194-2,181-3.51 170,088 256,767 Total 80,892 356 89,017-8,126-9.13 2,892,731
NORTHCOAST SPORTS SERVICE COVERING GAMES FROM. SEPTEMBER 27th - OCTOBER 15, 2018
 NORTHCOAST SPORTS SERVICE PO Box 450829 Cleveland, OH 44145 1-800-654-3448 or ncsports.com VOLUME 28 NO. 2 FOOTBALL 2018-2019 COVERING GAMES FROM SEPTEMBER 27th - OCTOBER 15, 2018 POWER SWEEP / POWER PLAYS
 3+ 3+ N = 155, 442 3+ R 2 =.32 < < < 3+ N = 149, 685 3+ R 2 =.27 < < < 3+ N = 99, 752 3+ R 2 =.4 < < < 3+ N = 98, 887 3+ R 2 =.6 < < < 3+ N = 52, 624 3+ R 2 =.28 < < < 3+ N = 36, 281 3+ R 2 =.5 < < < 7+
COLLEGE BASKETBALL. Jamaican Classic Montego Bay
 COLLEGE BASKETBALL 2017-18 SCHEDULE DATE GAME TIME FRI 11/10 Veterans Classic at the U.S. Naval Academy Memphis vs. Alabama 6:30 Pittsburgh vs. Navy 9:00 SUN 11/12 Princeton at Butler 6:00 MON 11/13 College
University of Idaho Sun Belt Conference Membership Presentation. February 15, 2016 Chuck Staben, President
 University of Idaho Sun Belt Conference Membership Presentation February 15, 2016 Chuck Staben, President 1 University of Idaho Idaho s Leading Research University 11,400 students High graduation rate
THE STATE OF GRANTSEEKING FACT SHEET
 1 THE STATE OF GRANTSEEKING FACT SHEET ORG ANIZATIONAL COMPARISO N BY C ENSUS DIV ISION S PRING 2013 The State of Grantseeking Spring 2013 is the sixth semi-annual informal survey of nonprofits conducted
Illinois Higher Education Executive Compensation Analysis
 Illinois Higher Education Executive Analysis July 2015 Illinois Board of Higher Education Notes on sources and methods: The peer information used in this analysis was obtained from the Chronicle of Higher
Ethnic Studies Asst 54, ,315-3, ,229 6,229. Gen Honors/UC Asso 64, ,402-4, ,430 24,430
 A&S Prof 99,280 157 110,954-11,674-10.52 1,832,807 2,010,866 Asso 70,144 112 73,921-3,777-5.11 422,998 603,376 Asst 60,165 82 62,465-2,300-3.68 188,570 269,597 Total 80,845 351 87,809-6,964-7.93 2,444,375
41/95/2 Student Affairs ATO Chapters Chapter Composites File,
 41/95/2 Student Affairs ATO Chapters Chapter Composites File, 1867-2015 Note: Due to preservation considerations, pre-1950 and modern composites have been separated. Please be aware that older composites
Acm762 AG U.S. VITAL STATISTICS BY SECTION, 2017 Page 1
 Acm762 AG U.S. VITAL STATISTICS BY SECTION, 2017 Page 1 District Summary Major Worship Total Total -------------------- Adherents -------------------- Service District Churches Membership Boys Girls Men
THE METHODIST CHURCH (U.S.)
") THE METHODIST LIBRARY CONFERENCE JOURNALS COLLECTION PAGE: 1 ALABAMA 1939-58 ALABAMA WEST FLORIDA 1959-1967 ALASKA MISSION 1941, 1949-1967 ATLANTA 1939-1951 BALTIMORE CALIFORNIA ORIENTAL MISSION 1939-1952
THE METHODIST LIBRARY CONFERENCE JOURNALS COLLECTION PAGE: 1 ALABAMA 1939-58 ALABAMA WEST FLORIDA 1959-1967 ALASKA MISSION 1941, 1949-1967 ATLANTA 1939-1951 BALTIMORE CALIFORNIA ORIENTAL MISSION 1939-1952
AMERICAN ASSOCIATION FOR AGRICULTURAL EDUCATION FACULTY SALARIES
 AMERICAN ASSOCIATION FOR AGRICULTURAL EDUCATION 1999-2000 FACULTY SALARIES Contents Page Summary Data for 1999-2000 Faculty FTEs by Region Nine-month appointments (Table 1)...2 Twelve-month appointments
Fiscal Year Tuition and Fee Comparisons for UNC Peer Institutions
 Fee Comparisons and 1 California State University at Fresno $2,933 $13,103 2 California State University at Chico $3,370 $13,540 3 Appalachian State University $3,436 $13,178 4 Georgia Southern University
Current Medicare Advantage Enrollment Penetration: State and County-Level Tabulations
 Current Advantage Enrollment : State and County-Level Tabulations 5 Slide Series, Volume 40 September 2016 Summary of Tabulations and Findings As of September 2016, 17.9 million of the nation s 56.1 million
TABLE 3c: Congressional Districts with Number and Percent of Hispanics* Living in Hard-to-Count (HTC) Census Tracts**
 Census Tracts**") living Alaska 00 47,808 21,213 44.4 Alabama 01 20,661 3,288 15.9 Alabama 02 23,949 6,614 27.6 Alabama 03 20,225 3,247 16.1 Alabama 04 41,412 7,933 19.2 Alabama 05 34,388 11,863 34.5 Alabama 06 34,849 4,074
living Alaska 00 47,808 21,213 44.4 Alabama 01 20,661 3,288 15.9 Alabama 02 23,949 6,614 27.6 Alabama 03 20,225 3,247 16.1 Alabama 04 41,412 7,933 19.2 Alabama 05 34,388 11,863 34.5 Alabama 06 34,849 4,074
2010 College Football
 2010 College Football Thursday, September 2, 2010 Southern Miss. v. South Carolina 6:30 PM 9:30 PM ESPN Thursday, September 2, 2010 USC at Hawaii 10:00 PM 1:00 AM ESPN Friday, September 3, 2010 Arizona
TABLE 3b: Congressional Districts Ranked by Percent of Hispanics* Living in Hard-to- Count (HTC) Census Tracts**
 Census Tracts**") Rank State District Count (HTC) 1 New York 05 150,499 141,567 94.1 2 New York 08 133,453 109,629 82.1 3 Massachusetts 07 158,518 120,827 76.2 4 Michigan 13 47,921 36,145 75.4 5 Illinois 04 508,677 379,527
Rank State District Count (HTC) 1 New York 05 150,499 141,567 94.1 2 New York 08 133,453 109,629 82.1 3 Massachusetts 07 158,518 120,827 76.2 4 Michigan 13 47,921 36,145 75.4 5 Illinois 04 508,677 379,527
Keeping Score When It Counts: Academic Progress/Graduation Success Rate Study of 2017 NCAA Division I Men s and Women s Basketball Tournament Teams
 Media Contacts: Destini Orr 804-704-0195, destiniorr@knights.ucf.edu Todd Currie 561-284-0921, todd.currie@ucf.edu Keeping Score When It Counts: Academic Progress/Graduation Success Rate Study of 2017
2017 Volleyball Attendance
 2017 Volleyball Attendance Ark Classic Averages: 25 Aug Attendance 1257 Attendance 994 Ark Classic (10 am) 26 Aug Attendance 563 Totals: Ark Classic (7 pm) 26 Aug Attendance 832 Attendance 12,918 Oral
Acm769 AG U.S. WATER BAPTISMS, 2017¹ Page 1
 Acm769 AG U.S. WATER BAPTISMS, 2017¹ Page 1 Baptisms Baptisms Pct Baptisms Pct Baptisms Pct Alabama 2,552 2,944-392 -13.3 3,146-594 -18.9 2,501 51 2.0 Alaska 511 392 119 30.4 443 68 15.3 505 6 1.2 Appalachian
DOCTORAL/RESEARCH INSTITUTIONS RECEIVING FULBRIGHT AWARDS FOR
 DOCTORAL/RESEARCH INSTITUTIONS RECEIVING FULBRIGHT AWARDS FOR 2015-2016 Those institutions highlighted in blue are listed in the Chronicle of Higher Education Institution State Grants Applications Harvard
Unemployment Rate (%) Rank State. Unemployment
 Rank State. Unemployment") States Ranked by February 2018 Unemployment Rate Seasonally Adjusted Unemployment Unemployment Unemployment 1 Hawaii 2.1 19 Alabama 3.7 33 Ohio 4.5 2 New Hampshire 2.6 19 Missouri 3.7 33 Rhode Island 4.5
States Ranked by February 2018 Unemployment Rate Seasonally Adjusted Unemployment Unemployment Unemployment 1 Hawaii 2.1 19 Alabama 3.7 33 Ohio 4.5 2 New Hampshire 2.6 19 Missouri 3.7 33 Rhode Island 4.5
Unemployment Rate (%) Rank State. Unemployment
 Rank State. Unemployment") States Ranked by November 2015 Unemployment Rate Seasonally Adjusted Unemployment Unemployment Unemployment 1 North Dakota 2.7 19 Indiana 4.4 37 Georgia 5.6 2 Nebraska 2.9 20 Ohio 4.5 37 Tennessee 5.6
States Ranked by November 2015 Unemployment Rate Seasonally Adjusted Unemployment Unemployment Unemployment 1 North Dakota 2.7 19 Indiana 4.4 37 Georgia 5.6 2 Nebraska 2.9 20 Ohio 4.5 37 Tennessee 5.6
Unemployment Rate (%) Rank State. Unemployment
 Rank State. Unemployment") States Ranked by April 2017 Unemployment Rate Seasonally Adjusted Unemployment Unemployment Unemployment 1 Colorado 2.3 17 Virginia 3.8 37 California 4.8 2 Hawaii 2.7 20 Massachusetts 3.9 37 West Virginia
States Ranked by April 2017 Unemployment Rate Seasonally Adjusted Unemployment Unemployment Unemployment 1 Colorado 2.3 17 Virginia 3.8 37 California 4.8 2 Hawaii 2.7 20 Massachusetts 3.9 37 West Virginia
Unemployment Rate (%) Rank State. Unemployment
 Rank State. Unemployment") States Ranked by August 2017 Unemployment Rate Seasonally Adjusted Unemployment Unemployment Unemployment 1 North Dakota 2.3 18 Maryland 3.9 36 New York 4.8 2 Colorado 2.4 18 Michigan 3.9 38 Delaware 4.9
States Ranked by August 2017 Unemployment Rate Seasonally Adjusted Unemployment Unemployment Unemployment 1 North Dakota 2.3 18 Maryland 3.9 36 New York 4.8 2 Colorado 2.4 18 Michigan 3.9 38 Delaware 4.9
Unemployment Rate (%) Rank State. Unemployment
 Rank State. Unemployment") States Ranked by March 2016 Unemployment Rate Seasonally Adjusted Unemployment Unemployment Unemployment 1 South Dakota 2.5 19 Delaware 4.4 37 Georgia 5.5 2 New Hampshire 2.6 19 Massachusetts 4.4 37 North
States Ranked by March 2016 Unemployment Rate Seasonally Adjusted Unemployment Unemployment Unemployment 1 South Dakota 2.5 19 Delaware 4.4 37 Georgia 5.5 2 New Hampshire 2.6 19 Massachusetts 4.4 37 North
Unemployment Rate (%) Rank State. Unemployment
 Rank State. Unemployment") States Ranked by September 2017 Unemployment Rate Seasonally Adjusted Unemployment Unemployment Unemployment 1 North Dakota 2.4 17 Indiana 3.8 36 New Jersey 4.7 2 Colorado 2.5 17 Kansas 3.8 38 Pennsylvania
States Ranked by September 2017 Unemployment Rate Seasonally Adjusted Unemployment Unemployment Unemployment 1 North Dakota 2.4 17 Indiana 3.8 36 New Jersey 4.7 2 Colorado 2.5 17 Kansas 3.8 38 Pennsylvania
Unemployment Rate (%) Rank State. Unemployment
 Rank State. Unemployment") States Ranked by December 2017 Unemployment Rate Seasonally Adjusted Unemployment Unemployment Unemployment 1 Hawaii 2.0 16 South Dakota 3.5 37 Connecticut 4.6 2 New Hampshire 2.6 20 Arkansas 3.7 37 Delaware
States Ranked by December 2017 Unemployment Rate Seasonally Adjusted Unemployment Unemployment Unemployment 1 Hawaii 2.0 16 South Dakota 3.5 37 Connecticut 4.6 2 New Hampshire 2.6 20 Arkansas 3.7 37 Delaware
Unemployment Rate (%) Rank State. Unemployment
 Rank State. Unemployment") States Ranked by September 2015 Unemployment Rate Seasonally Adjusted Unemployment Unemployment Unemployment 1 North Dakota 2.8 17 Oklahoma 4.4 37 South Carolina 5.7 2 Nebraska 2.9 20 Indiana 4.5 37 Tennessee
States Ranked by September 2015 Unemployment Rate Seasonally Adjusted Unemployment Unemployment Unemployment 1 North Dakota 2.8 17 Oklahoma 4.4 37 South Carolina 5.7 2 Nebraska 2.9 20 Indiana 4.5 37 Tennessee
Unemployment Rate (%) Rank State. Unemployment
 Rank State. Unemployment") States Ranked by November 2014 Unemployment Rate Seasonally Adjusted Unemployment Unemployment Unemployment 1 North Dakota 2.7 19 Pennsylvania 5.1 35 New Mexico 6.4 2 Nebraska 3.1 20 Wisconsin 5.2 38 Connecticut
States Ranked by November 2014 Unemployment Rate Seasonally Adjusted Unemployment Unemployment Unemployment 1 North Dakota 2.7 19 Pennsylvania 5.1 35 New Mexico 6.4 2 Nebraska 3.1 20 Wisconsin 5.2 38 Connecticut
Unemployment Rate (%) Rank State. Unemployment
 Rank State. Unemployment") States Ranked by July 2018 Unemployment Rate Seasonally Adjusted Unemployment Unemployment Unemployment 1 Hawaii 2.1 19 Massachusetts 3.6 37 Kentucky 4.3 2 Iowa 2.6 19 South Carolina 3.6 37 Maryland 4.3
States Ranked by July 2018 Unemployment Rate Seasonally Adjusted Unemployment Unemployment Unemployment 1 Hawaii 2.1 19 Massachusetts 3.6 37 Kentucky 4.3 2 Iowa 2.6 19 South Carolina 3.6 37 Maryland 4.3
NCAA DIVISION I SOFTBALL COMMITTEE ANNOUNCES 2015 BRACKET. INDIANAPOLIS University of Florida, the defending national champion, was named
 FOR IMMEDIATE RELEASE Sunday, May 10, 2015 CONTACT: Sharon Cessna Director, Championships and Alliances 317/917-6222 NCAA DIVISION I SOFTBALL COMMITTEE ANNOUNCES 2015 BRACKET INDIANAPOLIS University of
U.S. Psychology. Departments
 Table of Contents Department Ratings Links Home U.S. Psychology Distinguished Strong Good Departments This page ranks United States doctoral programs in psychology based on the 1995 study conducted by
FBI Field Offices. Louisville Division Room Martin Luther King Jr. Place Louisville, Kentucky (502)
") FBI Field Offices Alabama Kentucky North Dakota Birmingham Division Room 1400 2121 8 th Ave. North Birmingham, Alabama 35203-2396 (205) 326-6166 Mobile Division One St. Louis Street, 3 rd Floor Mobile,
FBI Field Offices Alabama Kentucky North Dakota Birmingham Division Room 1400 2121 8 th Ave. North Birmingham, Alabama 35203-2396 (205) 326-6166 Mobile Division One St. Louis Street, 3 rd Floor Mobile,
Index of religiosity, by state
 Index of religiosity, by state Low Medium High Total United States 19 26 55=100 Alabama 7 16 77 Alaska 28 27 45 Arizona 21 26 53 Arkansas 12 19 70 California 24 27 49 Colorado 24 29 47 Connecticut 25 32
The American Legion NATIONAL MEMBERSHIP RECORD
 The American Legion NATIONAL MEMBERSHIP RECORD www.legion.org 2016 The American Legion NATIONAL MEMBERSHIP RECORD 1920-1929 Department 1920 1921 1922 1923 1924 1925 1926 1927 1928 1929 Alabama 4,474 3,246
Critical Access Hospitals and HCAHPS
 Critical Access Hospitals and HCAHPS Michelle Casey, MS Senior Research Fellow and Deputy Director University of Minnesota Rural Health Research Center June 12, 2012 Overview of Presentation Why is HCAHPS
2018 NCAA Division I Men's Basketball Championship
 Charlotte Wichita Boise Nashville Nashville Pittsburgh Detroit San Diego Wichita Detroit Dallas Dallas Boise San Diego Charlotte Pittsburgh 2018 NCAA Division I Men's Basketball Championship First Round
STATE ENTREPRENEURSHIP INDEX
 University of Nebraska - Lincoln DigitalCommons@University of Nebraska - Lincoln Business in Nebraska Bureau of Business Research 12-2013 STATE ENTREPRENEURSHIP INDEX Eric Thompson University of Nebraska-Lincoln,
5 x 7 Notecards $1.50 with Envelopes - MOQ - 12
 5 x 7 Notecards $1.50 with Envelopes - MOQ - 12 Magnets 2½ 3½ Magnet $1.75 - MOQ - 5 - Add $0.25 for packaging Die Cut Acrylic Magnet $2.00 - MOQ - 24 - Add $0.25 for packaging 2535-22225 California AM-22225
Betting Tools NCAA FB Home Scores Matchups Teams Standings Schedules News Buy Picks Odds ½ u-10 PK PK -10
 Sign In Register Sportsbooks Poker Casinos Betting Guides Proxy Services FREE PICK VEGAS ODDS VI EXPERTS Home NFL NBA NHL MLB NCAA FB NCAA BK Golf Auto Horses Soccer Boxing/MMA More Betting Tools NCAA
PARKWAY And BROAD STREET VOLUME 8 ISSUE #1 AUG 20 - AUG 27, 2018 THE 2018 COLLEGE FOOTBALL SEASON
 301 Thomas French Drive Scottsboro, AL 35769 Real Estate (256) 574-2515 1-800-345-4839 Political Signs Fax: (256) 259-2972 Vinyl Graphics email: tnvalley4@scottsboro.org Digital Printing www.tennesseevalleysigns.com
PRESS RELEASE Media Contact: Joseph Stefko, Director of Public Finance, ;
 PRESS RELEASE Media Contact: Joseph Stefko, Director of Public Finance, 585.327.7075; jstefko@cgr.org Highest Paid State Workers in New Jersey & New York in 2010; Lowest Paid in Dakotas and West Virginia
U.S. Track & Field and Cross Country Coaches Association
 Men Arizona State University Belmont University Binghamton University Boston University Bradley University Brigham Young University Brown University Bucknell University Central Michigan University Colgate
MAP 1: Seriously Delinquent Rate by State for Q3, 2008
 MAP 1: Seriously Delinquent Rate by State for Q3, 2008 Seriously Delinquent Rate Greater than 6.93% 5.18% 6.93% 0 5.17% Source: MBA s National Deliquency Survey MAP 2: Foreclosure Inventory Rate by State
Decline Admission to Boston College Law School Fall 2018
 Decline Admission to Boston College Law School Fall 2018 We are sorry to hear that you will not be attending Boston College Law School. Please complete and submit this form to formally decline your admission
WOMEN S BASKETBALL COMPOSITE SCHEDULE
 2013-14 WOMEN S BASKELL COMPOSITE SCHEDULE NOVEMBER Fri., Nov. 8 Bluefield College at Marshall 10:30 a.m. Virginia Intermonth College at East Carolina West Alabama at Southern Miss Texas Southern at Tulsa
College Football Playoff schedule
 ESPN.com: College Football [Print without images] Sunday, December 6, 2015 Updated: December 7, 11:16 PM ET 2015-2016 College Football Playoff and bowl schedule By ESPN.com staff ESPN.com From the Celebration
VOLUME 6 ISSUE #11 NOV 1 - NOV 5, 2016
 COMPLIMENTS OF: SanDiegoBowlGames.com VOLUME 6 ISSUE #11 NOV 1 - NOV 5, 2016 WHO IS STILL ALIVE? GAME-OF-THE-WEEK By Jim Gumm Owner / Editor of THE BLITZ The so called college football experts have eliminated
2018 NCAA DIVISION I WOMEN'S GOLF REGIONAL SELECTIONS
 FOR IMMEDIATE RELEASE CONTACT: Carol A. Reep Championships and Alliances 317-917-6678 2018 NCAA DIVISION I WOMEN'S GOLF REGIONAL SELECTIONS INDIANAPOLIS --- The NCAA Division I Women's Golf Committee has
California Economic Snapshot 3 rd Quarter 2014
 Provided By: State Annual Nonfarm Job Growth, Sept-14 Upper Upper-Middle Lower-Middle Lower North Dakota 5.0% California 2.1% Hawaii 1.5% Idaho 0.8% Utah 3.7% Missouri Rhode Island 1.4% Nebraska 0.8% Texas
Table 1 Number of Varsity Athletic Teams at Ivy League, ACC, and Big Ten Universities in Ivy League ACC Big Ten
 Table 1 Number of Varsity Athletic Teams at Ivy League, ACC, and Big Ten Universities in 1998-99 Ivy League ACC Big Ten Brown 36 Clemson 17 Illinois 18 Columbia 26 Duke 23 Indiana 20 Cornell 34 Florida
BOWLING GREEN MEN S GOLF STATISTICS
 Date Tournament 1 2 3 4 Total Finish Low Falcon Sept. 12-13 Joe Feaganes Marshall Invite. 287 287 282 856 5th Rispler (T-15th) Sept. 19-20 Inverness Intercollegiate 287 300 291 878 T-8th Rispler (9th)
RICE OWLS GOLF Rice University Athletic Communications MS 548, PO Box 1892 Houston, TX
 RICE OWLS GOLF Rice University Athletic Communications MS 548, PO Box 1892 Houston, TX 77251-1892 RiceOwls.com @RiceOwlsdotcom @RiceGolf 2016-17 RICE SCHEDULE/RESULTS FALL 2016 Team Team Top Date Tournament
NSSE 2017 Selected Comparison Groups Ohio University
 NSSE 2017 Selected Groups IPEDS: 204857 About This Report Groups The NSSE Institutional Report displays core survey results for your students alongside those of three s. In May, your institution was invited
Percentage of Enrolled Students by Program Type, 2016
 Percentage of Enrolled Students by Program Type, 2016 Doctorate 4% PN/VN 3% MSN 15% ADN 28% BSRN 22% Diploma 2% BSN 26% n = 279,770 Percentage of Graduations by Program Type, 2016 MSN 12% Doctorate 1%
PLAY TO WIN! Jessica Tidwell, PMP PMI Northern Utah Chapter. All Rights Reserved.
 PLAY TO WIN! Jessica Tidwell, PMP WINNING What does it even mean? I made breakfast Check this day off as a success! - Lydia Taggart Presentation Title ? Presentation Title What does winning mean to YOU?
Child & Adult Care Food Program: Participation Trends 2017
 Child & Adult Care Food Program: Participation Trends 2017 February 2018 About FRAC The Food Research and Action Center (FRAC) is the leading national organization working for more effective public and
Cooperative Program Allocation Budget Receipts Southern Baptist Convention Executive Committee August 2015
 Cooperative Program Allocation Budget Receipts August 2015 Cooperative Program Allocation Budget Current Current $ Change % Change Month Month from from Contribution Sources 2014-2015 2013-2014 Prior Year
Cooperative Program Allocation Budget Receipts Southern Baptist Convention Executive Committee March 2018
 Cooperative Program Allocation Budget Receipts March 2018 Cooperative Program Allocation Budget Current Current $ Change % Change Month Month from from Contribution Sources 2017-2018 2016-2017 Prior Year
The number of masters degrees awarded for all program areas at Land-grant institutions rose by 11,318 degrees (18%).
.") In This Edition >>> Graduate degrees awarded within agriculture. Graduate degrees awarded by the largest programs. Graduate degrees awarded by gender. Graduate degrees awarded by ethnicity. Summer 214
In This Edition >>> Graduate degrees awarded within agriculture. Graduate degrees awarded by the largest programs. Graduate degrees awarded by gender. Graduate degrees awarded by ethnicity. Summer 214
Keeping Score When It Counts: Graduation Success and Academic Progress Rates for the 2011 NCAA Division I Men s Basketball Tournament Teams
 Media Contact: Kelvin Ang Kelvinangjy@knights.ucf.edu, 315 450 1420 Keeping Score When It Counts: Graduation Success and Academic Progress Rates for the 2011 NCAA Division I Men s Tournament Teams Graduation
Cooperative Program Allocation Budget Receipts Southern Baptist Convention Executive Committee January 2014
 Cooperative Program Allocation Budget Receipts January 2014 Cooperative Program Allocation Budget Current Current $ Change % Change Month Month from from Contribution Sources 2013-2014 2012-2013 Prior
Cooperative Program Allocation Budget Receipts Southern Baptist Convention Executive Committee April 2015
 Cooperative Program Allocation Budget Receipts April 2015 Cooperative Program Allocation Budget Current Current $ Change % Change Month Month from from Contribution Sources 2014-2015 2013-2014 Prior Year
Cooperative Program Allocation Budget Receipts Southern Baptist Convention Executive Committee March 2015
 Cooperative Program Allocation Budget Receipts March 2015 Cooperative Program Allocation Budget Current Current $ Change % Change Month Month from from Contribution Sources 2014-2015 2013-2014 Prior Year
Cooperative Program Allocation Budget Receipts Southern Baptist Convention Executive Committee May 2016
 Cooperative Program Allocation Budget Receipts May 2016 Cooperative Program Allocation Budget Current Current $ Change % Change Month Month from from Contribution Sources 2015-2016 2014-2015 Prior Year
Cooperative Program Allocation Budget Receipts Southern Baptist Convention Executive Committee December 2015
 Cooperative Program Allocation Budget Receipts December 2015 Cooperative Program Allocation Budget Current Current $ Change % Change Month Month from from Contribution Sources 2015-2016 2014-2015 Prior
2015 State Hospice Report 2013 Medicare Information 1/1/15
 2015 State Hospice Report 2013 Medicare Information 1/1/15 www.hospiceanalytics.com 2 2013 Demographics & Hospice Utilization National Population 316,022,508 Total Deaths 2,529,792 Medicare Beneficiaries
Date: 5/25/2012. To: Chuck Wyatt, DCR, Virginia. From: Christos Siderelis
 1 Date: 5/25/2012 To: Chuck Wyatt, DCR, Virginia From: Christos Siderelis Chuck Wyatt with the DCR in Virginia inquired about the classification of state parks having resort type characteristics and, if
Table 8 Online and Telephone Medicaid Applications for Children, Pregnant Women, Parents, and Expansion Adults, January 2017
 Table 8 Online and Telephone Medicaid Applications for Children, Pregnant Women, Parents, and Expansion Adults, January 2017 State Applications Can be Submitted Online at the State Level 1 < 25% 25% -
HOME HEALTH AIDE TRAINING REQUIREMENTS, DECEMBER 2016
 BACKGROUND HOME HEALTH AIDE TRAINING REQUIREMENTS, DECEMBER 2016 Federal legislation (42 CFR 484.36) requires that Medicare-certified home health agencies employ home health aides who are trained and evaluated
2016 INCOME EARNED BY STATE INFORMATION
 BY STATE INFORMATION This information is being provided to assist in your 2016 tax preparations. The information is also mailed to applicable Columbia fund non-corporate shareholders with their year-end
2016 Adjusted Graduation Gap Report: NCAA FBS Football
 Websites: Twitter: Phone: Email: csri- sc.org csriconference.org @csrisouthall; @csriconference (803) 777-0658 / (803) 777-5550 csri@mailbox.sc.edu Media Contacts: Dr. Richard M. Southall, Director: College
USDA Farm to School Program FY 2013 FY 2017 Summary of Grant Awards
 USDA Farm to School Program FY 2013 FY 2017 Summary of Grant Awards ABOUT THIS REPORT This report summarizes findings from an analysis of select data from the 365 farm to school projects funded by USDA